EP4501238A1 - Electrocardiogram signal analysis system - Google Patents
Electrocardiogram signal analysis system Download PDFInfo
- Publication number
- EP4501238A1 EP4501238A1 EP23779012.6A EP23779012A EP4501238A1 EP 4501238 A1 EP4501238 A1 EP 4501238A1 EP 23779012 A EP23779012 A EP 23779012A EP 4501238 A1 EP4501238 A1 EP 4501238A1
- Authority
- EP
- European Patent Office
- Prior art keywords
- unit
- wave
- peak
- waveform data
- electrocardiographic
- Prior art date
- Legal status (The legal status is an assumption and is not a legal conclusion. Google has not performed a legal analysis and makes no representation as to the accuracy of the status listed.)
- Granted
Links
Images





Classifications
-
- G—PHYSICS
- G16—INFORMATION AND COMMUNICATION TECHNOLOGY [ICT] SPECIALLY ADAPTED FOR SPECIFIC APPLICATION FIELDS
- G16H—HEALTHCARE INFORMATICS, i.e. INFORMATION AND COMMUNICATION TECHNOLOGY [ICT] SPECIALLY ADAPTED FOR THE HANDLING OR PROCESSING OF MEDICAL OR HEALTHCARE DATA
- G16H40/00—ICT specially adapted for the management or administration of healthcare resources or facilities; ICT specially adapted for the management or operation of medical equipment or devices
- G16H40/60—ICT specially adapted for the management or administration of healthcare resources or facilities; ICT specially adapted for the management or operation of medical equipment or devices for the operation of medical equipment or devices
- G16H40/63—ICT specially adapted for the management or administration of healthcare resources or facilities; ICT specially adapted for the management or operation of medical equipment or devices for the operation of medical equipment or devices for local operation
-
- A—HUMAN NECESSITIES
- A61—MEDICAL OR VETERINARY SCIENCE; HYGIENE
- A61B—DIAGNOSIS; SURGERY; IDENTIFICATION
- A61B5/00—Measuring for diagnostic purposes; Identification of persons
- A61B5/24—Detecting, measuring or recording bioelectric or biomagnetic signals of the body or parts thereof
- A61B5/30—Input circuits therefor
- A61B5/307—Input circuits therefor specially adapted for particular uses
- A61B5/308—Input circuits therefor specially adapted for particular uses for electrocardiography [ECG]
-
- A—HUMAN NECESSITIES
- A61—MEDICAL OR VETERINARY SCIENCE; HYGIENE
- A61B—DIAGNOSIS; SURGERY; IDENTIFICATION
- A61B5/00—Measuring for diagnostic purposes; Identification of persons
- A61B5/24—Detecting, measuring or recording bioelectric or biomagnetic signals of the body or parts thereof
- A61B5/316—Modalities, i.e. specific diagnostic methods
- A61B5/318—Heart-related electrical modalities, e.g. electrocardiography [ECG]
- A61B5/346—Analysis of electrocardiograms
-
- A—HUMAN NECESSITIES
- A61—MEDICAL OR VETERINARY SCIENCE; HYGIENE
- A61B—DIAGNOSIS; SURGERY; IDENTIFICATION
- A61B5/00—Measuring for diagnostic purposes; Identification of persons
- A61B5/24—Detecting, measuring or recording bioelectric or biomagnetic signals of the body or parts thereof
- A61B5/316—Modalities, i.e. specific diagnostic methods
- A61B5/318—Heart-related electrical modalities, e.g. electrocardiography [ECG]
- A61B5/346—Analysis of electrocardiograms
- A61B5/349—Detecting specific parameters of the electrocardiograph cycle
-
- A—HUMAN NECESSITIES
- A61—MEDICAL OR VETERINARY SCIENCE; HYGIENE
- A61B—DIAGNOSIS; SURGERY; IDENTIFICATION
- A61B5/00—Measuring for diagnostic purposes; Identification of persons
- A61B5/24—Detecting, measuring or recording bioelectric or biomagnetic signals of the body or parts thereof
- A61B5/316—Modalities, i.e. specific diagnostic methods
- A61B5/318—Heart-related electrical modalities, e.g. electrocardiography [ECG]
- A61B5/346—Analysis of electrocardiograms
- A61B5/349—Detecting specific parameters of the electrocardiograph cycle
- A61B5/352—Detecting R peaks, e.g. for synchronising diagnostic apparatus; Estimating R-R interval
-
- A—HUMAN NECESSITIES
- A61—MEDICAL OR VETERINARY SCIENCE; HYGIENE
- A61B—DIAGNOSIS; SURGERY; IDENTIFICATION
- A61B5/00—Measuring for diagnostic purposes; Identification of persons
- A61B5/24—Detecting, measuring or recording bioelectric or biomagnetic signals of the body or parts thereof
- A61B5/316—Modalities, i.e. specific diagnostic methods
- A61B5/318—Heart-related electrical modalities, e.g. electrocardiography [ECG]
- A61B5/346—Analysis of electrocardiograms
- A61B5/349—Detecting specific parameters of the electrocardiograph cycle
- A61B5/366—Detecting abnormal QRS complex, e.g. widening
-
- A—HUMAN NECESSITIES
- A61—MEDICAL OR VETERINARY SCIENCE; HYGIENE
- A61B—DIAGNOSIS; SURGERY; IDENTIFICATION
- A61B5/00—Measuring for diagnostic purposes; Identification of persons
- A61B5/72—Signal processing specially adapted for physiological signals or for diagnostic purposes
- A61B5/7221—Determining signal validity, reliability or quality
-
- A—HUMAN NECESSITIES
- A61—MEDICAL OR VETERINARY SCIENCE; HYGIENE
- A61B—DIAGNOSIS; SURGERY; IDENTIFICATION
- A61B5/00—Measuring for diagnostic purposes; Identification of persons
- A61B5/72—Signal processing specially adapted for physiological signals or for diagnostic purposes
- A61B5/7225—Details of analogue processing, e.g. isolation amplifier, gain or sensitivity adjustment, filtering, baseline or drift compensation
Definitions
- the present invention relates to an electrocardiographic signal analysis system that estimates a measurement state of electrocardiographic signals based on, for example, electrocardiographic signals (hereinafter, electrocardiographic information).
- the heart functions as a pump that repeats contraction and expansion to send blood throughout the body.
- This activity is regulated by weak electrical stimulation in myocardial cells, and occurrence of abnormality in this electrical stimulation also causes abnormality in the heart activity.
- This abnormality in the activity of the heart is called arrhythmia.
- arrhythmia There are various types of arrhythmias, and examples thereof include highly fatal ventricular fibrillation that causes cardiac arrest, ventricular tachycardia, and atrial fibrillation that causes cerebral infarction. Therefore, it is essential to determine the arrhythmia, which is determined using electrocardiographic information acquired from a determination target by an electrocardiographic signal measuring instrument.
- waveform data indicated by the electrocardiographic information can be divided at intervals (hereinafter, cycles) from previous and subsequent waveforms or the height (hereinafter, the wave height) of the waveform
- cycles intervals
- the wave height the height of the waveform
- systems that automatically determine the arrhythmia by calculating the cycle or the wave height from electrocardiographic information are widely used.
- the actual cycle or wave height may not be calculated due to an influence of a measurement failure of the measuring instrument or external disturbance.
- Patent Literature 1 describes a method of detecting an abnormal period or wave height and interpolating for the portion with the abnormality. Specifically, in a case where a cycle or a wave height calculated from electrocardiographic information is out of a normal range, target data is determined as abnormal, and interpolation is performed based on previous and subsequent normal cycles or wave heights.
- Patent Literature 1 WO 2017/135116 A
- a loss may occur at a waveform peak.
- a peak loss refers to the occurrence of a recess or the like in a peak of an R wave or an S wave of the obtained waveform due to a measurement failure of the measuring instrument or external disturbance.
- the cycle or the wave height calculated from an electrocardiographic waveform in which a peak loss is occurring is different from an actual cycle or wave height; however, the gap is small.
- the peak loss is not considered, and it is difficult to determine a peak loss as an abnormality. Therefore, it is not possible to calculate the actual cycle and wave height of an electrocardiographic waveform in which a peak loss occurs only by applying Patent Literature 1, and thus erroneous determination of arrhythmia may be caused.
- An object of the present invention is to provide an electrocardiographic signal analysis system capable of optimizing the waveform in a case where a peak loss occurs in an electrocardiographic waveform by solving the above problems of the prior art.
- An electrocardiographic signal analysis system of the present invention that achieves the above object has the following configuration.
- the waveform can be optimized in a case where a peak loss occurs in an electrocardiographic waveform.
- FIG. 1 is a diagram illustrating a configuration example of an electrocardiographic signal analysis system according to a first embodiment of the present invention.
- electrocardiographic information 10 to be analyzed is acquired from a subject 1 via an electrocardiographic signal measuring instrument 2.
- the electrocardiographic information herein indicates a minute amount of current generated with contraction and expansion of the heart.
- the subject 1 is not particularly limited such as a human or an animal.
- Examples of the electrocardiographic signal measuring instrument 2 include a wearable electrocardiograph.
- the electrocardiographic signal measuring instrument 2 includes a plurality of electrodes provided to the main body of an outfit worn by the subject 1 and an electrocardiograph 100 electrically connected to each of the electrodes.
- the electrocardiograph 100 is an example of an electrocardiographic signal measuring instrument that measures an electrocardiographic signal of a subject.
- the electrocardiograph 100 has a function of continuously measuring an electrocardiographic signal (the electrocardiographic information 10) of a subject, a function of storing the obtained electrocardiographic information 10, and a function of transferring data by communication with an electrocardiographic signal analysis system 3.
- the electrocardiograph 100 may transfer data including the electrocardiographic information 10 to a server device, and the server device may transfer the electrocardiographic information 10 to the electrocardiographic signal analysis system 3.
- description will be given on the premise that the subject 1 refers to a person wearing the electrocardiographic signal measuring instrument 2.
- the electrocardiographic information 10 acquired from the subject 1 includes information of the subject 1, acquisition date and time, a location, and a measurement result.
- the measurement result is waveform data 11 obtained by plotting on the horizontal axis as time and the vertical axis as voltage (see FIG. 1 ).
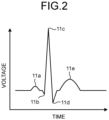
- FIG. 2 is a diagram illustrating a detailed example of the electrocardiographic information 10 used for analysis.
- the waveform data 11 may include components referred to as a P wave 11a, a Q wave 11b, an R wave 11c, an S wave 11d, and a T wave 11e, and these shapes are used as determination criteria for arrhythmia. Note that the shape of the waveform data 11 included in the electrocardiographic information 10 may change depending on the subject or the position of the electrocardiograph 100 on the subject.
- the electrocardiographic signal analysis system 3 includes an input unit 31, a filter processing unit 32, a unit waveform data extracting unit 33, a loss detection unit 34, a data interpolation unit 35, an output unit 36, a control unit 37, and a storage unit 38.
- the input unit 31 receives input of the electrocardiographic information 10 output from the electrocardiographic signal measuring instrument 2.
- the input unit 31 includes a connector electrically connected to the electrocardiographic signal measuring instrument 2, a communication device including a communication means with the electrocardiographic signal measuring instrument 2, or an input port of a medium storing data and may further include a user interface such as a keyboard, a mouse, or a microphone.
- the filter processing unit 32 performs filter processing on the waveform data 11 of the electrocardiographic information 10.
- the unit waveform data extracting unit 33 extracts unit waveform data 13 from electrocardiographic information (waveform data) 12 having been subjected to filter processing.
- the loss detection unit 34 detects a loss of a peak of an R wave or an S wave in the waveform indicated by the unit waveform data 13.
- the data interpolation unit 35 interpolates a peak loss portion detected by the loss detection unit 34.
- the output unit 36 includes an output device such as a display device or a printing device and outputs various types of information under the control by the control unit 37.
- the output unit 36 has, for example, a sound output function of a display including liquid crystal, organic electro luminescence (EL), or the like, a speaker, or the like.
- the control unit 37 integrally controls the operation of the electrocardiographic signal analysis system 3.
- the control unit 37 causes the display to display the electrocardiographic information 10, information of normality and arrhythmia determined based on the electrocardiographic information 10, the interpolation result by the data interpolation unit 35, and the like or outputs the information to the outside.
- the storage unit 38 stores various programs for operating the electrocardiographic signal analysis system 3 or various types of data including data generated by the units.
- the various programs also include a determination program executed using a learning model.
- the storage unit 38 includes a read only memory (ROM) in which various programs and the like are installed in advance, a random access memory (RAM) that stores calculation parameters, data, and the like of each processing, a hard disk drive (HDD), a solid state drive (SSD), and the like.
- the various programs can be recorded on a computer-readable recording medium such as an HDD, a flash memory, a CD-ROM, a DVD-ROM, or Blu-ray (registered trademark) and widely distributed. Furthermore, the input unit 31 can acquire the various programs via a communication network.
- the communication network mentioned here is configured using, for example, an existing public line network, a local area network (LAN), a wide area network (WAN), or the like and may be either wired or wireless.
- the electrocardiographic signal analysis system 3 having the above functional configuration is a computer configured using one or a plurality of pieces of hardware such as a central processing unit (CPU), a graphics processing unit (GPU), an application specific integrated circuit (ASIC), and a field programmable gate array (FPGA).
- CPU central processing unit
- GPU graphics processing unit
- ASIC application specific integrated circuit
- FPGA field programmable gate array
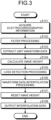
- FIG. 3 is a flowchart illustrating the noise determination processing according to the first embodiment.
- the input unit 31 acquires the electrocardiographic information 10 obtained from the subject 1 via the electrocardiographic signal measuring instrument 2 (step S101).
- the filter processing unit 32 performs filter processing on the waveform data 11 acquired in step S101 (step S102). For example, the filter processing unit 32 reduces the difference between the normal sinus rhythm and arrhythmia by allowing only the features of the electrocardiographic signal to pass from the waveform data 11 indicating the relationship between time and intensity (here, voltage), thereby making a difference from the noise obvious. Specifically, the filter processing unit 32 applies a frequency filter to the electrocardiographic information 10 input by the input unit 31 to generate the filtered electrocardiographic information (waveform data) 12 in which only characteristic frequencies of the normal sinus rhythm and the arrhythmia are allowed to pass.
- the filter processing unit 32 applies a filter that leaves frequency components of both or one of an R wave and an S wave to output the filtered electrocardiographic information (waveform data) 12.
- a filter that leaves frequency components of both or one of an R wave and an S wave to output the filtered electrocardiographic information (waveform data) 12.
- a specific pass band of the frequency filter 5 to 50 Hz or the like is set; however, it is not limited thereto.
- the frequency filter is designed using a general infinite impulse response (IIR) filter or a finite impulse response (FIR) filter.
- FIGS. 4A to 4C are diagrams for describing a processing example of the filter processing unit according to the first embodiment. Executing filter processing on waveform data 11A to 11C illustrated in (a) of FIGS. 4A to 4C results in generation of filtered electrocardiographic information (waveform data) 12A to 12C (see (b) of FIGS. 4A to 4C ). The generated filtered electrocardiographic information (waveform data) 12 is registered in the storage unit 38.
- the unit waveform data extracting unit 33 After the filter processing, the unit waveform data extracting unit 33 generates the unit waveform data 13 obtained by partial extraction from the waveform data 12 (step S103).
- FIG. 5 is a diagram illustrating a processing example of the unit waveform data extracting unit.
- the unit waveform data extracting unit 33 generates the unit waveform data 13 in which each designated unit is extracted from the waveform data 12 illustrated in (a) of FIG. 5 (see (b) of FIG. 5 ) and stores the unit waveform data 13 in the storage unit 38.
- extraction of the unit waveform data 13 is performed using, for example, a designated period based on time axis information as a unit or using an R wave 12a as an extraction reference position, and then define a designated number of waveforms as a unit; however, it is not limited thereto.
- a peak position 12ap of the R wave 12a is detected, and a designated number of seconds before and after the peak position 12ap of the R wave 12a is set as one unit, whereby the unit waveform data 13 represents a single waveform based on the waveform data 12.
- intervals between the pieces of the unit waveform data 13 are not constant due to heart rate fluctuation.
- an effect of improving the accuracy of loss detection by the loss detection unit 34 or interpolation by the data interpolation unit 35 and an effect of improving the accuracy of arrhythmia determination can be expected.
- a section having no useful information for determination such as out-of-unit waveform data 12b in (b) of FIG. 5 , is excluded, the processing amount can be suppressed.
- the designated number of seconds before and after (for example, 0.4 seconds) the peak position 12ap of the R wave 12a detected from the maximum value in a certain section is set as one unit waveform; however, it is not limited thereto.
- the input unit 31 obtains the maximum value of the waveform data 12, uses the maximum value as the reference point, and defines a designated number of seconds before and after this maximum value as one unit.
- the unit waveform data extracting unit 33 calculates the wave height for the unit waveform data 13 (step S104).
- the wave height indicates the height of a waveform
- the cycle indicates the interval between pieces of unit waveform data.
- FIG. 6 is a diagram illustrating a processing example of the unit waveform data extracting unit.
- the unit waveform data extracting unit 33 calculates a distance H 1 between a peak position 12ap of the R wave 12a of the unit waveform data 13 and a peak position 12cp of the S wave 12c regarding the wave height.
- the unit waveform data extracting unit 33 calculates a distance C 1 between peak positions 12ap of R waves 12a of the unit waveform data 13 temporally adjacent to each other.
- the loss detection unit 34 detects a waveform loss in the unit waveform data 13 (step S105).
- the peak loss referred to herein means that a loss occurs at a peak of an R wave or an S wave of an obtained waveform due to a measurement failure of the electrocardiographic signal measuring instrument 2 or an influence of external disturbance.
- FIG. 7 is a diagram for describing an overview of processing by the loss detection unit.
- the loss detection unit 34 detects a loss portion R L of the waveform (R wave in FIG. 7 ) of the unit waveform data 13.
- a peak loss for example, an extreme value immediately before or after an R wave or S wave is used, and the extreme value is compared with a preset reference to detect a peak loss.
- a peak loss is detected by determining whether or not the potential of the minimum point immediately before or after an R wave peak exceeds the reference, or a peak loss is detected by determining whether or not the potential of the maximum point immediately before or after an R wave peak exceeds the reference.
- a peak loss is detected by determining whether or not the potential of the maximum point immediately before or after an S wave peak is below the reference, or a peak loss is detected by determining whether or not the potential of the minimum point immediately before or after an S wave peak is below the reference. In this manner, a spike-like peak loss can be detected.
- a baseline (zero point) of the electrocardiographic information 10 is used or that a value of 50% of the potential from the baseline to an R wave peak is used; however, an actual method is not specified, and it is merely preferable to appropriately adjust the reference by referring to the value obtained by the above method, for example.
- a point of inflection immediately before or after an R wave or S wave peak is used, and the potential at the point of inflection is compared with a preset reference to detect a peak loss.
- a peak loss is detected by determining whether or not the potential of the point of inflection immediately before or after an R wave peak exceeds the reference, or a peak loss is detected by determining whether or not the potential of the point of inflection immediately before or after an S wave peak is less than the reference. In this manner, a peak loss portion due to distortion can be detected.
- each extreme value or the point of inflection is set based on, for example, extreme values and points of inflection of each of waveforms in which no peak loss is occurring and waveforms in which a peak loss is occurring.
- the data interpolation unit 35 interpolates data for the detected peak loss portion (step S106).
- a known method for interpolating the peak loss portion a known method such as general spline interpolation can be adopted. Note that the data interpolation unit 35 also interpolates original waveform data (for example, the waveform data 11 or 12).
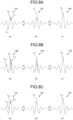
- FIGS. 8A to 8C are diagrams for describing processing examples of the loss detection unit and the data interpolation unit according to the first embodiment.
- a waveform assumed in a case where there is no defect is indicated by a broken line.
- the loss portion is detected from the unit waveform data 13 by the peak loss detection described above.
- the loss detection unit 34 detects, for example, a minimum point T 11 immediately before a peak of an R wave or a minimum point T 12 immediately after the peak of the R wave for unit waveform data 13A and determines whether or not the potential of the minimum point exceeds a reference to detect a peak loss (see (a) of FIG. 8A ). Then, the data interpolation unit 35 interpolates an interpolation waveform L 3 for the peak loss portion (see (b) of FIG. 8A ) and generates interpolation data 14A (see (c) of FIG. 8A ). As a result, the peak position of the R wave changes from a peak position T 21 to a peak position T 31 .
- the loss detection unit 34 detects, for example, a maximum point T 13 immediately before a peak of an R wave or a maximum point T 14 immediately after the peak of the R wave for unit waveform data 13B and determines whether or not the potential of the maximum point exceeds a reference to detect a peak loss (see (a) of FIG. 8B ). Then, the data interpolation unit 35 interpolates an interpolation waveform L 4 for the peak loss portion (see (b) of FIG. 8B ) and generates interpolation data 14B (see (c) of FIG. 8B ). As a result, the peak position of the R wave changes from a peak position T 22 to a peak position T 32 .
- the loss detection unit 34 detects, for example, a point of inflection T 15 immediately before a peak of an R wave or a point of inflection T 16 immediately after the peak of the R wave for unit waveform data 13C and determines whether or not the potential of the point of inflection exceeds a reference to detect a peak loss (see (a) of FIG. 8C ). Then, the data interpolation unit 35 interpolates an interpolation waveform L 5 for the peak loss portion (see (b) of FIG. 8C ) and generates interpolation data 14C (see (c) of FIG. 8C ). As a result, the peak position of the R wave changes from a peak position T 23 to a peak position T 33 .
- the data interpolation unit 35 resets the wave height for interpolation data 14 (step S107).
- the data interpolation unit 35 resets the wave height of the interpolation data 14 (for example, the interpolation data 14A to 14C illustrated in FIGS. 8A to 8C ) based on the peak of the R wave of the waveform.
- the wave height calculated based on the peak of the R wave of the waveform before interpolation is changed.
- the wave height by the resetting processing is used for convenience of determining normality or arrhythmia and is used as the actual wave height of the electrocardiographic waveform in which the peak loss has occurred. Incidentally, the same applies to a case of using the cycle.
- the control unit 37 outputs the interpolation data 14 (step S108).
- the output destination is, for example, the storage unit 38 or the output unit 36.
- the peak loss of the waveform is detected based on the unit waveform data 13, and the detected peak loss is interpolated to reset the wave height of the unit waveform data 13.
- the determination of the arrhythmia is applied using the reset cycle or wave height, it is possible to suppress erroneous determination due to the influence of a peak loss, and as a result, it is possible to determine normality or arrhythmia from the electrocardiographic information 10 with high accuracy.
- the data interpolation unit 35 generates interpolated waveform data (the interpolation data 14)
- the interpolation data 14 in order to determine normality or arrhythmia from the electrocardiographic information 10, it is not always necessary to generate the interpolation data 14, and it is sufficient to use a reset wave height. Therefore, the interpolation data 14 may not be generated.
- the wave height it is sufficient for the wave height that information necessary for determining normality or arrhythmia be generated from the electrocardiographic information 10, and at least one of pieces of information necessary for the determination may be calculated or reset.
- the wave height may be set in step S107 without executing the calculation processing in step S104.
- the unit waveform data extracting unit 33 (or the data interpolation unit 35) calculates the wave height based on the unit waveform data 13.
- the data interpolation unit 35 calculates the wave height based on the unit waveform data 13 obtained by the interpolation.
- FIG. 9 is a diagram illustrating a configuration example of an electrocardiographic signal analysis system according to a second embodiment.
- the second embodiment includes an electrocardiographic signal analysis system 3A instead of the electrocardiographic signal analysis system 3 according to the first embodiment.
- the electrocardiographic signal analysis system 3A the same components as those of the electrocardiographic signal analysis system 3 are denoted by the same reference numerals, and description thereof will be omitted.
- points different from those of the first embodiment will be described.
- the electrocardiographic signal analysis system 3A includes an input unit 31, a filter processing unit 32, a unit waveform data extracting unit 33, a loss detection unit 34, a data interpolation unit 35, an output unit 36, a control unit 37, a storage unit 38, and a wave height ratio generating unit 39.
- the wave height ratio generating unit 39 aggregates wave heights associated with respective pieces of unit waveform data 13 included in electrocardiographic information 10 and generates, when any one of the average value, the maximum value, and the minimum value of the wave heights is used as a reference, a wave height ratio that is a relative amount concerning the reference.
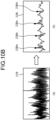
- FIGS. 10A and 10B are diagrams illustrating a processing example of the wave height ratio generating unit.
- the input unit 31 acquires the electrocardiographic information 10 obtained from a subject 1 via an electrocardiographic signal measuring instrument 2.
- Waveform data 21A and 21B acquired at this point is waveform data included in the electrocardiographic information 10 and obtained by plotting with the horizontal axis as time and the vertical axis as the voltage (see (a) of FIG. 10A and (a) of FIG. 10B ).
- the amount of noise to be superimposed is different between the waveform data 21A and the waveform data 21B, and more noise is superimposed on the waveform data 21B than on the waveform data 21A.
- filter processing is executed by the filter processing unit 32 to generate filtered electrocardiographic information (waveform data) 22A and 22B (see (b) of FIG. 10A and (b) of FIG. 10B) .
- the filter processing to be executed is different between the waveform data 22A and the waveform data 22B, and since the amount of noise superimposed is large in the waveform data 21B, filter processing for smoothing is executed more on the waveform data 22B than on the waveform data 22A.
- Unit waveform data 23Aa to 23Ad and 23Ba to 23Bd included in the waveform data 22A and 22B are each associated with a wave height.
- the wave height is a wave height calculated by the unit waveform data extracting unit 33 or a wave height reset by the data interpolation unit 35.
- the associated wave heights are used as a criterion for the determination of arrhythmia; however, it can be seen that the wave height is smaller in the waveform data 22B on which the filter processing for further smoothing has been executed than in the waveform data 22A. Therefore, in consideration of the determination of arrhythmia, which is the final application, if the wave height is output as it is as in the first embodiment, the filter design has to be limited in order to suppress the influence of the filter design.
- the wave height ratio generating unit 39 aggregates the wave heights associated with the unit waveform data 13 included in the waveform data 12 and generates the wave height ratio that is a relative amount.
- the average value is used as the reference (100%); however, the maximum value or the minimum value may be used as the reference.
- the wave heights associated with the unit waveform data 23Aa to 23Ad and 23Ba to 23Bd can be treated as a wave height ratio in percentage rather than a voltage value in volts, and it is possible to determine the arrhythmia (detect an abnormal wave height) as usual after canceling the influence of the filter design.
- the extraction of the unit waveform data 13 by the unit waveform data extracting unit 33, the loss detection by the loss detection unit 34, and others, which are subsequent processing, can be performed with higher accuracy.
- the electrocardiographic signal analysis systems 3 and 3A are provided separately from the electrocardiographic signal measuring instrument 2; however, the electrocardiographic signal analysis systems 3 and 3A may be configured integrally with the electrocardiographic signal measuring instrument 2.
- the electrocardiograph 100 may include the input unit 31, the filter processing unit 32, the unit waveform data extracting unit 33, the loss detection unit 34, the data interpolation unit 35, the output unit 36, and the control unit 37.
- electrocardiographic signal analysis system makes it possible to optimize the waveform when a peak loss occurs in an electrocardiographic waveform.
Landscapes
- Health & Medical Sciences (AREA)
- Life Sciences & Earth Sciences (AREA)
- Cardiology (AREA)
- Engineering & Computer Science (AREA)
- Biomedical Technology (AREA)
- Public Health (AREA)
- General Health & Medical Sciences (AREA)
- Medical Informatics (AREA)
- Molecular Biology (AREA)
- Biophysics (AREA)
- Pathology (AREA)
- Physics & Mathematics (AREA)
- Heart & Thoracic Surgery (AREA)
- Veterinary Medicine (AREA)
- Surgery (AREA)
- Animal Behavior & Ethology (AREA)
- Signal Processing (AREA)
- Physiology (AREA)
- Computer Vision & Pattern Recognition (AREA)
- Psychiatry (AREA)
- Artificial Intelligence (AREA)
- Power Engineering (AREA)
- Business, Economics & Management (AREA)
- General Business, Economics & Management (AREA)
- Epidemiology (AREA)
- Primary Health Care (AREA)
- Measurement And Recording Of Electrical Phenomena And Electrical Characteristics Of The Living Body (AREA)
- Measurement Of Current Or Voltage (AREA)
Abstract
Description
- The present invention relates to an electrocardiographic signal analysis system that estimates a measurement state of electrocardiographic signals based on, for example, electrocardiographic signals (hereinafter, electrocardiographic information).
- The heart functions as a pump that repeats contraction and expansion to send blood throughout the body. This activity is regulated by weak electrical stimulation in myocardial cells, and occurrence of abnormality in this electrical stimulation also causes abnormality in the heart activity. This abnormality in the activity of the heart is called arrhythmia. There are various types of arrhythmias, and examples thereof include highly fatal ventricular fibrillation that causes cardiac arrest, ventricular tachycardia, and atrial fibrillation that causes cerebral infarction. Therefore, it is essential to determine the arrhythmia, which is determined using electrocardiographic information acquired from a determination target by an electrocardiographic signal measuring instrument.
- Since waveform data indicated by the electrocardiographic information can be divided at intervals (hereinafter, cycles) from previous and subsequent waveforms or the height (hereinafter, the wave height) of the waveform, systems that automatically determine the arrhythmia by calculating the cycle or the wave height from electrocardiographic information are widely used. However, in electrocardiographic information acquired by an electrocardiographic signal measuring instrument, the actual cycle or wave height may not be calculated due to an influence of a measurement failure of the measuring instrument or external disturbance.
- For this problem, for example, Patent Literature 1 describes a method of detecting an abnormal period or wave height and interpolating for the portion with the abnormality. Specifically, in Patent Literature 1, in a case where a cycle or a wave height calculated from electrocardiographic information is out of a normal range, target data is determined as abnormal, and interpolation is performed based on previous and subsequent normal cycles or wave heights.
- Patent Literature 1:
WO 2017/135116 A - Meanwhile, in measured electrocardiographic information, a loss may occur at a waveform peak. A peak loss refers to the occurrence of a recess or the like in a peak of an R wave or an S wave of the obtained waveform due to a measurement failure of the measuring instrument or external disturbance. The cycle or the wave height calculated from an electrocardiographic waveform in which a peak loss is occurring is different from an actual cycle or wave height; however, the gap is small. In the method of Patent Literature 1 or the like, the peak loss is not considered, and it is difficult to determine a peak loss as an abnormality. Therefore, it is not possible to calculate the actual cycle and wave height of an electrocardiographic waveform in which a peak loss occurs only by applying Patent Literature 1, and thus erroneous determination of arrhythmia may be caused.
- An object of the present invention is to provide an electrocardiographic signal analysis system capable of optimizing the waveform in a case where a peak loss occurs in an electrocardiographic waveform by solving the above problems of the prior art.
- An electrocardiographic signal analysis system of the present invention that achieves the above object has the following configuration.
- (1) An electrocardiographic signal analysis system that acquires electrocardiographic information and performs processing, the electrocardiographic signal analysis system including: an input unit configured to receive input of the electrocardiographic information; a unit waveform data extracting unit configured to perform segmentation and extract unit waveform data based on a peak of an R wave or an S wave from waveform data included in the electrocardiographic information; a loss detection unit configured to detect a loss portion of a peak of an R wave or an S wave in the unit waveform data using an extreme value immediately before or immediately after the peak or using a point of inflection immediately before or immediately after the peak; and a data interpolation unit configured to set a wave height or a cycle of a waveform after interpolation based on a peak position of an R wave or an S wave of a waveform obtained by interpolating the loss portion.
- (2) The electrocardiographic signal analysis system according to (1), wherein concerning the unit waveform data, the loss detection unit is configured to determine whether or not a minimum point immediately before or immediately after the peak of the R wave exceeds a reference or whether or not a maximum point immediately before or immediately after the peak of the S wave is below a reference to detect the peak loss.
- (3) The electrocardiographic signal analysis system according to (1), wherein concerning the unit waveform data, the loss detection unit is configured to determine whether or not a maximum point immediately before or immediately after the peak of the R wave exceeds a reference or whether or not a minimum point immediately before or immediately after the peak of the S wave is below a reference to detect the peak loss.
- (4) The electrocardiographic signal analysis system according to (1), wherein concerning the unit waveform data, the loss detection unit is configured to determine whether or not the point of inflection immediately before or immediately after the peak of the R wave exceeds a reference or whether or not the point of inflection immediately before or immediately after the peak of the S wave is below a reference to detect the peak loss.
- (5) The electrocardiographic signal analysis system according to any one of (1) to (4), further including: a filter processing unit that applies a filter to the electrocardiographic information acquired by the input unit to pass the characteristic frequency and outputs filtered electrocardiographic information, wherein the unit waveform data extracting unit is configured to extract the unit waveform data based on the filtered electrocardiographic information.
- (6) The electrocardiographic signal analysis system according to any one of (1) to (4), further including: a filter processing unit that applies a filter to the electrocardiographic information acquired by the input unit to retain the frequency components of both or either the R wave and the S wave, and outputs filtered electrocardiographic information, wherein the unit waveform data extracting unit is configured to extract the unit waveform data based on the filtered electrocardiographic information, and when any one of an average value, a maximum value, or a minimum value of wave heights in the unit waveform data is used as a reference, the wave height set by the data interpolation unit is a relative amount concerning the reference.
- (7) The electrocardiographic signal analysis system according to any one of (1) to (4), wherein the data interpolation unit is configured to generate interpolation data in which the peak loss portion is interpolated. Advantageous Effects of Invention
- According to the present invention, the waveform can be optimized in a case where a peak loss occurs in an electrocardiographic waveform.
-
-
FIG. 1 is a diagram illustrating a configuration example of an electrocardiographic signal analysis system according to a first embodiment. -
FIG. 2 is a diagram illustrating a detailed example of electrocardiographic information used for analysis. -
FIG. 3 is a flowchart illustrating noise determination processing according to the first embodiment. -
FIG. 4A is a diagram (part 1) for describing a processing example of a filter processing unit. -
FIG. 4B is a diagram (part 2) for explaining a processing example of the filter processing unit. -
FIG. 4C is a diagram (part 3) for describing a processing example of the filter processing unit. -
FIG. 5 is a diagram (part 1) illustrating a processing example of a unit waveform data extracting unit. -
FIG. 6 is a diagram (part 2) illustrating a processing example of the unit waveform data extracting unit. -
FIG. 7 is a diagram for describing an overview of processing of a loss detection unit. -
FIG. 8A is a diagram (part 1) illustrating exemplary processing of the loss detection unit and a data interpolation unit. -
FIG. 8B is a diagram (part 2) illustrating exemplary processing of the loss detection unit and the data interpolation unit. -
FIG. 8C is a diagram (part 3) illustrating exemplary processing of the loss detection unit and the data interpolation unit. -
FIG. 9 is a diagram illustrating a configuration example of an electrocardiographic signal analysis system according to a second embodiment. -
FIG. 10A is a diagram (part 1) illustrating a processing example of a wave height ratio generating unit. -
FIG. 10B is a diagram (part 2) illustrating a processing example of the wave height ratio generating unit. - Hereinafter, embodiments of an electrocardiographic signal analysis system according to the present invention will be described in detail with reference to the drawings. Note that the present invention is not limited by the embodiments. Moreover, individual embodiments of the present invention are not independent and can be combined for implementation as appropriate.
-
FIG. 1 is a diagram illustrating a configuration example of an electrocardiographic signal analysis system according to a first embodiment of the present invention. According toFIG. 1 ,electrocardiographic information 10 to be analyzed is acquired from a subject 1 via an electrocardiographicsignal measuring instrument 2. The electrocardiographic information herein indicates a minute amount of current generated with contraction and expansion of the heart. The subject 1 is not particularly limited such as a human or an animal. - Examples of the electrocardiographic
signal measuring instrument 2 include a wearable electrocardiograph. Specifically, the electrocardiographicsignal measuring instrument 2 includes a plurality of electrodes provided to the main body of an outfit worn by the subject 1 and anelectrocardiograph 100 electrically connected to each of the electrodes. - The
electrocardiograph 100 is an example of an electrocardiographic signal measuring instrument that measures an electrocardiographic signal of a subject. Theelectrocardiograph 100 has a function of continuously measuring an electrocardiographic signal (the electrocardiographic information 10) of a subject, a function of storing the obtainedelectrocardiographic information 10, and a function of transferring data by communication with an electrocardiographicsignal analysis system 3. Note that theelectrocardiograph 100 may transfer data including theelectrocardiographic information 10 to a server device, and the server device may transfer theelectrocardiographic information 10 to the electrocardiographicsignal analysis system 3. Hereinafter, description will be given on the premise that the subject 1 refers to a person wearing the electrocardiographicsignal measuring instrument 2. - The
electrocardiographic information 10 acquired from the subject 1 includes information of the subject 1, acquisition date and time, a location, and a measurement result. The measurement result iswaveform data 11 obtained by plotting on the horizontal axis as time and the vertical axis as voltage (seeFIG. 1 ). -
FIG. 2 is a diagram illustrating a detailed example of theelectrocardiographic information 10 used for analysis. Thewaveform data 11 may include components referred to as aP wave 11a, aQ wave 11b, anR wave 11c, anS wave 11d, and aT wave 11e, and these shapes are used as determination criteria for arrhythmia. Note that the shape of thewaveform data 11 included in theelectrocardiographic information 10 may change depending on the subject or the position of theelectrocardiograph 100 on the subject. - Returning to
FIG. 1 , the electrocardiographicsignal analysis system 3 according to the present invention includes aninput unit 31, afilter processing unit 32, a unit waveformdata extracting unit 33, aloss detection unit 34, adata interpolation unit 35, anoutput unit 36, acontrol unit 37, and astorage unit 38. - The
input unit 31 receives input of theelectrocardiographic information 10 output from the electrocardiographicsignal measuring instrument 2. Theinput unit 31 includes a connector electrically connected to the electrocardiographicsignal measuring instrument 2, a communication device including a communication means with the electrocardiographicsignal measuring instrument 2, or an input port of a medium storing data and may further include a user interface such as a keyboard, a mouse, or a microphone. - The
filter processing unit 32 performs filter processing on thewaveform data 11 of theelectrocardiographic information 10. - The unit waveform
data extracting unit 33 extractsunit waveform data 13 from electrocardiographic information (waveform data) 12 having been subjected to filter processing. - The
loss detection unit 34 detects a loss of a peak of an R wave or an S wave in the waveform indicated by theunit waveform data 13. - The
data interpolation unit 35 interpolates a peak loss portion detected by theloss detection unit 34. - The
output unit 36 includes an output device such as a display device or a printing device and outputs various types of information under the control by thecontrol unit 37. Theoutput unit 36 has, for example, a sound output function of a display including liquid crystal, organic electro luminescence (EL), or the like, a speaker, or the like. - The
control unit 37 integrally controls the operation of the electrocardiographicsignal analysis system 3. In addition, thecontrol unit 37 causes the display to display theelectrocardiographic information 10, information of normality and arrhythmia determined based on theelectrocardiographic information 10, the interpolation result by thedata interpolation unit 35, and the like or outputs the information to the outside. - The
storage unit 38 stores various programs for operating the electrocardiographicsignal analysis system 3 or various types of data including data generated by the units. The various programs also include a determination program executed using a learning model. Thestorage unit 38 includes a read only memory (ROM) in which various programs and the like are installed in advance, a random access memory (RAM) that stores calculation parameters, data, and the like of each processing, a hard disk drive (HDD), a solid state drive (SSD), and the like. - The various programs can be recorded on a computer-readable recording medium such as an HDD, a flash memory, a CD-ROM, a DVD-ROM, or Blu-ray (registered trademark) and widely distributed. Furthermore, the
input unit 31 can acquire the various programs via a communication network. The communication network mentioned here is configured using, for example, an existing public line network, a local area network (LAN), a wide area network (WAN), or the like and may be either wired or wireless. - The electrocardiographic
signal analysis system 3 having the above functional configuration is a computer configured using one or a plurality of pieces of hardware such as a central processing unit (CPU), a graphics processing unit (GPU), an application specific integrated circuit (ASIC), and a field programmable gate array (FPGA). - Next, noise determination processing based on the
electrocardiographic information 10 obtained from the subject 1 will be described.FIG. 3 is a flowchart illustrating the noise determination processing according to the first embodiment. In the noise determination processing, first, theinput unit 31 acquires theelectrocardiographic information 10 obtained from the subject 1 via the electrocardiographic signal measuring instrument 2 (step S101). - The
filter processing unit 32 performs filter processing on thewaveform data 11 acquired in step S101 (step S102). For example, thefilter processing unit 32 reduces the difference between the normal sinus rhythm and arrhythmia by allowing only the features of the electrocardiographic signal to pass from thewaveform data 11 indicating the relationship between time and intensity (here, voltage), thereby making a difference from the noise obvious. Specifically, thefilter processing unit 32 applies a frequency filter to theelectrocardiographic information 10 input by theinput unit 31 to generate the filtered electrocardiographic information (waveform data) 12 in which only characteristic frequencies of the normal sinus rhythm and the arrhythmia are allowed to pass. For example, thefilter processing unit 32 applies a filter that leaves frequency components of both or one of an R wave and an S wave to output the filtered electrocardiographic information (waveform data) 12. As a specific pass band of the frequency filter, 5 to 50 Hz or the like is set; however, it is not limited thereto. The frequency filter is designed using a general infinite impulse response (IIR) filter or a finite impulse response (FIR) filter. -
FIGS. 4A to 4C are diagrams for describing a processing example of the filter processing unit according to the first embodiment. Executing filter processing onwaveform data 11A to 11C illustrated in(a) of FIGS. 4A to 4C results in generation of filtered electrocardiographic information (waveform data) 12A to 12C (see(b) of FIGS. 4A to 4C ). The generated filtered electrocardiographic information (waveform data) 12 is registered in thestorage unit 38. - After the filter processing, the unit waveform
data extracting unit 33 generates theunit waveform data 13 obtained by partial extraction from the waveform data 12 (step S103).FIG. 5 is a diagram illustrating a processing example of the unit waveform data extracting unit. The unit waveformdata extracting unit 33 generates theunit waveform data 13 in which each designated unit is extracted from thewaveform data 12 illustrated in (a) ofFIG. 5 (see (b) ofFIG. 5 ) and stores theunit waveform data 13 in thestorage unit 38. It is conceivable that extraction of theunit waveform data 13 is performed using, for example, a designated period based on time axis information as a unit or using anR wave 12a as an extraction reference position, and then define a designated number of waveforms as a unit; however, it is not limited thereto. In the example illustrated inFIG. 5 , a peak position 12ap of theR wave 12a is detected, and a designated number of seconds before and after the peak position 12ap of theR wave 12a is set as one unit, whereby theunit waveform data 13 represents a single waveform based on thewaveform data 12. - Incidentally, in the waveform data 12 (or the waveform data 11), intervals between the pieces of the
unit waveform data 13 are not constant due to heart rate fluctuation. However, with segmentation into each unit waveform, an effect of improving the accuracy of loss detection by theloss detection unit 34 or interpolation by thedata interpolation unit 35 and an effect of improving the accuracy of arrhythmia determination can be expected. In addition, since a section having no useful information for determination, such as out-of-unit waveform data 12b in (b) ofFIG. 5 , is excluded, the processing amount can be suppressed. - In addition, in the example illustrated in
FIG. 5 , in order to perform segmentation into unit waveforms, the designated number of seconds before and after (for example, 0.4 seconds) the peak position 12ap of theR wave 12a detected from the maximum value in a certain section is set as one unit waveform; however, it is not limited thereto. In a case where the waveform data does not have theR wave 11c and the peak position 12ap of theR wave 12a cannot be detected, theinput unit 31 obtains the maximum value of thewaveform data 12, uses the maximum value as the reference point, and defines a designated number of seconds before and after this maximum value as one unit. - Then, the unit waveform
data extracting unit 33 calculates the wave height for the unit waveform data 13 (step S104). Hereinafter, an example of calculating only the wave height will be described; however, only the cycle may be calculated, or the wave height and the cycle may be calculated. The wave height indicates the height of a waveform, and the cycle indicates the interval between pieces of unit waveform data. -
FIG. 6 is a diagram illustrating a processing example of the unit waveform data extracting unit. The unit waveformdata extracting unit 33 calculates a distance H1 between a peak position 12ap of theR wave 12a of theunit waveform data 13 and a peak position 12cp of theS wave 12c regarding the wave height. When calculating the cycle, the unit waveformdata extracting unit 33 calculates a distance C1 between peak positions 12ap of R waves 12a of theunit waveform data 13 temporally adjacent to each other. - The
loss detection unit 34 detects a waveform loss in the unit waveform data 13 (step S105). The peak loss referred to herein means that a loss occurs at a peak of an R wave or an S wave of an obtained waveform due to a measurement failure of the electrocardiographicsignal measuring instrument 2 or an influence of external disturbance. -
FIG. 7 is a diagram for describing an overview of processing by the loss detection unit. Theloss detection unit 34 detects a loss portion RL of the waveform (R wave inFIG. 7 ) of theunit waveform data 13. - Specifically, as a method for detecting a peak loss, for example, an extreme value immediately before or after an R wave or S wave is used, and the extreme value is compared with a preset reference to detect a peak loss. Specifically, for example, a peak loss is detected by determining whether or not the potential of the minimum point immediately before or after an R wave peak exceeds the reference, or a peak loss is detected by determining whether or not the potential of the maximum point immediately before or after an R wave peak exceeds the reference. Similarly, for an S wave as well, a peak loss is detected by determining whether or not the potential of the maximum point immediately before or after an S wave peak is below the reference, or a peak loss is detected by determining whether or not the potential of the minimum point immediately before or after an S wave peak is below the reference. In this manner, a spike-like peak loss can be detected.
- As a method of setting the reference for detecting a peak loss, for example, it is assumed that a baseline (zero point) of the
electrocardiographic information 10 is used or that a value of 50% of the potential from the baseline to an R wave peak is used; however, an actual method is not specified, and it is merely preferable to appropriately adjust the reference by referring to the value obtained by the above method, for example. - Alternatively, as another method for detecting a peak loss, a point of inflection immediately before or after an R wave or S wave peak is used, and the potential at the point of inflection is compared with a preset reference to detect a peak loss. Specifically, for example, a peak loss is detected by determining whether or not the potential of the point of inflection immediately before or after an R wave peak exceeds the reference, or a peak loss is detected by determining whether or not the potential of the point of inflection immediately before or after an S wave peak is less than the reference. In this manner, a peak loss portion due to distortion can be detected.
- Note that the reference of each extreme value or the point of inflection is set based on, for example, extreme values and points of inflection of each of waveforms in which no peak loss is occurring and waveforms in which a peak loss is occurring.
- After a loss is detected, the
data interpolation unit 35 interpolates data for the detected peak loss portion (step S106). As a method for interpolating the peak loss portion, a known method such as general spline interpolation can be adopted. Note that thedata interpolation unit 35 also interpolates original waveform data (for example, thewaveform data 11 or 12). -
FIGS. 8A to 8C are diagrams for describing processing examples of the loss detection unit and the data interpolation unit according to the first embodiment. InFIGS. 8A to 8C , a waveform assumed in a case where there is no defect is indicated by a broken line. The loss portion is detected from theunit waveform data 13 by the peak loss detection described above. - Note that, in a case where no peak loss is detected, the processing for the
unit waveform data 13 is ended. - The
loss detection unit 34 detects, for example, a minimum point T11 immediately before a peak of an R wave or a minimum point T12 immediately after the peak of the R wave forunit waveform data 13A and determines whether or not the potential of the minimum point exceeds a reference to detect a peak loss (see(a) of FIG. 8A ). Then, thedata interpolation unit 35 interpolates an interpolation waveform L3 for the peak loss portion (see(b) of FIG. 8A ) and generatesinterpolation data 14A (see(c) of FIG. 8A ). As a result, the peak position of the R wave changes from a peak position T21 to a peak position T31. - The
loss detection unit 34 detects, for example, a maximum point T13 immediately before a peak of an R wave or a maximum point T14 immediately after the peak of the R wave forunit waveform data 13B and determines whether or not the potential of the maximum point exceeds a reference to detect a peak loss (see(a) of FIG. 8B ). Then, thedata interpolation unit 35 interpolates an interpolation waveform L4 for the peak loss portion (see(b) of FIG. 8B ) and generatesinterpolation data 14B (see(c) of FIG. 8B ). As a result, the peak position of the R wave changes from a peak position T22 to a peak position T32. - The
loss detection unit 34 detects, for example, a point of inflection T15 immediately before a peak of an R wave or a point of inflection T16 immediately after the peak of the R wave forunit waveform data 13C and determines whether or not the potential of the point of inflection exceeds a reference to detect a peak loss (see(a) of FIG. 8C ). Then, thedata interpolation unit 35 interpolates an interpolation waveform L5 for the peak loss portion (see(b) of FIG. 8C ) and generatesinterpolation data 14C (see(c) of FIG. 8C ). As a result, the peak position of the R wave changes from a peak position T23 to a peak position T33. - After the interpolation processing, the
data interpolation unit 35 resets the wave height for interpolation data 14 (step S107). Thedata interpolation unit 35 resets the wave height of the interpolation data 14 (for example, theinterpolation data 14A to 14C illustrated inFIGS. 8A to 8C ) based on the peak of the R wave of the waveform. As a result, the wave height calculated based on the peak of the R wave of the waveform before interpolation is changed. The wave height by the resetting processing is used for convenience of determining normality or arrhythmia and is used as the actual wave height of the electrocardiographic waveform in which the peak loss has occurred. Incidentally, the same applies to a case of using the cycle. - After the interpolation processing, the
control unit 37 outputs the interpolation data 14 (step S108). The output destination is, for example, thestorage unit 38 or theoutput unit 36. As an output mode of the interpolation data 14, it is conceivable to output theelectrocardiographic information 10 input to theinput unit 31 as replaced electrocardiographic information obtained by replacing a corresponding portion with the interpolated interpolation data 14; however, it is not limited thereto. It is also conceivable that a wave height or a cycle set after the interpolation is output in an integrated manner with another wave height or cycle calculated by the unit waveformdata extracting unit 33; however, it is not limited thereto. - Note that it is conceivable that the above-described processing is executed each time at timing at which new electrocardiographic information is input or is executed each time at timing at which a certain amount of electrocardiographic information is accumulated; however, it is not limited thereto.
- In the first embodiment described above, the peak loss of the waveform is detected based on the
unit waveform data 13, and the detected peak loss is interpolated to reset the wave height of theunit waveform data 13. According to the first embodiment, in a case where the determination of the arrhythmia is applied using the reset cycle or wave height, it is possible to suppress erroneous determination due to the influence of a peak loss, and as a result, it is possible to determine normality or arrhythmia from theelectrocardiographic information 10 with high accuracy. - Note that, in the first embodiment, an example in which the
data interpolation unit 35 generates interpolated waveform data (the interpolation data 14) has been described. However, in order to determine normality or arrhythmia from theelectrocardiographic information 10, it is not always necessary to generate the interpolation data 14, and it is sufficient to use a reset wave height. Therefore, the interpolation data 14 may not be generated. In addition, it is sufficient for the wave height that information necessary for determining normality or arrhythmia be generated from theelectrocardiographic information 10, and at least one of pieces of information necessary for the determination may be calculated or reset. - In the first embodiment, the example in which the unit waveform
data extracting unit 33 and thedata interpolation unit 35 set the wave height has been described. However, the wave height may be set in step S107 without executing the calculation processing in step S104. In this case, in a case where no peak loss is detected, in step S107, the unit waveform data extracting unit 33 (or the data interpolation unit 35) calculates the wave height based on theunit waveform data 13. In addition, in a case where a peak loss is detected, in step S107, thedata interpolation unit 35 calculates the wave height based on theunit waveform data 13 obtained by the interpolation. - Next, a second embodiment of the present invention will be described.
FIG. 9 is a diagram illustrating a configuration example of an electrocardiographic signal analysis system according to a second embodiment. The second embodiment includes an electrocardiographicsignal analysis system 3A instead of the electrocardiographicsignal analysis system 3 according to the first embodiment. In the electrocardiographicsignal analysis system 3A, the same components as those of the electrocardiographicsignal analysis system 3 are denoted by the same reference numerals, and description thereof will be omitted. Hereinafter, points different from those of the first embodiment will be described. - The electrocardiographic
signal analysis system 3A according to the second embodiment includes aninput unit 31, afilter processing unit 32, a unit waveformdata extracting unit 33, aloss detection unit 34, adata interpolation unit 35, anoutput unit 36, acontrol unit 37, astorage unit 38, and a wave heightratio generating unit 39. - The wave height
ratio generating unit 39 aggregates wave heights associated with respective pieces ofunit waveform data 13 included inelectrocardiographic information 10 and generates, when any one of the average value, the maximum value, and the minimum value of the wave heights is used as a reference, a wave height ratio that is a relative amount concerning the reference. -
FIGS. 10A and10B are diagrams illustrating a processing example of the wave height ratio generating unit. In the filter processing according to the second embodiment, first, theinput unit 31 acquires theelectrocardiographic information 10 obtained from a subject 1 via an electrocardiographicsignal measuring instrument 2.Waveform data electrocardiographic information 10 and obtained by plotting with the horizontal axis as time and the vertical axis as the voltage (see(a) of FIG. 10A and(a) of FIG. 10B ). At this point, the amount of noise to be superimposed is different between thewaveform data 21A and thewaveform data 21B, and more noise is superimposed on thewaveform data 21B than on thewaveform data 21A. - Next, filter processing is executed by the
filter processing unit 32 to generate filtered electrocardiographic information (waveform data) 22A and 22B (see(b) of FIG. 10A and(b) of FIG. 10B) . At this point, the filter processing to be executed is different between thewaveform data 22A and thewaveform data 22B, and since the amount of noise superimposed is large in thewaveform data 21B, filter processing for smoothing is executed more on thewaveform data 22B than on thewaveform data 22A. - In this manner, since the influence of noise can be reduced when the filter processing is executed, extraction of the
unit waveform data 13 by the unit waveformdata extracting unit 33, the loss detection by theloss detection unit 34, and others, which are subsequent processing, can be performed with higher accuracy.
However, in a case where the filter processing for further smoothing is executed as in thewaveform data 22B, there is a concern about deformation of the waveform and reduction of the wave height. - Unit waveform data 23Aa to 23Ad and 23Ba to 23Bd included in the
waveform data data extracting unit 33 or a wave height reset by thedata interpolation unit 35. - The associated wave heights are used as a criterion for the determination of arrhythmia; however, it can be seen that the wave height is smaller in the
waveform data 22B on which the filter processing for further smoothing has been executed than in thewaveform data 22A. Therefore, in consideration of the determination of arrhythmia, which is the final application, if the wave height is output as it is as in the first embodiment, the filter design has to be limited in order to suppress the influence of the filter design. - Therefore, the wave height
ratio generating unit 39 aggregates the wave heights associated with theunit waveform data 13 included in thewaveform data 12 and generates the wave height ratio that is a relative amount. InFIGS. 10A and10B , the average value is used as the reference (100%); however, the maximum value or the minimum value may be used as the reference. - According to this, the wave heights associated with the unit waveform data 23Aa to 23Ad and 23Ba to 23Bd can be treated as a wave height ratio in percentage rather than a voltage value in volts, and it is possible to determine the arrhythmia (detect an abnormal wave height) as usual after canceling the influence of the filter design.
- According to the second embodiment described above, since the influence of the filter design can be canceled and the filter processing for further smoothing can be executed, the extraction of the
unit waveform data 13 by the unit waveformdata extracting unit 33, the loss detection by theloss detection unit 34, and others, which are subsequent processing, can be performed with higher accuracy. - In addition, since a waveform having a relatively large or small wave height can be found from the wave height ratio, the determination of arrhythmia, which is the final application, can be performed as usual.
- Although the embodiments for carrying out the present invention have been described above, the present invention should not be limited only by the above-described embodiments. For example, it has been described that the electrocardiographic
signal analysis systems signal measuring instrument 2; however, the electrocardiographicsignal analysis systems signal measuring instrument 2. In addition, at least some of the functions of the electrocardiographicsignal analysis systems electrocardiograph 100. For example, theelectrocardiograph 100 may include theinput unit 31, thefilter processing unit 32, the unit waveformdata extracting unit 33, theloss detection unit 34, thedata interpolation unit 35, theoutput unit 36, and thecontrol unit 37. - Using the electrocardiographic signal analysis system according to the present invention makes it possible to optimize the waveform when a peak loss occurs in an electrocardiographic waveform.
-
- 1 SUBJECT
- 2 ELECTROCARDIOGRAPHIC SIGNAL MEASURING INSTRUMENT
- 3, 3A ELECTROCARDIOGRAPHIC SIGNAL ANALYSIS SYSTEM
- 10 ELECTROCARDIOGRAPHIC INFORMATION
- 11, 11A to 11C, 12, 12A to 12C, 21A, 21B, 22A, 22B WAVEFORM DATA
- 13, 13A to 13C, 23Aa to 23Ad, 23Ba to 23Bd UNIT WAVEFORM DATA
- 14, 14A to 14C INTERPOLATION DATA
- 31 INPUT UNIT
- 32 FILTER PROCESSING UNIT
- 33 UNIT WAVEFORM DATA EXTRACTING UNIT
- 34 LOSS DETECTION UNIT
- 35 DATA INTERPOLATION UNIT
- 36 OUTPUT UNIT
- 37 CONTROL UNIT
- 38 STORAGE UNIT
- 39 WAVE HEIGHT RATIO GENERATING UNIT
- 100 ELECTROCARDIOGRAPH
- RL LOSS PORTION
Claims (7)
- An electrocardiographic signal analysis system that acquires electrocardiographic information and performs processing, the electrocardiographic signal analysis system comprising:an input unit configured to receive input of the electrocardiographic information;a unit waveform data extracting unit configured to perform segmentation and extract unit waveform data based on a peak of an R wave or an S wave from waveform data included in the electrocardiographic information;a loss detection unit configured to detect a loss portion of a peak of an R wave or an S wave in the unit waveform data using an extreme value immediately before or immediately after the peak or using a point of inflection immediately before or immediately after the peak; anda data interpolation unit configured to set a wave height or a cycle of a waveform after interpolation based on a peak position of an R wave or an S wave of a waveform obtained by interpolating the loss portion.
- The electrocardiographic signal analysis system according to claim 1, wherein
concerning the unit waveform data, the loss detection unit is configured to determine whether or not a minimum point immediately before or immediately after the peak of the R wave exceeds a reference or whether or not a maximum point immediately before or immediately after the peak of the S wave is below a reference to detect the peak loss. - The electrocardiographic signal analysis system according to claim 1, wherein
concerning the unit waveform data, the loss detection unit is configured to determine whether or not a maximum point immediately before or immediately after the peak of the R wave exceeds a reference or whether or not a minimum point immediately before or immediately after the peak of the S wave is below a reference to detect the peak loss. - The electrocardiographic signal analysis system according to claim 1, wherein
concerning the unit waveform data, the loss detection unit is configured to determine whether or not the point of inflection immediately before or immediately after the peak of the R wave exceeds a reference or whether or not the point of inflection immediately before or immediately after the peak of the S wave is below a reference to detect the peak loss. - The electrocardiographic signal analysis system according to any one of claims 1 to 4, further comprising:a filter processing unit that applies a filter to the electrocardiographic information acquired by the input unit to pass the characteristic frequency and outputs filtered electrocardiographic information, whereinthe unit waveform data extracting unit is configured to extract the unit waveform data based on the filtered electrocardiographic information.
- The electrocardiographic signal analysis system according to any one of claims 1 to 4, further comprising:a filter processing unit that applies a filter to the electrocardiographic information acquired by the input unit to retain the frequency components of both or either the R wave and the S wave, and outputs filtered electrocardiographic information, whereinthe unit waveform data extracting unit is configured to extract the unit waveform data based on the filtered electrocardiographic information, andwhen any one of an average value, a maximum value, or a minimum value of wave heights in the unit waveform data is used as a reference, the wave height set by the data interpolation unit is a relative amount concerning the reference.
- The electrocardiographic signal analysis system according to any one of claims 1 to 4, wherein
the data interpolation unit is configured to generate interpolation data in which the peak loss portion is interpolated.
Applications Claiming Priority (2)
| Application Number | Priority Date | Filing Date | Title |
|---|---|---|---|
| JP2022053215 | 2022-03-29 | ||
| PCT/JP2023/005851 WO2023188982A1 (en) | 2022-03-29 | 2023-02-17 | Electrocardiogram signal analysis system |
Publications (3)
| Publication Number | Publication Date |
|---|---|
| EP4501238A1 true EP4501238A1 (en) | 2025-02-05 |
| EP4501238A4 EP4501238A4 (en) | 2026-02-25 |
| EP4501238B1 EP4501238B1 (en) | 2026-07-22 |
Family
ID=88200346
Family Applications (1)
| Application Number | Title | Priority Date | Filing Date |
|---|---|---|---|
| EP23779012.6A Active EP4501238B1 (en) | 2022-03-29 | 2023-02-17 | Electrocardiogram signal analysis system |
Country Status (7)
| Country | Link |
|---|---|
| US (1) | US20250210187A1 (en) |
| EP (1) | EP4501238B1 (en) |
| JP (1) | JPWO2023188982A1 (en) |
| KR (1) | KR20240164539A (en) |
| CN (1) | CN118946311A (en) |
| TW (1) | TW202400085A (en) |
| WO (1) | WO2023188982A1 (en) |
Families Citing this family (1)
| Publication number | Priority date | Publication date | Assignee | Title |
|---|---|---|---|---|
| CN118136119B (en) * | 2024-04-30 | 2024-08-06 | 宁波海尔施基因科技股份有限公司 | Capillary electrophoresis mobility correction method for Sanger sequencing |
Family Cites Families (6)
| Publication number | Priority date | Publication date | Assignee | Title |
|---|---|---|---|---|
| US7027855B2 (en) * | 2002-08-27 | 2006-04-11 | General Electric Company | R-peak detection corrections for improved cardiac gated reconstruction |
| CN104161510B (en) * | 2014-08-27 | 2016-03-23 | 电子科技大学 | A QRS Waveform Recognition Method of Multilevel Lead ECG Signal |
| WO2017135116A1 (en) | 2016-02-04 | 2017-08-10 | 日本電信電話株式会社 | Biological signal processing method and biological signal processing device |
| JP6857582B2 (en) * | 2017-09-14 | 2021-04-14 | 日本電信電話株式会社 | Instantaneous heart rate time series data complement device, complement method and its program |
| US11974852B2 (en) * | 2019-10-11 | 2024-05-07 | Physio-Control, Inc. | Devices and methods for analyzing electrocardiogram (ECG) signals for artifact and notification of culprit electrode |
| CN111513706B (en) * | 2020-04-20 | 2022-09-27 | 重庆邮电大学 | Method and device for detecting electrocardiosignals containing abnormal R waves |
-
2023
- 2023-02-17 EP EP23779012.6A patent/EP4501238B1/en active Active
- 2023-02-17 US US18/847,809 patent/US20250210187A1/en active Pending
- 2023-02-17 KR KR1020247033931A patent/KR20240164539A/en active Pending
- 2023-02-17 WO PCT/JP2023/005851 patent/WO2023188982A1/en not_active Ceased
- 2023-02-17 JP JP2023517913A patent/JPWO2023188982A1/ja active Pending
- 2023-02-17 CN CN202380030312.4A patent/CN118946311A/en active Pending
- 2023-03-07 TW TW112108350A patent/TW202400085A/en unknown
Also Published As
| Publication number | Publication date |
|---|---|
| CN118946311A (en) | 2024-11-12 |
| TW202400085A (en) | 2024-01-01 |
| EP4501238A4 (en) | 2026-02-25 |
| WO2023188982A1 (en) | 2023-10-05 |
| US20250210187A1 (en) | 2025-06-26 |
| JPWO2023188982A1 (en) | 2023-10-05 |
| EP4501238B1 (en) | 2026-07-22 |
| KR20240164539A (en) | 2024-11-19 |
Similar Documents
| Publication | Publication Date | Title |
|---|---|---|
| De Groot et al. | Critical appraisal of technologies to assess electrical activity during atrial fibrillation: A position paper from the European heart rhythm association and European society of cardiology working group on eCardiology in collaboration with the heart rhythm society, asia pacific heart rhythm society, Latin American heart rhythm society and computing in cardiology | |
| EP3054840B1 (en) | Prediction of risk for sudden cardiac death | |
| US12575795B2 (en) | Non-invasive prediction of risk for sudden cardiac death | |
| US9782092B2 (en) | Patient signal analysis based on vector analysis | |
| CN116528763B (en) | Biological signal analysis system | |
| CN108601546B (en) | Biological signal processing method and biological signal processing apparatus | |
| US10945623B2 (en) | Heartbeat detection method and heartbeat detection device | |
| CN109843165B (en) | Heartbeat detection method and heartbeat detection device | |
| JP2018011819A (en) | Biological signal processing method and device | |
| US20250210187A1 (en) | Electrocardiographic signal analysis system | |
| US10750969B2 (en) | Heartbeat detection method and heartbeat detection device | |
| EP4501237A1 (en) | Electrocardiogram signal analysis system | |
| KR101321290B1 (en) | Holter system with atrial fibrillation waveform extraction and therof method | |
| JP2017051496A (en) | Electrocardiogram analysis method, electrocardiogram analyzer, electrocardiogram analysis program, and computer-readable recording medium including electrocardiogram analysis program stored therein | |
| D'Addio et al. | Correlation between power-law behavior and poincare plots of heart rate variability in congestive heart failure patients | |
| Ramírez et al. | Prediction of sudden cardiac death in chronic heart failure patients by analysis of restitution dispersion | |
| US10722135B2 (en) | Myogram determination from ECG signal | |
| Ramírez et al. | Comparison of ECG T-wave duration and morphology restitution markers for sudden cardiac death prediction in chronic heart failure | |
| KR20140074664A (en) | Method for detecting disease and apparatus using the method | |
| JP2022029070A (en) | Information processing device and program | |
| JP7457266B2 (en) | Signal analysis device, signal analysis method and program | |
| Martin-Yebra et al. | Index of T-wave variation as a predictor of sudden cardiac death in chronic heart failure patients with atrial fibrillation | |
| JP7216599B2 (en) | Heart rate analyzer | |
| JP2023145972A (en) | Electrocardiogram signal analysis system | |
| Wan et al. | Improved modified moving average analysis of T-wave alternans using least squares-based curve fitting method |
Legal Events
| Date | Code | Title | Description |
|---|---|---|---|
| STAA | Information on the status of an ep patent application or granted ep patent |
Free format text: STATUS: THE INTERNATIONAL PUBLICATION HAS BEEN MADE |
|
| PUAI | Public reference made under article 153(3) epc to a published international application that has entered the european phase |
Free format text: ORIGINAL CODE: 0009012 |
|
| STAA | Information on the status of an ep patent application or granted ep patent |
Free format text: STATUS: REQUEST FOR EXAMINATION WAS MADE |
|
| 17P | Request for examination filed |
Effective date: 20240927 |
|
| AK | Designated contracting states |
Kind code of ref document: A1 Designated state(s): AL AT BE BG CH CY CZ DE DK EE ES FI FR GB GR HR HU IE IS IT LI LT LU LV MC ME MK MT NL NO PL PT RO RS SE SI SK SM TR |
|
| DAV | Request for validation of the european patent (deleted) | ||
| DAX | Request for extension of the european patent (deleted) | ||
| REG | Reference to a national code |
Ref country code: DE Ref legal event code: R079 Free format text: PREVIOUS MAIN CLASS: A61B0005346000 Ipc: A61B0005366000 Ref document number: 602023020284 Country of ref document: DE |
|
| A4 | Supplementary search report drawn up and despatched |
Effective date: 20260128 |
|
| RIC1 | Information provided on ipc code assigned before grant |
Ipc: A61B 5/366 20210101AFI20260122BHEP Ipc: A61B 5/346 20210101ALI20260122BHEP Ipc: A61B 5/349 20210101ALI20260122BHEP Ipc: A61B 5/00 20060101ALI20260122BHEP Ipc: A61B 5/352 20210101ALI20260122BHEP |
|
| GRAP | Despatch of communication of intention to grant a patent |
Free format text: ORIGINAL CODE: EPIDOSNIGR1 |
|
| STAA | Information on the status of an ep patent application or granted ep patent |
Free format text: STATUS: GRANT OF PATENT IS INTENDED |
|
| RIC1 | Information provided on ipc code assigned before grant |
Ipc: A61B 5/366 20210101AFI20260420BHEP Ipc: A61B 5/346 20210101ALI20260420BHEP Ipc: A61B 5/349 20210101ALI20260420BHEP Ipc: A61B 5/00 20060101ALI20260420BHEP Ipc: A61B 5/352 20210101ALI20260420BHEP |
|
| INTG | Intention to grant announced |
Effective date: 20260519 |
|
| GRAS | Grant fee paid |
Free format text: ORIGINAL CODE: EPIDOSNIGR3 |
|
| GRAA | (expected) grant |
Free format text: ORIGINAL CODE: 0009210 |
|
| STAA | Information on the status of an ep patent application or granted ep patent |
Free format text: STATUS: THE PATENT HAS BEEN GRANTED |
|
| AK | Designated contracting states |
Kind code of ref document: B1 Designated state(s): AL AT BE BG CH CY CZ DE DK EE ES FI FR GB GR HR HU IE IS IT LI LT LU LV MC ME MK MT NL NO PL PT RO RS SE SI SK SM TR |
|
| P01 | Opt-out of the competence of the unified patent court (upc) registered |
Free format text: CASE NUMBER: UPC_APP_0018674_4501238/2026 Effective date: 20260615 |
|
| REG | Reference to a national code |
Ref country code: CH Ref legal event code: F10 Free format text: ST27 STATUS EVENT CODE: U-0-0-F10-F00 (AS PROVIDED BY THE NATIONAL OFFICE) Effective date: 20260722 Ref country code: GB Ref legal event code: FG4D |
|
| REG | Reference to a national code |
Ref country code: IE Ref legal event code: FG4D |
|
| REG | Reference to a national code |
Ref country code: DE Ref legal event code: R096 Ref document number: 602023020284 Country of ref document: DE |