EP4498302A1 - Environmental impact evaluation index calculation system and method for using environmental impact evaluation index calculation system - Google Patents
Environmental impact evaluation index calculation system and method for using environmental impact evaluation index calculation system Download PDFInfo
- Publication number
- EP4498302A1 EP4498302A1 EP24190085.1A EP24190085A EP4498302A1 EP 4498302 A1 EP4498302 A1 EP 4498302A1 EP 24190085 A EP24190085 A EP 24190085A EP 4498302 A1 EP4498302 A1 EP 4498302A1
- Authority
- EP
- European Patent Office
- Prior art keywords
- environmental impact
- calculation system
- evaluation index
- company
- soil
- Prior art date
- Legal status (The legal status is an assumption and is not a legal conclusion. Google has not performed a legal analysis and makes no representation as to the accuracy of the status listed.)
- Pending
Links
Images



Classifications
-
- G—PHYSICS
- G06—COMPUTING OR CALCULATING; COUNTING
- G06Q—INFORMATION AND COMMUNICATION TECHNOLOGY [ICT] SPECIALLY ADAPTED FOR ADMINISTRATIVE, COMMERCIAL, FINANCIAL, MANAGERIAL OR SUPERVISORY PURPOSES; SYSTEMS OR METHODS SPECIALLY ADAPTED FOR ADMINISTRATIVE, COMMERCIAL, FINANCIAL, MANAGERIAL OR SUPERVISORY PURPOSES, NOT OTHERWISE PROVIDED FOR
- G06Q10/00—Administration; Management
- G06Q10/06—Resources, workflows, human or project management; Enterprise or organisation planning; Enterprise or organisation modelling
-
- G—PHYSICS
- G06—COMPUTING OR CALCULATING; COUNTING
- G06Q—INFORMATION AND COMMUNICATION TECHNOLOGY [ICT] SPECIALLY ADAPTED FOR ADMINISTRATIVE, COMMERCIAL, FINANCIAL, MANAGERIAL OR SUPERVISORY PURPOSES; SYSTEMS OR METHODS SPECIALLY ADAPTED FOR ADMINISTRATIVE, COMMERCIAL, FINANCIAL, MANAGERIAL OR SUPERVISORY PURPOSES, NOT OTHERWISE PROVIDED FOR
- G06Q50/00—Information and communication technology [ICT] specially adapted for implementation of business processes of specific business sectors, e.g. utilities or tourism
- G06Q50/08—Construction
-
- G—PHYSICS
- G06—COMPUTING OR CALCULATING; COUNTING
- G06Q—INFORMATION AND COMMUNICATION TECHNOLOGY [ICT] SPECIALLY ADAPTED FOR ADMINISTRATIVE, COMMERCIAL, FINANCIAL, MANAGERIAL OR SUPERVISORY PURPOSES; SYSTEMS OR METHODS SPECIALLY ADAPTED FOR ADMINISTRATIVE, COMMERCIAL, FINANCIAL, MANAGERIAL OR SUPERVISORY PURPOSES, NOT OTHERWISE PROVIDED FOR
- G06Q50/00—Information and communication technology [ICT] specially adapted for implementation of business processes of specific business sectors, e.g. utilities or tourism
- G06Q50/10—Services
- G06Q50/16—Real estate
- G06Q50/165—Land development
Definitions
- the present invention relates to an environmental impact evaluation index calculation system and a method for using the environmental impact evaluation index calculation system.
- JP 2022-153012 A proposes, for the purpose of providing a carbon storage agriculture evaluation system and a method for providing carbon storage agriculture evaluation information for visualizing carbon storage agriculture, "A carbon storage agriculture evaluation system, comprising: a data acquisition unit that reads, from a storage device, first data indicating a characteristic of a soil enhancement material containing bio-coal, second data including an application amount of the soil enhancement material containing the bio-coal applied to agricultural land, the type and surface area of the agricultural land, and the type and amount of applied fertilizer, and third data including the variety and the harvest amount of crops cultivated on the agricultural land; and a data processor that uses the first to third data acquired by the data acquisition unit to calculate one or both of a carbon storage amount and a greenhouse gas emission reduction amount of the agricultural land.
- JP 2022-153012 A discloses an invention that employs agriculture-related data to estimate carbon amounts and thus achieve the purpose of the invention.
- sources evaluated as being carbon neutral a CO2 generation source, an absorption source, and the like, which were not evaluated in the production process or the like, are indicated again, and therefore an evaluation of the amount of CO2 emissions in terms of overall environmental impact is problematic.
- indexing the environmental load of water quality and soil in the surrounding environment is problematic.
- an object of the present invention is to provide an environmental impact evaluation index calculation system and a method for using the environmental impact evaluation index calculation system that make it possible to provide investors and the like with a composite index, which is determined by evaluating the environmental impact on the surroundings caused by CO2 emissions and economic activity and which takes into account an evaluation of the impact on the CO2 storage capacity of soil, which is caused by a change in the natural environment in various land use methods such as solar installations, biofuel production, resource mining, and building and house construction.
- the present invention provides "an environmental impact evaluation index calculation system that determines, as an index, an environmental impact of a company on a social environment, the environmental impact evaluation index calculation system determining a CO2 emission storage amount from total CO2 emissions emitted from within a company facility, a total soil carbon amount and a carbon absorption capacity within the company facility estimated using a soil carbon cycle model, and a carbon absorption capacity in a downstream region within the company facility estimated using a river simulator, and setting the CO2 emission storage amount as a first environmental impact index.
- the present invention provides "a method for using an environmental impact evaluation index calculation system that employs the environmental impact evaluation index calculation system, wherein the environmental impact index is presented to investors, and a company provides, to the environmental impact evaluation index calculation system, calculation basis data of total CO2 emissions emitted from within a company facility and data on soil within the company facility".
- the present invention enables not only emissions, but also an absorption amount, to be used together, and also enables an environmental impact on the surroundings to be expressed as an index to facilitate an investment decision, thus enabling an evaluation of the overall environmental impact to be performed.
- Fig. 1 is a diagram showing a configuration example of an environmental impact evaluation index calculation system according to an embodiment of the present invention.
- a business model using the environmental impact evaluation index calculation system will be described.
- Participants in this business model are a company 2 striving for environmental protection and an investor 3 investing in company 2 in support of the environmental protection activities of company 2, and, as a third party, an environmental impact evaluation index calculation system 1 that calculates and provides an environmental impact evaluation index enabling an accurate evaluation of the results and the current status of the environmental activities of company 2.
- company 2 is not limited to being one company.
- company 2 which is striving for environmental protection, provides various data D to the environmental impact evaluation index calculation system 1 in an appropriate situation.
- the various types of data D include CO2 emissions data, raw material procurement data, and soil data of a production site. From the viewpoint of the data to be provided, it is desirable to provide a wide variety of data, such as data related to direct emissions of greenhouse gases by the business entity itself (fuel combustion, industrial processes), data related to indirect emissions associated with the use of electricity, heat, and steam supplied from other companies, and data related to indirect emissions other than the foregoing emissions (emissions by other companies related to activities of the companies).
- data D are ascertained by being roughly divided into two types.
- One data type is basis data D1 for calculating the total CO2 emissions due to the activities of company 2, and the other type is measurement-related data D2 when company 2 executes a soil enhancement measure 2b or the like to improve the environment.
- the basis data D1 for calculating the total CO2 emissions is an environmental management/monitoring plan D11 of company 2, emissions D12 at the time of raw material procurement, emissions D13 at the time of production, emissions D14 at the time of product transportation and usage, and the like.
- the measurement-related data D2 when the soil enhancement measure 2b or the like is implemented includes soil data D21 on raw material procurement and the production site as the measurement data D2 of company 2, and in addition, the weather data D22a, the environmental data D22b, and the land use data D22c are determined as the regional data D22 for the region where the company is conducting business activities.
- elevation topography data D31 and river data D32 are inputted as map data D3.
- map information is provided and an evaluation is performed to include the impact on a river downstream region in particular.
- the environmental impact evaluation index calculation system 1 uses the various data D1, D2, and D3 described above to perform the following processing sequentially. Note that the environmental impact evaluation index calculation system 1 is implemented using a computer, and the main processing functions executed in an arithmetic unit of the computer are represented by blocks in Fig. 1 .
- the total emissions calculation processor 11 in the environmental impact evaluation index calculation system 1 calculates the total CO2 emissions within the company facility and an increase/decrease of the emissions.
- the environmental management/monitoring plan D11 of company 2 emissions D12 at the time of raw material procurement, emissions D13 at the time of production, and emissions D14 at the time of product transportation and usage, which are basis data D1 for calculating the total CO2 emissions, are used.
- the CO2 in the air may be determined by multiplying an "activity amount", which is used in economic statistics such as usage of gasoline, electricity, gas, and the like, by an "emission coefficient".
- a total soil carbon amount calculation unit 12 in the environmental impact evaluation index calculation system 1 calculates the total soil carbon amount in the target area and an increase or decrease of the total soil carbon amount.
- a carbon absorption capacity estimation processor 13 estimates the carbon absorption capacity of the target area.
- the target area here is assumed to be on site at company 2. Note that, in the processing by the total soil carbon amount calculation unit 12 and the carbon absorption capacity estimation processor 13, a soil carbon cycle model 12M in Fig. 2 is used.
- the soil carbon cycle model 12M is configured based on the RothC model.
- the total soil carbon amount D41 and the CO2 emissions D42 are calculated for a sampling area A1, for example, of a region A managed by the company.
- the weather data D22a, the environmental data D22b, and the land use data D22c are inputted, and the total soil carbon amount D41 and the CO2 emissions D42 are estimated.
- modeling is performed for each area A1 divided into vegetation and soil features.
- the weather data D22a is a precipitation amount, a temperature, and humidity, and the environmental data corresponds to soil characteristics, vegetation data, and the like.
- the land use data D22c includes data on organic matter such as plants for each area.
- the soil carbon cycle model 12M which is based on the RothC model, is obtained by defining a plurality of states of organic matter for soil-carbon decomposition and accumulation processes, and modeling temporal changes between the states.
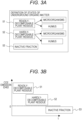
- Fig. 3A defines a plurality of states of underground organic matter, and the underground organic matter are accordingly defined by being divided into a readily-decomposable plant residue 51 (composed of the total number of microorganisms and humus) in which decomposition proceeds relatively quickly, a hardly-decomposable plant residue 52 (composed of the total number of microorganisms and humus) in which decomposition proceeds relatively slowly, and an inactive fraction 53 in which decomposition barely advances. Note that the ratio of underground organic matter for each of the divided areas A is determined from soil measurement data.
- Fig. 3b the horizontal axis represents time, and the vertical axis represents CO2 emissions.
- This drawing illustrates that the readily-decomposable plant residue 51, which decomposes quickly, is initially responsible for CO2 emissions, whereupon the hardly-decomposable plant residue 52, which decomposes slowly, is responsible for CO2 emissions, and that the inactive fraction 53 does not contribute to CO2 emissions.
- This decomposition means that CO2 emissions at an appropriate point in time in Fig. 3b are determined, and at the same time, means that the carbon absorption capacity in this area is determined chronologically by the carbon absorption capacity estimation processor 13 by using the soil carbon cycle model 12M.
- the estimation processor 14 of the environmental impact on the downstream region in the environmental impact evaluation index calculation system 1 uses the river simulator 14M to estimate the environmental impact on the downstream region of the target area.
- the river simulator 14M is configured based on a Sail & Water assessment tool (SWAT) model of a material circulation model in a target basin. Note that, in the SWAT model, a GIS interface is mounted, and dynamic processes such as water circulation, soil erosion, nutrient salt, agricultural chemicals, microorganisms, and the like in a water collection area are reproduced and predicted.
- SWAT Sail & Water assessment tool
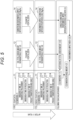
- Fig. 4 is a diagram to illustrate processing by the river simulator 14M.
- the river simulator 14M executes processing in three stages.
- a river region is designated which includes, as analysis areas, a company site and a downstream region of a surrounding river.
- Data necessary for analysis by the river simulator 14M is also acquired.
- These data are the weather data D22a, the environmental data D22b, the elevation topography data D31, and the land use data D22b.
- the weather data D22a includes a precipitation amount, temperature, and humidity data
- the environmental data D22b corresponds to soil characteristics, vegetation data, and the like.
- a second stage 14M2 the river flow is modeled using the SWAT model using the elevation topography data D31, the river data D32, and the weather data D22a, and the circulation of matter is estimated based on the river flow and reactions in the soil.
- the description of the processing content of the SWAT model illustrated in the second stage 14M2 of Fig. 4 is omitted, in short, the impact of the soil environment on the site of the company on the surrounding area over time due to the impact of the surrounding river is estimated and calculated chronologically.
- the environmental impact is visualized to enable a time-series display on a map.
- the estimation processor 17 for estimating the carbon absorption capacity including the downstream region estimates how the carbon absorption capacities in the target area (on the company site) and the downstream region have been changed by the impact of the carbon absorption capacity on the company site by using the carbon absorption capacity at the company site as determined by the processing of the carbon absorption capacity estimation processor 13 and the estimation processing results of the environmental impact determined by the environmental impact estimation processor 14 on the downstream region.
- the CO2 emission storage amount calculation unit 15 in Fig. 1 determines the CO2 emission storage amount that has already been emitted as the sum of the output of the total emissions calculation processor 11 and the output of the total soil carbon amount calculation unit 12.
- the former output is the amount of CO2 emitted through business activities, and the latter output is the amount of CO2 emitted by the soil on the site.
- the storage amount serving as the discharge reserve (scheduled for discharge in the near future) is determined from the output of the estimation processor 17 for estimating the carbon absorption capacity including the downstream region. Estimating the carbon absorption capacity means determining how much CO2 has accumulated without being discharged.
- An environmental impact index calculation unit 16 acquires information such as the CO2 emissions and the reserve amount (storage amount) thereof from the CO2 emission storage amount calculation unit 15, and also the degree of impact, on the downstream region, of the environmental impact downstream of the estimation processor 14, and externally presents data corresponding to these pieces of information.
- the investor 3 examines prospective investment recipients by referring to the environmental impact index of each company 2.
- the company 2 implements the soil enhancement measure 2a starting with highly effective areas.
- a cycle is created where the company 2 yields a profit from the investor 3 by creating absorption credits and an additional investment by improving the CO2 emission storage amount.
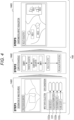
- Fig. 5 is presented in three stages, where an upper stage represents the first year, a middle stage represents the following year, and a lower stage represents an evaluation index for the following year.
- the processing results of the total emissions calculation processor 11, the processing results of the total soil carbon amount calculation unit 12, and the environmental impact estimation processing results determined by the estimation processor 14 regarding the environmental impact on the downstream region are indicated by specific numerical values.
- the CO2 emissions in the following year determined from the processing results by the total emissions calculation processor 11 were assumed to be 1.1t, as illustrated in the middle stage.
- measuring the carbon amount of soil sampled in the land at the time of raw material procurement yielded a result of 0.06 kg/m2. In a case where the surface area of the target area is 10,000 m2, the total carbon amount is then 0.6t.
- the environmental impact on the downstream region (nitrogen phosphorus load) determined by the estimation processor 14 for the environmental impact on the downstream region was reduced from 20 kg/ha to 10 kg/ha. Therefore, the rate of change from the first year to the following year is 0.5. Finally, by multiplying the difference 0.7t of the CO2 emissions by the rate of change 0.5 from the first year to the following year of the environmental impact, the environmental impact index is then 0.35.
- the energy of the factory utilizes gas and system power
- the amount of emission of the factory was 1t in the light of the basic units determined from the processing results of the total emissions calculation processor 11, and the CO2 emission storage amount determined by the CO2 emission storage amount calculation unit 15 including the carbon absorption loss D42 was evaluated as 1.4t.
- the environmental impact (nitrogen phosphorus load) on the downstream region before the factory construction determined by the estimation processor 14 of the environmental impact on the downstream region was 10 kg/ha
- the environmental impact (nitrogen phosphorus load) on the downstream region after the construction was 30 kg/ha.
- the rate of change in environmental impact on the downstream region is 3.
- the carbon amount was measured from a soil sample at the scheduled construction site by using the combustion oxidation method, and the total carbon amount D41 of the scheduled construction site was estimated from the topography and vegetation data. As a result, the total carbon amount D41 was 0.2t.
- the environmental impact (nitrogen phosphorus load) on the downstream region before the solar installation, which was determined by the estimation processor 14, on the downstream region was 10 kg/ha
- the environmental impact (nitrogen phosphorus load) on the downstream region one year after the solar installation was 14 kg/ha
- the environmental impact (nitrogen phosphorus load) on the downstream region after two years was 20 kg/ha.
- the rate of change in environmental impact on the downstream region was 1.4 after one year and 2 after two years.
- the environmental impact index determined by the environmental impact index calculation unit 16 was evaluated such that the environmental impact index after one year was 0.028 and the environmental impact index after two years was 0.08.
- the above-described embodiment of the present invention enables not only emissions, but also an absorption amount, to be used together, and also enables the environmental impact on the surroundings to be expressed as an index to facilitate an investment decision, thus enabling an evaluation of the overall environmental impact to be performed.
- the first embodiment presents the present invention with a focus on the data to be handled and the processing functions, whereas the second embodiment presents the basic premise behind the present invention.
- Fig. 6 is a diagram illustrating the basic premise behind the present invention.
- changes in land use 61 occur in a target area such as a company site, and soil sampling 62 and measurement 63 are performed.
- changes in land use 61 are the soil enhancement measure 2a, a fertilizer change, new factory construction, and solar power construction.
- the first model 64 estimates the carbon emission storage amount, and although, conventionally, only the carbon emission storage amount in the target area is estimated, in the present invention, the carbon emission storage amount in the area including the downstream area of the river is estimated. That is, for a target area such as a company site which is a soil nutrient source, the model application range is set to include a downstream region thereof. According to the first model 64, calculation can be performed including an SOC amount 65 including the downstream region, and upon receipt of the result, the CO2 reduction amount 66 is set as an index 1.
- a second model of the present invention involves applying a river simulator 67 to calculate, along the river, soil nutrient sources including flow rate, nitrogen, and phosphorus. This estimation result is used as an index 2 for the environmental impact 62 on the downstream region.
- a composite index which is the product of index 1 and index 2 is defined as an environmental impact index.
- the evaluation area covers not only the area of activity but also the downstream region affected by the area of activity.
- the environmental evaluation index is a composite evaluation index in which CO2 emissions and a downstream environmental impact are combined in a composite manner.
Landscapes
- Business, Economics & Management (AREA)
- Engineering & Computer Science (AREA)
- Strategic Management (AREA)
- Economics (AREA)
- Human Resources & Organizations (AREA)
- Tourism & Hospitality (AREA)
- General Business, Economics & Management (AREA)
- General Physics & Mathematics (AREA)
- Marketing (AREA)
- Physics & Mathematics (AREA)
- Theoretical Computer Science (AREA)
- General Health & Medical Sciences (AREA)
- Health & Medical Sciences (AREA)
- Primary Health Care (AREA)
- Entrepreneurship & Innovation (AREA)
- Development Economics (AREA)
- Educational Administration (AREA)
- Game Theory and Decision Science (AREA)
- Operations Research (AREA)
- Quality & Reliability (AREA)
- Management, Administration, Business Operations System, And Electronic Commerce (AREA)
Abstract
An environmental impact evaluation index calculation system that determines, as an index, an environmental impact of a company on a social environment, the environmental impact evaluation index calculation system determining a CO2 emission storage amount from total CO2 emissions emitted from within a company facility, a total soil carbon amount and a carbon absorption capacity within the company facility estimated using a soil carbon cycle model, and a carbon absorption capacity in a downstream region within the company facility estimated using a river simulator, and setting the CO2 emission storage amount as a first environmental impact index.
Description
- The present invention relates to an environmental impact evaluation index calculation system and a method for using the environmental impact evaluation index calculation system.
- In CO2 emission management for environmental protection, current emission credits transactions calculate emissions by accumulating basic units across the entire supply chain from production to usage, and thus determine transaction amounts. Meanwhile, in recent years, in addition to carbon storage in soil, indexing of the impact of economic activities on the surrounding environment has been required as an index for biological diversity.
- In this regard,
JP 2022-153012 A -
JP 2022-153012 A - In view of the foregoing, an object of the present invention is to provide an environmental impact evaluation index calculation system and a method for using the environmental impact evaluation index calculation system that make it possible to provide investors and the like with a composite index, which is determined by evaluating the environmental impact on the surroundings caused by CO2 emissions and economic activity and which takes into account an evaluation of the impact on the CO2 storage capacity of soil, which is caused by a change in the natural environment in various land use methods such as solar installations, biofuel production, resource mining, and building and house construction.
- In view of the foregoing, the present invention provides "an environmental impact evaluation index calculation system that determines, as an index, an environmental impact of a company on a social environment, the environmental impact evaluation index calculation system determining a CO2 emission storage amount from total CO2 emissions emitted from within a company facility, a total soil carbon amount and a carbon absorption capacity within the company facility estimated using a soil carbon cycle model, and a carbon absorption capacity in a downstream region within the company facility estimated using a river simulator, and setting the CO2 emission storage amount as a first environmental impact index".
- Further, the present invention provides "a method for using an environmental impact evaluation index calculation system that employs the environmental impact evaluation index calculation system, wherein the environmental impact index is presented to investors, and a company provides, to the environmental impact evaluation index calculation system, calculation basis data of total CO2 emissions emitted from within a company facility and data on soil within the company facility".
- The present invention enables not only emissions, but also an absorption amount, to be used together, and also enables an environmental impact on the surroundings to be expressed as an index to facilitate an investment decision, thus enabling an evaluation of the overall environmental impact to be performed.
-
-
Fig. 1 is a diagram showing a configuration example of an environmental impact evaluation index calculation system according to an embodiment of the present invention; -
Fig. 2 is a diagram illustrating a configuration example of a soilcarbon cycle model 12M; -
Fig. 3A is a diagram defining a plurality of states of underground organic matter; -
Fig. 3B is a diagram illustrating the relationship between time and CO2 emissions; -
Fig. 4 is a diagram to illustrate processing by ariver simulator 14M; -
Fig. 5 is a diagram to illustrate, using numerical values, a specific processing case to which the present invention is applied; and -
Fig. 6 is a diagram illustrating the basic premise behind the present invention. - Hereinafter, embodiments of the present invention will be described with reference to the drawings.
-
Fig. 1 is a diagram showing a configuration example of an environmental impact evaluation index calculation system according to an embodiment of the present invention. Here, before describing the configuration of the environmental impact evaluation index calculation system, a business model using the environmental impact evaluation index calculation system will be described. - Participants in this business model are a
company 2 striving for environmental protection and an investor 3 investing incompany 2 in support of the environmental protection activities ofcompany 2, and, as a third party, an environmental impact evaluationindex calculation system 1 that calculates and provides an environmental impact evaluation index enabling an accurate evaluation of the results and the current status of the environmental activities ofcompany 2. Note thatcompany 2 is not limited to being one company. - In order to implement an environmental enhancement cycle using the business model described above, first,
company 2, which is striving for environmental protection, provides various data D to the environmental impact evaluationindex calculation system 1 in an appropriate situation. The various types of data D include CO2 emissions data, raw material procurement data, and soil data of a production site. From the viewpoint of the data to be provided, it is desirable to provide a wide variety of data, such as data related to direct emissions of greenhouse gases by the business entity itself (fuel combustion, industrial processes), data related to indirect emissions associated with the use of electricity, heat, and steam supplied from other companies, and data related to indirect emissions other than the foregoing emissions (emissions by other companies related to activities of the companies). - These broadly provided data D are ascertained by being roughly divided into two types. One data type is basis data D1 for calculating the total CO2 emissions due to the activities of
company 2, and the other type is measurement-related data D2 whencompany 2 executes asoil enhancement measure 2b or the like to improve the environment. - Specifically, the basis data D1 for calculating the total CO2 emissions is an environmental management/monitoring plan D11 of
company 2, emissions D12 at the time of raw material procurement, emissions D13 at the time of production, emissions D14 at the time of product transportation and usage, and the like. - Further, the measurement-related data D2 when the soil enhancement measure 2b or the like is implemented includes soil data D21 on raw material procurement and the production site as the measurement data D2 of
company 2, and in addition, the weather data D22a, the environmental data D22b, and the land use data D22c are determined as the regional data D22 for the region where the company is conducting business activities. - In the environmental impact evaluation
index calculation system 1, in addition to the data D1 and D2 described above, elevation topography data D31 and river data D32 are inputted as map data D3. In the environmental impact evaluationindex calculation system 1 of the present invention, because the impact on the environment is not limited to within the company facility and extends to the surroundings, map information is provided and an evaluation is performed to include the impact on a river downstream region in particular. - Using the various data D1, D2, and D3 described above, the environmental impact evaluation
index calculation system 1 performs the following processing sequentially. Note that the environmental impact evaluationindex calculation system 1 is implemented using a computer, and the main processing functions executed in an arithmetic unit of the computer are represented by blocks inFig. 1 . - First, the total
emissions calculation processor 11 in the environmental impact evaluationindex calculation system 1 calculates the total CO2 emissions within the company facility and an increase/decrease of the emissions. In this calculation, the environmental management/monitoring plan D11 ofcompany 2, emissions D12 at the time of raw material procurement, emissions D13 at the time of production, and emissions D14 at the time of product transportation and usage, which are basis data D1 for calculating the total CO2 emissions, are used. Note that, here, instead of using a meter or the like to directly measure the CO2 in the air, the CO2 in the air may be determined by multiplying an "activity amount", which is used in economic statistics such as usage of gasoline, electricity, gas, and the like, by an "emission coefficient". The CO2 in the air can be determined as CO2 emissions = activity amount (production amount, usage amount, incineration amount, or the like) × emission coefficient. - Next, a total soil carbon
amount calculation unit 12 in the environmental impact evaluationindex calculation system 1 calculates the total soil carbon amount in the target area and an increase or decrease of the total soil carbon amount. A carbon absorptioncapacity estimation processor 13 estimates the carbon absorption capacity of the target area. The target area here is assumed to be on site atcompany 2. Note that, in the processing by the total soil carbonamount calculation unit 12 and the carbon absorptioncapacity estimation processor 13, a soilcarbon cycle model 12M inFig. 2 is used. The soilcarbon cycle model 12M is configured based on the RothC model. - In the soil
carbon cycle model 12M ofFig. 2 , the total soil carbon amount D41 and the CO2 emissions D42 are calculated for a sampling area A1, for example, of a region A managed by the company. In thismodel 12M, as the regional data D22 in the region, the weather data D22a, the environmental data D22b, and the land use data D22c are inputted, and the total soil carbon amount D41 and the CO2 emissions D42 are estimated. Here, modeling is performed for each area A1 divided into vegetation and soil features. The weather data D22a is a precipitation amount, a temperature, and humidity, and the environmental data corresponds to soil characteristics, vegetation data, and the like. The land use data D22c includes data on organic matter such as plants for each area. - Note that the soil
carbon cycle model 12M, which is based on the RothC model, is obtained by defining a plurality of states of organic matter for soil-carbon decomposition and accumulation processes, and modeling temporal changes between the states. -
Fig. 3A defines a plurality of states of underground organic matter, and the underground organic matter are accordingly defined by being divided into a readily-decomposable plant residue 51 (composed of the total number of microorganisms and humus) in which decomposition proceeds relatively quickly, a hardly-decomposable plant residue 52 (composed of the total number of microorganisms and humus) in which decomposition proceeds relatively slowly, and aninactive fraction 53 in which decomposition barely advances. Note that the ratio of underground organic matter for each of the divided areas A is determined from soil measurement data. - In
Fig. 3b , the horizontal axis represents time, and the vertical axis represents CO2 emissions. This drawing illustrates that the readily-decomposable plant residue 51, which decomposes quickly, is initially responsible for CO2 emissions, whereupon the hardly-decomposable plant residue 52, which decomposes slowly, is responsible for CO2 emissions, and that theinactive fraction 53 does not contribute to CO2 emissions. This decomposition means that CO2 emissions at an appropriate point in time inFig. 3b are determined, and at the same time, means that the carbon absorption capacity in this area is determined chronologically by the carbon absorptioncapacity estimation processor 13 by using the soilcarbon cycle model 12M. - Next, the
estimation processor 14 of the environmental impact on the downstream region in the environmental impact evaluationindex calculation system 1 uses theriver simulator 14M to estimate the environmental impact on the downstream region of the target area. Theriver simulator 14M is configured based on a Sail & Water assessment tool (SWAT) model of a material circulation model in a target basin. Note that, in the SWAT model, a GIS interface is mounted, and dynamic processes such as water circulation, soil erosion, nutrient salt, agricultural chemicals, microorganisms, and the like in a water collection area are reproduced and predicted. -
Fig. 4 is a diagram to illustrate processing by theriver simulator 14M. Theriver simulator 14M executes processing in three stages. In a first stage 14M1 for preparatory purposes, a river region is designated which includes, as analysis areas, a company site and a downstream region of a surrounding river. Data necessary for analysis by theriver simulator 14M is also acquired. These data are the weather data D22a, the environmental data D22b, the elevation topography data D31, and the land use data D22b. Among such data, the weather data D22a includes a precipitation amount, temperature, and humidity data, and the environmental data D22b corresponds to soil characteristics, vegetation data, and the like. - In a second stage 14M2, the river flow is modeled using the SWAT model using the elevation topography data D31, the river data D32, and the weather data D22a, and the circulation of matter is estimated based on the river flow and reactions in the soil. Although the description of the processing content of the SWAT model illustrated in the second stage 14M2 of
Fig. 4 is omitted, in short, the impact of the soil environment on the site of the company on the surrounding area over time due to the impact of the surrounding river is estimated and calculated chronologically. In a third stage 14M3, the environmental impact is visualized to enable a time-series display on a map. - Returning to
Fig. 1 , the estimation processor 17 for estimating the carbon absorption capacity including the downstream region estimates how the carbon absorption capacities in the target area (on the company site) and the downstream region have been changed by the impact of the carbon absorption capacity on the company site by using the carbon absorption capacity at the company site as determined by the processing of the carbon absorptioncapacity estimation processor 13 and the estimation processing results of the environmental impact determined by the environmentalimpact estimation processor 14 on the downstream region. - Through the above processing, the CO2 emission storage
amount calculation unit 15 inFig. 1 determines the CO2 emission storage amount that has already been emitted as the sum of the output of the totalemissions calculation processor 11 and the output of the total soil carbonamount calculation unit 12. The former output is the amount of CO2 emitted through business activities, and the latter output is the amount of CO2 emitted by the soil on the site. In contrast, the storage amount serving as the discharge reserve (scheduled for discharge in the near future) is determined from the output of the estimation processor 17 for estimating the carbon absorption capacity including the downstream region. Estimating the carbon absorption capacity means determining how much CO2 has accumulated without being discharged. - An environmental impact index calculation unit 16 (
Fig. 1 ) acquires information such as the CO2 emissions and the reserve amount (storage amount) thereof from the CO2 emission storageamount calculation unit 15, and also the degree of impact, on the downstream region, of the environmental impact downstream of theestimation processor 14, and externally presents data corresponding to these pieces of information. - In response to this data, the investor 3 examines prospective investment recipients by referring to the environmental impact index of each
company 2. On the other hand, on the basis of the results of estimating the environmental impact index for each area, thecompany 2 implements thesoil enhancement measure 2a starting with highly effective areas. As a result, along with an increase in the environmental impact index due to thesoil enhancement measure 2a, a cycle is created where thecompany 2 yields a profit from the investor 3 by creating absorption credits and an additional investment by improving the CO2 emission storage amount. - Next, a specific processing example to which the present invention is applied will be described using numerical values, and with reference to
Fig. 5 . First,Fig. 5 is presented in three stages, where an upper stage represents the first year, a middle stage represents the following year, and a lower stage represents an evaluation index for the following year. For the data of each year, the processing results of the totalemissions calculation processor 11, the processing results of the total soil carbonamount calculation unit 12, and the environmental impact estimation processing results determined by theestimation processor 14 regarding the environmental impact on the downstream region are indicated by specific numerical values. - The case of a bread factory will now be described using the example of
Fig. 5 . In this bread factory, it was assumed that the CO2 emissions in the first year determined by the processing results of the totalemissions calculation processor 11 was 1t, as illustrated in the upper stage. Furthermore, measuring the carbon amount of soil sampled in the target area at the time of raw material procurement yielded a result of 0.02 kg/m2. In a case where the surface area of the target area is 10,000 m2, the total carbon amount, which is the processing result of the total soil carbonamount calculation unit 12, is then 0.2t. Thesoil enhancement measure 2a was assumed to involve changing the land at the time of raw material procurement from chemical fertilizer to compost in order to increase the soil carbon amount. - In contrast, in the same bread factory, the CO2 emissions in the following year determined from the processing results by the total
emissions calculation processor 11 were assumed to be 1.1t, as illustrated in the middle stage. In addition, measuring the carbon amount of soil sampled in the land at the time of raw material procurement yielded a result of 0.06 kg/m2. In a case where the surface area of the target area is 10,000 m2, the total carbon amount is then 0.6t. - At this time, when the difference in total carbon amount between the first year and the following year is calculated, the following year evaluation index in the lower stage is then 0.4t. In addition, the difference between the CO2 emissions in the first year and the CO2 emissions in the following year is 1.1t -0.4t = 0.7t, which is taken as the CO2 emission storage amount in the present environmental impact evaluation index calculation system including the absorption amount.
- Furthermore, due to the effect of changing the target area from chemical fertilizer to compost in order to increase the soil carbon amount at the time of raw material procurement, the environmental impact on the downstream region (nitrogen phosphorus load) determined by the
estimation processor 14 for the environmental impact on the downstream region was reduced from 20 kg/ha to 10 kg/ha. Therefore, the rate of change from the first year to the following year is 0.5. Finally, by multiplying the difference 0.7t of the CO2 emissions by the rate of change 0.5 from the first year to the following year of the environmental impact, the environmental impact index is then 0.35. - Next, although not illustrated, a case of construction of a new factory for the same bread factory as in
Fig. 5 will be described. In this case, when the carbon amount was measured from a soil sample D21 at the scheduled construction site by using the combustion oxidation method, and the total carbon amount D41 of the scheduled construction site was estimated from the topography and vegetation data, taking into account the fact that the total carbon amount D41 was 0.5t and that the pavement area of the factory construction site was 80%, the carbon absorption loss D42 was 0.4t. - In addition, the energy of the factory utilizes gas and system power, and the amount of emission of the factory was 1t in the light of the basic units determined from the processing results of the total
emissions calculation processor 11, and the CO2 emission storage amount determined by the CO2 emission storageamount calculation unit 15 including the carbon absorption loss D42 was evaluated as 1.4t. - In contrast, the environmental impact (nitrogen phosphorus load) on the downstream region before the factory construction determined by the
estimation processor 14 of the environmental impact on the downstream region was 10 kg/ha, and the environmental impact (nitrogen phosphorus load) on the downstream region after the construction was 30 kg/ha. In this case, the rate of change in environmental impact on the downstream region is 3. - In this case, the environmental impact index determined by the environmental impact
index calculation unit 16 is 1.4 (CO2 emission storage amount) × 3 (rate of change in environmental impact on the lower region) = 4.2, and the environmental impact index is evaluated as 4.2. - Furthermore, although not illustrated, a case where solar power construction is performed for the same bread factory as in
Fig. 5 will be described. In this case, the carbon amount was measured from a soil sample at the scheduled construction site by using the combustion oxidation method, and the total carbon amount D41 of the scheduled construction site was estimated from the topography and vegetation data. As a result, the total carbon amount D41 was 0.2t. - When the soil sample was re-measured one year after the solar installation and the start of power generation (carbon neutral), the total carbon amount was 0.18t, and when the soil sample was re-measured 2 years after the start of power generation, the total carbon amount was 0.16t. At this time, the CO2 emission storage amount was re-evaluated as 0.02t after one year and 0.04 after 2 years.
- In contrast, it was assumed that the environmental impact (nitrogen phosphorus load) on the downstream region before the solar installation, which was determined by the
estimation processor 14, on the downstream region was 10 kg/ha, the environmental impact (nitrogen phosphorus load) on the downstream region one year after the solar installation was 14 kg/ha, and the environmental impact (nitrogen phosphorus load) on the downstream region after two years was 20 kg/ha. In this case, the rate of change in environmental impact on the downstream region was 1.4 after one year and 2 after two years. - In this case, the environmental impact index determined by the environmental impact
index calculation unit 16 was evaluated such that the environmental impact index after one year was 0.028 and the environmental impact index after two years was 0.08. - The above-described embodiment of the present invention enables not only emissions, but also an absorption amount, to be used together, and also enables the environmental impact on the surroundings to be expressed as an index to facilitate an investment decision, thus enabling an evaluation of the overall environmental impact to be performed.
- The first embodiment presents the present invention with a focus on the data to be handled and the processing functions, whereas the second embodiment presents the basic premise behind the present invention.
-
Fig. 6 is a diagram illustrating the basic premise behind the present invention. Here, as a premise, changes inland use 61 occur in a target area such as a company site, andsoil sampling 62 andmeasurement 63 are performed. Note that, as described in the case of the first embodiment, changes inland use 61 are thesoil enhancement measure 2a, a fertilizer change, new factory construction, and solar power construction. - In the present invention, estimation using two types of models (hereinafter, referred to as models including a simulator) is performed for the changes in
land use 61. Thefirst model 64 estimates the carbon emission storage amount, and although, conventionally, only the carbon emission storage amount in the target area is estimated, in the present invention, the carbon emission storage amount in the area including the downstream area of the river is estimated. That is, for a target area such as a company site which is a soil nutrient source, the model application range is set to include a downstream region thereof. According to thefirst model 64, calculation can be performed including anSOC amount 65 including the downstream region, and upon receipt of the result, theCO2 reduction amount 66 is set as anindex 1. - A second model of the present invention involves applying a
river simulator 67 to calculate, along the river, soil nutrient sources including flow rate, nitrogen, and phosphorus. This estimation result is used as anindex 2 for theenvironmental impact 62 on the downstream region. - Finally, a composite index, which is the product of
index 1 andindex 2, is defined as an environmental impact index. - The basic premise behind the second embodiment will be summarized as follows. First, the evaluation area covers not only the area of activity but also the downstream region affected by the area of activity. By adding a river simulator at this time, not only the SOC amount in the area of activity is ascertained, but also the distribution of nitrogen and phosphorus in the downstream region is checked to obtain an environmental evaluation index. The environmental evaluation index is a composite evaluation index in which CO2 emissions and a downstream environmental impact are combined in a composite manner.
Claims (6)
- An environmental impact evaluation index calculation system that determines, as an index, an environmental impact of a company on a social environment, the environmental impact evaluation index calculation system determining a CO2 emission storage amount from total CO2 emissions emitted from within a company facility, a total soil carbon amount and a carbon absorption capacity within the company facility estimated using a soil carbon cycle model, and a carbon absorption capacity in a downstream region within the company facility estimated using a river simulator, and setting the CO2 emission storage amount as a first environmental impact index.
- The environmental impact evaluation index calculation system according to claim 1, wherein the river simulator estimates, calculates and quantifies the impact, on the surrounding region via a river, of the soil environment within the company facility, and sets the impact as a second environmental impact index.
- The environmental impact evaluation index calculation system according to claim 2, wherein a third environmental impact index from a first environmental impact index and a second environmental impact index is obtained.
- The environmental impact evaluation index calculation system according to claim 1, wherein the total CO2 emissions emitted from within the company facility are determined from an environmental management/monitoring plan of the company, emissions at a time of raw material procurement, emissions at a time of production, and emissions at a time of product transportation and usage.
- The environmental impact evaluation index calculation system according to claim 1, wherein the soil carbon cycle model is obtained by defining a plurality of states of organic matter for soil-carbon decomposition and accumulation processes, and modeling temporal changes between the states.
- A method for using an environmental impact evaluation index calculation system that employs the environmental impact evaluation index calculation system according to any one of claims 1 to 5, whereinthe environmental impact index is presented to investors, andthe company provides, to the environmental impact evaluation index calculation system, calculation basis data of total CO2 emissions emitted from within a company facility and data on soil within the company facility.
Applications Claiming Priority (1)
| Application Number | Priority Date | Filing Date | Title |
|---|---|---|---|
| JP2023123216A JP2025019554A (en) | 2023-07-28 | 2023-07-28 | Environmental impact assessment index calculation system and method of using the environmental impact assessment index calculation system |
Publications (1)
| Publication Number | Publication Date |
|---|---|
| EP4498302A1 true EP4498302A1 (en) | 2025-01-29 |
Family
ID=91961730
Family Applications (1)
| Application Number | Title | Priority Date | Filing Date |
|---|---|---|---|
| EP24190085.1A Pending EP4498302A1 (en) | 2023-07-28 | 2024-07-22 | Environmental impact evaluation index calculation system and method for using environmental impact evaluation index calculation system |
Country Status (2)
| Country | Link |
|---|---|
| EP (1) | EP4498302A1 (en) |
| JP (1) | JP2025019554A (en) |
Cited By (1)
| Publication number | Priority date | Publication date | Assignee | Title |
|---|---|---|---|---|
| CN120851387A (en) * | 2025-09-18 | 2025-10-28 | 吉林建筑大学 | Carbon emission assessment method and system for cold-region cities based on big data fusion |
Citations (2)
| Publication number | Priority date | Publication date | Assignee | Title |
|---|---|---|---|---|
| US20220124963A1 (en) * | 2020-10-26 | 2022-04-28 | Arizona Board Of Regents On Behalf Of Arizona State University | Systems, methods, and apparatuses for implementing automated data modeling and scaling of a soil health data fabric |
| JP2022153012A (en) | 2021-03-29 | 2022-10-12 | 株式会社フジタ | Carbon storage agriculture evaluation system, and method of providing carbon storage agriculture evaluation information |
-
2023
- 2023-07-28 JP JP2023123216A patent/JP2025019554A/en active Pending
-
2024
- 2024-07-22 EP EP24190085.1A patent/EP4498302A1/en active Pending
Patent Citations (2)
| Publication number | Priority date | Publication date | Assignee | Title |
|---|---|---|---|---|
| US20220124963A1 (en) * | 2020-10-26 | 2022-04-28 | Arizona Board Of Regents On Behalf Of Arizona State University | Systems, methods, and apparatuses for implementing automated data modeling and scaling of a soil health data fabric |
| JP2022153012A (en) | 2021-03-29 | 2022-10-12 | 株式会社フジタ | Carbon storage agriculture evaluation system, and method of providing carbon storage agriculture evaluation information |
Non-Patent Citations (2)
| Title |
|---|
| DU XINZHONG ET AL: "Hydro-climate and biogeochemical processes control watershed organic carbon inflows: Development of an in-stream organic carbon module coupled with a process-based hydrologic model", SCIENCE OF THE TOTAL ENVIRONMENT, ELSEVIER, AMSTERDAM, NL, vol. 718, 13 February 2020 (2020-02-13), XP086136141, ISSN: 0048-9697, [retrieved on 20200213], DOI: 10.1016/J.SCITOTENV.2020.137281 * |
| ZHAO FUBO ET AL: "Predicting the climate change impacts on water-carbon coupling cycles for a loess hilly-gully watershed", JOURNAL OF HYDROLOGY, ELSEVIER, AMSTERDAM, NL, vol. 581, 30 November 2019 (2019-11-30), XP085987041, ISSN: 0022-1694, [retrieved on 20191130], DOI: 10.1016/J.JHYDROL.2019.124388 * |
Cited By (1)
| Publication number | Priority date | Publication date | Assignee | Title |
|---|---|---|---|---|
| CN120851387A (en) * | 2025-09-18 | 2025-10-28 | 吉林建筑大学 | Carbon emission assessment method and system for cold-region cities based on big data fusion |
Also Published As
| Publication number | Publication date |
|---|---|
| JP2025019554A (en) | 2025-02-07 |
Similar Documents
| Publication | Publication Date | Title |
|---|---|---|
| Trolle et al. | Effects of changes in land use and climate on aquatic ecosystems: Coupling of models and decomposition of uncertainties | |
| Cui et al. | Spatial and temporal analysis of carbon sources and sinks through land use/cover changes in the Beijing-Tianjin-Hebei urban agglomeration region | |
| Lamastra et al. | A novel fuzzy expert system to assess the sustainability of the viticulture at the wine-estate scale | |
| Huang et al. | Simulated town expansion under ecological constraints: A case study of Zhangbei County, Heibei Province, China | |
| Strano et al. | Economic and environmental sustainability assessment of wine grape production scenarios in Southern Italy | |
| Forsius et al. | Modelling impacts of forest bioenergy use on ecosystem sustainability: Lammi LTER region, southern Finland | |
| CN118154358A (en) | An intelligent water resources management system | |
| Wang et al. | IA-SDSS: A GIS-based land use decision support system with consideration of carbon sequestration | |
| Kim et al. | AI-Enhanced Precision Irrigation in Legume Farming: Optimizing Water Use Efficiency. | |
| CN116011848A (en) | A method for calculating the value of cultivated land resource assets | |
| CN118246817A (en) | A method, system, device and storage medium for assessing carbon footprint of crops | |
| CN119863156A (en) | Regional ecosystem carbon sink function evaluation system | |
| Nia et al. | Optimization of energy use efficiency and environmental assessment in soybean and peanut farming using the imperialist competitive algorithm | |
| CN117217632A (en) | Model estimation-based farmland carbon flux assessment method | |
| JP2025019554A (en) | Environmental impact assessment index calculation system and method of using the environmental impact assessment index calculation system | |
| CN119903988B (en) | A method and device for evaluating farmland soil remediation technology | |
| Jahangirpour et al. | Cropping pattern optimization in the context of climate-smart agriculture: A case study for Doroodzan irrigation network-iran | |
| CN114926040A (en) | Comprehensive evaluation method and system for natural capital of drainage basin and electronic equipment | |
| CN119475208A (en) | An ecological carbon sink calculation and estimation data fusion platform for the thermal power industry | |
| Denier Van Der Gon et al. | Combining upscaling and downscaling of methane emissions from rice fields: methodologies and preliminary results | |
| CN118153999A (en) | A method and related device for evaluating the ecological service function of water resources in a river basin | |
| CN118411082A (en) | Evaluation method and device for coordinated development of photovoltaic power generation system and ecological environment | |
| Yahaya et al. | Analysis of Fine and Coarse Particle Number Count Concentrations Using Boosted Regression Tree Technique in Coastal Environment. | |
| LU602031B1 (en) | Groundwater sustainability assessment method, device, computer apparatus, storage medium | |
| CN121329000B (en) | Intelligent monitoring and evaluating method and system for black land ecological environment |
Legal Events
| Date | Code | Title | Description |
|---|---|---|---|
| PUAI | Public reference made under article 153(3) epc to a published international application that has entered the european phase |
Free format text: ORIGINAL CODE: 0009012 |
|
| STAA | Information on the status of an ep patent application or granted ep patent |
Free format text: STATUS: REQUEST FOR EXAMINATION WAS MADE |
|
| 17P | Request for examination filed |
Effective date: 20240816 |
|
| AK | Designated contracting states |
Kind code of ref document: A1 Designated state(s): AL AT BE BG CH CY CZ DE DK EE ES FI FR GB GR HR HU IE IS IT LI LT LU LV MC ME MK MT NL NO PL PT RO RS SE SI SK SM TR |