EP4498047A1 - A computer-implemented method for monitoring an electrical switching component immersed in a liquid - Google Patents
A computer-implemented method for monitoring an electrical switching component immersed in a liquid Download PDFInfo
- Publication number
- EP4498047A1 EP4498047A1 EP23188120.2A EP23188120A EP4498047A1 EP 4498047 A1 EP4498047 A1 EP 4498047A1 EP 23188120 A EP23188120 A EP 23188120A EP 4498047 A1 EP4498047 A1 EP 4498047A1
- Authority
- EP
- European Patent Office
- Prior art keywords
- smoothed curve
- time
- peak
- computer
- vibration
- Prior art date
- Legal status (The legal status is an assumption and is not a legal conclusion. Google has not performed a legal analysis and makes no representation as to the accuracy of the status listed.)
- Granted
Links
Images




Classifications
-
- G—PHYSICS
- G01—MEASURING; TESTING
- G01H—MEASUREMENT OF MECHANICAL VIBRATIONS OR ULTRASONIC, SONIC OR INFRASONIC WAVES
- G01H1/00—Measuring characteristics of vibrations in solids by using direct conduction to the detector
-
- G—PHYSICS
- G01—MEASURING; TESTING
- G01R—MEASURING ELECTRIC VARIABLES; MEASURING MAGNETIC VARIABLES
- G01R31/00—Arrangements for testing electric properties; Arrangements for locating electric faults; Arrangements for electrical testing characterised by what is being tested not provided for elsewhere
- G01R31/327—Testing of circuit interrupters, switches or circuit-breakers
- G01R31/3271—Testing of circuit interrupters, switches or circuit-breakers of high voltage or medium voltage devices
- G01R31/3275—Fault detection or status indication
-
- G—PHYSICS
- G01—MEASURING; TESTING
- G01R—MEASURING ELECTRIC VARIABLES; MEASURING MAGNETIC VARIABLES
- G01R31/00—Arrangements for testing electric properties; Arrangements for locating electric faults; Arrangements for electrical testing characterised by what is being tested not provided for elsewhere
- G01R31/50—Testing of electric apparatus, lines, cables or components for short-circuits, continuity, leakage current or incorrect line connections
- G01R31/62—Testing of transformers
-
- H—ELECTRICITY
- H01—ELECTRIC ELEMENTS
- H01H—ELECTRIC SWITCHES; RELAYS; SELECTORS; EMERGENCY PROTECTIVE DEVICES
- H01H9/00—Details of switching devices, not covered by groups H01H1/00 - H01H7/00
- H01H9/0005—Tap change devices
- H01H2009/0061—Monitoring tap change switching devices
Definitions
- the present invention relates to automated monitoring of an electrical switching component immersed in a liquid in a container of an electrical device comprising a transformer or an on-load tap changer (OLTC).
- OLTC on-load tap changer
- On-load tap changers are used with power transformers and regulate their voltage under load, i.e., without interrupting the power supply to consumers.
- Switching time (total and partial) of the operation sequence of a tap changer is one of the most important parameters that can be associated with various health issues inside a tap changer.
- a normal switching time of the OLTC can be measured at production of the OLTC or established using historical measurement in use, as further elaborated below. In use, the actual switching time can be measured by methods like pressure pulse analysis or vibration signal analysis. By monitoring the switching time, i.e. the measured switching time in use, and comparing it to the normal switching time, a deviation time may be determined to be the difference between the actual switching time and the normal switching time. If the deviation time is too large, there is probably something wrong with the OLTC, and action should be taken, such as scheduling maintenance work.
- the deviation time may be monitored and compared to a predetermined deviation criterion, such as a predetermined time or a predetermined percentage of the normal switching time.
- a predetermined deviation criterion such as a predetermined time or a predetermined percentage of the normal switching time.
- a transformer or an on-load tap changer may be provided with an electrical switching component immersed in a liquid in a container.
- the electrical switching component may be a tap changer or some other switching device.
- the switching component comprises movable mechanical components, such as one or more electrical contact elements. When the mechanical components move and/or make contact, vibrations form around the switching component. For a fully functional switch, the vibrations emitted at each movement of a switching sequence follows a specific pattern governed by the design of the switching component, and external factors, such ambient temperature. In other words, the vibration pattern is predictable for a fully functional electrical switching component.
- one or more deviations from the specific pattern may be detected.
- a certain amount of deviation is normal but abnormal deviations are typically associated with some malfunction or wear of the electrical switching component.
- the environment in use around a switching component may present various sources of vibrations making it difficult to study the vibrations emitted by the switching component, and hence more difficult to monitor the function of the electrical switching component using vibration analysis.
- An object of the invention is to provide a robust method for monitoring an electrical switching component immersed in a liquid in a container.
- a further object is to enable robust monitoring of both total switching time and partial switching time, i.e. the time it takes to perform a full switching sequence, and one or more sub-portions of the switching sequence.
- the computer-implemented method is suitable for monitoring an electrical switching component immersed in a liquid in a container of an electrical device comprising a transformer or an on-load tap changer (OLTC).
- the method comprises, by a processing circuitry of a computer system:
- the vibration signature model is typically pre-determined in a lab using measurements on a fully functional electrical switching device.
- the vibration signature model could be determined using machine-learning on a fully functional electrical switching device.
- the claimed computer-implemented method comprises obtaining the vibration signal model and is not limited to how the vibration signature model as such is determined.
- the vibration signal is obtained and then used to compare make a comparison between information derivable from the vibration signal recording and a vibration signature of the vibration signature model.
- the first smoothed curve with a higher smoothing level i.e. less detailed curve
- the second smoothed curve, which is more detailed than the first smoothed curve is studied. Specifically, only the selected extent in time of the second smoothed curve is studied and peaks of the second smoothed curve outside the selected extent in time are not included in the comparison of the sub-portion of the switching sequence compares to the corresponding sub-portion of the switching sequence of the signature model.
- This approach improves the method's ability to correctly match information derivable from the vibration signal recording to corresponding information of the vibration signature since a bigger picture is established first, using the first smoothed curve, thus absorbing influence from noise or abnormal data such as missing peaks or additional peaks of the vibration signal recording.
- the risk of comparing one or more specific peaks of the more detailed curve to wrong peak(s) of the vibration signature model decreases.
- the peaks of the first smoothed curve are referred to as global peaks and the peaks of the second smoothed curve are referred to as local peaks.
- the selection of an extent in time of a peak of the first smoothed curve may be performed in any suitable way.
- the extent in time of a peak of the first smoothed curve may be from a start time of the peak of the first smoothed curve to a start time of a subsequent peak or, if no subsequent peak is present in the first smoothed curve, to the end of the first smoothed curve, or to a time being offset a predetermined time after the start time of the last peak of the first smoothed curve.
- the start time may be determined to be the time when the first smoothed curve reaches a minimum absolute value between the peak and a preceding peak of the first smoothed curve, or reaches a predetermined threshold level, whichever occurs closer in time to the time of a maximum absolute value of the peak.
- the example curves illustrated in the figures are derived such that they measure strength of vibration as a one-sided curve on a positive side of the Y-axis of the graph, i.e. with positive values.
- the curves could be derived such that they are one-sided on the negative side of the Y-axis, such that the signal strength is measured in negative terms.
- the method looks at the absolute value of the vibration strength indicated by the respective curve.
- Said comparing of one or more peaks of the selected portion the second smoothed curve to one or more peaks of a corresponding portion of the vibration signature may comprise comparing a maximum absolute value and/or a duration of one or more peaks of the selected portion of the second smoothed curve to a maximum absolute value and/or duration of one or more corresponding peaks of a corresponding portion of the vibration signature.
- Any suitable implantation of the signature model may be used and preferably enables identification of a peak of the second smoothed curve using at least information from the first smoothed curve, such as information pertaining to which peak of the first smooth curve a peak of the second smoothed curve belongs to.
- This enables classification of the peaks of the second smoothed curve for improved identification of which portion of the switching sequence the specific peak of the second smoothed curve belongs to.
- Deviations may be studied in terms of extent of time of one or more peaks of the second smoothed curve, and/or in terms of maximum absolute value of a specific peak of the second smoothed curve.
- a specific peak may be studied, or a group of peaks may be jointly studied to a reference peak or group of peaks.
- a total switching time may be studied for a group of all peaks of the second smoothed curve.
- the switching time model may comprise information for discarding initial peaks of the first or second smoothed curves not of interest for monitoring purposes.
- the duration may be calculated as the extent in time from a start time of a peak of the second smoothed curve to a start time of a subsequent peak of the second smoothed curve, or, if no subsequent peak is present in the second smoothed curve, to the end of the second smoothed curve, or to a time being offset a predetermined time after the start time of the peak.
- the deviation status may be determined to be a normal status in response to said deviation being within a predetermined deviation range or below a predetermined deviation threshold, and/or the deviation status may be determined to be an error status in response to said deviation being outside said predetermined deviation range or exceeding said predetermined deviation threshold.
- the monitoring may be based on continuously providing/receiving an OK status, such that an omission of provision of said OK status indirectly means that something is not OK with the electrical switching component.
- the monitoring may be based on providing a status indicating something is not OK when such status is determined, wherein the existence of the provision of such a status means that something is not OK with the electrical switching component.
- a low-pass filter may be applied to the vibration signal when determining the first and second smoothed curves.
- the low-pass filter may have a cut-off frequency of 0.5 - 1 kHz.
- the first smoothed curve may be determined using a root mean square smoothing with a moving time window in the range of 5-10 milliseconds.
- the second smooth curve may be determined using a root mean square smoothing with a moving time window smaller than the moving time window used for determining the first smoothed curve.
- the object is also achieved by an electrical device according to claim 11, with alternative embodiments presented in the dependent claims.
- the electrical device comprises a transformer or an on-load tap changer (OLTC), and: a container, an electrical switching component immersed in a liquid in the container, a vibration sensor configured to measure vibrations of the container, and a computer system comprising a processing circuitry configured to perform the computer-implemented method described above.
- OLTC on-load tap changer
- Fig. 1 shows an example of an electrical device 10 in the form of a transformer assembly 10 provided with an on-load tap changer 12.
- the on-load tap changer 12 comprises an electrical switching component 1 in the form of a diverter switch.
- the on-load tap changer 12 comprises two separate sections.
- the two separate sections are the diverter switch 1, which generally may be in its own housing separate from the transformer housing 16, and a tap selector 18.
- the tap selector 18, which is mounted beneath the diverter switch 1, consists of a fine tap selector and usually a change-over selector. In the example illustrated in Figure 1 , there are two diverter switches 1 and three tap selectors.
- Power to operate the tap-changer 12 is supplied from the motor drive mechanism 20, which is typically mounted on the outside of the transformer 10.
- the power is transmitted by means of shafts 22, 24, and bevel gears 26, which turn the tap selector 18 from tap to tap.
- the transformer assembly 10 is provided with a vibration sensor 4 configured to measure vibrations of the container 2.
- a computer system 700 is provided, said computer system 700 comprising a processing circuitry 702 configured to perform a computer-implemented method M for monitoring of the electrical switching component 1.
- any other electrical switching component 1 immersed in a liquid in a container 2 could alternatively be monitored.
- the computer-implemented method M is suitable for monitoring an electrical switching component 1 immersed in a liquid in a container 2 of an electrical device comprising a transformer or an on-load tap changer (OLTC) 3. As shown in fig. 6 , the method M comprises at least, by a processing circuitry 4 of a computer system 5:
- Fig. 2 shows an example of a graphical plot of a vibration signal recording.
- Fig. 3 shows the first C1 and second C2 smoothed curves, and maximum absolute values marked for the peaks of the first C1 and second C2 smoothed curves.
- the envelope for both curves C1, C2 are derived such that the curves are one-sided using Hilbert transform or any other suitable method.
- fig. 3 shows markings for start times of the peaks of the second smoothed curve C2. It is evident that the lower level of smoothing of the second smoothed curve provides a curve with more details than the first smoothed curve C1.
- any suitable level of smoothing may be applied when determining the first C1 and second C2 smoothed curves.
- smoothing has been made using root mean square smoothing with a moving time window of 6 ms for the first smoothed curve C1, and a moving window of 1 ms for the second smoothed curve C2.
- other values for the moving window may alternatively be used instead, as long as the second smoothed curve C2 is determined using a root mean square smoothing with a moving time window smaller than the moving time window used for determining the first smoothed curve C1.
- the first smoothed curve C1 is determined using a root mean square smoothing with a moving time window in the range of 5-10 ms.
- the extent in time of a peak may be chosen according to any suitable method, as long as the same method is used both when deriving the vibration signature and when comparing the vibration recording against the signature model.
- the first smoothed curve C1 is from a start time of the peak P1 of the first smoothed curve C1 to a start time of a subsequent peak or, if no subsequent peak is present in the first smoothed curve C1, to the end of the first smoothed curve C1, or to a time being offset a predetermined time after the start time of the last peak P1 of the first smoothed curve C1.
- start time may be chosen according to any suitable method, as long as the same method is used both when deriving the vibration signature and when comparing the vibration recording against the signature model.
- the start time is determined to be the time when the first smoothed curve C1 reaches a minimum absolute value between the peak P1 and a preceding peak of the first smoothed curve C1, or reaches a predetermined threshold level L, whichever occurs closer in time to the time of a maximum absolute value of the peak.
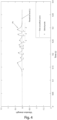
- Fig. 4 shows a graphical plot of the first smoothed curve, along with indications under the horizontal axis indicating some of the extents in time determined using information from the peaks of the first smoothed curve.
- Fig. 5 shows a graphical plot of the second smoothed curve, along with some of the time portions selected using the extents in time identified with information from the peaks of the first smoothed curve.
- peaks of the second smoothed curve are associated with the switching sub-sequence indicated by a respective peak of the first smoothed curve.
- the comparing of one or more peaks of the selected portion the second smoothed curve C2 to the one or more peaks of a corresponding portion of the vibration signature comprises comparing a maximum absolute value and/or a duration of one or more peaks of the selected portion of the second smoothed curve C2 to a maximum absolute value and/or duration of one or more corresponding peaks of a corresponding portion of the vibration signature.
- any other suitable method for achieving the comparison may alternatively be used instead.
- the duration of a peak P2 of the second smoothed curve C2 may be calculated as the extent in time from a start time of a peak P2 of the second smoothed curve C2 to a start time of a subsequent peak of the second smoothed curve C2, or, if no subsequent peak is present in the second smoothed curve C2, to the end of the second smoothed curve C2, or to a time being offset a predetermined time after the start time of the peak P2.
- the start time of a peak P2 of the second smoothed curve C2 may be determined using any suitable method.
- the start time of a peak P2 of the second smoothed curve C2 is determined to be the time when the second smoothed curve C1 reaches a predetermined threshold level which is a threshold level defined by the vibration signature for each peak P2.
- the start of the peak P2 may be found using a threshold level proportional to the maximum absolute value of the respective peak P2, or it may be the time when the curve reaches a minimum absolute value between the peak P2 and a preceding peak of the second smoothed curve C2.
- the deviation status may be determined to be a normal status in response to said deviation being within a predetermined deviation range or below a predetermined deviation threshold, and/or the deviation status is determined to be an error status in response to said deviation being outside said predetermined deviation range or exceeding said predetermined deviation threshold.
- a low-pass filter is applied to the vibration signal when determining the first and second smoothed curves.
- the low-pass filter has a cut-off frequency of 0.5 - 1 kHz but may alternatively be configured with any other suitable cut-off frequency.
- noise may alternatively be handled using any other suitable method, or not handled at all.
- the method M is used on an electrical device 10 comprising a transformer or an on-load tap changer OLTC 3.
- the electrical device 10 comprises a container 2 which may be a part of the transformer or part of the on-load tap changer, or which may be a container separate from the transformer or the OLTC. In this embodiment, the container is part of the OLTC.
- the electrical device 10 further comprises an electrical switching component 1 immersed in a liquid in the container 2, a vibration sensor 4 configured to measure vibrations of the container 2, and a computer system 700 comprising a processing circuitry 702 configured to perform the above-described computer-implemented method M.
- the vibration sensor 4 is attached to the container 2 but in other embodiments it may be attached anywhere it is able to sense vibrations associated with the movements of the mechanical members of the switching component 1.
- the sensor 4 may be any suitable type of vibration sensor.
- the vibration sensor may be an optical sensor configured to measure vibration of the container 2 using light reflected by the container 2 to the optical sensor.
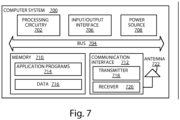
- FIG. 7 shows a computer system 700 in accordance with some embodiments.
- a computer system 700 refers to a device or system capable, configured, arranged and/or operable to communicate with network nodes and/or other computer systems.
- Examples of a computer system include, but are not limited to, a smart phone, mobile phone, cell phone, desktop computer, personal digital assistant (PDA), wearable terminal device, wireless endpoint, tablet, laptop, laptop-embedded equipment (LEE), laptop-mounted equipment (LME), smart device, wireless customer-premise equipment (CPE), etc.
- PDA personal digital assistant
- LOE laptop-embedded equipment
- LME laptop-mounted equipment
- CPE wireless customer-premise equipment
- a computer system may support device-to-device (D2D) communication, for example by implementing a electrical switching 3GPP standard for sidelink communication, Dedicated Short-Range Communication (DSRC), vehicle-to-vehicle (V2V), vehicle-to-infrastructure (V2I), or vehicle-to-everything (V2X).
- D2D device-to-device
- DSRC Dedicated Short-Range Communication
- V2V vehicle-to-vehicle
- V2I vehicle-to-infrastructure
- V2X vehicle-to-everything
- the computer system 700 includes processing circuitry 702, also referred to herein as a processor device, that is operatively coupled via a bus 704 to an input/output interface 706, a power source 708, a memory 710, a communication interface 712, and/or any other component, or any combination thereof.
- processing circuitry 702 also referred to herein as a processor device, that is operatively coupled via a bus 704 to an input/output interface 706, a power source 708, a memory 710, a communication interface 712, and/or any other component, or any combination thereof.
- Certain computer systems may utilize all or a subset of the components shown in Figure 7 . The level of integration between the components may vary from one computer system to another computer system. Further, certain computer systems may contain multiple instances of a component, such as multiple processors, memories, transceivers, transmitters, receivers, etc.
- the processing circuitry 702 is configured to process instructions and data and may be configured to implement any sequential state machine operative to execute instructions stored as machine-readable computer programs in the memory 710.
- the processing circuitry 702 may be implemented as one or more hardware-implemented state machines (e.g., in discrete logic, field-programmable gate arrays (FPGAs), application specific integrated circuits (ASICs), etc.); programmable logic together with appropriate firmware; one or more stored computer programs, general-purpose processors, such as a microprocessor or digital signal processor (DSP), together with appropriate software; or any combination of the above.
- the processing circuitry 702 may include multiple central processing units (CPUs).
- the input/output interface 706 may be configured to provide an interface or interfaces to an input device, output device, or one or more input and/or output devices.
- Examples of an output device include a speaker, a sound card, a video card, a display, a monitor, a printer, an actuator, an emitter, a smartcard, another output device, or any combination thereof.
- An input device may allow a user to capture information into the computer system 700.
- Examples of an input device include a touch-sensitive or presence-sensitive display, a camera (e.g., a digital camera, a digital video camera, a web camera, etc.), a microphone, a sensor, a mouse, a trackball, a directional pad, a trackpad, a scroll wheel, a smartcard, and the like.
- the presence-sensitive display may include a capacitive or resistive touch sensor to sense input from a user.
- a sensor may be, for instance, an accelerometer, a gyroscope, a tilt sensor, a force sensor, a magnetometer, an optical sensor, a proximity sensor, a biometric sensor, etc., or any combination thereof.
- An output device may use the same type of interface port as an input device. For example, a Universal Serial Bus (USB) port may be used to provide an input device and an output device.
- USB Universal Serial Bus
- the power source 708 is structured as a battery or battery pack. Other types of power sources, such as an external power source (e.g., an electricity outlet), photovoltaic device, or power cell, may be used.
- the power source 708 may further include power circuitry for delivering power from the power source 708 itself, and/or an external power source, to the various parts of the computer system 700 via input circuitry or an interface such as an electrical power cable. Delivering power may be, for example, for charging of the power source 708.
- Power circuitry may perform any formatting, converting, or other modification to the power from the power source 708 to make the power suitable for the respective components of the computer system 700 to which power is supplied.
- the memory 710 may be or be configured to include memory such as random access memory (RAM), read-only memory (ROM), programmable read-only memory (PROM), erasable programmable read-only memory (EPROM), electrically erasable programmable read-only memory (EEPROM), magnetic disks, optical disks, hard disks, removable cartridges, flash drives, and so forth.
- the memory 710 includes one or more application programs 714, such as an operating system, web browser application, a widget, gadget engine, or other application, and corresponding data 716.
- the memory 710 may store, for use by the computer system 700, any of a variety of various operating systems or combinations of operating systems.
- the memory 710 may be configured to include a number of physical drive units, such as redundant array of independent disks (RAID), flash memory, USB flash drive, external hard disk drive, thumb drive, pen drive, key drive, high-density digital versatile disc (HD-DVD) optical disc drive, internal hard disk drive, Blu-Ray optical disc drive, holographic digital data storage (HDDS) optical disc drive, external mini-dual in-line memory module (DIMM), synchronous dynamic random access memory (SDRAM), external micro-DIMM SDRAM, smartcard memory such as tamper resistant module in the form of a universal integrated circuit card (UICC) including one or more subscriber identity modules (SIMs), such as a USIM and/or ISIM, other memory, or any combination thereof.
- RAID redundant array of independent disks
- HD-DVD high-density digital versatile disc
- HDDS holographic digital data storage
- DIMM external mini-dual in-line memory module
- SDRAM synchronous dynamic random access memory
- SDRAM synchronous dynamic random access memory
- the UICC may for example be an embedded UICC (eUICC), integrated UICC (iUICC) or a removable UICC commonly known as 'SIM card.
- eUICC embedded UICC
- iUICC integrated UICC
- 'SIM card removable UICC commonly known as 'SIM card.
- the memory 710 may allow the computer system 700 to access instructions, application programs and the like, stored on transitory or non-transitory memory media, to off-load data, or to upload data.
- An article of manufacture, such as one utilizing a communication system may be tangibly embodied as or in the memory 710, which may be or comprise a device-readable storage medium.
- the processing circuitry 702 may be configured to communicate with an access network or other network using the communication interface 712.
- the communication interface 712 may comprise one or more communication subsystems and may include or be communicatively coupled to an antenna 722.
- the communication interface 712 may include one or more transceivers used to communicate, such as by communicating with one or more remote transceivers of another device capable of wireless communication (e.g., another computer system or a network node in an access network).
- Each transceiver may include a transmitter 718 and/or a receiver 720 appropriate to provide network communications (e.g., optical, electrical, frequency allocations, and so forth).
- the transmitter 718 and receiver 720 may be coupled to one or more antennas (e.g., antenna 722) and may share circuit components, software or firmware, or alternatively be implemented separately.
- communication functions of the communication interface 712 may include cellular communication, Wi-Fi communication, LPWAN communication, data communication, voice communication, multimedia communication, short-range communications such as Bluetooth, near-field communication, location-based communication such as the use of the global positioning system (GPS) to determine a location, another like communication function, or any combination thereof.
- GPS global positioning system
- Communications may be implemented in according to one or more communication protocols and/or standards, such as IEEE 802.11, Code Division Multiplexing Access (CDMA), Wideband Code Division Multiple Access (WCDMA), GSM, LTE, New Radio (NR), UMTS, WiMax, Ethernet, transmission control protocol/internet protocol (TCP/IP), synchronous optical networking (SONET), Asynchronous Transfer Mode (ATM), QUIC, Hypertext Transfer Protocol (HTTP), and so forth.
- CDMA Code Division Multiplexing Access
- WCDMA Wideband Code Division Multiple Access
- WCDMA Wideband Code Division Multiple Access
- GSM Global System for Mobile communications
- LTE Long Term Evolution
- NR New Radio
- UMTS Worldwide Interoperability for Microwave Access
- WiMax Ethernet
- TCP/IP transmission control protocol/internet protocol
- SONET synchronous optical networking
- ATM Asynchronous Transfer Mode
- QUIC Hypertext Transfer Protocol
- HTTP Hypertext Transfer Protocol
- a computer system may provide an output of data captured by its sensors, through its communication interface 712, via a wireless connection to a network node.
- Data captured by sensors of a computer system can be communicated through a wireless connection to a network node via another computer system.
- the output may be periodic (e.g., once every 15 minutes if it reports the sensed temperature), random (e.g., to even out the load from reporting from several sensors), in response to a triggering event (e.g., when moisture is detected an alert is sent), in response to a request (e.g., a user initiated request), or a continuous stream (e.g., a live video feed of a patient).
- a computer system comprises an actuator, a motor, or a switch, related to a communication interface configured to receive wireless input from a network node via a wireless connection. In response to the received wireless input the states of the actuator, the motor, or the switch may change.
- a computer system may represent a machine or other device that performs monitoring and/or measurements, and transmits the results of such monitoring and/or measurements to another computer system and/or a network node.
- the computer system may in this case be an M2M device, which may in a electrical switching 3GPP context be referred to as an MTC device.
- the computer system may implement the electrical switching 3GPP NB-loT standard.
- any number of computer systems may be used together with respect to a single use case.
- the first and/or the second computer system can also include more than one of the functionalities described above.
- a computer system might comprise the sensor and the actuator, and handle communication of data for both the speed sensor and the actuators.
- computing devices described herein may include the illustrated combination of hardware components, other embodiments may comprise computing devices with different combinations of components. It is to be understood that these computing devices may comprise any suitable combination of hardware and/or software needed to perform the tasks, features, functions and methods disclosed herein. Determining, calculating, obtaining or similar operations described herein may be performed by processing circuitry, which may process information by, for example, converting the obtained information into other information, comparing the obtained information or converted information to information stored in the computer system, and/or performing one or more operations based on the obtained information or converted information, and as a result of said processing making a determination.
- processing circuitry may process information by, for example, converting the obtained information into other information, comparing the obtained information or converted information to information stored in the computer system, and/or performing one or more operations based on the obtained information or converted information, and as a result of said processing making a determination.
- computing devices may comprise multiple different physical components that make up a single illustrated component, and functionality may be partitioned between separate components.
- a communication interface may be configured to include any of the components described herein, and/or the functionality of the components may be partitioned between the processing circuitry and the communication interface.
- non-computationally intensive functions of any of such components may be implemented in software or firmware and computationally intensive functions may be implemented in hardware.
- processing circuitry executing instructions stored on in memory, which in certain embodiments may be a computer program product in the form of a non-transitory computer-readable storage medium.
- some or all of the functionalities may be provided by the processing circuitry without executing instructions stored on a separate or discrete device-readable storage medium, such as in a hard-wired manner.
- the processing circuitry can be configured to perform the described functionality. The benefits provided by such functionality are not limited to the processing circuitry alone or to other components of the computing device but are enjoyed by the computing device as a whole, and/or by end users.
Landscapes
- Physics & Mathematics (AREA)
- General Physics & Mathematics (AREA)
- Engineering & Computer Science (AREA)
- Power Engineering (AREA)
- Measurement Of Mechanical Vibrations Or Ultrasonic Waves (AREA)
Abstract
Description
- The present invention relates to automated monitoring of an electrical switching component immersed in a liquid in a container of an electrical device comprising a transformer or an on-load tap changer (OLTC).
- On-load tap changers (OLTCs) are used with power transformers and regulate their voltage under load, i.e., without interrupting the power supply to consumers.
- On load tap changers are by far the most contributor to the major transformer failures worldwide and therefore deserve condition-based maintenance assisted by online monitoring. Switching time (total and partial) of the operation sequence of a tap changer is one of the most important parameters that can be associated with various health issues inside a tap changer. A normal switching time of the OLTC can be measured at production of the OLTC or established using historical measurement in use, as further elaborated below. In use, the actual switching time can be measured by methods like pressure pulse analysis or vibration signal analysis. By monitoring the switching time, i.e. the measured switching time in use, and comparing it to the normal switching time, a deviation time may be determined to be the difference between the actual switching time and the normal switching time. If the deviation time is too large, there is probably something wrong with the OLTC, and action should be taken, such as scheduling maintenance work.
- Accordingly, the deviation time, or any other measurable deviation, may be monitored and compared to a predetermined deviation criterion, such as a predetermined time or a predetermined percentage of the normal switching time. One can monitor the total switching time and/or one can monitor partial switching time, i.e. the time it takes to complete sub-portions of a switching sequence.
- Such monitoring may alternatively be performed on other electrical switching components than electrical switching components of OLTC:s. Accordingly, a transformer or an on-load tap changer (OLTC) may be provided with an electrical switching component immersed in a liquid in a container. The electrical switching component may be a tap changer or some other switching device. The switching component comprises movable mechanical components, such as one or more electrical contact elements. When the mechanical components move and/or make contact, vibrations form around the switching component. For a fully functional switch, the vibrations emitted at each movement of a switching sequence follows a specific pattern governed by the design of the switching component, and external factors, such ambient temperature. In other words, the vibration pattern is predictable for a fully functional electrical switching component.
- By studying the vibrations emitted during operation of the switching component, one or more deviations from the specific pattern may be detected. A certain amount of deviation is normal but abnormal deviations are typically associated with some malfunction or wear of the electrical switching component.
- The environment in use around a switching component may present various sources of vibrations making it difficult to study the vibrations emitted by the switching component, and hence more difficult to monitor the function of the electrical switching component using vibration analysis.
- An object of the invention is to provide a robust method for monitoring an electrical switching component immersed in a liquid in a container. A further object is to enable robust monitoring of both total switching time and partial switching time, i.e. the time it takes to perform a full switching sequence, and one or more sub-portions of the switching sequence.
- According to a first aspect, this and other objects are achieved by a computer-implemented method according to
claim 1 with alternative embodiments presented in the dependent claims. - The computer-implemented method is suitable for monitoring an electrical switching component immersed in a liquid in a container of an electrical device comprising a transformer or an on-load tap changer (OLTC). The method comprises, by a processing circuitry of a computer system:
- obtaining a vibration signature model defining at least a vibration signature associated with movement of one or more mechanical components of the electrical switching component during a switching sequence of the electrical switching component from one switching position to another switching position of the electrical switching component,
- obtaining a vibration signal recording from a vibration sensor configured to measure vibrations of the container,
- determining a first smoothed curve based on the vibration signal recording using a first smoothing level,
- determining a second smoothed curve based on the vibration signal recording using a second smoothing level lower than the first smoothing level,
- selecting a portion in time of the second smoothed curve based on an extent in time of a peak of the first smoothed curve,
- comparing one or more peaks of the selected portion the second smoothed curve to one or more peaks of a corresponding portion of the vibration signature to determine one or more deviations based on the comparison,
- determining a deviation status based on the deviations, and
- providing a deviation status signal based on the deviation status.
- The vibration signature model is typically pre-determined in a lab using measurements on a fully functional electrical switching device. Alternatively, the vibration signature model could be determined using machine-learning on a fully functional electrical switching device.
- The claimed computer-implemented method comprises obtaining the vibration signal model and is not limited to how the vibration signature model as such is determined.
- The vibration signal is obtained and then used to compare make a comparison between information derivable from the vibration signal recording and a vibration signature of the vibration signature model.
- Two curves with different smoothing levels are derived from the vibration signal recording. The first smoothed curve with a higher smoothing level, i.e. less detailed curve, is used to identify different sub-portions of the switching sequence by selecting an extent in time based on the curvature of a peak of the first smoothed curve, and then the second smoothed curve, which is more detailed than the first smoothed curve, is studied. Specifically, only the selected extent in time of the second smoothed curve is studied and peaks of the second smoothed curve outside the selected extent in time are not included in the comparison of the sub-portion of the switching sequence compares to the corresponding sub-portion of the switching sequence of the signature model. This approach improves the method's ability to correctly match information derivable from the vibration signal recording to corresponding information of the vibration signature since a bigger picture is established first, using the first smoothed curve, thus absorbing influence from noise or abnormal data such as missing peaks or additional peaks of the vibration signal recording. Thus, the risk of comparing one or more specific peaks of the more detailed curve to wrong peak(s) of the vibration signature model decreases.
- It should be understood that correct comparison between a vibration signal recording from a fully functional electrical switching component to the vibration signature is less prone to go wrong than a comparison between the vibration signal recording of a non-functional electrical switching component and the vibration signature. The above-described computer-implemented method increases accuracy of said comparison and increases the ability of the model to identify deviations for sub-portions of a switching sequence.
- In the drawings, the peaks of the first smoothed curve are referred to as global peaks and the peaks of the second smoothed curve are referred to as local peaks.
- The use of a lower smoothing level means that more details of the vibration signal recording remain in the smoothed curve than would have been the case when using a higher smoothing level.
- The selection of an extent in time of a peak of the first smoothed curve may be performed in any suitable way. For example, the extent in time of a peak of the first smoothed curve may be from a start time of the peak of the first smoothed curve to a start time of a subsequent peak or, if no subsequent peak is present in the first smoothed curve, to the end of the first smoothed curve, or to a time being offset a predetermined time after the start time of the last peak of the first smoothed curve.
- The start time may be determined to be the time when the first smoothed curve reaches a minimum absolute value between the peak and a preceding peak of the first smoothed curve, or reaches a predetermined threshold level, whichever occurs closer in time to the time of a maximum absolute value of the peak.
- The example curves illustrated in the figures are derived such that they measure strength of vibration as a one-sided curve on a positive side of the Y-axis of the graph, i.e. with positive values. Alternatively, the curves could be derived such that they are one-sided on the negative side of the Y-axis, such that the signal strength is measured in negative terms. To cover both these approaches, the method looks at the absolute value of the vibration strength indicated by the respective curve.
- Said comparing of one or more peaks of the selected portion the second smoothed curve to one or more peaks of a corresponding portion of the vibration signature may comprise comparing a maximum absolute value and/or a duration of one or more peaks of the selected portion of the second smoothed curve to a maximum absolute value and/or duration of one or more corresponding peaks of a corresponding portion of the vibration signature.
- Any suitable implantation of the signature model may be used and preferably enables identification of a peak of the second smoothed curve using at least information from the first smoothed curve, such as information pertaining to which peak of the first smooth curve a peak of the second smoothed curve belongs to. This enables classification of the peaks of the second smoothed curve for improved identification of which portion of the switching sequence the specific peak of the second smoothed curve belongs to. Deviations may be studied in terms of extent of time of one or more peaks of the second smoothed curve, and/or in terms of maximum absolute value of a specific peak of the second smoothed curve. Hence, a specific peak may be studied, or a group of peaks may be jointly studied to a reference peak or group of peaks. For example, a total switching time may be studied for a group of all peaks of the second smoothed curve. The switching time model may comprise information for discarding initial peaks of the first or second smoothed curves not of interest for monitoring purposes.
- The duration may be calculated as the extent in time from a start time of a peak of the second smoothed curve to a start time of a subsequent peak of the second smoothed curve, or, if no subsequent peak is present in the second smoothed curve, to the end of the second smoothed curve, or to a time being offset a predetermined time after the start time of the peak.
- The deviation status may be determined to be a normal status in response to said deviation being within a predetermined deviation range or below a predetermined deviation threshold, and/or the deviation status may be determined to be an error status in response to said deviation being outside said predetermined deviation range or exceeding said predetermined deviation threshold.
- Accordingly, the monitoring may be based on continuously providing/receiving an OK status, such that an omission of provision of said OK status indirectly means that something is not OK with the electrical switching component. Alternatively, or additionally, the monitoring may be based on providing a status indicating something is not OK when such status is determined, wherein the existence of the provision of such a status means that something is not OK with the electrical switching component.
- A low-pass filter may be applied to the vibration signal when determining the first and second smoothed curves. The low-pass filter may have a cut-off frequency of 0.5 - 1 kHz.
- The first smoothed curve may be determined using a root mean square smoothing with a moving time window in the range of 5-10 milliseconds.
- The second smooth curve may be determined using a root mean square smoothing with a moving time window smaller than the moving time window used for determining the first smoothed curve.
- According to a second aspect, the object is also achieved by an electrical device according to claim 11, with alternative embodiments presented in the dependent claims. The electrical device comprises a transformer or an on-load tap changer (OLTC), and: a container, an electrical switching component immersed in a liquid in the container, a vibration sensor configured to measure vibrations of the container, and a computer system comprising a processing circuitry configured to perform the computer-implemented method described above.
- The appended figures are schematic representations of non-limiting embodiments.
-
Fig. 1 shows an example of anelectrical device 10 in the form of atransformer assembly 10 provided with an on-load tap changer 12. -
Fig. 2 shows an example of a graphical plot of a vibration recording. -
Fig. 3 shows the first C1 and second C2 smoothed curves, and maximum absolute values marked for the peaks of the first C1 and second C2 smoothed curves. -
Fig. 5 shows a graphical plot of the second smoothed curve, along with some of the time portions selected using information from the peaks of the first smoothed curve. Here it is possible to see which peaks of the second smoothed curve are associated with the switching sub-sequence indicated by a respective peak of the first smoothed curve. -
Fig. 6 shows a schematic overview of the method steps of the computer-implemented method for monitoring an electrical switching component immersed in a liquid in a container of an electric device. -
Fig. 7 shows a schematic overview of the computer system implementing the monitoring method. -
Fig. 1 shows an example of anelectrical device 10 in the form of atransformer assembly 10 provided with an on-load tap changer 12. The on-load tap changer 12 comprises anelectrical switching component 1 in the form of a diverter switch. - The on-load tap changer 12 comprises two separate sections. The two separate sections are the
diverter switch 1, which generally may be in its own housing separate from thetransformer housing 16, and atap selector 18. Thetap selector 18, which is mounted beneath thediverter switch 1, consists of a fine tap selector and usually a change-over selector. In the example illustrated inFigure 1 , there are twodiverter switches 1 and three tap selectors. - Power to operate the tap-changer 12 is supplied from the
motor drive mechanism 20, which is typically mounted on the outside of thetransformer 10. The power is transmitted by means ofshafts bevel gears 26, which turn thetap selector 18 from tap to tap. - Electrical switching components of the
diverter switch 1 are immersed in a liquid in acontainer 2. Thetransformer assembly 10 is provided with avibration sensor 4 configured to measure vibrations of thecontainer 2. Also, acomputer system 700 is provided, saidcomputer system 700 comprising aprocessing circuitry 702 configured to perform a computer-implemented method M for monitoring of theelectrical switching component 1. In other embodiments any otherelectrical switching component 1 immersed in a liquid in acontainer 2 could alternatively be monitored. - Embodiments of the computer-implemented method will hereinafter be described with reference to the appended figures.
- The computer-implemented method M is suitable for monitoring an
electrical switching component 1 immersed in a liquid in acontainer 2 of an electrical device comprising a transformer or an on-load tap changer (OLTC) 3. As shown infig. 6 , the method M comprises at least, by aprocessing circuitry 4 of a computer system 5: - obtaining M1 a vibration signature model defining at least a vibration signature associated with movement of one or more mechanical components of the
electrical switching component 1 during a switching sequence of theelectrical switching component 1 from a one switching position to another switching position of the electrical switching component, - obtaining M2 a vibration signal recording R from a
vibration sensor 4 configured to measure vibrations of thecontainer 2, - determining M3 a first smoothed curve C1 based on the vibration signal recording R using a first smoothing level,
- determining M4 a second smoothed curve C2 based on the vibration signal recording R using a second smoothing level lower than the first smoothing level,
- selecting M5 a portion in time of the second smoothed curve C2 based on an extent in time of a peak P1 of the first smoothed curve C1,
- comparing M6) one or more peaks P2) of the selected portion the second smoothed curve C2) to one or more peaks of a corresponding portion of the vibration signature to determine one or more deviations based on the comparison,
- determining M7) a deviation status based on the deviations, and
- providing M8) a deviation status signal based on the deviation status.
-
Fig. 2 shows an example of a graphical plot of a vibration signal recording. -
Fig. 3 shows the first C1 and second C2 smoothed curves, and maximum absolute values marked for the peaks of the first C1 and second C2 smoothed curves. The envelope for both curves C1, C2 are derived such that the curves are one-sided using Hilbert transform or any other suitable method. Also,fig. 3 shows markings for start times of the peaks of the second smoothed curve C2. It is evident that the lower level of smoothing of the second smoothed curve provides a curve with more details than the first smoothed curve C1. - Any suitable level of smoothing may be applied when determining the first C1 and second C2 smoothed curves. In the present example, smoothing has been made using root mean square smoothing with a moving time window of 6 ms for the first smoothed curve C1, and a moving window of 1 ms for the second smoothed curve C2. In other embodiments, other values for the moving window may alternatively be used instead, as long as the second smoothed curve C2 is determined using a root mean square smoothing with a moving time window smaller than the moving time window used for determining the first smoothed curve C1. Typically, the first smoothed curve C1 is determined using a root mean square smoothing with a moving time window in the range of 5-10 ms.
- The extent in time of a peak may be chosen according to any suitable method, as long as the same method is used both when deriving the vibration signature and when comparing the vibration recording against the signature model.
- In the present embodiment, the first smoothed curve C1 is from a start time of the peak P1 of the first smoothed curve C1 to a start time of a subsequent peak or, if no subsequent peak is present in the first smoothed curve C1, to the end of the first smoothed curve C1, or to a time being offset a predetermined time after the start time of the last peak P1 of the first smoothed curve C1.
- Also the start time may be chosen according to any suitable method, as long as the same method is used both when deriving the vibration signature and when comparing the vibration recording against the signature model.
- In the present embodiment, the start time is determined to be the time when the first smoothed curve C1 reaches a minimum absolute value between the peak P1 and a preceding peak of the first smoothed curve C1, or reaches a predetermined threshold level L, whichever occurs closer in time to the time of a maximum absolute value of the peak.
-
Fig. 4 shows a graphical plot of the first smoothed curve, along with indications under the horizontal axis indicating some of the extents in time determined using information from the peaks of the first smoothed curve. -
Fig. 5 shows a graphical plot of the second smoothed curve, along with some of the time portions selected using the extents in time identified with information from the peaks of the first smoothed curve. Here it is possible to see which peaks of the second smoothed curve are associated with the switching sub-sequence indicated by a respective peak of the first smoothed curve. - In this embodiment, the comparing of one or more peaks of the selected portion the second smoothed curve C2 to the one or more peaks of a corresponding portion of the vibration signature comprises comparing a maximum absolute value and/or a duration of one or more peaks of the selected portion of the second smoothed curve C2 to a maximum absolute value and/or duration of one or more corresponding peaks of a corresponding portion of the vibration signature. In other embodiments, any other suitable method for achieving the comparison may alternatively be used instead.
- The duration of a peak P2 of the second smoothed curve C2 may be calculated as the extent in time from a start time of a peak P2 of the second smoothed curve C2 to a start time of a subsequent peak of the second smoothed curve C2, or, if no subsequent peak is present in the second smoothed curve C2, to the end of the second smoothed curve C2, or to a time being offset a predetermined time after the start time of the peak P2.
- The start time of a peak P2 of the second smoothed curve C2 may be determined using any suitable method. In the present embodiment, the start time of a peak P2 of the second smoothed curve C2 is determined to be the time when the second smoothed curve C1 reaches a predetermined threshold level which is a threshold level defined by the vibration signature for each peak P2. In other embodiments, the start of the peak P2 may be found using a threshold level proportional to the maximum absolute value of the respective peak P2, or it may be the time when the curve reaches a minimum absolute value between the peak P2 and a preceding peak of the second smoothed curve C2.
- The deviation status may be determined to be a normal status in response to said deviation being within a predetermined deviation range or below a predetermined deviation threshold, and/or the deviation status is determined to be an error status in response to said deviation being outside said predetermined deviation range or exceeding said predetermined deviation threshold.
- In this embodiment, a low-pass filter is applied to the vibration signal when determining the first and second smoothed curves. The low-pass filter has a cut-off frequency of 0.5 - 1 kHz but may alternatively be configured with any other suitable cut-off frequency.
- In other embodiments, noise may alternatively be handled using any other suitable method, or not handled at all.
- As indicated above, the method M is used on an
electrical device 10 comprising a transformer or an on-loadtap changer OLTC 3. Theelectrical device 10 comprises acontainer 2 which may be a part of the transformer or part of the on-load tap changer, or which may be a container separate from the transformer or the OLTC. In this embodiment, the container is part of the OLTC. Theelectrical device 10 further comprises anelectrical switching component 1 immersed in a liquid in thecontainer 2, avibration sensor 4 configured to measure vibrations of thecontainer 2, and acomputer system 700 comprising aprocessing circuitry 702 configured to perform the above-described computer-implemented method M. In this embodiment, thevibration sensor 4 is attached to thecontainer 2 but in other embodiments it may be attached anywhere it is able to sense vibrations associated with the movements of the mechanical members of theswitching component 1. Thesensor 4 may be any suitable type of vibration sensor. For example, the vibration sensor may be an optical sensor configured to measure vibration of thecontainer 2 using light reflected by thecontainer 2 to the optical sensor. -
Figure 7 shows acomputer system 700 in accordance with some embodiments. As used herein, acomputer system 700 refers to a device or system capable, configured, arranged and/or operable to communicate with network nodes and/or other computer systems. Examples of a computer system include, but are not limited to, a smart phone, mobile phone, cell phone, desktop computer, personal digital assistant (PDA), wearable terminal device, wireless endpoint, tablet, laptop, laptop-embedded equipment (LEE), laptop-mounted equipment (LME), smart device, wireless customer-premise equipment (CPE), etc. - A computer system may support device-to-device (D2D) communication, for example by implementing a electrical switching 3GPP standard for sidelink communication, Dedicated Short-Range Communication (DSRC), vehicle-to-vehicle (V2V), vehicle-to-infrastructure (V2I), or vehicle-to-everything (V2X).
- The
computer system 700 includesprocessing circuitry 702, also referred to herein as a processor device, that is operatively coupled via a bus 704 to an input/output interface 706, apower source 708, amemory 710, acommunication interface 712, and/or any other component, or any combination thereof. Certain computer systems may utilize all or a subset of the components shown inFigure 7 . The level of integration between the components may vary from one computer system to another computer system. Further, certain computer systems may contain multiple instances of a component, such as multiple processors, memories, transceivers, transmitters, receivers, etc. - The
processing circuitry 702 is configured to process instructions and data and may be configured to implement any sequential state machine operative to execute instructions stored as machine-readable computer programs in thememory 710. Theprocessing circuitry 702 may be implemented as one or more hardware-implemented state machines (e.g., in discrete logic, field-programmable gate arrays (FPGAs), application specific integrated circuits (ASICs), etc.); programmable logic together with appropriate firmware; one or more stored computer programs, general-purpose processors, such as a microprocessor or digital signal processor (DSP), together with appropriate software; or any combination of the above. For example, theprocessing circuitry 702 may include multiple central processing units (CPUs). - In the example, the input/
output interface 706 may be configured to provide an interface or interfaces to an input device, output device, or one or more input and/or output devices. Examples of an output device include a speaker, a sound card, a video card, a display, a monitor, a printer, an actuator, an emitter, a smartcard, another output device, or any combination thereof. An input device may allow a user to capture information into thecomputer system 700. Examples of an input device include a touch-sensitive or presence-sensitive display, a camera (e.g., a digital camera, a digital video camera, a web camera, etc.), a microphone, a sensor, a mouse, a trackball, a directional pad, a trackpad, a scroll wheel, a smartcard, and the like. The presence-sensitive display may include a capacitive or resistive touch sensor to sense input from a user. A sensor may be, for instance, an accelerometer, a gyroscope, a tilt sensor, a force sensor, a magnetometer, an optical sensor, a proximity sensor, a biometric sensor, etc., or any combination thereof. An output device may use the same type of interface port as an input device. For example, a Universal Serial Bus (USB) port may be used to provide an input device and an output device. - In some embodiments, the
power source 708 is structured as a battery or battery pack. Other types of power sources, such as an external power source (e.g., an electricity outlet), photovoltaic device, or power cell, may be used. Thepower source 708 may further include power circuitry for delivering power from thepower source 708 itself, and/or an external power source, to the various parts of thecomputer system 700 via input circuitry or an interface such as an electrical power cable. Delivering power may be, for example, for charging of thepower source 708. Power circuitry may perform any formatting, converting, or other modification to the power from thepower source 708 to make the power suitable for the respective components of thecomputer system 700 to which power is supplied. - The
memory 710 may be or be configured to include memory such as random access memory (RAM), read-only memory (ROM), programmable read-only memory (PROM), erasable programmable read-only memory (EPROM), electrically erasable programmable read-only memory (EEPROM), magnetic disks, optical disks, hard disks, removable cartridges, flash drives, and so forth. In one example, thememory 710 includes one ormore application programs 714, such as an operating system, web browser application, a widget, gadget engine, or other application, andcorresponding data 716. Thememory 710 may store, for use by thecomputer system 700, any of a variety of various operating systems or combinations of operating systems. - The
memory 710 may be configured to include a number of physical drive units, such as redundant array of independent disks (RAID), flash memory, USB flash drive, external hard disk drive, thumb drive, pen drive, key drive, high-density digital versatile disc (HD-DVD) optical disc drive, internal hard disk drive, Blu-Ray optical disc drive, holographic digital data storage (HDDS) optical disc drive, external mini-dual in-line memory module (DIMM), synchronous dynamic random access memory (SDRAM), external micro-DIMM SDRAM, smartcard memory such as tamper resistant module in the form of a universal integrated circuit card (UICC) including one or more subscriber identity modules (SIMs), such as a USIM and/or ISIM, other memory, or any combination thereof. The UICC may for example be an embedded UICC (eUICC), integrated UICC (iUICC) or a removable UICC commonly known as 'SIM card.' Thememory 710 may allow thecomputer system 700 to access instructions, application programs and the like, stored on transitory or non-transitory memory media, to off-load data, or to upload data. An article of manufacture, such as one utilizing a communication system may be tangibly embodied as or in thememory 710, which may be or comprise a device-readable storage medium. - The
processing circuitry 702 may be configured to communicate with an access network or other network using thecommunication interface 712. Thecommunication interface 712 may comprise one or more communication subsystems and may include or be communicatively coupled to anantenna 722. Thecommunication interface 712 may include one or more transceivers used to communicate, such as by communicating with one or more remote transceivers of another device capable of wireless communication (e.g., another computer system or a network node in an access network). Each transceiver may include atransmitter 718 and/or areceiver 720 appropriate to provide network communications (e.g., optical, electrical, frequency allocations, and so forth). Moreover, thetransmitter 718 andreceiver 720 may be coupled to one or more antennas (e.g., antenna 722) and may share circuit components, software or firmware, or alternatively be implemented separately. - In the illustrated embodiment, communication functions of the
communication interface 712 may include cellular communication, Wi-Fi communication, LPWAN communication, data communication, voice communication, multimedia communication, short-range communications such as Bluetooth, near-field communication, location-based communication such as the use of the global positioning system (GPS) to determine a location, another like communication function, or any combination thereof. Communications may be implemented in according to one or more communication protocols and/or standards, such as IEEE 802.11, Code Division Multiplexing Access (CDMA), Wideband Code Division Multiple Access (WCDMA), GSM, LTE, New Radio (NR), UMTS, WiMax, Ethernet, transmission control protocol/internet protocol (TCP/IP), synchronous optical networking (SONET), Asynchronous Transfer Mode (ATM), QUIC, Hypertext Transfer Protocol (HTTP), and so forth. - Regardless of the type of sensor, a computer system may provide an output of data captured by its sensors, through its
communication interface 712, via a wireless connection to a network node. Data captured by sensors of a computer system can be communicated through a wireless connection to a network node via another computer system. The output may be periodic (e.g., once every 15 minutes if it reports the sensed temperature), random (e.g., to even out the load from reporting from several sensors), in response to a triggering event (e.g., when moisture is detected an alert is sent), in response to a request (e.g., a user initiated request), or a continuous stream (e.g., a live video feed of a patient). - As another example, a computer system comprises an actuator, a motor, or a switch, related to a communication interface configured to receive wireless input from a network node via a wireless connection. In response to the received wireless input the states of the actuator, the motor, or the switch may change.
- As yet another specific example, in an loT scenario, a computer system may represent a machine or other device that performs monitoring and/or measurements, and transmits the results of such monitoring and/or measurements to another computer system and/or a network node. The computer system may in this case be an M2M device, which may in a electrical switching 3GPP context be referred to as an MTC device. As one particular example, the computer system may implement the electrical switching 3GPP NB-loT standard.
- In practice, any number of computer systems may be used together with respect to a single use case. The first and/or the second computer system can also include more than one of the functionalities described above. For example, a computer system might comprise the sensor and the actuator, and handle communication of data for both the speed sensor and the actuators.
- Although the computing devices described herein (e.g., computer system) may include the illustrated combination of hardware components, other embodiments may comprise computing devices with different combinations of components. It is to be understood that these computing devices may comprise any suitable combination of hardware and/or software needed to perform the tasks, features, functions and methods disclosed herein. Determining, calculating, obtaining or similar operations described herein may be performed by processing circuitry, which may process information by, for example, converting the obtained information into other information, comparing the obtained information or converted information to information stored in the computer system, and/or performing one or more operations based on the obtained information or converted information, and as a result of said processing making a determination. Moreover, while components are depicted as single boxes located within a larger box, or nested within multiple boxes, in practice, computing devices may comprise multiple different physical components that make up a single illustrated component, and functionality may be partitioned between separate components. For example, a communication interface may be configured to include any of the components described herein, and/or the functionality of the components may be partitioned between the processing circuitry and the communication interface. In another example, non-computationally intensive functions of any of such components may be implemented in software or firmware and computationally intensive functions may be implemented in hardware.
- In certain embodiments, some or all of the functionality described herein may be provided by processing circuitry executing instructions stored on in memory, which in certain embodiments may be a computer program product in the form of a non-transitory computer-readable storage medium. In alternative embodiments, some or all of the functionalities may be provided by the processing circuitry without executing instructions stored on a separate or discrete device-readable storage medium, such as in a hard-wired manner. In any of those particular embodiments, whether executing instructions stored on a non-transitory computer-readable storage medium or not, the processing circuitry can be configured to perform the described functionality. The benefits provided by such functionality are not limited to the processing circuitry alone or to other components of the computing device but are enjoyed by the computing device as a whole, and/or by end users.
Claims (12)
- A computer-implemented method (M) for monitoring an electrical switching component (1) immersed in a liquid in a container (2) of an electric device (10) comprising a transformer or of an on-load tap changer (OLTC) (3), said method (M) comprising, by a processing circuitry (4) of a computer system (5):obtaining (M1) a vibration signature model defining at least a vibration signature associated with movement of one or more mechanical components of the electrical switching component 1 during a switching sequence of the electrical switching component 1 from a one switching position to another switching position of the electrical switching component,obtaining (M2) a vibration signal recording (R) from a vibration sensor (4) configured to measure vibrations of the container (2),determining (M3) a first smoothed curve (C1) based on the vibration signal recording (R) using a first smoothing level,determining (M4) a second smoothed curve (C2) based on the vibration signal recording (R) using a second smoothing level lower than the first smoothing level,selecting (M5) a portion in time of the second smoothed curve (C2) based on an extent in time of a peak (P1) of the first smoothed curve (C1),comparing (M6) one or more peaks (P2) of the selected portion the second smoothed curve (C2) to one or more peaks of a corresponding portion of the vibration signature to determine one or more deviations based on the comparison,determining (M7) a deviation status based on the deviations, andproviding (M8) a deviation status signal based on the deviation status.
- The computer-implemented method (M) according to claim 1,
wherein the extent in time of a peak of the first smoothed curve (C1) is from a start time of the peak (P1) of the first smoothed curve (C1) to a start time of a subsequent peak or, if no subsequent peak is present in the first smoothed curve (C1), to the end of the first smoothed curve (C1), or to a time being offset a predetermined time after the start time of the last peak (P1) of the first smoothed curve (C1). - The computer-implemented method (M) according to claim 2, wherein the start time is determined to be the time when the first smoothed curve (C1) reaches a minimum absolute value between the peak (P1) and a preceding peak of the first smoothed curve (C1), or reaches a predetermined threshold level (L), whichever occurs closer in time to the time of a maximum absolute value of the peak.
- The computer-implemented method (M) according to any one of the preceding claims, wherein said comparing of one or more peaks of the selected portion the second smoothed curve (C2) to the one or more peaks of a corresponding portion of the vibration signature comprises comparing a maximum absolute value and/or a duration of one or more peaks of the selected portion of the second smoothed curve (C2) to a maximum absolute value and/or duration of one or more corresponding peaks of a corresponding portion of the vibration signature.
- The computer-implemented method (M) according to claim 4, wherein the duration is calculated as the extent in time from a start time of a peak (P2) of the second smoothed curve (C2) to a start time of a subsequent peak of the second smoothed curve (C2), or, if no subsequent peak is present in the second smoothed curve (C2), to the end of the second smoothed curve (C2), or to a time being offset a predetermined time after the start time of the peak (P2).
- The computer-implemented method (M) according to any one of the preceding claims, wherein the deviation status is determined to be a normal status in response to said deviation being within a predetermined deviation range or below a predetermined deviation threshold, and/or wherein the deviation status is determined to be an error status in response to said deviation being outside said predetermined deviation range or exceeding said predetermined deviation threshold.
- The computer-implemented method (M) according to any one of the preceding claims, wherein a low-pass filter is applied to the vibration signal when determining the first and second smoothed curves.
- The computer-implemented method (M) according to claim 7, wherein the low-pass filter has a cut-off frequency of 0.5 - 1 kHz.
- The computer-implemented method (M) according to any one of the preceding claims, wherein the first smoothed curve is determined using a root mean square smoothing with a moving time window in the range of 5-10 milliseconds.
- The computer-implemented method (M) according to claim 9, wherein the second smoothed curve is determined using a root mean square smoothing with a moving time window smaller than the moving time window used for determining the first smoothed curve.
- An electrical device (10) comprising a transformer or an on-load tap changer (OLTC) (3), said electrical device (10) comprising:a container (2),an electrical switching component (1) immersed in a liquid in the container (2),a vibration sensor (4) configured to measure vibrations of the container, anda computer system (700) comprising a processing circuitry (702) configured to perform the computer-implemented method (M) according to any one of claims 1-10.
- An electrical device (10) according to claim 11, wherein the vibration sensor (4) is attached to the container (2) or wherein the vibration sensor (4) is an optical sensor configured to measure vibration of the container (2) using light reflected by the container (2) to the optical sensor.
Priority Applications (3)
| Application Number | Priority Date | Filing Date | Title |
|---|---|---|---|
| EP23188120.2A EP4498047B1 (en) | 2023-07-27 | 2023-07-27 | A computer-implemented method for monitoring an electrical switching component immersed in a liquid |
| PCT/EP2024/059019 WO2025021332A1 (en) | 2023-07-27 | 2024-04-03 | A computer-implemented method for monitoring an electrical switching component immersed in a liquid |
| CN202480046956.7A CN121511395A (en) | 2023-07-27 | 2024-04-03 | Computer-based implementation method for monitoring electrical switching components immersed in liquid. |
Applications Claiming Priority (1)
| Application Number | Priority Date | Filing Date | Title |
|---|---|---|---|
| EP23188120.2A EP4498047B1 (en) | 2023-07-27 | 2023-07-27 | A computer-implemented method for monitoring an electrical switching component immersed in a liquid |
Publications (2)
| Publication Number | Publication Date |
|---|---|
| EP4498047A1 true EP4498047A1 (en) | 2025-01-29 |
| EP4498047B1 EP4498047B1 (en) | 2025-11-05 |
Family
ID=87517408
Family Applications (1)
| Application Number | Title | Priority Date | Filing Date |
|---|---|---|---|
| EP23188120.2A Active EP4498047B1 (en) | 2023-07-27 | 2023-07-27 | A computer-implemented method for monitoring an electrical switching component immersed in a liquid |
Country Status (3)
| Country | Link |
|---|---|
| EP (1) | EP4498047B1 (en) |
| CN (1) | CN121511395A (en) |
| WO (1) | WO2025021332A1 (en) |
Family Cites Families (8)
| Publication number | Priority date | Publication date | Assignee | Title |
|---|---|---|---|---|
| DE102012103263A1 (en) * | 2012-04-16 | 2013-10-17 | Maschinenfabrik Reinhausen Gmbh | Method and system for investigating a tapping change device of a transformer |
| CN104964734A (en) * | 2015-05-07 | 2015-10-07 | 国家电网公司 | On-load voltage regulation switch vibration signal on-line monitoring method |
| CN105701570A (en) * | 2016-01-11 | 2016-06-22 | 国网浙江省电力公司经济技术研究院 | Short-term electric power demand analysis method based on overall process technology improvement |
| DE102018105087B3 (en) * | 2018-03-06 | 2019-06-27 | Maschinenfabrik Reinhausen Gmbh | System, method and computer program product for detecting physical quantities of at least one component of a tapped transformer and for monitoring the components of a tapped transformer |
| JP7445928B2 (en) * | 2018-05-07 | 2024-03-08 | ストロング フォース アイオーティ ポートフォリオ 2016,エルエルシー | Methods and systems for data collection, learning, and streaming of machine signals for analysis and maintenance using the industrial Internet of Things |
| US11443728B2 (en) * | 2020-12-18 | 2022-09-13 | Semiconductor Components Industries, Llc | Echo detection with background noise based screening |
| CN114295971B (en) * | 2021-12-30 | 2024-05-28 | 国网河北省电力有限公司电力科学研究院 | On-load tap changer state detection device, method and control equipment |
| CN116295812B (en) * | 2023-05-22 | 2023-08-18 | 南方电网科学研究院有限责任公司 | Monitoring method, monitoring device and electronic device for power transformer |
-
2023
- 2023-07-27 EP EP23188120.2A patent/EP4498047B1/en active Active
-
2024
- 2024-04-03 CN CN202480046956.7A patent/CN121511395A/en active Pending
- 2024-04-03 WO PCT/EP2024/059019 patent/WO2025021332A1/en active Pending
Non-Patent Citations (3)
| Title |
|---|
| PENGJU KANG ET AL: "Condition Assessment of Power Transformer Onload Tap Changers Using Wavelet Analysis and Self-Organizing Map: Field Evaluation", IEEE TRANSACTIONS ON POWER DELIVERY, IEEE SERVICE CENTER, NEW YORK, NY, US, vol. 18, no. 1, 1 January 2003 (2003-01-01), XP011078918, ISSN: 0885-8977 * |
| SEO JUNHYUCK ET AL: "On Savitzky-Golay Filtering for Online Condition Monitoring of Transformer On-Load Tap Changer", IEEE TRANSACTIONS ON POWER DELIVERY, IEEE SERVICE CENTER, NEW YORK, NY, US, vol. 33, no. 4, 1 August 2018 (2018-08-01), pages 1689 - 1698, XP011683174, ISSN: 0885-8977, [retrieved on 20180509], DOI: 10.1109/TPWRD.2017.2749374 * |
| VIERECK K ET AL: "Driving Reliability with Machine Learning and Improving Operation by Digitalization of Power Transformers", 2019 IEEE PES GTD GRAND INTERNATIONAL CONFERENCE AND EXPOSITION ASIA (GTD ASIA), IEEE, 19 March 2019 (2019-03-19), pages 217 - 222, XP033551275, DOI: 10.1109/GTDASIA.2019.8715987 * |
Also Published As
| Publication number | Publication date |
|---|---|
| EP4498047B1 (en) | 2025-11-05 |
| WO2025021332A1 (en) | 2025-01-30 |
| CN121511395A (en) | 2026-02-10 |
Similar Documents
| Publication | Publication Date | Title |
|---|---|---|
| US11662222B2 (en) | Sensor management and reliability | |
| US9285057B2 (en) | Methods and apparatus for process device calibration | |
| CN108304287B (en) | Disk failure detection method, device and related equipment | |
| US20200026268A1 (en) | Control device and diagnosis system | |
| US20190196441A1 (en) | Apparatus, method, and computer readable media for controlling machining parameters | |
| CA2922792C (en) | Cable processing machine monitoring with improved precision mechanism for cable processing | |
| CN114326676B (en) | Intrusion detection method and device, storage medium and electronic equipment | |
| CN112904799A (en) | Data acquisition device, system and method thereof | |
| CN114077919A (en) | System for predicting machining anomalies | |
| EP4498047B1 (en) | A computer-implemented method for monitoring an electrical switching component immersed in a liquid | |
| CA3291043A1 (en) | A computer-implemented method for monitoring an electrical switching component immersed in a liquid | |
| CN105425739A (en) | System for predicting abnormality occurrence using PLC log data | |
| KR102094639B1 (en) | Factory manufacturing line management system, and method thereof | |
| US20180053518A1 (en) | Method and apparatus to improve speech recognition in a high audio noise environment | |
| CN104964652A (en) | Cell winding production detection method and device based on machine vision | |
| CN116868256A (en) | Packaging simulation device and method for producing secondary batteries | |
| WO2024213271A1 (en) | A computer-implemented method for monitoring switching time of an electrical switching component immersed in a liquid | |
| US11359944B2 (en) | System and method for spatially resolved determination of at least one physical or chemical process variable | |
| US20230278567A1 (en) | Autonomous driving control apparatus and method thereof | |
| CN113051700B (en) | Equipment reliability monitoring method and device | |
| CN107948989B (en) | Method and device for calculating networking time of mobile terminal | |
| CN116978440B (en) | Memory chip voltage adjustment method, device, equipment and medium | |
| CN114650048B (en) | Key control device, key control method, key control device, storage medium and electronic device | |
| KR102361641B1 (en) | Method for processing location information and method for processing measurement information including the same | |
| KR20190091700A (en) | Predictive maintenance method and system of facilities by studying type of electricity consumption data using facilities control characteristic |
Legal Events
| Date | Code | Title | Description |
|---|---|---|---|
| PUAI | Public reference made under article 153(3) epc to a published international application that has entered the european phase |
Free format text: ORIGINAL CODE: 0009012 |
|
| STAA | Information on the status of an ep patent application or granted ep patent |
Free format text: STATUS: REQUEST FOR EXAMINATION WAS MADE |
|
| 17P | Request for examination filed |
Effective date: 20240209 |
|
| AK | Designated contracting states |
Kind code of ref document: A1 Designated state(s): AL AT BE BG CH CY CZ DE DK EE ES FI FR GB GR HR HU IE IS IT LI LT LU LV MC ME MK MT NL NO PL PT RO RS SE SI SK SM TR |
|
| GRAP | Despatch of communication of intention to grant a patent |
Free format text: ORIGINAL CODE: EPIDOSNIGR1 |
|
| STAA | Information on the status of an ep patent application or granted ep patent |
Free format text: STATUS: GRANT OF PATENT IS INTENDED |
|
| INTG | Intention to grant announced |
Effective date: 20250605 |
|
| GRAS | Grant fee paid |
Free format text: ORIGINAL CODE: EPIDOSNIGR3 |
|
| GRAA | (expected) grant |
Free format text: ORIGINAL CODE: 0009210 |
|
| STAA | Information on the status of an ep patent application or granted ep patent |
Free format text: STATUS: THE PATENT HAS BEEN GRANTED |
|
| AK | Designated contracting states |
Kind code of ref document: B1 Designated state(s): AL AT BE BG CH CY CZ DE DK EE ES FI FR GB GR HR HU IE IS IT LI LT LU LV MC ME MK MT NL NO PL PT RO RS SE SI SK SM TR |
|
| REG | Reference to a national code |
Ref country code: CH Ref legal event code: F10 Free format text: ST27 STATUS EVENT CODE: U-0-0-F10-F00 (AS PROVIDED BY THE NATIONAL OFFICE) Effective date: 20251105 Ref country code: GB Ref legal event code: FG4D |
|
| REG | Reference to a national code |
Ref country code: DE Ref legal event code: R096 Ref document number: 602023008223 Country of ref document: DE |
|
| P01 | Opt-out of the competence of the unified patent court (upc) registered |
Free format text: CASE NUMBER: UPC_APP_0011517_4498047/2025 Effective date: 20251029 |
|
| REG | Reference to a national code |
Ref country code: IE Ref legal event code: FG4D |
|
| P02 | Opt-out of the competence of the unified patent court (upc) changed |
Free format text: CASE NUMBER: UPC_APP_0012957_4498047/2025 Effective date: 20251112 |
|
| REG | Reference to a national code |
Ref country code: NL Ref legal event code: MP Effective date: 20251105 |
|
| PG25 | Lapsed in a contracting state [announced via postgrant information from national office to epo] |
Ref country code: ES Free format text: LAPSE BECAUSE OF FAILURE TO SUBMIT A TRANSLATION OF THE DESCRIPTION OR TO PAY THE FEE WITHIN THE PRESCRIBED TIME-LIMIT Effective date: 20251105 |
|
| REG | Reference to a national code |
Ref country code: LT Ref legal event code: MG9D |
|
| PG25 | Lapsed in a contracting state [announced via postgrant information from national office to epo] |
Ref country code: NO Free format text: LAPSE BECAUSE OF FAILURE TO SUBMIT A TRANSLATION OF THE DESCRIPTION OR TO PAY THE FEE WITHIN THE PRESCRIBED TIME-LIMIT Effective date: 20260205 |
|
| PG25 | Lapsed in a contracting state [announced via postgrant information from national office to epo] |
Ref country code: AT Free format text: LAPSE BECAUSE OF FAILURE TO SUBMIT A TRANSLATION OF THE DESCRIPTION OR TO PAY THE FEE WITHIN THE PRESCRIBED TIME-LIMIT Effective date: 20251105 Ref country code: HR Free format text: LAPSE BECAUSE OF FAILURE TO SUBMIT A TRANSLATION OF THE DESCRIPTION OR TO PAY THE FEE WITHIN THE PRESCRIBED TIME-LIMIT Effective date: 20251105 Ref country code: FI Free format text: LAPSE BECAUSE OF FAILURE TO SUBMIT A TRANSLATION OF THE DESCRIPTION OR TO PAY THE FEE WITHIN THE PRESCRIBED TIME-LIMIT Effective date: 20251105 |
|
| REG | Reference to a national code |
Ref country code: AT Ref legal event code: MK05 Ref document number: 1854801 Country of ref document: AT Kind code of ref document: T Effective date: 20251105 |
|
| PG25 | Lapsed in a contracting state [announced via postgrant information from national office to epo] |
Ref country code: NL Free format text: LAPSE BECAUSE OF FAILURE TO SUBMIT A TRANSLATION OF THE DESCRIPTION OR TO PAY THE FEE WITHIN THE PRESCRIBED TIME-LIMIT Effective date: 20251105 |
|
| PG25 | Lapsed in a contracting state [announced via postgrant information from national office to epo] |
Ref country code: RS Free format text: LAPSE BECAUSE OF FAILURE TO SUBMIT A TRANSLATION OF THE DESCRIPTION OR TO PAY THE FEE WITHIN THE PRESCRIBED TIME-LIMIT Effective date: 20260205 |
|
| PG25 | Lapsed in a contracting state [announced via postgrant information from national office to epo] |
Ref country code: IS Free format text: LAPSE BECAUSE OF FAILURE TO SUBMIT A TRANSLATION OF THE DESCRIPTION OR TO PAY THE FEE WITHIN THE PRESCRIBED TIME-LIMIT Effective date: 20260305 |
|
| PG25 | Lapsed in a contracting state [announced via postgrant information from national office to epo] |
Ref country code: PT Free format text: LAPSE BECAUSE OF FAILURE TO SUBMIT A TRANSLATION OF THE DESCRIPTION OR TO PAY THE FEE WITHIN THE PRESCRIBED TIME-LIMIT Effective date: 20260305 |
|
| PG25 | Lapsed in a contracting state [announced via postgrant information from national office to epo] |
Ref country code: PL Free format text: LAPSE BECAUSE OF FAILURE TO SUBMIT A TRANSLATION OF THE DESCRIPTION OR TO PAY THE FEE WITHIN THE PRESCRIBED TIME-LIMIT Effective date: 20251105 |
|
| PG25 | Lapsed in a contracting state [announced via postgrant information from national office to epo] |
Ref country code: LV Free format text: LAPSE BECAUSE OF FAILURE TO SUBMIT A TRANSLATION OF THE DESCRIPTION OR TO PAY THE FEE WITHIN THE PRESCRIBED TIME-LIMIT Effective date: 20251105 |
|
| PG25 | Lapsed in a contracting state [announced via postgrant information from national office to epo] |
Ref country code: BG Free format text: LAPSE BECAUSE OF FAILURE TO SUBMIT A TRANSLATION OF THE DESCRIPTION OR TO PAY THE FEE WITHIN THE PRESCRIBED TIME-LIMIT Effective date: 20251105 |