EP4492306A1 - Generating vehicle logistic plan and maintenance plan with graphical model - Google Patents
Generating vehicle logistic plan and maintenance plan with graphical model Download PDFInfo
- Publication number
- EP4492306A1 EP4492306A1 EP24179584.8A EP24179584A EP4492306A1 EP 4492306 A1 EP4492306 A1 EP 4492306A1 EP 24179584 A EP24179584 A EP 24179584A EP 4492306 A1 EP4492306 A1 EP 4492306A1
- Authority
- EP
- European Patent Office
- Prior art keywords
- maintenance
- plan
- vehicle
- logistic
- vehicles
- Prior art date
- Legal status (The legal status is an assumption and is not a legal conclusion. Google has not performed a legal analysis and makes no representation as to the accuracy of the status listed.)
- Pending
Links
Images






Classifications
-
- G—PHYSICS
- G06—COMPUTING OR CALCULATING; COUNTING
- G06Q—INFORMATION AND COMMUNICATION TECHNOLOGY [ICT] SPECIALLY ADAPTED FOR ADMINISTRATIVE, COMMERCIAL, FINANCIAL, MANAGERIAL OR SUPERVISORY PURPOSES; SYSTEMS OR METHODS SPECIALLY ADAPTED FOR ADMINISTRATIVE, COMMERCIAL, FINANCIAL, MANAGERIAL OR SUPERVISORY PURPOSES, NOT OTHERWISE PROVIDED FOR
- G06Q10/00—Administration; Management
- G06Q10/20—Administration of product repair or maintenance
-
- G—PHYSICS
- G06—COMPUTING OR CALCULATING; COUNTING
- G06Q—INFORMATION AND COMMUNICATION TECHNOLOGY [ICT] SPECIALLY ADAPTED FOR ADMINISTRATIVE, COMMERCIAL, FINANCIAL, MANAGERIAL OR SUPERVISORY PURPOSES; SYSTEMS OR METHODS SPECIALLY ADAPTED FOR ADMINISTRATIVE, COMMERCIAL, FINANCIAL, MANAGERIAL OR SUPERVISORY PURPOSES, NOT OTHERWISE PROVIDED FOR
- G06Q10/00—Administration; Management
- G06Q10/06—Resources, workflows, human or project management; Enterprise or organisation planning; Enterprise or organisation modelling
- G06Q10/063—Operations research, analysis or management
- G06Q10/0631—Resource planning, allocation, distributing or scheduling for enterprises or organisations
Definitions
- This disclosure pertains to vehicle maintenance resource allocation and vehicle maintenance scheduling.
- Aircraft maintenance is often highly logistically complex, since it utilizes many different types of resources that vary between different types of aircraft. When supplying these resources to the locations at which aircraft maintenance is performed, resource shortages and surpluses may occur as a result of inaccurate maintenance resource allocation. Thus, maintenance to an aircraft may be delayed, or additional costs may be incurred by oversupplying a resource to a particular location.
- Scheduling aircraft maintenance in time-limited scenarios also presents additional challenges.
- the success or failure to achieve a mission objective may depend upon the number of aircraft available.
- the objectives of an aircraft maintenance schedule may accordingly change during an active mission phase.
- the availability of maintenance resources and the ability to perform maintenance on aircraft may be more limited during an active mission phase than at other times.
- a computing system including one or more processing devices configured to generate a graphical model of a plurality of locations, a plurality of vehicles, and a plurality of vehicle maintenance resources.
- the one or more processing devices are further configured to receive, for each vehicle of the plurality of vehicles, respective vehicle health signal data and maintenance event data.
- the one or more processing devices are further configured to compute a logistic plan based at least in part on the graphical model.
- the logistic plan includes an assignment of the vehicles and the vehicle maintenance resources among the plurality of locations. Computing the logistic plan includes determining that the assignment of the vehicle maintenance resources satisfies a vulnerability assessment constraint.
- the one or more processing devices are further configured to compute a maintenance plan for the plurality of vehicles that minimizes or maximizes a maintenance plan objective function.
- Each of the maintenance plan generating iterations includes, based at least in part on the vehicle health signal data, the maintenance event data, and the logistic plan, computing the maintenance plan for the plurality of vehicles.
- Each of the maintenance plan generating iterations further includes determining whether performing the maintenance plan when the vehicle maintenance resources have the assignment indicated in the logistic plan would violate the vulnerability assessment constraint.
- Each of the maintenance plan generating iterations further includes, if performing the maintenance plan would violate the vulnerability assessment constraint, modifying the logistic plan.
- the one or more processing devices are further configured to output the logistic plan and the maintenance plan.
- Systems and methods are provided below that allow vehicle maintenance to be scheduled in a manner that depends upon the logistical network in which vehicles and maintenance resources are situated.
- the systems and methods discussed below are configured to generate a vehicle maintenance plan that approximately minimizes or maximizes a maintenance plan objective function.
- the maintenance plan is generated using a logistic plan that assigns the vehicle maintenance resources to the locations.
- the vehicle maintenance plan is generated to be robust to shocks to the logistical network, such that the maintenance plan satisfies a vulnerability constraint on logistic plan.
- the logistic plan and the maintenance plan are iteratively updated to satisfy the criteria of both the logistic plan generation and the maintenance plan generation, thereby integrating the computation of resource assignments and vehicle maintenance schedules.
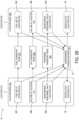
- FIG. 1 schematically shows a computing system 10 at which the logistic plan and the maintenance plan are generated, according to one example embodiment.
- the computing system 10 shown in FIG. 1 includes one or more processing devices 12 and one or more memory devices 14.
- the one or more processing devices 12 include, for example, one or more central processing units (CPUs), one or more graphics processing units (GPUs), and/or one or more other hardware accelerators.
- the one or more memory devices 14 include, for example, one or more volatile memory devices and one or more non-volatile storage devices.
- One or more user input devices and one or more user output devices are also included in the computing system 10 in some examples.
- the one or more processing devices 12 and the one or more memory devices 14 are included in one or more components that combine processor and memory functionality, such as a system-on-a-chip (SoC). Additionally or alternatively, in some examples, the one or more processing devices 12 and the one or more memory devices 14 are distributed across a plurality of physical computing systems, such as a plurality of networked computing devices located in a data center.
- SoC system-on-a-chip
- the one or more processing devices 12 are further configured to input the logistic plan 41 into a maintenance plan generating module 60 at which the maintenance plan 61 is generated.
- the maintenance plan generating module 60 includes a trained machine learning model 70.
- the one or more processing devices 12 are further configured to execute a loop in which the logistic plan 41 and the maintenance plan 61 are iteratively checked against the one or more vulnerability assessment constraints 51 at the vulnerability assessor 50 and are modified if the one or more vulnerability assessment constraints 51 are violated.
- the one or more processing devices 12 are configured to compute the maintenance plan 61 at the maintenance plan generating module 60 over a plurality of maintenance plan generating iterations 74.
- the one or more processing devices 12 are further configured to produce an output 80 that includes the logistic plan 41 and the maintenance plan 61.
- the one or more processing devices 12 are configured to convey the output 80 to one or more additional computing processes.
- the one or more processing devices 12 are configured to output the output 80 to a user interface.
- FIG. 2A schematically shows the computing system 10 in additional detail when the one or more processing devices 12 receive the input data 20 and generate the graphical model 31.
- the input data 20 includes a plurality of locations 21, a plurality of vehicles 22, and a plurality of vehicle maintenance resources 24.
- the vehicles 22 are aircraft, such as a plurality of unmanned aerial vehicles (UAVs) and/or a plurality of aircraft configured to be flown by onboard pilots.
- the vehicle maintenance resources 24 include maintenance personnel 24A configured to perform maintenance on the vehicles 22.
- the vehicle maintenance resources 24 shown in the example of FIG. 2A further include line ready units (LRUs) 24B configured to be installed in the vehicles 22.
- the vehicle maintenance resources 24 include fuel 24C.
- the vehicle maintenance resources 24 are encoded in a maintenance resource directed acyclic graph (DAG) 23.
- the maintenance resource DAG 23 expresses dependencies between one or more types of LRUs 24B and/or one or more types of maintenance personnel 24A included among the vehicle maintenance resources 24.
- the maintenance resource DAG 23 indicates types of maintenance that the maintenance personnel 24A are trained to perform. In this example, those types of maintenance are indicated by the types of LRUs 24B used to perform the maintenance, thereby expressing dependencies between the vehicle maintenance personnel 24A and the LRUs 24B.
- the one or more processing devices 12 are configured to refer to the maintenance resource DAG 23 when determining whether a maintenance action 28 is performable.
- the maintenance resource DAG 23 is expressed as a set of tuples of vehicle maintenance resources 24. Each tuple of vehicle maintenance resources 24 is associated with a respective maintenance action 28 and indicates the vehicle maintenance resources 24 that are used to perform that maintenance action 28.
- the graphical model 31 is a petrinet (also known as a place-transition network).
- the graphical model 31 includes a plurality of nodes, which include a plurality of location nodes 32 that indicate the locations 21.
- the plurality of nodes further includes a plurality of place transition nodes 33 that indicate respective transitions between the locations 21.
- the plurality of nodes further includes a plurality of maintenance transition nodes 34 that indicate a respective plurality of maintenance actions 28 performable at a plurality of vehicles 22.
- the graphical model 31 further includes a plurality of edges 35 between the nodes.
- the graphical model 31 further includes a plurality of tokens, including a plurality of vehicle tokens 36 that represent the vehicles 22 and a plurality of resource tokens 38 that represent the vehicle maintenance resources 24.
- the vehicle tokens 36 and the vehicle maintenance resources 24 are configured to be moveable between the nodes of the graphical model 31.
- the vehicle tokens 36 have respective vehicle token status indicators 37 that encode respective maintenance statuses of the vehicles 22.
- the vehicle token status indicator 37 of a vehicle 22 indicates demand for a maintenance action 28 at the vehicle 22, such as refueling the vehicle 22 or replacing an LRU 24B.
- the vehicle token status indicator 37 acts as a vehicle health indicator that specifies whether the components of the vehicle 22 are functional.
- FIG. 2B schematically shows a graphical model 31 according to a simplified example in which the graphical model 31 includes one vehicle 22, two locations 21A and 21B, one type of maintenance personnel 24A, one type of LRU 24B, and one type of fuel 24C.
- the graphical model 31 includes respective location nodes 32A and 32B corresponding to the locations 21A and 21B.
- the graphical model 31 further includes a personnel transport node 33A, an LRU transport node 33B, and a fuel transport node 33C.
- the graphical model 31 includes a maintenance transition node 34.
- the graphical model 31 of FIG. 2B further includes a vehicle token 36, a maintenance personnel token 38A, an LRU token 38B, and a fuel token 38C. These nodes are shown when the vehicle 22, the maintenance personnel 24A, the LRU 24B, and the fuel 24C are located at the first location 21A and when they are located at the second location 21B.
- FIG. 2B further shows the edges 35 between the nodes.
- the one or more processing devices 12 are further configured to receive respective weighting coefficients 25 that are associated with the vehicle maintenance resources 24 and are represented in the maintenance resource DAG 23.
- the structure of the maintenance resource DAG 23, as well as the locations and vehicle token status indicators 37 of the vehicle tokens 36, is used to dynamically modify the weighting coefficients 25 in some examples.
- the weighting coefficients 25 are each associated with a vehicle maintenance resource 24 and with a location 21.
- the one or more processing devices 12 are configured to set the weighting coefficient 25 of that vehicle maintenance resource 24 to zero.
- the one or more processing devices 12 are further configured to reset the weighting coefficient 25 to its previous value when the vehicle maintenance resource 24 becomes eligible for use in a maintenance action 28 at its current location 21 or an adjacent location 21.
- the one or more processing devices 12 are further configured to generate the logistic plan 41 based at least in part on the weighting coefficients 25.
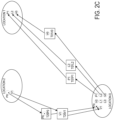
- FIG. 2C shows another example graphical model 31 that is structured as a petrinet.
- the graphical model 31 depicted in the example of FIG. 2C includes three locations, labeled as Location 0, Location 1, and Location 2. Vehicles V0, V1, and V2, personnel P0 and P1, and LRUs L0, L1, and L2 are also shown in the example of FIG. 2 .
- the graphical model 31 further includes transport nodes T01V0, T01P1, T01L2, T20P0, and T20V1, where the "T" at the beginning of the node names indicates "transport," the first digit indicates a source location number, the second digit indicates a destination location number, and the last two characters indicate the vehicle, personnel, or LRU for which that transport node indicates a transition.
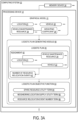
- FIG. 3A schematically shows the computing system 10 when the one or more processing devices 12 are configured to execute the logistic plan generating module 40 to compute the logistic plan 41 based at least in part on the graphical model 31.
- the logistic plan 41 as depicted in FIG. 3A , includes an assignment 42 of the vehicles 22 and the vehicle maintenance resources 24 among the plurality of locations 21.
- the one or more processing devices 12 are configured to compute the logistic plan 41 at least in part by minimizing or maximizing a logistic plan objective function 43.
- the one or more processing devices 12 are configured to compute the logistic plan objective function 43 based at least in part on respective numbers of the plurality of vehicle maintenance resources 24 located at each of the locations 21, the respective weighting coefficients 25 associated with the plurality of vehicle maintenance resources 24, and a total number of resource relocation events 47 specified by the logistic plan 41.
- the logistic plan objective function 43 is a utility function that the one or more processing devices 12 are configured to approximately maximize.
- the logistic plan objective function 43 in the example of FIG. 3A is expressed as a sum of a spare resource utility term 44, a neighboring location supply utility term 45, and a resource relocation event number term 46.
- P is the graphical model 31
- f i is a spare resource utility value
- g j is a neighboring location supply utility value.
- M is the total number of resource relocation events 47 that would be performed when relocating the vehicle maintenance resources 24 into the assignment 42 specified by the logistic plan 41.
- c 1 , c 2 , and c 3 are positive constants.
- n i,j is the number of vehicle maintenance resources 24 of type j at location i .
- n i , j is an m ⁇ n matrix of the values of n i , j , where m is the number of locations and n is the number of vehicle maintenance resource types, such that i ⁇ ⁇ 1, ... , m ⁇ and j ⁇ ⁇ 1, ... , n ⁇ .
- w i,j are the weighting coefficients 25 associated with respective vehicle maintenance resources 24 and locations 21.
- the weighting coefficients w i , j are monetary values of LRUs 24B.
- the weighting coefficients w i , j represent estimates of the usefulness of the vehicle maintenance resources 24 in a mission. As shown in the above equation for the spare resource utility value f i , the utility of keeping spare copies of a vehicle maintenance resource 24 declines exponentially at numbers of copies greater than one.
- f i,u is the sum of the spare resource utility values associated with the plurality of location 21 for a particular vehicle maintenance resource 24.
- v ⁇ u indicates "v is adjacent to u.” Accordingly, when the neighboring location supply utility value g j is computed, the one or more processing devices 12 are configured to compute a sum, over all pairs of non-identical vehicle maintenance resources 24, of utility values associated with exchanging the vehicle maintenance resources 24 included in that pair between neighboring locations 21.
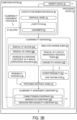
- FIG. 3B further shows the computing system 10 during generation of the logistic plan 41 when the one or more processing devices 12 are configured to execute the vulnerability assessor 50.
- Computing the logistic plan 41 includes determining that the assignment 42 of the vehicle maintenance resources 24 satisfies a vulnerability assessment constraint 51.
- the one or more processing devices 12 are configured to compute the logistic plan 41 over one or more vulnerability assessment iterations 54 in which a vulnerability assessment constraint 51 is checked and the logistic plan 41 is updated if the vulnerability assessment constraint 51 is violated.
- the one or more processing devices 12 are configured to check multiple different vulnerability assessment constraints 51 either separately or concurrently in the plurality of vulnerability assessment iterations 54.
- the one or more processing devices 12 are configured to apply a simulated adverse event 52 to the graphical model 31 to generate a perturbed graphical model 53.
- Types of simulated adverse events 52 that are applied to the graphical model 31 in some examples include removal of at least one edge from the graphical model 52A, removal of at least one node from the graphical model 52B, removal of at least one vehicle maintenance resource token 52C, an increase in the weighting coefficient of at least one vehicle maintenance resource 52D, or damage to at least one vehicle (expressed as a change in the vehicle token status indicator 37 of a vehicle token 36).
- the one or more processing devices 12 are configured to shock the logistic plan 41 in a manner that corresponds to a shock to a real-world logistical network.
- simulated adverse events 52 include inclement weather; vehicle malfunctions or damage; defects in LRUs 24B; increases in vehicle maintenance resource prices; illness or injury of maintenance personnel 24A; and adversarial attacks on locations 21, vehicles 22, and vehicle maintenance resources 24.
- a plurality of simulated adverse events 52 are applied to the graphical model 31 concurrently when the perturbed graphical model 53 is generated.
- the one or more processing devices 12 are further configured to assign respective event probabilities 55 to the simulated adverse events 52.
- the one or more processing devices 12 are further configured to compute respective probabilities of the simulated adverse events 52 co-occurring.
- the simulated adverse events 52 that co-occur are treated as statistically independent in some examples.
- the event probabilities 55 are modeled using a joint distribution 57 that represents probabilities of correlated adverse events (e.g., an inclement weather event occurring across multiple locations 21, an adversarial attack on multiple locations 21, or a defect in a batch of LRUs 24B).
- the joint distribution 57 is encoded in a Bayesian network in some examples.
- the one or more processing devices 12 are configured to model correlated adverse events as individual events with respective event probabilities 55 that are modeled as being independent of the event probabilities 55 of other simulated adverse events 52.
- the one or more processing devices 12 are configured to perform a respective vulnerability assessment iteration 54 for each simulated adverse event 52 or combination of simulated adverse events 52 that has an event probability 55 above a probability threshold 56.
- the probability threshold 56 is a user-adjustable parameter of the vulnerability assessor 50.
- the user is able to set the strictness of the vulnerability assessment according to characteristics of the mission.
- the one or more processing devices 12 are further configured to determining whether the perturbed graphical model 53 violates the vulnerability assessment constraint 51 when the vehicle maintenance resources 24 are assigned as indicated in the logistic plan 41.
- the vulnerability assessment constraint 51 is a connectedness constraint 51A on the graphical model 31.
- the connectedness constraint 51A is a constraint specifying that the graphical model 31 remains a connected graph if an edge 35 is removed.
- the vulnerability assessment constraint 51 is a minimum cut constraint 51B specifying that the graphical model 31 remains a connected graph if a plurality of edges 35 are removed, up to some predetermined number of edges 35. The predetermined number of edges is expressed as a fraction of the total number of edges 35 included in the graphical model 31 in some examples.
- the vulnerability assessment constraint 51 is a resource replaceability constraint 51C on the assignment 42 of the vehicle maintenance resources 24. In some examples, the resource replaceability constraint 51C specifies that a replacement LRU 24B is available for each LRU 24B with an RUL 29 below a predetermined RUL threshold.
- FIG. 3C schematically shows the computing system 10 when additional operations are performed at the one or more processing devices 12 during the vulnerability assessment.
- the one or more processing devices 12 are further configured to compute a minimal transition set 58 of one or more modifications 59 to the logistic plan 41 that resolve the violation of the vulnerability assessment constraint 51.
- the one or more processing devices 12 are further configured to apply the minimal transition set 58 to the logistic plan 41.
- Each of the modifications 59 included in the minimal transition set 58 is a relocation of a vehicle maintenance resource 24 within the graphical model 31.
- the minimal transition set 58 that produces to the logistic plan 41 with the highest value of the logistic plan objective function 43 is applied.
- the one or more processing devices 12 are further configured to perform another vulnerability assessment iteration 54.
- the vulnerability assessment iterations 54 are performed until each vulnerability assessment constraint 51 is satisfied.
- the one or more processing devices 12 are further configured to output the logistic plan 41 to the maintenance plan generating module 60.
- FIG. 4A schematically shows the computing system 10 when the one or more processing devices 12 are configured to execute the maintenance plan generating module 60.
- the maintenance plan 61 is computed in each of the plurality of maintenance plan generating iterations 74 using a current version of the logistic plan 41.
- the one or more processing devices 12 are configured to compute the maintenance plan 61 for the plurality of vehicles 22 such that the maintenance plan 61 minimizes or maximizes a maintenance plan objective function 73.
- the maintenance plan objective function 73 is a loss function that the one or more processing devices 12 are configured to approximately minimize, as discussed in further detail below.
- the one or more processing devices 12 are configured to generate a plurality of candidate maintenance plans 62 for the plurality of vehicles 22.
- the plurality of candidate maintenance plans 62 are associated with an active mission phase 63 of a mission that utilizes the plurality of vehicles 22.
- Parameters of the active mission phase 63 including a duration 64 of the active mission phase 63, one or more locations 21 at which the mission occurs, and the vehicles 22 used in the mission, are configured to be set by the user.
- the candidate maintenance plans 62 include orderings of maintenance actions 28 performable at the vehicles 22 during a maintenance recovery period, which is a period of time outside the active mission phase 63.
- the one or more processing devices 12 are configured to search across a plurality of different orderings 65 of the maintenance actions 28 for a maintenance plan 61 that has a lowest value of the maintenance plan objective function 73.
- the one or more processing devices 12 are configured to simulate that candidate maintenance plan 62 when each of the simulated adverse events 52 occurs.
- the candidate maintenance plans 62 are modeled under the adverse conditions at a trained machine learning model 70.
- the one or more processing devices 12 are configured to determining a number of the vehicles 22 that have respective maintenance-free operating periods (MFOPs) 72 shorter than the duration 64 of the active mission phase 63.
- MFOPs maintenance-free operating periods
- the trained machine learning model 70 is a counterfactual recurrent network (CRN).
- the trained machine learning model 70 in this example, is configured to compute the MFOPs 72 of the vehicles 22 at least in part by compute predicted vehicle health signal data 71 for the vehicles 22 based at least in part on the vehicle health signal data 26 and the maintenance event data 27.
- the one or more processing devices 12 are further configured to compute the MFOPs 72 of the vehicles 22 from the predicted vehicle health signal data 71.
- the one or more processing devices 12 are further configured to compute, over the plurality of simulated adverse events 52, an expected value of the number of vehicles 22 that have MFOPs 72 shorter than the duration 64.
- This expected value is the maintenance plan objective function 73 in the example of FIG. 4A .
- the expective value is computed as a sum of the event probabilities 55 of the simulated adverse events 52 multiplied by the numbers of vehicles with MFOPs 72 shorter than the duration 64, as approximated at the trained machine learning model 70.
- the one or more processing devices 12 are further configured to select, as the maintenance plan 61, a candidate maintenance plan 62 of the plurality of candidate maintenance plans 62 that has a lowest expected value of the number of vehicles 22 that have MFOPs 72 shorter than the duration 64. Accordingly, the one or more processing devices 12 are configured to approximately minimize the maintenance plan objective function 73. As shown in the example of FIG. 4A , the maintenance plan 61 includes an ordering 65 of the plurality of maintenance actions 28.
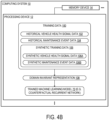
- FIG. 4B schematically shows the computing system 10 during training of the trained machine learning model 70.
- the trained machine learning model 70 is a CRN.
- the trained machine learning model 70 is trained using training data 100 that includes historical vehicle health signal data 102.
- the historical vehicle health signal data 102 is encoded as time series data and includes historical sensor data collected at sensors included in a plurality of vehicles.
- the vehicles at which the historical vehicle health signal data 102 is collected are the vehicles 22 modeled in the graphical model 31.
- the historical vehicle health signal data 102 is at least partially collected at one or more other vehicles.
- the training data 100 for the trained machine learning model 70 further includes historical maintenance event data 104.
- the historical maintenance event data 104 indicates historical maintenance actions performed at each of the vehicles from which the historical vehicle health signal data 102 is received.
- the training data 100 further includes synthetic training data 106.
- the synthetic training data 106 includes synthetic vehicle health signal data 106A and/or synthetic maintenance event data 106B.
- the synthetic training data 106 is used in such examples to augment the size of the training data set used to generate the trained machine learning model 70.
- the one or more processing devices 12 are further configured to convert the training data 100 into a domain invariant representation 108 prior to inputting the training data 100 into the machine learning model.
- the domain invariant representation 108 is a transformation of the training data 100 that accounts for imperfect correlation between the historical vehicle health signal data 102 and the historical maintenance event data 104.
- domain alignment, meta-learning, data augmentation, ensemble learning, or some other technique can be used to generate the domain invariant representation 108 from the historical vehicle health signal data 102 and the historical maintenance event data 104.
- the synthetic training data 106 is included in the domain invariant representation 108 in some examples.
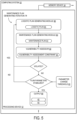
- FIG. 5 schematically shows the computing system 10 when the one or more processing devices 12 are configured to perform the plurality of maintenance plan generating iterations 74.
- the one or more processing devices 12 are further configured to determine whether performing the maintenance plan 61 when the vehicle maintenance resources 24 have the assignment 42 indicated in the logistic plan 41 would violate the one or more vulnerability assessment constraints 51.
- the one or more processing devices 12 are further configured to modify the logistic plan 41.
- the one or more processing devices 12 are further configured to recompute the maintenance plan 61 using the modified logistic plan 41.
- the logistic plan 41 and the maintenance plan 61 are iteratively computed over the plurality of maintenance plan generating iterations 74.
- the one or more processing devices 12 are configured to iteratively compute the logistic plan 41 and the maintenance plan 61 until the parameters of the logistic plan 41 and the maintenance plan 61 stabilize. In some examples, this stabilization occurs when the logistic plan 41 and the maintenance plan 61 remain unchanged, or approximately unchanged to within a parameter threshold 81, between a pair of successive maintenance plan generating iterations 74.
- the one or more processing devices 12 determine that a repetition of logistic plans 41 and maintenance plans 61 has occurred between non-successive maintenance plan generating iterations 74.
- the one or more processing devices 12, in such examples, are configured to select a logistic plan 41 and a maintenance plan 61 from among the logistic plans 41 and corresponding maintenance plans 61 included in the repeating loop.
- a logistic plan 41 and a maintenance plan 61 are still output in examples in which the iterative computation of the logistic plan 41 and the maintenance plan 61 does not converge.
- the graphical model includes a plurality of nodes and a plurality of edges between the nodes.
- the plurality of nodes include a plurality of location nodes that indicate the locations.
- the plurality of nodes further include, in some examples, a plurality of location transition nodes that indicate respective transitions between the locations.
- the graphical model further includes a plurality of tokens.
- the plurality of tokens include, in some examples, a plurality of vehicle tokens that represent the vehicles and a plurality of resource tokens that represent the vehicle maintenance resources. The tokens are configured to be moveable between the nodes of the graphical model.
- the graphical model is a petrinet.
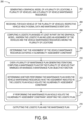
- the method 200 further includes receiving, for each vehicle of the plurality of vehicles, respective vehicle health signal data and maintenance event data.
- the vehicle health data is collected via sensors included in the plurality of vehicles.
- the maintenance event data indicates maintenance actions performed at the vehicles.
- the vehicle health signal data and the maintenance event data are expressed as time series data in some examples.
- the method 200 further includes computing a logistic plan based at least in part on the graphical model.
- the logistic plan includes an assignment of the vehicles and the vehicle maintenance resources among the plurality of locations.
- Computing the logistic plan at step 206 includes, at step 208, determining that the assignment of the vehicle maintenance resources satisfies a vulnerability assessment constraint.
- Example vulnerability assessment constraints include a connectedness constraint on the graphical model, a minimum cut constraint on the graphical model, or a resource replaceability constraint on the assignment of the vehicle maintenance resources.
- the method 200 further includes computing a maintenance plan for the plurality of vehicles that minimizes or maximizes a maintenance plan objective function.
- Step 210 includes, at step 212, determining whether performing the maintenance plan when the vehicle maintenance resources have the assignment indicated in the logistic plan would violate the vulnerability assessment constraint. If performing the maintenance plan would violate the vulnerability assessment constraint, step 210 further includes, at step 214, modifying the logistic plan. The maintenance plan is subsequently computed using the modified logistic plan in a subsequent maintenance plan generating iteration.
- the method 200 further includes outputting the logistic plan and the maintenance plan.
- the logistic plan and the maintenance plan are output to a user interface.
- FIGS. 6B-6D show additional steps of the method 200 that are performed in some examples.
- the method 200 further includes receiving a respective plurality of weighting coefficients associated with the vehicle maintenance resources.
- the weighting coefficients indicate prices associated with the vehicle maintenance resources.
- the weighting coefficients indicate usefulness of the vehicle maintenance resources in a mission.
- the weighting coefficients are dynamically modified in some examples to account for usability of the vehicle maintenance resources at their current locations.
- the method 200 further includes generating the logistic plan based at least in part on the weighting coefficients.
- the logistic plan is computed, in some examples, at least in part by minimizing or maximizing a logistic plan objective function.
- the logistic plan objective function can depend upon respective numbers of the plurality of vehicle maintenance resources located at each of the locations and a total number of resource relocation events specified by the logistic plan as well as on the weighting coefficients.
- the logistic plan objective function includes a spare resource utility term, a neighboring location supply utility term, and a resource relocation event number term.
- FIG. 6C shows additional steps of the method 200 that are performed in some examples when computing the logistic plan. The steps of FIG. 6C are performed in each of one or more vulnerability assessment iterations.
- the method 200 further includes applying a simulated adverse event to the graphical model to generate a perturbed graphical model. Examples of simulated adverse events include removal of at least one edge from the graphical model, removal of at least one node from the graphical model, removal of at least one vehicle maintenance resource token, an increase in the weighting coefficient of at least one vehicle maintenance resource, and damage to at least one vehicle. These changes to the graphical model are used, for example, to simulate inclement weather, adversarial attacks, supply shortages, or other types of adverse events.
- Combinations of simulated adverse events are also applied during the one or more vulnerability assessment constraints in some examples.
- the simulated adverse events have respective estimated event probabilities.
- a combination of simulated adverse events is tested when the estimated probability of that combination is above a predefined probability threshold.
- the simulated adverse events are treated as independent.
- a joint probability distribution is computed, and the probabilities of the combinations of simulated adverse events are computed using the joint probability distribution.
- the method 200 further includes determining whether the perturbed graphical model violates the vulnerability assessment constraint when the vehicle maintenance resources are assigned as indicated in the logistic plan. If the perturbed graphical model violates the vulnerability assessment constraint, steps 226 and 228 are performed. At step 226, the method 200 further includes computing a minimal transition set of one or more modifications to the logistic plan that resolve the violation of the vulnerability assessment constraint. The minimal transition set is a set of vehicle maintenance resource relocations. At step 228, the method 200 further includes applying the minimal transition set to the logistic plan. Thus, the logistic plan is adjusted to satisfy the vulnerability assessment constraint, and this adjustment is performed with a minimal number of resource relocations applied to the logistic plan that minimizes or maximizes the logistic plan objective function.
- FIG. 6D shows additional steps of the method 200 that are performed in each of the plurality of maintenance plan generating iterations when computing the maintenance plan.
- the method 200 further includes generating a plurality of candidate maintenance plans for the plurality of vehicles.
- the candidate maintenance plans are associated with an active mission phase of a mission that utilizes the plurality of vehicles.
- the candidate maintenance plan indicates a plurality of maintenance actions performed on the vehicles before and after the active mission phase.
- the method 200 further includes steps 232, 234, and 236, which are performed for each of the candidate maintenance plans.
- the method 200 further includes determining a number of the vehicles that have respective MFOPs shorter than a duration of the active mission phase.
- Step 232 is performed at a trained machine learning model in the example of FIG. 6D .
- the trained machine learning model is a counterfactual recurrent network (CRN).
- determining the MFOPs at step 232 includes, at step 234, computing predicted vehicle health signal data for each of the candidate maintenance plans.
- the predicted vehicle health signal data is computed at the trained machine learning model based at least in part on the vehicle health signal data and the maintenance event data.
- the MFOPs of the vehicles are then computed from the predicted vehicle health signal data.
- the method 200 further includes computing, over the plurality of simulated adverse events, an expected value of the number of vehicles that have MFOPs shorter than the duration. Subsequently to computing the respective expected value for each of the candidate maintenance plans, the method 200 further includes selecting, as the maintenance plan, a candidate maintenance plan of the plurality of candidate maintenance plans that has a lowest expected value of the number of vehicles that have MFOPs shorter than the duration. Thus, the expected value of the number of vehicles with MFOPs shorter than the duration of the active mission phase is used as a loss function when selecting the maintenance plan.
- a logistic plan and a maintenance plan for vehicle sustainment are generated in a manner that balances efficient resource usage with robustness to adverse events.
- the logistic plan and the maintenance plan generated using the above systems and methods allow high numbers of vehicles to remain operable without requiring maintenance during an active mission phase, even when accounting for adverse events that can occur at the logistic network.
- the systems and methods discussed above allow vehicle sustainment planning to be performed in a manner that efficiently increases the probability of mission success.
- the methods and processes described herein can be tied to a computing system of one or more computing devices.
- such methods and processes can be implemented as an executable computer-application program, a network-accessible computing service, an application-programming interface (API), a library, or a combination of the above and/or other compute resources.
- API application-programming interface
- FIG. 7 schematically shows a simplified representation of a computing system 300 configured to provide any to all of the computing functionality described herein.
- Computing system 300 can take the form of one or more network-accessible devices, server computers, mobile computing devices, Internet of Things (IoT) devices, embedded computing devices, vehicle computing systems, vehicle guidance systems, and/or other computing devices.
- IoT Internet of Things
- Computing system 300 includes a logic subsystem 302 and a storage subsystem 304.
- Computing system 300 can optionally include a display subsystem 306, input subsystem 308, communication subsystem 310, and/or other subsystems not shown in FIG. 7 .
- Logic subsystem 302 includes one or more physical devices configured to execute instructions.
- the logic subsystem can be configured to execute instructions that are part of one or more applications, services, or other logical constructs.
- the logic subsystem can include one or more hardware processors configured to execute software instructions. Additionally, or alternatively, the logic subsystem can include one or more hardware or firmware devices configured to execute hardware or firmware instructions.
- Processors of the logic subsystem can be single-core or multi-core, and the instructions executed thereon can be configured for sequential, parallel, and/or distributed processing. Individual components of the logic subsystem optionally can be distributed among two or more separate devices, which can be remotely located and/or configured for coordinated processing. Aspects of the logic subsystem can be virtualized and executed by remotely accessible, networked computing devices configured in a cloud-computing configuration.
- Storage subsystem 304 includes one or more physical devices configured to temporarily and/or permanently hold computer information such as data and instructions executable by the logic subsystem. When the storage subsystem includes two or more devices, the devices can be collocated and/or remotely located. Storage subsystem 304 can include volatile, nonvolatile, dynamic, static, read/write, read-only, random-access, sequential-access, location-addressable, file-addressable, and/or content-addressable devices. Storage subsystem 304 can include removable and/or built-in devices. When the logic subsystem executes instructions, the state of storage subsystem 304 can be transformed - e.g., to hold different data.
- logic subsystem 302 and storage subsystem 304 can be integrated together into one or more hardware-logic components.
- Such hardware-logic components can include program- and application-specific integrated circuits (PASIC / ASICs), program- and application-specific standard products (PSSP / ASSPs), system-on-a-chip (SOC), and complex programmable logic devices (CPLDs), for example.
- PASIC / ASICs program- and application-specific integrated circuits
- PSSP / ASSPs program- and application-specific standard products
- SOC system-on-a-chip
- CPLDs complex programmable logic devices
- the logic subsystem 302 and the storage subsystem 304 can cooperate to instantiate one or more logic machines.
- the term "machine” is used to collectively refer to the combination of hardware, firmware, software, instructions, and/or any other components cooperating to provide computer functionality. In other words, "machines" are never abstract ideas and always have a tangible form.
- a machine can be instantiated by a single computing device, or a machine can include two or more sub-components instantiated by two or more different computing devices.
- a machine includes a local component (e.g., software application executed by a computer processor) cooperating with a remote component (e.g., cloud computing service provided by a network of server computers).
- the software and/or other instructions that give a particular machine its functionality can optionally be saved as one or more unexecuted modules on one or more suitable storage devices.
- display subsystem 306 can be used to present a visual representation of data held by storage subsystem 304.
- This visual representation can take the form of a graphical user interface (GUI).
- GUI graphical user interface
- Display subsystem 306 can include one or more display devices utilizing virtually any type of technology.
- display subsystem can include one or more virtual-, augmented-, or mixed reality displays.
- input subsystem 308 can comprise or interface with one or more input devices.
- An input device can include a sensor device or a user input device. Examples of user input devices include a keyboard, mouse, or touch screen.
- the input subsystem can comprise or interface with selected natural user input (NUI) componentry.
- NUI natural user input
- Such componentry can be integrated or peripheral, and the transduction and/or processing of input actions can be handled on- or off-board.
- NUI componentry can include a microphone for speech and/or voice recognition; an infrared, color, stereoscopic, and/or depth camera for machine vision and/or gesture recognition; a head tracker, eye tracker, accelerometer, and/or gyroscope for motion detection and/or intent recognition.
- communication subsystem 310 can be configured to communicatively couple computing system 300 with one or more other computing devices.
- Communication subsystem 310 can include wired and/or wireless communication devices compatible with one or more different communication protocols.
- the communication subsystem can be configured for communication via personal-, local- and/or wide-area networks.
- a computing system comprising: one or more processing devices configured to: generate a graphical model of a plurality of locations, a plurality of vehicles, and a plurality of vehicle maintenance resources; receive, for each vehicle of the plurality of vehicles, respective vehicle health signal data and maintenance event data; compute a logistic plan based at least in part on the graphical model, wherein: the logistic plan includes an assignment of the vehicles and the vehicle maintenance resources among the plurality of locations; and computing the logistic plan includes determining that the assignment of the vehicle maintenance resources satisfies a vulnerability assessment constraint; over a plurality of maintenance plan generating iterations, compute a maintenance plan for the plurality of vehicles that minimizes or maximizes a maintenance plan objective function, wherein each of the maintenance plan generating iterations includes: based at least in part on the vehicle health signal data, the maintenance event data, and the logistic plan, computing the maintenance plan for the plurality of vehicles; determining whether performing the maintenance plan when the vehicle maintenance resources have the assignment indicated in the logistic plan would violate the vulnerability assessment constraint; and
- Clause 2 The computing system of Clause 1, wherein the graphical model includes: a plurality of nodes including a plurality of location nodes that indicate the locations; a plurality of edges between the nodes; and a plurality of tokens including a plurality of vehicle tokens that represent the vehicles and a plurality of resource tokens that represent the vehicle maintenance resources.
- Clause 3 The computing system of Clause 2, wherein the graphical model is a petrinet.
- Clause 4 The computing system of Clause 2, wherein the vulnerability assessment constraint is: a connectedness constraint on the graphical model; a minimum cut constraint on the graphical model; or a resource replaceability constraint on the assignment of the vehicle maintenance resources.
- the vulnerability assessment constraint is: a connectedness constraint on the graphical model; a minimum cut constraint on the graphical model; or a resource replaceability constraint on the assignment of the vehicle maintenance resources.
- Clause 5 The computing system of Clause 2, wherein the one or more processing devices are configured to compute the logistic plan at least in part by, in each of one or more vulnerability assessment iterations: applying a simulated adverse event to the graphical model to generate a perturbed graphical model; determining whether the perturbed graphical model violates the vulnerability assessment constraint when the vehicle maintenance resources are assigned as indicated in the logistic plan; and if the perturbed graphical model violates the vulnerability assessment constraint: computing a minimal transition set of one or more modifications to the logistic plan that resolve the violation of the vulnerability assessment constraint; and applying the minimal transition set to the logistic plan.
- Clause 6 The computing system of Clause 5, wherein the one or more processing devices are further configured to: receive a respective plurality of weighting coefficients associated with the vehicle maintenance resources; and generate the logistic plan based at least in part on the weighting coefficients.
- Clause 7 The computing system of Clause 6, wherein the simulated adverse event includes: removal of at least one edge from the graphical model; removal of at least one node from the graphical model; removal of at least one vehicle maintenance resource token; an increase in the weighting coefficient of at least one vehicle maintenance resource; or damage to at least one vehicle.
- Clause 8 The computing system of Clause 6, wherein the one or more processing devices are further configured to compute the logistic plan at least in part by minimizing or maximizing a logistic plan objective function.
- Clause 9 The computing system of Clause 8, wherein the one or more processing devices are configured to compute the logistic plan objective function based at least in part on: respective numbers of the plurality of vehicle maintenance resources located at each of the locations; the respective weighting coefficients associated with the plurality of vehicle maintenance resources; and a total number of resource relocation events specified by the logistic plan.
- Clause 10 The computing system of Clause 5, wherein the one or more processing devices are configured to compute the maintenance plan at least in part by, in each of the plurality of maintenance plan generating iterations: generating a plurality of candidate maintenance plans for the plurality of vehicles, wherein the candidate maintenance plans are associated with an active mission phase of a mission that utilizes the plurality of vehicles; and for each of the candidate maintenance plans: at a trained machine learning model, for each of the simulated adverse events, determining a number of the vehicles that have respective maintenance-free operating periods (MFOPs) shorter than a duration of the active mission phase; and computing, over the plurality of simulated adverse events, an expected value of the number of vehicles that have MFOPs shorter than the duration; and selecting, as the maintenance plan, a candidate maintenance plan of the plurality of candidate maintenance plans that has a lowest expected value of the number of vehicles that have MFOPs shorter than the duration.
- MFOPs maintenance-free operating periods
- Clause 11 The computing system of Clause 10, wherein the trained machine learning model is a counterfactual recurrent network (CRN) at which, for each of the candidate maintenance plans, the one or more processing devices are configured to compute predicted vehicle health signal data based at least in part on the vehicle health signal data and the maintenance event data.
- CNN counterfactual recurrent network
- Clause 12 The computing system of Clause 1, wherein the maintenance plan includes an ordering of a plurality of maintenance actions scheduled for performance at each vehicle of the plurality of vehicles.
- Clause 13 The computing system of Clause 1, wherein the graphical model indicates one or more types of line ready units (LRUs) and one or more types of maintenance personnel included among the plurality of vehicle maintenance resources.
- LRUs line ready units
- a method for use with a computing system comprising: generating a graphical model of a plurality of locations, a plurality of vehicles, and a plurality of vehicle maintenance resources; receiving, for each vehicle of the plurality of vehicles, respective vehicle health signal data and maintenance event data; computing a logistic plan based at least in part on the graphical model, wherein: the logistic plan includes an assignment of the vehicles and the vehicle maintenance resources among the plurality of locations; and computing the logistic plan includes determining that the assignment of the vehicle maintenance resources satisfies a vulnerability assessment constraint; over a plurality of maintenance plan generating iterations, computing a maintenance plan for the plurality of vehicles that minimizes or maximizes a maintenance plan objective function, wherein each of the maintenance plan generating iterations includes: based at least in part on the vehicle health signal data, the maintenance event data, and the logistic plan, computing the maintenance plan for the plurality of vehicles; determining whether performing the maintenance plan when the vehicle maintenance resources have the assignment indicated in the logistic plan would violate the vulnerability assessment constraint;
- Clause 15 The method of Clause 14, wherein the graphical model includes: a plurality of nodes including a plurality of location nodes that indicate the locations; a plurality of edges between the nodes; and a plurality of tokens including a plurality of vehicle tokens that represent the vehicles and a plurality of resource tokens that represent the vehicle maintenance resources.
- Clause 16 The method of Clause 15, wherein the graphical model is a petrinet.
- Clause 17 The method of Clause 14, wherein computing the logistic plan includes, in each of one or more vulnerability assessment iterations: applying a simulated adverse event to the graphical model to generate a perturbed graphical model; determining whether the perturbed graphical model violates the vulnerability assessment constraint when the vehicle maintenance resources are assigned as indicated in the logistic plan; and if the perturbed graphical model violates the vulnerability assessment constraint: computing a minimal transition set of one or more modifications to the logistic plan that resolve the violation of the vulnerability assessment constraint; and applying the minimal transition set to the logistic plan.
- computing the maintenance plan includes, in each of the plurality of maintenance plan generating iterations: generating a plurality of candidate maintenance plans for the plurality of vehicles, wherein the candidate maintenance plans are associated with an active mission phase of a mission that utilizes the plurality of vehicles; and for each of the candidate maintenance plans: at a trained machine learning model, for each of the simulated adverse events, determining a number of the vehicles that have respective maintenance-free operating periods (MFOPs) shorter than a duration of the active mission phase; and computing, over the plurality of simulated adverse events, an expected value of the number of vehicles that have MFOPs shorter than the duration; and selecting, as the maintenance plan, a candidate maintenance plan of the plurality of candidate maintenance plans that has a lowest expected value of the number of vehicles that have MFOPs shorter than the duration.
- MFOPs maintenance-free operating periods
- the trained machine learning model is a counterfactual recurrent network (CRN); and the method further comprises, at the CRN, computing predicted vehicle health signal data for each of the candidate maintenance plans based at least in part on the vehicle health signal data and the maintenance event data.
- CRN counterfactual recurrent network
- a computing system comprising: one or more processing devices configured to: generate a petrinet that includes: a plurality of nodes including: a plurality of location nodes that indicate a respective plurality of locations; a plurality of location transition nodes that indicate respective transitions between the locations; and a plurality of maintenance transition nodes that indicate a respective plurality of maintenance actions performable at a plurality of vehicles; a plurality of edges between the nodes; and a plurality of tokens including: a plurality of vehicle tokens that represent the vehicles; and a plurality of resource tokens that represent vehicle maintenance resources with which the vehicle maintenance actions are performable; receive, for each vehicle of the plurality of vehicles, respective vehicle health signal data and maintenance event data; compute a logistic plan based at least in part on the graphical model, wherein: the logistic plan includes an assignment of the vehicles and the vehicle maintenance resources among the plurality of locations; and computing the logistic plan includes determining that the assignment of the vehicle maintenance resources satisfies a vulnerability assessment constraint; over a pluralit
Landscapes
- Business, Economics & Management (AREA)
- Human Resources & Organizations (AREA)
- Engineering & Computer Science (AREA)
- Strategic Management (AREA)
- Economics (AREA)
- Entrepreneurship & Innovation (AREA)
- Physics & Mathematics (AREA)
- Quality & Reliability (AREA)
- Operations Research (AREA)
- Tourism & Hospitality (AREA)
- Marketing (AREA)
- General Business, Economics & Management (AREA)
- General Physics & Mathematics (AREA)
- Theoretical Computer Science (AREA)
- Development Economics (AREA)
- Educational Administration (AREA)
- Game Theory and Decision Science (AREA)
- Management, Administration, Business Operations System, And Electronic Commerce (AREA)
Abstract
A computing system including one or more processing devices configured to generate a graphical model of locations, vehicles, and vehicle maintenance resources. The processing devices receive vehicle health signal data and maintenance event data. The processing devices compute a logistic plan based on the graphical model. The logistic plan includes an assignment of the vehicles and resources among the locations. Computing the logistic plan includes determining that the assignment satisfies a vulnerability assessment constraint. Over a plurality of maintenance plan generating iterations, the processing devices compute a maintenance plan for the vehicles that minimizes or maximizes a maintenance plan objective function. Each of the iterations includes computing the maintenance plan based on the vehicle health signal data, the maintenance event data, and the logistic plan, and modifying the logistic plan if performing the maintenance plan would violate the vulnerability assessment constraint. The processing devices output the logistic and maintenance plans.
Description
- This disclosure pertains to vehicle maintenance resource allocation and vehicle maintenance scheduling.
- Aircraft maintenance is often highly logistically complex, since it utilizes many different types of resources that vary between different types of aircraft. When supplying these resources to the locations at which aircraft maintenance is performed, resource shortages and surpluses may occur as a result of inaccurate maintenance resource allocation. Thus, maintenance to an aircraft may be delayed, or additional costs may be incurred by oversupplying a resource to a particular location.
- Scheduling aircraft maintenance in time-limited scenarios also presents additional challenges. In such scenarios, the success or failure to achieve a mission objective may depend upon the number of aircraft available. The objectives of an aircraft maintenance schedule may accordingly change during an active mission phase. In addition, the availability of maintenance resources and the ability to perform maintenance on aircraft may be more limited during an active mission phase than at other times.
- According to one aspect of the present disclosure, a computing system is provided, including one or more processing devices configured to generate a graphical model of a plurality of locations, a plurality of vehicles, and a plurality of vehicle maintenance resources. The one or more processing devices are further configured to receive, for each vehicle of the plurality of vehicles, respective vehicle health signal data and maintenance event data. The one or more processing devices are further configured to compute a logistic plan based at least in part on the graphical model. The logistic plan includes an assignment of the vehicles and the vehicle maintenance resources among the plurality of locations. Computing the logistic plan includes determining that the assignment of the vehicle maintenance resources satisfies a vulnerability assessment constraint. Over a plurality of maintenance plan generating iterations, the one or more processing devices are further configured to compute a maintenance plan for the plurality of vehicles that minimizes or maximizes a maintenance plan objective function. Each of the maintenance plan generating iterations includes, based at least in part on the vehicle health signal data, the maintenance event data, and the logistic plan, computing the maintenance plan for the plurality of vehicles. Each of the maintenance plan generating iterations further includes determining whether performing the maintenance plan when the vehicle maintenance resources have the assignment indicated in the logistic plan would violate the vulnerability assessment constraint. Each of the maintenance plan generating iterations further includes, if performing the maintenance plan would violate the vulnerability assessment constraint, modifying the logistic plan. The one or more processing devices are further configured to output the logistic plan and the maintenance plan.
-
-
FIG. 1 schematically shows a computing system at which a logistic plan and the maintenance plan are generated for a plurality of vehicles, according to one example embodiment. -
FIG. 2A schematically shows the computing system when the one or more processing devices included in the computing system receive input data and generate a graphical model, according to the example ofFIG. 1 . -
FIG. 2B schematically shows an example graphical model, according to the example ofFIG. 2A . -
FIG. 2C schematically shows another example graphical model that is structured as a petrinet, according to the example ofFIG. 2A . -
FIG. 3A schematically shows the computing system when the one or more processing devices are configured to execute a logistic plan generating module to compute the logistic plan, according to the example ofFIG. 1 . -
FIGS. 3B-3C schematically show the computing system when the one or more processing devices are configured to execute a vulnerability assessor during generation of the logistic plan, according to the example ofFIG. 3A . -
FIG. 4A schematically shows the computing system when the one or more processing devices are configured to compute a maintenance plan for the plurality of vehicles by executing a maintenance plan generating module, according to the example ofFIG. 1 . -
FIG. 4B schematically shows the computing system during training of the trained machine learning model used when generating the maintenance plan, according to the example ofFIG. 4A . -
FIG. 5 schematically shows the computing system when the one or more processing devices are configured to perform a plurality of maintenance plan generating iterations in which the logistic plan and the maintenance plan are iteratively computed, according to the example ofFIG. 1 . -
FIG. 6A shows a flowchart of a method for use with a computing system to compute a logistic plan and a maintenance plan for sustainment of a plurality of vehicles, according to the example ofFIG. 1 . -
FIG. 6B shows additional steps of the method ofFIG. 6A that are performed in some examples when receiving the input data and generating the logistic plan. -
FIG. 6C shows additional steps of the method ofFIG. 6A that are performed in some examples when computing the logistic plan. -
FIG. 6D shows additional steps of the method ofFIG. 6A that are performed, according to some examples, in each of a plurality of maintenance plan generating iterations when computing the maintenance plan. -
FIG. 7 schematically shows an example computing system in which the computing system ofFIG. 1 may be instantiated. - Systems and methods are provided below that allow vehicle maintenance to be scheduled in a manner that depends upon the logistical network in which vehicles and maintenance resources are situated. The systems and methods discussed below are configured to generate a vehicle maintenance plan that approximately minimizes or maximizes a maintenance plan objective function. The maintenance plan is generated using a logistic plan that assigns the vehicle maintenance resources to the locations. In addition, the vehicle maintenance plan is generated to be robust to shocks to the logistical network, such that the maintenance plan satisfies a vulnerability constraint on logistic plan. The logistic plan and the maintenance plan are iteratively updated to satisfy the criteria of both the logistic plan generation and the maintenance plan generation, thereby integrating the computation of resource assignments and vehicle maintenance schedules.
-
FIG. 1 schematically shows acomputing system 10 at which the logistic plan and the maintenance plan are generated, according to one example embodiment. Thecomputing system 10 shown inFIG. 1 includes one ormore processing devices 12 and one ormore memory devices 14. The one ormore processing devices 12 include, for example, one or more central processing units (CPUs), one or more graphics processing units (GPUs), and/or one or more other hardware accelerators. The one ormore memory devices 14 include, for example, one or more volatile memory devices and one or more non-volatile storage devices. One or more user input devices and one or more user output devices are also included in thecomputing system 10 in some examples. - In some examples, the one or
more processing devices 12 and the one ormore memory devices 14 are included in one or more components that combine processor and memory functionality, such as a system-on-a-chip (SoC). Additionally or alternatively, in some examples, the one ormore processing devices 12 and the one ormore memory devices 14 are distributed across a plurality of physical computing systems, such as a plurality of networked computing devices located in a data center. -
FIG. 1 schematically shows a plurality of modules configured to be executed at the one ormore processing devices 12 of thecomputing system 10. The one ormore processing devices 12 are configured to transmitinput data 20 to a graphicalmodel generating module 30. Agraphical model 31 computed at the graphicalmodel generating module 30 based on theinput data 20 is then received as input at a logisticplan generating module 40, which is configured to generate alogistic plan 41. When thelogistic plan 41 is generated, the logisticplan generating module 40 communicates with avulnerability assessor 50 to determine whether one or morevulnerability assessment constraints 51 are violated. - The one or
more processing devices 12 are further configured to input thelogistic plan 41 into a maintenanceplan generating module 60 at which themaintenance plan 61 is generated. The maintenanceplan generating module 60, as depicted in the example ofFIG. 1 , includes a trainedmachine learning model 70. The one ormore processing devices 12 are further configured to execute a loop in which thelogistic plan 41 and themaintenance plan 61 are iteratively checked against the one or morevulnerability assessment constraints 51 at thevulnerability assessor 50 and are modified if the one or morevulnerability assessment constraints 51 are violated. Thus, by executing this loop, the one ormore processing devices 12 are configured to compute themaintenance plan 61 at the maintenanceplan generating module 60 over a plurality of maintenance plan generating iterations 74. - When the loop reaches stable versions of the
logistic plan 41 and themaintenance plan 61, the one ormore processing devices 12 are further configured to produce anoutput 80 that includes thelogistic plan 41 and themaintenance plan 61. The one ormore processing devices 12 are configured to convey theoutput 80 to one or more additional computing processes. In some examples, the one ormore processing devices 12 are configured to output theoutput 80 to a user interface. -
FIG. 2A schematically shows thecomputing system 10 in additional detail when the one ormore processing devices 12 receive theinput data 20 and generate thegraphical model 31. In the example ofFIG. 2A , theinput data 20 includes a plurality oflocations 21, a plurality ofvehicles 22, and a plurality ofvehicle maintenance resources 24. In some examples, thevehicles 22 are aircraft, such as a plurality of unmanned aerial vehicles (UAVs) and/or a plurality of aircraft configured to be flown by onboard pilots. Thevehicle maintenance resources 24 includemaintenance personnel 24A configured to perform maintenance on thevehicles 22. Thevehicle maintenance resources 24 shown in the example ofFIG. 2A further include line ready units (LRUs) 24B configured to be installed in thevehicles 22. In addition, thevehicle maintenance resources 24 includefuel 24C. - In some examples, as shown in
FIG. 2A , thevehicle maintenance resources 24 are encoded in a maintenance resource directed acyclic graph (DAG) 23. Themaintenance resource DAG 23 expresses dependencies between one or more types ofLRUs 24B and/or one or more types ofmaintenance personnel 24A included among thevehicle maintenance resources 24. In one example, themaintenance resource DAG 23 indicates types of maintenance that themaintenance personnel 24A are trained to perform. In this example, those types of maintenance are indicated by the types ofLRUs 24B used to perform the maintenance, thereby expressing dependencies between thevehicle maintenance personnel 24A and theLRUs 24B. The one ormore processing devices 12 are configured to refer to themaintenance resource DAG 23 when determining whether amaintenance action 28 is performable. In some examples, themaintenance resource DAG 23 is expressed as a set of tuples ofvehicle maintenance resources 24. Each tuple ofvehicle maintenance resources 24 is associated with arespective maintenance action 28 and indicates thevehicle maintenance resources 24 that are used to perform thatmaintenance action 28. - In the example of
FIG. 2A , thegraphical model 31 is a petrinet (also known as a place-transition network). Thegraphical model 31 includes a plurality of nodes, which include a plurality oflocation nodes 32 that indicate thelocations 21. The plurality of nodes further includes a plurality ofplace transition nodes 33 that indicate respective transitions between thelocations 21. In addition, the plurality of nodes further includes a plurality ofmaintenance transition nodes 34 that indicate a respective plurality ofmaintenance actions 28 performable at a plurality ofvehicles 22. Thegraphical model 31 further includes a plurality ofedges 35 between the nodes. - The
graphical model 31 further includes a plurality of tokens, including a plurality ofvehicle tokens 36 that represent thevehicles 22 and a plurality ofresource tokens 38 that represent thevehicle maintenance resources 24. Thevehicle tokens 36 and thevehicle maintenance resources 24 are configured to be moveable between the nodes of thegraphical model 31. In the example ofFIG. 2A , thevehicle tokens 36 have respective vehicle token status indicators 37 that encode respective maintenance statuses of thevehicles 22. The vehicle token status indicator 37 of avehicle 22 indicates demand for amaintenance action 28 at thevehicle 22, such as refueling thevehicle 22 or replacing anLRU 24B. In this example, the vehicle token status indicator 37 acts as a vehicle health indicator that specifies whether the components of thevehicle 22 are functional. - As shown in the example of
FIG. 2A , theinput data 20 further includes vehiclehealth signal data 26 andmaintenance event data 27. The vehiclehealth signal data 26 includes sensor data collected from respective sensors included in the vehicles and indicates statuses of the components of thevehicles 22. The vehiclehealth signal data 26 is used to compute the vehicle token status indicators 37 associated with thevehicles 22 in some examples. Themaintenance event data 27 indicatesprior maintenance actions 28 performed at thevehicle 22. In some examples, themaintenance event data 27 is expressed as time series data in a maintenance event vector. In such examples, the elements of the maintenance event vector indicate time increments of the time series, and the values of those elements indicate types of maintenance actions 28 (including "no maintenance") that occurred at those time increments. The vehiclehealth signal data 26 and themaintenance event data 27 are used when computing themaintenance plan 61, as discussed in further detail below. -
FIG. 2B schematically shows agraphical model 31 according to a simplified example in which thegraphical model 31 includes onevehicle 22, twolocations maintenance personnel 24A, one type ofLRU 24B, and one type offuel 24C. As shown in the example ofFIG. 2B , thegraphical model 31 includesrespective location nodes locations graphical model 31 further includes apersonnel transport node 33A, anLRU transport node 33B, and afuel transport node 33C. In addition, thegraphical model 31 includes amaintenance transition node 34. - The
graphical model 31 ofFIG. 2B further includes avehicle token 36, a maintenance personnel token 38A, an LRU token 38B, and afuel token 38C. These nodes are shown when thevehicle 22, themaintenance personnel 24A, theLRU 24B, and thefuel 24C are located at thefirst location 21A and when they are located at thesecond location 21B.FIG. 2B further shows theedges 35 between the nodes. - Returning to the example of
FIG. 2A , the one ormore processing devices 12 are further configured to receiverespective weighting coefficients 25 that are associated with thevehicle maintenance resources 24 and are represented in themaintenance resource DAG 23. The structure of themaintenance resource DAG 23, as well as the locations and vehicle token status indicators 37 of thevehicle tokens 36, is used to dynamically modify theweighting coefficients 25 in some examples. In such examples, theweighting coefficients 25 are each associated with avehicle maintenance resource 24 and with alocation 21. When avehicle maintenance resource 24 is not usable to perform anymaintenance action 28 at itscurrent location 21 or anyadjacent locations 21, the one ormore processing devices 12 are configured to set theweighting coefficient 25 of thatvehicle maintenance resource 24 to zero. The one ormore processing devices 12 are further configured to reset theweighting coefficient 25 to its previous value when thevehicle maintenance resource 24 becomes eligible for use in amaintenance action 28 at itscurrent location 21 or anadjacent location 21. In addition, as discussed in further detail below, the one ormore processing devices 12 are further configured to generate thelogistic plan 41 based at least in part on theweighting coefficients 25. - In the example of
FIG. 2A , theinput data 20 further includes a respective remaining useful lifetime (RUL) 29 associated with eachLRU 24B. In some examples, theRUL 29 of anLRU 24B is used to dynamically update theweighting coefficient 25 of theLRU 24B to decrease theweighting coefficient 25 over time. TheRUL 29 is also used in some examples when checking one or morevulnerability assessment constraints 51, as discussed in further detail below. -
FIG. 2C shows another examplegraphical model 31 that is structured as a petrinet. Thegraphical model 31 depicted in the example ofFIG. 2C includes three locations, labeled asLocation 0,Location 1, andLocation 2. Vehicles V0, V1, and V2, personnel P0 and P1, and LRUs L0, L1, and L2 are also shown in the example ofFIG. 2 . Thegraphical model 31 further includes transport nodes T01V0, T01P1, T01L2, T20P0, and T20V1, where the "T" at the beginning of the node names indicates "transport," the first digit indicates a source location number, the second digit indicates a destination location number, and the last two characters indicate the vehicle, personnel, or LRU for which that transport node indicates a transition. The dashed lines around V1 atLocation 0 and around V0, P1, and L2 atLocation 1 indicate thatLocation 0 is the destination for the vehicle V1, and thatLocation 2 is the destination for the vehicle V0, the personnel P1, and the LRU L2. The other tokens are not relocated. Three instances of the personnel P0 are included in thegraphical model 31, one of which moves fromLocation 2 toLocation 0 and the other of which remain atLocation 0, as indicated by dots that represent the personnel tokens. -
FIG. 3A schematically shows thecomputing system 10 when the one ormore processing devices 12 are configured to execute the logisticplan generating module 40 to compute thelogistic plan 41 based at least in part on thegraphical model 31. Thelogistic plan 41, as depicted inFIG. 3A , includes anassignment 42 of thevehicles 22 and thevehicle maintenance resources 24 among the plurality oflocations 21. - The one or
more processing devices 12 are configured to compute thelogistic plan 41 at least in part by minimizing or maximizing a logistic planobjective function 43. The one ormore processing devices 12 are configured to compute the logistic planobjective function 43 based at least in part on respective numbers of the plurality ofvehicle maintenance resources 24 located at each of thelocations 21, therespective weighting coefficients 25 associated with the plurality ofvehicle maintenance resources 24, and a total number ofresource relocation events 47 specified by thelogistic plan 41. - In the example of
FIG. 3A , the logistic planobjective function 43 is a utility function that the one ormore processing devices 12 are configured to approximately maximize. The logistic planobjective function 43 in the example ofFIG. 3A is expressed as a sum of a spareresource utility term 44, a neighboring locationsupply utility term 45, and a resource relocationevent number term 46. Thus, in the example ofFIG. 3A , the logistic planobjective function 43 is given by:
graphical model 31, fi is a spare resource utility value, gj is a neighboring location supply utility value. M is the total number ofresource relocation events 47 that would be performed when relocating thevehicle maintenance resources 24 into theassignment 42 specified by thelogistic plan 41. c 1, c 2, and c 3 are positive constants. - In the above equation for the logistic plan
objective function 43, the spare resource utility value fi is given by:
vehicle maintenance resources 24 of type j at location i. n i,j is an m × n matrix of the values of n i,j , where m is the number of locations and n is the number of vehicle maintenance resource types, such that i ∈ {1, ... , m} and j ∈ {1, ... , n}. wi,j are theweighting coefficients 25 associated with respectivevehicle maintenance resources 24 andlocations 21. In some examples, the weighting coefficients w i,j are monetary values ofLRUs 24B. In other examples, the weighting coefficients w i,j represent estimates of the usefulness of thevehicle maintenance resources 24 in a mission. As shown in the above equation for the spare resource utility value fi , the utility of keeping spare copies of avehicle maintenance resource 24 declines exponentially at numbers of copies greater than one. - The neighboring location supply utility value gj is given by:

location 21 for a particularvehicle maintenance resource 24. fi,u is computed as follows:
more processing devices 12 are configured to compute a sum, over all pairs of non-identicalvehicle maintenance resources 24, of utility values associated with exchanging thevehicle maintenance resources 24 included in that pair betweenneighboring locations 21. -
FIG. 3B further shows thecomputing system 10 during generation of thelogistic plan 41 when the one ormore processing devices 12 are configured to execute thevulnerability assessor 50. Computing thelogistic plan 41 includes determining that theassignment 42 of thevehicle maintenance resources 24 satisfies avulnerability assessment constraint 51. The one ormore processing devices 12 are configured to compute thelogistic plan 41 over one or morevulnerability assessment iterations 54 in which avulnerability assessment constraint 51 is checked and thelogistic plan 41 is updated if thevulnerability assessment constraint 51 is violated. In some examples, the one ormore processing devices 12 are configured to check multiple differentvulnerability assessment constraints 51 either separately or concurrently in the plurality ofvulnerability assessment iterations 54. - In each of the
vulnerability assessment iterations 54, the one ormore processing devices 12 are configured to apply a simulatedadverse event 52 to thegraphical model 31 to generate a perturbedgraphical model 53. Types of simulatedadverse events 52 that are applied to thegraphical model 31 in some examples include removal of at least one edge from thegraphical model 52A, removal of at least one node from thegraphical model 52B, removal of at least one vehiclemaintenance resource token 52C, an increase in the weighting coefficient of at least onevehicle maintenance resource 52D, or damage to at least one vehicle (expressed as a change in the vehicle token status indicator 37 of a vehicle token 36). Accordingly, by applying the simulatedadverse event 52, the one ormore processing devices 12 are configured to shock thelogistic plan 41 in a manner that corresponds to a shock to a real-world logistical network. Examples of simulatedadverse events 52 include inclement weather; vehicle malfunctions or damage; defects inLRUs 24B; increases in vehicle maintenance resource prices; illness or injury ofmaintenance personnel 24A; and adversarial attacks onlocations 21,vehicles 22, andvehicle maintenance resources 24. - In some examples, a plurality of simulated
adverse events 52 are applied to thegraphical model 31 concurrently when the perturbedgraphical model 53 is generated. In such examples, the one ormore processing devices 12 are further configured to assignrespective event probabilities 55 to the simulatedadverse events 52. Using theevent probabilities 55, the one ormore processing devices 12 are further configured to compute respective probabilities of the simulatedadverse events 52 co-occurring. The simulatedadverse events 52 that co-occur are treated as statistically independent in some examples. In other examples, theevent probabilities 55 are modeled using ajoint distribution 57 that represents probabilities of correlated adverse events (e.g., an inclement weather event occurring acrossmultiple locations 21, an adversarial attack onmultiple locations 21, or a defect in a batch ofLRUs 24B). Thejoint distribution 57 is encoded in a Bayesian network in some examples. In other examples, rather than utilizing ajoint distribution 57, the one ormore processing devices 12 are configured to model correlated adverse events as individual events withrespective event probabilities 55 that are modeled as being independent of theevent probabilities 55 of other simulatedadverse events 52. - The one or
more processing devices 12 are configured to perform a respectivevulnerability assessment iteration 54 for each simulatedadverse event 52 or combination of simulatedadverse events 52 that has anevent probability 55 above aprobability threshold 56. In this example, theprobability threshold 56 is a user-adjustable parameter of thevulnerability assessor 50. Thus, the user is able to set the strictness of the vulnerability assessment according to characteristics of the mission. - In each of the
vulnerability assessment iterations 54, subsequently to applying the one or more simulatedadverse events 52 to thegraphical model 31 to generate the perturbedgraphical model 53, the one ormore processing devices 12 are further configured to determining whether the perturbedgraphical model 53 violates thevulnerability assessment constraint 51 when thevehicle maintenance resources 24 are assigned as indicated in thelogistic plan 41. In some examples, thevulnerability assessment constraint 51 is aconnectedness constraint 51A on thegraphical model 31. Theconnectedness constraint 51A is a constraint specifying that thegraphical model 31 remains a connected graph if anedge 35 is removed. In other examples, thevulnerability assessment constraint 51 is a minimum cut constraint 51B specifying that thegraphical model 31 remains a connected graph if a plurality ofedges 35 are removed, up to some predetermined number ofedges 35. The predetermined number of edges is expressed as a fraction of the total number ofedges 35 included in thegraphical model 31 in some examples. In other examples, thevulnerability assessment constraint 51 is a resource replaceability constraint 51C on theassignment 42 of thevehicle maintenance resources 24. In some examples, the resource replaceability constraint 51C specifies that areplacement LRU 24B is available for eachLRU 24B with anRUL 29 below a predetermined RUL threshold. -
FIG. 3C schematically shows thecomputing system 10 when additional operations are performed at the one ormore processing devices 12 during the vulnerability assessment. As depicted inFIG. 3C , if the perturbedgraphical model 53 violates thevulnerability assessment constraint 51, the one ormore processing devices 12 are further configured to compute a minimal transition set 58 of one ormore modifications 59 to thelogistic plan 41 that resolve the violation of thevulnerability assessment constraint 51. The one ormore processing devices 12 are further configured to apply the minimal transition set 58 to thelogistic plan 41. Each of themodifications 59 included in the minimal transition set 58 is a relocation of avehicle maintenance resource 24 within thegraphical model 31. In examples in which the violation of thevulnerability assessment constraint 51 is satisfied by more than one minimal transition set 58, the minimal transition set 58 that produces to thelogistic plan 41 with the highest value of the logistic planobjective function 43 is applied. - Subsequently to updating the
graphical model 31 with the minimal transition set 58, the one ormore processing devices 12 are further configured to perform anothervulnerability assessment iteration 54. Thevulnerability assessment iterations 54 are performed until eachvulnerability assessment constraint 51 is satisfied. In response to determining that eachvulnerability assessment constraint 51 is satisfied, the one ormore processing devices 12 are further configured to output thelogistic plan 41 to the maintenanceplan generating module 60. -
FIG. 4A schematically shows thecomputing system 10 when the one ormore processing devices 12 are configured to execute the maintenanceplan generating module 60. Themaintenance plan 61 is computed in each of the plurality of maintenance plan generating iterations 74 using a current version of thelogistic plan 41. The one ormore processing devices 12 are configured to compute themaintenance plan 61 for the plurality ofvehicles 22 such that themaintenance plan 61 minimizes or maximizes a maintenance planobjective function 73. In the example ofFIG. 4A , the maintenance planobjective function 73 is a loss function that the one ormore processing devices 12 are configured to approximately minimize, as discussed in further detail below. - In each of the plurality of maintenance plan generating iterations 74, according to the example of
FIG. 4A , the one ormore processing devices 12 are configured to generate a plurality of candidate maintenance plans 62 for the plurality ofvehicles 22. The plurality of candidate maintenance plans 62 are associated with anactive mission phase 63 of a mission that utilizes the plurality ofvehicles 22. Parameters of theactive mission phase 63, including a duration 64 of theactive mission phase 63, one ormore locations 21 at which the mission occurs, and thevehicles 22 used in the mission, are configured to be set by the user. In some examples, the candidate maintenance plans 62 include orderings ofmaintenance actions 28 performable at thevehicles 22 during a maintenance recovery period, which is a period of time outside theactive mission phase 63. By testing a plurality of different candidate maintenance plans 62, the one ormore processing devices 12 are configured to search across a plurality ofdifferent orderings 65 of themaintenance actions 28 for amaintenance plan 61 that has a lowest value of the maintenance planobjective function 73. - For each of the candidate maintenance plans 62, the one or
more processing devices 12 are configured to simulate thatcandidate maintenance plan 62 when each of the simulatedadverse events 52 occurs. The candidate maintenance plans 62 are modeled under the adverse conditions at a trainedmachine learning model 70. At the trainedmachine learning model 70, the one ormore processing devices 12 are configured to determining a number of thevehicles 22 that have respective maintenance-free operating periods (MFOPs) 72 shorter than the duration 64 of theactive mission phase 63. AnMFOP 72 shorter than the duration 64 of theactive mission phase 63 indicates that thevehicle 22 is not expected to remain fully functional over the duration 64 of theactive mission phase 63. - In the example of
FIG. 4A , the trainedmachine learning model 70 is a counterfactual recurrent network (CRN). The trainedmachine learning model 70, in this example, is configured to compute theMFOPs 72 of thevehicles 22 at least in part by compute predicted vehiclehealth signal data 71 for thevehicles 22 based at least in part on the vehiclehealth signal data 26 and themaintenance event data 27. The one ormore processing devices 12 are further configured to compute theMFOPs 72 of thevehicles 22 from the predicted vehiclehealth signal data 71. - For each of the candidate maintenance plans 62, the one or
more processing devices 12 are further configured to compute, over the plurality of simulatedadverse events 52, an expected value of the number ofvehicles 22 that have MFOPs 72 shorter than the duration 64. This expected value is the maintenance planobjective function 73 in the example ofFIG. 4A . The expective value is computed as a sum of theevent probabilities 55 of the simulatedadverse events 52 multiplied by the numbers of vehicles withMFOPs 72 shorter than the duration 64, as approximated at the trainedmachine learning model 70. - The one or
more processing devices 12 are further configured to select, as themaintenance plan 61, acandidate maintenance plan 62 of the plurality of candidate maintenance plans 62 that has a lowest expected value of the number ofvehicles 22 that have MFOPs 72 shorter than the duration 64. Accordingly, the one ormore processing devices 12 are configured to approximately minimize the maintenance planobjective function 73. As shown in the example ofFIG. 4A , themaintenance plan 61 includes an ordering 65 of the plurality ofmaintenance actions 28. -
FIG. 4B schematically shows thecomputing system 10 during training of the trainedmachine learning model 70. In the example ofFIG. 4B , the trainedmachine learning model 70 is a CRN. The trainedmachine learning model 70 is trained usingtraining data 100 that includes historical vehiclehealth signal data 102. The historical vehiclehealth signal data 102 is encoded as time series data and includes historical sensor data collected at sensors included in a plurality of vehicles. In some examples, the vehicles at which the historical vehiclehealth signal data 102 is collected are thevehicles 22 modeled in thegraphical model 31. In other examples, the historical vehiclehealth signal data 102 is at least partially collected at one or more other vehicles. - The
training data 100 for the trainedmachine learning model 70 further includes historicalmaintenance event data 104. The historicalmaintenance event data 104 indicates historical maintenance actions performed at each of the vehicles from which the historical vehiclehealth signal data 102 is received. - In some examples, the
training data 100 further includessynthetic training data 106. In such examples, thesynthetic training data 106 includes synthetic vehiclehealth signal data 106A and/or syntheticmaintenance event data 106B. Thesynthetic training data 106 is used in such examples to augment the size of the training data set used to generate the trainedmachine learning model 70. - In some examples, as shown in
FIG. 4B , the one ormore processing devices 12 are further configured to convert thetraining data 100 into a domaininvariant representation 108 prior to inputting thetraining data 100 into the machine learning model. The domaininvariant representation 108 is a transformation of thetraining data 100 that accounts for imperfect correlation between the historical vehiclehealth signal data 102 and the historicalmaintenance event data 104. For example, domain alignment, meta-learning, data augmentation, ensemble learning, or some other technique can be used to generate the domaininvariant representation 108 from the historical vehiclehealth signal data 102 and the historicalmaintenance event data 104. Thesynthetic training data 106 is included in the domaininvariant representation 108 in some examples. -
FIG. 5 schematically shows thecomputing system 10 when the one ormore processing devices 12 are configured to perform the plurality of maintenance plan generating iterations 74. As depicted inFIG. 5 , subsequently to generating themaintenance plan 61 in a maintenance plan generating iteration 74, the one ormore processing devices 12 are further configured to determine whether performing themaintenance plan 61 when thevehicle maintenance resources 24 have theassignment 42 indicated in thelogistic plan 41 would violate the one or morevulnerability assessment constraints 51. When the one ormore processing devices 12 determine that performing themaintenance plan 61 would violate the one or morevulnerability assessment constraints 51, the one ormore processing devices 12 are further configured to modify thelogistic plan 41. - Subsequently to modifying the
logistic plan 41, the one ormore processing devices 12 are further configured to recompute themaintenance plan 61 using the modifiedlogistic plan 41. Thus, thelogistic plan 41 and themaintenance plan 61 are iteratively computed over the plurality of maintenance plan generating iterations 74. The one ormore processing devices 12 are configured to iteratively compute thelogistic plan 41 and themaintenance plan 61 until the parameters of thelogistic plan 41 and themaintenance plan 61 stabilize. In some examples, this stabilization occurs when thelogistic plan 41 and themaintenance plan 61 remain unchanged, or approximately unchanged to within aparameter threshold 81, between a pair of successive maintenance plan generating iterations 74. In other examples, the one ormore processing devices 12 determine that a repetition oflogistic plans 41 and maintenance plans 61 has occurred between non-successive maintenance plan generating iterations 74. The one ormore processing devices 12, in such examples, are configured to select alogistic plan 41 and amaintenance plan 61 from among thelogistic plans 41 and corresponding maintenance plans 61 included in the repeating loop. Thus, alogistic plan 41 and amaintenance plan 61 are still output in examples in which the iterative computation of thelogistic plan 41 and themaintenance plan 61 does not converge. -
FIG. 6A shows a flowchart of amethod 200 for use with a computing system to compute a logistic plan and a maintenance plan for sustainment of a plurality of vehicles. Themethod 200 is configured to be performed at a computing system that includes one or more processing devices and one or more memory devices. - At
step 202, themethod 200 includes generating a graphical model of a plurality of locations, a plurality of vehicles, and a plurality of vehicle maintenance resources. The vehicles are aircraft in some examples. The vehicle maintenance resources include, for example, one or more types of maintenance personnel, LRUs, and fuel. - The graphical model includes a plurality of nodes and a plurality of edges between the nodes. In some examples, the plurality of nodes include a plurality of location nodes that indicate the locations. The plurality of nodes further include, in some examples, a plurality of location transition nodes that indicate respective transitions between the locations. The graphical model further includes a plurality of tokens. The plurality of tokens include, in some examples, a plurality of vehicle tokens that represent the vehicles and a plurality of resource tokens that represent the vehicle maintenance resources. The tokens are configured to be moveable between the nodes of the graphical model. In some examples, the graphical model is a petrinet.
- At
step 204, themethod 200 further includes receiving, for each vehicle of the plurality of vehicles, respective vehicle health signal data and maintenance event data. The vehicle health data is collected via sensors included in the plurality of vehicles. The maintenance event data indicates maintenance actions performed at the vehicles. The vehicle health signal data and the maintenance event data are expressed as time series data in some examples. - At
step 206, themethod 200 further includes computing a logistic plan based at least in part on the graphical model. The logistic plan includes an assignment of the vehicles and the vehicle maintenance resources among the plurality of locations. Computing the logistic plan atstep 206 includes, atstep 208, determining that the assignment of the vehicle maintenance resources satisfies a vulnerability assessment constraint. Example vulnerability assessment constraints include a connectedness constraint on the graphical model, a minimum cut constraint on the graphical model, or a resource replaceability constraint on the assignment of the vehicle maintenance resources. - At
step 210, over a plurality of maintenance plan generating iterations, themethod 200 further includes computing a maintenance plan for the plurality of vehicles that minimizes or maximizes a maintenance plan objective function. Step 210 includes, atstep 212, determining whether performing the maintenance plan when the vehicle maintenance resources have the assignment indicated in the logistic plan would violate the vulnerability assessment constraint. If performing the maintenance plan would violate the vulnerability assessment constraint, step 210 further includes, atstep 214, modifying the logistic plan. The maintenance plan is subsequently computed using the modified logistic plan in a subsequent maintenance plan generating iteration. - At
step 214, themethod 200 further includes outputting the logistic plan and the maintenance plan. In some examples, the logistic plan and the maintenance plan are output to a user interface. -
FIGS. 6B-6D show additional steps of themethod 200 that are performed in some examples. In the example ofFIG. 6B , atstep 216, themethod 200 further includes receiving a respective plurality of weighting coefficients associated with the vehicle maintenance resources. In some examples, the weighting coefficients indicate prices associated with the vehicle maintenance resources. In other examples, the weighting coefficients indicate usefulness of the vehicle maintenance resources in a mission. The weighting coefficients are dynamically modified in some examples to account for usability of the vehicle maintenance resources at their current locations. - At
step 218, themethod 200 further includes generating the logistic plan based at least in part on the weighting coefficients. The logistic plan is computed, in some examples, at least in part by minimizing or maximizing a logistic plan objective function. For example, the logistic plan objective function can depend upon respective numbers of the plurality of vehicle maintenance resources located at each of the locations and a total number of resource relocation events specified by the logistic plan as well as on the weighting coefficients. In some examples, the logistic plan objective function includes a spare resource utility term, a neighboring location supply utility term, and a resource relocation event number term. -
FIG. 6C shows additional steps of themethod 200 that are performed in some examples when computing the logistic plan. The steps ofFIG. 6C are performed in each of one or more vulnerability assessment iterations. Atstep 222, themethod 200 further includes applying a simulated adverse event to the graphical model to generate a perturbed graphical model. Examples of simulated adverse events include removal of at least one edge from the graphical model, removal of at least one node from the graphical model, removal of at least one vehicle maintenance resource token, an increase in the weighting coefficient of at least one vehicle maintenance resource, and damage to at least one vehicle. These changes to the graphical model are used, for example, to simulate inclement weather, adversarial attacks, supply shortages, or other types of adverse events. - Combinations of simulated adverse events are also applied during the one or more vulnerability assessment constraints in some examples. In such examples, the simulated adverse events have respective estimated event probabilities. A combination of simulated adverse events is tested when the estimated probability of that combination is above a predefined probability threshold. In some examples, the simulated adverse events are treated as independent. In other examples, a joint probability distribution is computed, and the probabilities of the combinations of simulated adverse events are computed using the joint probability distribution.
- At
step 224, themethod 200 further includes determining whether the perturbed graphical model violates the vulnerability assessment constraint when the vehicle maintenance resources are assigned as indicated in the logistic plan. If the perturbed graphical model violates the vulnerability assessment constraint, steps 226 and 228 are performed. Atstep 226, themethod 200 further includes computing a minimal transition set of one or more modifications to the logistic plan that resolve the violation of the vulnerability assessment constraint. The minimal transition set is a set of vehicle maintenance resource relocations. Atstep 228, themethod 200 further includes applying the minimal transition set to the logistic plan. Thus, the logistic plan is adjusted to satisfy the vulnerability assessment constraint, and this adjustment is performed with a minimal number of resource relocations applied to the logistic plan that minimizes or maximizes the logistic plan objective function. -
FIG. 6D shows additional steps of themethod 200 that are performed in each of the plurality of maintenance plan generating iterations when computing the maintenance plan. Atstep 230, themethod 200 further includes generating a plurality of candidate maintenance plans for the plurality of vehicles. The candidate maintenance plans are associated with an active mission phase of a mission that utilizes the plurality of vehicles. In some examples, the candidate maintenance plan indicates a plurality of maintenance actions performed on the vehicles before and after the active mission phase. - The
method 200 further includessteps step 232, for each of the simulated adverse events, themethod 200 further includes determining a number of the vehicles that have respective MFOPs shorter than a duration of the active mission phase. Step 232 is performed at a trained machine learning model in the example ofFIG. 6D . In some examples, the trained machine learning model is a counterfactual recurrent network (CRN). - In the example of
FIG. 6D , determining the MFOPs atstep 232 includes, atstep 234, computing predicted vehicle health signal data for each of the candidate maintenance plans. The predicted vehicle health signal data is computed at the trained machine learning model based at least in part on the vehicle health signal data and the maintenance event data. The MFOPs of the vehicles are then computed from the predicted vehicle health signal data. - At
step 236, themethod 200 further includes computing, over the plurality of simulated adverse events, an expected value of the number of vehicles that have MFOPs shorter than the duration. Subsequently to computing the respective expected value for each of the candidate maintenance plans, themethod 200 further includes selecting, as the maintenance plan, a candidate maintenance plan of the plurality of candidate maintenance plans that has a lowest expected value of the number of vehicles that have MFOPs shorter than the duration. Thus, the expected value of the number of vehicles with MFOPs shorter than the duration of the active mission phase is used as a loss function when selecting the maintenance plan. - Using the systems and methods discussed above, a logistic plan and a maintenance plan for vehicle sustainment are generated in a manner that balances efficient resource usage with robustness to adverse events. The logistic plan and the maintenance plan generated using the above systems and methods allow high numbers of vehicles to remain operable without requiring maintenance during an active mission phase, even when accounting for adverse events that can occur at the logistic network. Thus, the systems and methods discussed above allow vehicle sustainment planning to be performed in a manner that efficiently increases the probability of mission success.
- The methods and processes described herein can be tied to a computing system of one or more computing devices. In particular, such methods and processes can be implemented as an executable computer-application program, a network-accessible computing service, an application-programming interface (API), a library, or a combination of the above and/or other compute resources.
-
FIG. 7 schematically shows a simplified representation of acomputing system 300 configured to provide any to all of the computing functionality described herein.Computing system 300 can take the form of one or more network-accessible devices, server computers, mobile computing devices, Internet of Things (IoT) devices, embedded computing devices, vehicle computing systems, vehicle guidance systems, and/or other computing devices. -
Computing system 300 includes alogic subsystem 302 and astorage subsystem 304.Computing system 300 can optionally include adisplay subsystem 306,input subsystem 308,communication subsystem 310, and/or other subsystems not shown inFIG. 7 . -
Logic subsystem 302 includes one or more physical devices configured to execute instructions. For example, the logic subsystem can be configured to execute instructions that are part of one or more applications, services, or other logical constructs. The logic subsystem can include one or more hardware processors configured to execute software instructions. Additionally, or alternatively, the logic subsystem can include one or more hardware or firmware devices configured to execute hardware or firmware instructions. Processors of the logic subsystem can be single-core or multi-core, and the instructions executed thereon can be configured for sequential, parallel, and/or distributed processing. Individual components of the logic subsystem optionally can be distributed among two or more separate devices, which can be remotely located and/or configured for coordinated processing. Aspects of the logic subsystem can be virtualized and executed by remotely accessible, networked computing devices configured in a cloud-computing configuration. -
Storage subsystem 304 includes one or more physical devices configured to temporarily and/or permanently hold computer information such as data and instructions executable by the logic subsystem. When the storage subsystem includes two or more devices, the devices can be collocated and/or remotely located.Storage subsystem 304 can include volatile, nonvolatile, dynamic, static, read/write, read-only, random-access, sequential-access, location-addressable, file-addressable, and/or content-addressable devices.Storage subsystem 304 can include removable and/or built-in devices. When the logic subsystem executes instructions, the state ofstorage subsystem 304 can be transformed - e.g., to hold different data. - Aspects of
logic subsystem 302 andstorage subsystem 304 can be integrated together into one or more hardware-logic components. Such hardware-logic components can include program- and application-specific integrated circuits (PASIC / ASICs), program- and application-specific standard products (PSSP / ASSPs), system-on-a-chip (SOC), and complex programmable logic devices (CPLDs), for example. - The
logic subsystem 302 and thestorage subsystem 304 can cooperate to instantiate one or more logic machines. As used herein, the term "machine" is used to collectively refer to the combination of hardware, firmware, software, instructions, and/or any other components cooperating to provide computer functionality. In other words, "machines" are never abstract ideas and always have a tangible form. A machine can be instantiated by a single computing device, or a machine can include two or more sub-components instantiated by two or more different computing devices. In some implementations a machine includes a local component (e.g., software application executed by a computer processor) cooperating with a remote component (e.g., cloud computing service provided by a network of server computers). The software and/or other instructions that give a particular machine its functionality can optionally be saved as one or more unexecuted modules on one or more suitable storage devices. - When included,
display subsystem 306 can be used to present a visual representation of data held bystorage subsystem 304. This visual representation can take the form of a graphical user interface (GUI).Display subsystem 306 can include one or more display devices utilizing virtually any type of technology. In some implementations, display subsystem can include one or more virtual-, augmented-, or mixed reality displays. - When included,
input subsystem 308 can comprise or interface with one or more input devices. An input device can include a sensor device or a user input device. Examples of user input devices include a keyboard, mouse, or touch screen. In some embodiments, the input subsystem can comprise or interface with selected natural user input (NUI) componentry. Such componentry can be integrated or peripheral, and the transduction and/or processing of input actions can be handled on- or off-board. Example NUI componentry can include a microphone for speech and/or voice recognition; an infrared, color, stereoscopic, and/or depth camera for machine vision and/or gesture recognition; a head tracker, eye tracker, accelerometer, and/or gyroscope for motion detection and/or intent recognition. - When included,
communication subsystem 310 can be configured to communicatively couplecomputing system 300 with one or more other computing devices.Communication subsystem 310 can include wired and/or wireless communication devices compatible with one or more different communication protocols. The communication subsystem can be configured for communication via personal-, local- and/or wide-area networks. - Further, the disclosure comprises configurations according to the following clauses.
-
Clause 1. A computing system comprising: one or more processing devices configured to: generate a graphical model of a plurality of locations, a plurality of vehicles, and a plurality of vehicle maintenance resources; receive, for each vehicle of the plurality of vehicles, respective vehicle health signal data and maintenance event data; compute a logistic plan based at least in part on the graphical model, wherein: the logistic plan includes an assignment of the vehicles and the vehicle maintenance resources among the plurality of locations; and computing the logistic plan includes determining that the assignment of the vehicle maintenance resources satisfies a vulnerability assessment constraint; over a plurality of maintenance plan generating iterations, compute a maintenance plan for the plurality of vehicles that minimizes or maximizes a maintenance plan objective function, wherein each of the maintenance plan generating iterations includes: based at least in part on the vehicle health signal data, the maintenance event data, and the logistic plan, computing the maintenance plan for the plurality of vehicles; determining whether performing the maintenance plan when the vehicle maintenance resources have the assignment indicated in the logistic plan would violate the vulnerability assessment constraint; and if performing the maintenance plan would violate the vulnerability assessment constraint, modifying the logistic plan; and output the logistic plan and the maintenance plan. -
Clause 2. The computing system ofClause 1, wherein the graphical model includes: a plurality of nodes including a plurality of location nodes that indicate the locations; a plurality of edges between the nodes; and a plurality of tokens including a plurality of vehicle tokens that represent the vehicles and a plurality of resource tokens that represent the vehicle maintenance resources. - Clause 3. The computing system of
Clause 2, wherein the graphical model is a petrinet. - Clause 4. The computing system of
Clause 2, wherein the vulnerability assessment constraint is: a connectedness constraint on the graphical model; a minimum cut constraint on the graphical model; or a resource replaceability constraint on the assignment of the vehicle maintenance resources. - Clause 5. The computing system of
Clause 2, wherein the one or more processing devices are configured to compute the logistic plan at least in part by, in each of one or more vulnerability assessment iterations: applying a simulated adverse event to the graphical model to generate a perturbed graphical model; determining whether the perturbed graphical model violates the vulnerability assessment constraint when the vehicle maintenance resources are assigned as indicated in the logistic plan; and if the perturbed graphical model violates the vulnerability assessment constraint: computing a minimal transition set of one or more modifications to the logistic plan that resolve the violation of the vulnerability assessment constraint; and applying the minimal transition set to the logistic plan. - Clause 6. The computing system of Clause 5, wherein the one or more processing devices are further configured to: receive a respective plurality of weighting coefficients associated with the vehicle maintenance resources; and generate the logistic plan based at least in part on the weighting coefficients.
- Clause 7. The computing system of Clause 6, wherein the simulated adverse event includes: removal of at least one edge from the graphical model; removal of at least one node from the graphical model; removal of at least one vehicle maintenance resource token; an increase in the weighting coefficient of at least one vehicle maintenance resource; or damage to at least one vehicle.
- Clause 8. The computing system of Clause 6, wherein the one or more processing devices are further configured to compute the logistic plan at least in part by minimizing or maximizing a logistic plan objective function.
- Clause 9. The computing system of Clause 8, wherein the one or more processing devices are configured to compute the logistic plan objective function based at least in part on: respective numbers of the plurality of vehicle maintenance resources located at each of the locations; the respective weighting coefficients associated with the plurality of vehicle maintenance resources; and a total number of resource relocation events specified by the logistic plan.
-
Clause 10. The computing system of Clause 5, wherein the one or more processing devices are configured to compute the maintenance plan at least in part by, in each of the plurality of maintenance plan generating iterations: generating a plurality of candidate maintenance plans for the plurality of vehicles, wherein the candidate maintenance plans are associated with an active mission phase of a mission that utilizes the plurality of vehicles; and for each of the candidate maintenance plans: at a trained machine learning model, for each of the simulated adverse events, determining a number of the vehicles that have respective maintenance-free operating periods (MFOPs) shorter than a duration of the active mission phase; and computing, over the plurality of simulated adverse events, an expected value of the number of vehicles that have MFOPs shorter than the duration; and selecting, as the maintenance plan, a candidate maintenance plan of the plurality of candidate maintenance plans that has a lowest expected value of the number of vehicles that have MFOPs shorter than the duration. - Clause 11. The computing system of
Clause 10, wherein the trained machine learning model is a counterfactual recurrent network (CRN) at which, for each of the candidate maintenance plans, the one or more processing devices are configured to compute predicted vehicle health signal data based at least in part on the vehicle health signal data and the maintenance event data. -
Clause 12. The computing system ofClause 1, wherein the maintenance plan includes an ordering of a plurality of maintenance actions scheduled for performance at each vehicle of the plurality of vehicles. - Clause 13. The computing system of
Clause 1, wherein the graphical model indicates one or more types of line ready units (LRUs) and one or more types of maintenance personnel included among the plurality of vehicle maintenance resources. -
Clause 14. A method for use with a computing system, the method comprising: generating a graphical model of a plurality of locations, a plurality of vehicles, and a plurality of vehicle maintenance resources; receiving, for each vehicle of the plurality of vehicles, respective vehicle health signal data and maintenance event data; computing a logistic plan based at least in part on the graphical model, wherein: the logistic plan includes an assignment of the vehicles and the vehicle maintenance resources among the plurality of locations; and computing the logistic plan includes determining that the assignment of the vehicle maintenance resources satisfies a vulnerability assessment constraint; over a plurality of maintenance plan generating iterations, computing a maintenance plan for the plurality of vehicles that minimizes or maximizes a maintenance plan objective function, wherein each of the maintenance plan generating iterations includes: based at least in part on the vehicle health signal data, the maintenance event data, and the logistic plan, computing the maintenance plan for the plurality of vehicles; determining whether performing the maintenance plan when the vehicle maintenance resources have the assignment indicated in the logistic plan would violate the vulnerability assessment constraint; and if performing the maintenance plan would violate the vulnerability assessment constraint, modifying the logistic plan; and outputting the logistic plan and the maintenance plan. - Clause 15. The method of
Clause 14, wherein the graphical model includes: a plurality of nodes including a plurality of location nodes that indicate the locations; a plurality of edges between the nodes; and a plurality of tokens including a plurality of vehicle tokens that represent the vehicles and a plurality of resource tokens that represent the vehicle maintenance resources. - Clause 16. The method of Clause 15, wherein the graphical model is a petrinet.
- Clause 17. The method of
Clause 14, wherein computing the logistic plan includes, in each of one or more vulnerability assessment iterations: applying a simulated adverse event to the graphical model to generate a perturbed graphical model; determining whether the perturbed graphical model violates the vulnerability assessment constraint when the vehicle maintenance resources are assigned as indicated in the logistic plan; and if the perturbed graphical model violates the vulnerability assessment constraint: computing a minimal transition set of one or more modifications to the logistic plan that resolve the violation of the vulnerability assessment constraint; and applying the minimal transition set to the logistic plan. - Clause 18. The method of Clause 17, wherein computing the maintenance plan includes, in each of the plurality of maintenance plan generating iterations: generating a plurality of candidate maintenance plans for the plurality of vehicles, wherein the candidate maintenance plans are associated with an active mission phase of a mission that utilizes the plurality of vehicles; and for each of the candidate maintenance plans: at a trained machine learning model, for each of the simulated adverse events, determining a number of the vehicles that have respective maintenance-free operating periods (MFOPs) shorter than a duration of the active mission phase; and computing, over the plurality of simulated adverse events, an expected value of the number of vehicles that have MFOPs shorter than the duration; and selecting, as the maintenance plan, a candidate maintenance plan of the plurality of candidate maintenance plans that has a lowest expected value of the number of vehicles that have MFOPs shorter than the duration.
- Clause 19. The method of claim 18, wherein: the trained machine learning model is a counterfactual recurrent network (CRN); and the method further comprises, at the CRN, computing predicted vehicle health signal data for each of the candidate maintenance plans based at least in part on the vehicle health signal data and the maintenance event data.
-
Clause 20. A computing system comprising: one or more processing devices configured to: generate a petrinet that includes: a plurality of nodes including: a plurality of location nodes that indicate a respective plurality of locations; a plurality of location transition nodes that indicate respective transitions between the locations; and a plurality of maintenance transition nodes that indicate a respective plurality of maintenance actions performable at a plurality of vehicles; a plurality of edges between the nodes; and a plurality of tokens including: a plurality of vehicle tokens that represent the vehicles; and a plurality of resource tokens that represent vehicle maintenance resources with which the vehicle maintenance actions are performable; receive, for each vehicle of the plurality of vehicles, respective vehicle health signal data and maintenance event data; compute a logistic plan based at least in part on the graphical model, wherein: the logistic plan includes an assignment of the vehicles and the vehicle maintenance resources among the plurality of locations; and computing the logistic plan includes determining that the assignment of the vehicle maintenance resources satisfies a vulnerability assessment constraint; over a plurality of maintenance plan generating iterations, compute a maintenance plan for the plurality of vehicles that minimizes or maximizes a maintenance plan objective function, wherein each of the maintenance plan generating iterations includes: based at least in part on the vehicle health signal data, the maintenance event data, and the logistic plan, computing the maintenance plan for the plurality of vehicles; determining whether performing the maintenance plan when the vehicle maintenance resources have the assignment indicated in the logistic plan would violate the vulnerability assessment constraint; and if performing the maintenance plan would violate the vulnerability assessment constraint, modifying the logistic plan; and output the logistic plan and the maintenance plan. - "And/or" as used herein is defined as the inclusive or V, as specified by the following truth table:
A B A V B True True True True False True False True True False False False - It will be understood by those of ordinary skill in the art without undue experimentation that the configurations and/or approaches described herein are exemplary in nature, and that these specific implementations or examples are not to be considered in a limiting sense, because numerous variations are possible. The specific routines or methods described herein can represent one or more of any number of processing strategies. As such, various acts illustrated and/or described can be performed in the sequence illustrated and/or described, in other sequences, in parallel, or omitted. Likewise, the order of the above-described processes can be changed.
Claims (15)
- A method (200) for use with a computing system, the method comprising:generating a graphical model of a plurality of locations, a plurality of vehicles, and a plurality of vehicle maintenance resources (202);receiving, for each vehicle of the plurality of vehicles, respective vehicle health signal data and maintenance event data (204);computing a logistic plan based at least in part on the graphical model, wherein:the logistic plan includes an assignment of the vehicles and the vehicle maintenance resources among the plurality of locations (206); andcomputing the logistic plan includes determining that the assignment of the vehicle maintenance resources satisfies a vulnerability assessment constraint (208);over a plurality of maintenance plan generating iterations, computing a maintenance plan for the plurality of vehicles that minimizes or maximizes a maintenance plan objective function (210), wherein each of the maintenance plan generating iterations includes:based at least in part on the vehicle health signal data, the maintenance event data, and the logistic plan, computing the maintenance plan for the plurality of vehicles;determining whether performing the maintenance plan when the vehicle maintenance resources have the assignment indicated in the logistic plan would violate the vulnerability assessment constraint (212); andif performing the maintenance plan would violate the vulnerability assessment constraint, modifying the logistic plan (214); andoutputting the logistic plan and the maintenance plan (216).
- The method of claim 1, wherein the graphical model includes:a plurality of nodes including a plurality of location nodes that indicate the locations;a plurality of edges between the nodes; anda plurality of tokens including a plurality of vehicle tokens that represent the vehicles and a plurality of resource tokens that represent the vehicle maintenance resources.
- The method of claim 15, wherein the graphical model is a petrinet.
- The method of claim 2, wherein the vulnerability assessment constraint is:a connectedness constraint (51A) on the graphical model;a minimum cut constraint (51B) on the graphical model; ora resource replaceability constraint (51C) on the assignment of the vehicle maintenance resources.
- The method of claim 1, wherein computing the logistic plan includes, in each of one or more vulnerability assessment iterations:applying a simulated adverse event to the graphical model to generate a perturbed graphical model (222);determining whether the perturbed graphical model violates the vulnerability assessment constraint when the vehicle maintenance resources are assigned as indicated in the logistic plan (224); andif the perturbed graphical model violates the vulnerability assessment constraint:computing a minimal transition set of one or more modifications to the logistic plan that resolve the violation of the vulnerability assessment constraint (226); andapplying the minimal transition set to the logistic plan (228).
- The method of claim 5, wherein it further comprises:receiving a respective plurality of weighting coefficients (25) associated with the vehicle maintenance resources; andgenerating the logistic plan based at least in part on the weighting coefficients.
- The method of claim 6, wherein the simulated adverse event includes:removal of at least one edge (52A) from the graphical model;removal of at least one node (52B) from the graphical model;removal of at least one vehicle maintenance resource token (52C);an increase in the weighting coefficient of at least one vehicle maintenance resource (52D); ordamage to at least one vehicle (52E).
- The method of claim 6, wherein it further comprises computing the logistic plan at least in part by minimizing or maximizing a logistic plan objective function (43).
- The method of claim 8, wherein it further comprises computing the logistic plan objective function based at least in part on:respective numbers of the plurality of vehicle maintenance resources located at each of the locations;the respective weighting coefficients associated with the plurality of vehicle maintenance resources; anda total number of resource relocation events (47) specified by the logistic plan.
- The method of claim 5, wherein computing the maintenance plan includes, in each of the plurality of maintenance plan generating iterations:generating a plurality of candidate maintenance plans for the plurality of vehicles, wherein the candidate maintenance plans are associated with an active mission phase of a mission that utilizes the plurality of vehicles (230); andfor each of the candidate maintenance plans:at a trained machine learning model, for each of the simulated adverse events, determining a number of the vehicles that have respective maintenance-free operating periods (MFOPs) shorter than a duration of the active mission phase (232); andcomputing, over the plurality of simulated adverse events, an expected value of the number of vehicles that have MFOPs shorter than the duration (236); andselecting, as the maintenance plan, a candidate maintenance plan of the plurality of candidate maintenance plans that has a lowest expected value of the number of vehicles that have MFOPs shorter than the duration (238).
- The method of claim 10, wherein:the trained machine learning model is a counterfactual recurrent network (CRN); andthe method further comprises, at the CRN, computing predicted vehicle health signal data for each of the candidate maintenance plans based at least in part on the vehicle health signal data and the maintenance event data (234).
- The method of claim 1, wherein the maintenance plan includes an ordering of a plurality of maintenance actions scheduled for performance at each vehicle of the plurality of vehicles.
- The method of claim 1, wherein the graphical model indicates one or more types of line ready units (LRUs) (24B) and one or more types of maintenance personnel (24A) included among the plurality of vehicle maintenance resources.
- A computing system (10) comprising:
one or more processing devices (12) configured to carry out a method according to any one of claims 1 to 13. - The computing system (10) of claim 14, wherein it further comprises one or more memory devices (14), and further wherein, alternatively:the one or more processing devices (12) and the one or more memory devices (14) are included in a system-on-a-chip (SoC); orthe one or more processing devices (12) and the one or more memory devices (14) are distributed across a plurality of networked computing devices located in a data center.
Applications Claiming Priority (1)
| Application Number | Priority Date | Filing Date | Title |
|---|---|---|---|
| US18/350,671 US20250021943A1 (en) | 2023-07-11 | 2023-07-11 | Generating vehicle logistic plan and maintenance plan with graphical model |
Publications (1)
| Publication Number | Publication Date |
|---|---|
| EP4492306A1 true EP4492306A1 (en) | 2025-01-15 |
Family
ID=91376135
Family Applications (1)
| Application Number | Title | Priority Date | Filing Date |
|---|---|---|---|
| EP24179584.8A Pending EP4492306A1 (en) | 2023-07-11 | 2024-06-03 | Generating vehicle logistic plan and maintenance plan with graphical model |
Country Status (2)
| Country | Link |
|---|---|
| US (1) | US20250021943A1 (en) |
| EP (1) | EP4492306A1 (en) |
Citations (1)
| Publication number | Priority date | Publication date | Assignee | Title |
|---|---|---|---|---|
| US20140278712A1 (en) * | 2013-03-15 | 2014-09-18 | Oracle International Corporation | Asset tracking in asset intensive enterprises |
Family Cites Families (2)
| Publication number | Priority date | Publication date | Assignee | Title |
|---|---|---|---|---|
| US8880202B2 (en) * | 2010-07-09 | 2014-11-04 | Emerson Process Management Power & Water Solutions, Inc. | Optimization system using an iteratively coupled expert engine |
| US12288425B2 (en) * | 2022-06-01 | 2025-04-29 | The Boeing Company | Vehicle health management using a counterfactual machine learning model to optimize maintenance parameters |
-
2023
- 2023-07-11 US US18/350,671 patent/US20250021943A1/en active Pending
-
2024
- 2024-06-03 EP EP24179584.8A patent/EP4492306A1/en active Pending
Patent Citations (1)
| Publication number | Priority date | Publication date | Assignee | Title |
|---|---|---|---|---|
| US20140278712A1 (en) * | 2013-03-15 | 2014-09-18 | Oracle International Corporation | Asset tracking in asset intensive enterprises |
Non-Patent Citations (4)
| Title |
|---|
| "Topics in Artificial Intelligence", vol. 2504, 1 January 2002, SPRINGER BERLIN HEIDELBERG, ISBN: 978-3-540-36079-7, ISSN: 0302-9743, article RIERA DANIEL ET AL: "PN to CSP Methodology: Improved Bounds", pages: 145 - 158, XP093219766, DOI: 10.1007/3-540-36079-4_13 * |
| ANONYMOUS: "Constraint programming - Wikipedia", 9 July 2023 (2023-07-09), XP093220516, Retrieved from the Internet <URL:https://en.wikipedia.org/w/index.php?title=Constraint_programming&oldid=1164436463> * |
| HAOXUN CHEN ET AL: "Modeling, Analysis, and Optimization of Logistics Systems Petri Net Based Approaches", SERVICE SYSTEMS AND SERVICE MANAGEMENT, 2006 INTERNATIONAL CONFERENCE ON, IEEE, PI, 1 October 2006 (2006-10-01), pages 575 - 582, XP031052204, ISBN: 978-1-4244-0450-6 * |
| REED SEAN ET AL: "Logical representation of maintenance procedures for verification and analysis", 2016 11TH SYSTEM OF SYSTEMS ENGINEERING CONFERENCE (SOSE), IEEE, 12 June 2016 (2016-06-12), pages 1 - 6, XP032945153, DOI: 10.1109/SYSOSE.2016.7542942 * |
Also Published As
| Publication number | Publication date |
|---|---|
| US20250021943A1 (en) | 2025-01-16 |
Similar Documents
| Publication | Publication Date | Title |
|---|---|---|
| CN112001585B (en) | Multi-agent decision-making methods, devices, electronic equipment and storage media | |
| US12026796B2 (en) | Systems and methods for describing, simulating and optimizing spaceborne systems and missions | |
| US8626698B1 (en) | Method and system for determining probability of project success | |
| CN115292046B (en) | Computing power allocation method, device, storage medium and electronic device | |
| CN111985755B (en) | Method and system for minimizing risk using machine learning techniques | |
| US20140142998A1 (en) | Method and System for Optimized Task Assignment | |
| CN117132890B (en) | Remote sensing image target detection method and system based on Kubernetes edge computing cluster | |
| US11182689B2 (en) | Adaptive learning rate schedule in distributed stochastic gradient descent | |
| US12107665B2 (en) | Generating model update data at satellite | |
| CN109147396A (en) | The distribution method and device of airport aircraft gate | |
| US9153138B1 (en) | Agent-based airfield conflict resolution | |
| CN111784399B (en) | System and method for calculating price of returning and modifying label | |
| US11645507B2 (en) | Providing models to client devices | |
| CN120562930A (en) | A constellation mission planning method and system based on fine-tuning a large language model | |
| US20220245505A1 (en) | Methods and apparatus for machine learning model optimization | |
| US20160004985A1 (en) | Prioritizing Proposal Development Under Resource Constraints | |
| US20210125422A1 (en) | Maintenance induction for aircraft | |
| EP4287092B1 (en) | Vehicle health management using a counterfactual machine learning model to optimize maintenance parameters | |
| US20240112065A1 (en) | Meta-learning operation research optimization | |
| Guindani et al. | AMLLibrary: An AutoML approach for performance prediction | |
| US20250021943A1 (en) | Generating vehicle logistic plan and maintenance plan with graphical model | |
| US12367419B2 (en) | Game-theoretic invariant rationalization of machine-learning results | |
| US20250124179A1 (en) | Methods and systems for rapid design and delivery of spacecrafts | |
| US20250029033A1 (en) | System and method for optimizing airport operations | |
| US20240370300A1 (en) | Resource prioritization using machine learning techniques |
Legal Events
| Date | Code | Title | Description |
|---|---|---|---|
| PUAI | Public reference made under article 153(3) epc to a published international application that has entered the european phase |
Free format text: ORIGINAL CODE: 0009012 |
|
| STAA | Information on the status of an ep patent application or granted ep patent |
Free format text: STATUS: THE APPLICATION HAS BEEN PUBLISHED |
|
| AK | Designated contracting states |
Kind code of ref document: A1 Designated state(s): AL AT BE BG CH CY CZ DE DK EE ES FI FR GB GR HR HU IE IS IT LI LT LU LV MC ME MK MT NL NO PL PT RO RS SE SI SK SM TR |
|
| STAA | Information on the status of an ep patent application or granted ep patent |
Free format text: STATUS: REQUEST FOR EXAMINATION WAS MADE |
|
| 17P | Request for examination filed |
Effective date: 20250613 |