EP4491675A1 - Method for analyzing blood cells, reagent for blood cell analysis, reagent kit for blood cell analysis, and method for fluorescently staining blood cells - Google Patents
Method for analyzing blood cells, reagent for blood cell analysis, reagent kit for blood cell analysis, and method for fluorescently staining blood cells Download PDFInfo
- Publication number
- EP4491675A1 EP4491675A1 EP24186805.8A EP24186805A EP4491675A1 EP 4491675 A1 EP4491675 A1 EP 4491675A1 EP 24186805 A EP24186805 A EP 24186805A EP 4491675 A1 EP4491675 A1 EP 4491675A1
- Authority
- EP
- European Patent Office
- Prior art keywords
- sub
- carbon atoms
- alkyl group
- group
- scattered light
- Prior art date
- Legal status (The legal status is an assumption and is not a legal conclusion. Google has not performed a legal analysis and makes no representation as to the accuracy of the status listed.)
- Pending
Links
- 238000000034 method Methods 0.000 title claims abstract description 138
- 210000000601 blood cell Anatomy 0.000 title claims abstract description 85
- 239000003153 chemical reaction reagent Substances 0.000 title claims description 139
- 238000004458 analytical method Methods 0.000 title claims description 127
- 238000010186 staining Methods 0.000 title claims description 15
- 238000005259 measurement Methods 0.000 claims abstract description 203
- 239000007850 fluorescent dye Substances 0.000 claims abstract description 113
- 239000002245 particle Substances 0.000 claims abstract description 103
- 125000004432 carbon atom Chemical group C* 0.000 claims abstract description 93
- 125000000217 alkyl group Chemical group 0.000 claims abstract description 77
- 125000001424 substituent group Chemical group 0.000 claims abstract description 27
- 229910052736 halogen Inorganic materials 0.000 claims abstract description 23
- 150000002367 halogens Chemical class 0.000 claims abstract description 21
- 125000004435 hydrogen atom Chemical group [H]* 0.000 claims abstract description 21
- 125000001997 phenyl group Chemical group [H]C1=C([H])C([H])=C(*)C([H])=C1[H] 0.000 claims abstract description 16
- 125000003342 alkenyl group Chemical group 0.000 claims abstract description 15
- 125000001797 benzyl group Chemical group [H]C1=C([H])C([H])=C(C([H])=C1[H])C([H])([H])* 0.000 claims abstract description 12
- 125000003178 carboxy group Chemical group [H]OC(*)=O 0.000 claims abstract description 12
- 125000002887 hydroxy group Chemical group [H]O* 0.000 claims abstract description 10
- 125000000020 sulfo group Chemical group O=S(=O)([*])O[H] 0.000 claims abstract description 10
- 230000001678 irradiating effect Effects 0.000 claims abstract description 9
- 125000004430 oxygen atom Chemical group O* 0.000 claims abstract description 9
- BUGBHKTXTAQXES-UHFFFAOYSA-N Selenium Chemical group [Se] BUGBHKTXTAQXES-UHFFFAOYSA-N 0.000 claims abstract description 8
- 229910052711 selenium Inorganic materials 0.000 claims abstract description 8
- 229910052717 sulfur Inorganic materials 0.000 claims abstract description 8
- 125000004434 sulfur atom Chemical group 0.000 claims abstract description 8
- 125000003545 alkoxy group Chemical group 0.000 claims abstract description 6
- 210000001772 blood platelet Anatomy 0.000 claims description 84
- 210000000265 leukocyte Anatomy 0.000 claims description 66
- 206010018910 Haemolysis Diseases 0.000 claims description 61
- 230000008588 hemolysis Effects 0.000 claims description 61
- 210000003743 erythrocyte Anatomy 0.000 claims description 51
- 210000001995 reticulocyte Anatomy 0.000 claims description 46
- -1 3-ethyl-2-[(3-ethyl-6-methyl-2-benzothiazolinylidene)methyl]-6-methyl-benzothiazolium Chemical compound 0.000 claims description 41
- 239000012895 dilution Substances 0.000 claims description 40
- 238000010790 dilution Methods 0.000 claims description 40
- 239000012128 staining reagent Substances 0.000 claims description 38
- 210000004369 blood Anatomy 0.000 claims description 36
- 239000008280 blood Substances 0.000 claims description 36
- 210000003714 granulocyte Anatomy 0.000 claims description 26
- 238000002156 mixing Methods 0.000 claims description 19
- 210000001616 monocyte Anatomy 0.000 claims description 17
- 210000000440 neutrophil Anatomy 0.000 claims description 15
- 210000004698 lymphocyte Anatomy 0.000 claims description 14
- 210000003979 eosinophil Anatomy 0.000 claims description 12
- 210000003651 basophil Anatomy 0.000 claims description 10
- 150000002500 ions Chemical class 0.000 claims description 7
- WCJHMNADZOKGGL-UHFFFAOYSA-N 3-ethyl-2-[(3-ethyl-1,3-benzothiazol-3-ium-2-yl)methylidene]-1,3-benzothiazole Chemical compound S1C2=CC=CC=C2[N+](CC)=C1/C=C1/N(CC)C2=CC=CC=C2S1 WCJHMNADZOKGGL-UHFFFAOYSA-N 0.000 claims description 6
- XNZUELXWWBKRLE-UHFFFAOYSA-N 3-ethyl-2-[(3-ethyl-1,3-benzothiazol-3-ium-2-yl)methylidene]-1,3-benzoxazole Chemical compound S1C2=CC=CC=C2[N+](CC)=C1/C=C1/N(CC)C2=CC=CC=C2O1 XNZUELXWWBKRLE-UHFFFAOYSA-N 0.000 claims description 6
- SRTZJUAXPXFEJP-UHFFFAOYSA-N 3-methyl-2-[(e)-(1,3,3-trimethylindol-2-ylidene)methyl]-1,3-benzoxazol-3-ium Chemical compound CC1(C)C2=CC=CC=C2N(C)\C1=C\C1=[N+](C)C2=CC=CC=C2O1 SRTZJUAXPXFEJP-UHFFFAOYSA-N 0.000 claims description 6
- RZTUFLMOLRONMW-UHFFFAOYSA-N 3-methyl-2-[(e)-(1,3,3-trimethylindol-2-ylidene)methyl]-1,3-benzothiazol-3-ium Chemical compound CC1(C)C2=CC=CC=C2N(C)\C1=C\C1=[N+](C)C2=CC=CC=C2S1 RZTUFLMOLRONMW-UHFFFAOYSA-N 0.000 claims description 5
- IPZJQDSFZGZEOY-UHFFFAOYSA-N dimethylmethylene Chemical compound C[C]C IPZJQDSFZGZEOY-UHFFFAOYSA-N 0.000 claims description 3
- 230000008569 process Effects 0.000 description 44
- 210000004027 cell Anatomy 0.000 description 35
- 230000003287 optical effect Effects 0.000 description 20
- 230000000052 comparative effect Effects 0.000 description 19
- 238000002360 preparation method Methods 0.000 description 16
- 239000004094 surface-active agent Substances 0.000 description 15
- 238000006243 chemical reaction Methods 0.000 description 14
- 230000002949 hemolytic effect Effects 0.000 description 14
- 150000007523 nucleic acids Chemical class 0.000 description 13
- 102000039446 nucleic acids Human genes 0.000 description 13
- 108020004707 nucleic acids Proteins 0.000 description 13
- 239000003093 cationic surfactant Substances 0.000 description 11
- 235000005811 Viola adunca Nutrition 0.000 description 10
- 240000009038 Viola odorata Species 0.000 description 10
- 235000013487 Viola odorata Nutrition 0.000 description 10
- 235000002254 Viola papilionacea Nutrition 0.000 description 10
- 239000006172 buffering agent Substances 0.000 description 10
- 230000003204 osmotic effect Effects 0.000 description 10
- LYCAIKOWRPUZTN-UHFFFAOYSA-N Ethylene glycol Chemical compound OCCO LYCAIKOWRPUZTN-UHFFFAOYSA-N 0.000 description 9
- 239000002904 solvent Substances 0.000 description 9
- LFQSCWFLJHTTHZ-UHFFFAOYSA-N Ethanol Chemical compound CCO LFQSCWFLJHTTHZ-UHFFFAOYSA-N 0.000 description 8
- 239000002736 nonionic surfactant Substances 0.000 description 8
- 239000007788 liquid Substances 0.000 description 7
- IAZDPXIOMUYVGZ-UHFFFAOYSA-N Dimethylsulphoxide Chemical compound CS(C)=O IAZDPXIOMUYVGZ-UHFFFAOYSA-N 0.000 description 6
- KCXVZYZYPLLWCC-UHFFFAOYSA-N EDTA Chemical compound OC(=O)CN(CC(O)=O)CCN(CC(O)=O)CC(O)=O KCXVZYZYPLLWCC-UHFFFAOYSA-N 0.000 description 6
- 229920003171 Poly (ethylene oxide) Polymers 0.000 description 6
- MTHSVFCYNBDYFN-UHFFFAOYSA-N diethylene glycol Chemical compound OCCOCCO MTHSVFCYNBDYFN-UHFFFAOYSA-N 0.000 description 6
- 229940071106 ethylenediaminetetraacetate Drugs 0.000 description 5
- 239000003960 organic solvent Substances 0.000 description 5
- 210000005259 peripheral blood Anatomy 0.000 description 5
- 239000011886 peripheral blood Substances 0.000 description 5
- 239000004065 semiconductor Substances 0.000 description 5
- 238000003860 storage Methods 0.000 description 5
- XLYOFNOQVPJJNP-UHFFFAOYSA-N water Substances O XLYOFNOQVPJJNP-UHFFFAOYSA-N 0.000 description 5
- FAPWRFPIFSIZLT-UHFFFAOYSA-M Sodium chloride Chemical compound [Na+].[Cl-] FAPWRFPIFSIZLT-UHFFFAOYSA-M 0.000 description 4
- 230000002159 abnormal effect Effects 0.000 description 4
- 150000001450 anions Chemical class 0.000 description 4
- WPYMKLBDIGXBTP-UHFFFAOYSA-N benzoic acid Chemical compound OC(=O)C1=CC=CC=C1 WPYMKLBDIGXBTP-UHFFFAOYSA-N 0.000 description 4
- 239000000306 component Substances 0.000 description 4
- 125000001495 ethyl group Chemical group [H]C([H])([H])C([H])([H])* 0.000 description 4
- 125000002496 methyl group Chemical group [H]C([H])([H])* 0.000 description 4
- 125000001436 propyl group Chemical group [H]C([*])([H])C([H])([H])C([H])([H])[H] 0.000 description 4
- 229920002477 rna polymer Polymers 0.000 description 4
- 239000000243 solution Substances 0.000 description 4
- 239000006173 Good's buffer Substances 0.000 description 3
- HEMHJVSKTPXQMS-UHFFFAOYSA-M Sodium hydroxide Chemical compound [OH-].[Na+] HEMHJVSKTPXQMS-UHFFFAOYSA-M 0.000 description 3
- 238000010521 absorption reaction Methods 0.000 description 3
- 150000005215 alkyl ethers Chemical class 0.000 description 3
- 125000003118 aryl group Chemical group 0.000 description 3
- 230000003139 buffering effect Effects 0.000 description 3
- KRKNYBCHXYNGOX-UHFFFAOYSA-N citric acid Chemical compound OC(=O)CC(O)(C(O)=O)CC(O)=O KRKNYBCHXYNGOX-UHFFFAOYSA-N 0.000 description 3
- 125000002704 decyl group Chemical group [H]C([H])([H])C([H])([H])C([H])([H])C([H])([H])C([H])([H])C([H])([H])C([H])([H])C([H])([H])C([H])([H])C([H])([H])* 0.000 description 3
- PLMFYJJFUUUCRZ-UHFFFAOYSA-M decyltrimethylammonium bromide Chemical compound [Br-].CCCCCCCCCC[N+](C)(C)C PLMFYJJFUUUCRZ-UHFFFAOYSA-M 0.000 description 3
- 125000003438 dodecyl group Chemical group [H]C([H])([H])C([H])([H])C([H])([H])C([H])([H])C([H])([H])C([H])([H])C([H])([H])C([H])([H])C([H])([H])C([H])([H])C([H])([H])C([H])([H])* 0.000 description 3
- DDXLVDQZPFLQMZ-UHFFFAOYSA-M dodecyl(trimethyl)azanium;chloride Chemical compound [Cl-].CCCCCCCCCCCC[N+](C)(C)C DDXLVDQZPFLQMZ-UHFFFAOYSA-M 0.000 description 3
- 239000012530 fluid Substances 0.000 description 3
- 125000001188 haloalkyl group Chemical group 0.000 description 3
- 239000000203 mixture Substances 0.000 description 3
- 125000002347 octyl group Chemical group [H]C([*])([H])C([H])([H])C([H])([H])C([H])([H])C([H])([H])C([H])([H])C([H])([H])C([H])([H])[H] 0.000 description 3
- NBIIXXVUZAFLBC-UHFFFAOYSA-K phosphate Chemical compound [O-]P([O-])([O-])=O NBIIXXVUZAFLBC-UHFFFAOYSA-K 0.000 description 3
- 150000003839 salts Chemical class 0.000 description 3
- 208000010110 spontaneous platelet aggregation Diseases 0.000 description 3
- SXJYGDWAGOIGMC-UHFFFAOYSA-N (2z)-3-ethyl-2-[(3-ethyl-1,3-benzoxazol-3-ium-2-yl)methylidene]-1,3-benzoxazole Chemical compound O1C2=CC=CC=C2[N+](CC)=C1/C=C1/N(CC)C2=CC=CC=C2O1 SXJYGDWAGOIGMC-UHFFFAOYSA-N 0.000 description 2
- JQQZBGYFXAKJNP-UHFFFAOYSA-N (2z)-3-methyl-2-[(3-methyl-1,3-benzoxazol-3-ium-2-yl)methylidene]-1,3-benzoxazole Chemical compound O1C2=CC=CC=C2[N+](C)=C1/C=C1/N(C)C2=CC=CC=C2O1 JQQZBGYFXAKJNP-UHFFFAOYSA-N 0.000 description 2
- WRMNZCZEMHIOCP-UHFFFAOYSA-N 2-phenylethanol Chemical compound OCCC1=CC=CC=C1 WRMNZCZEMHIOCP-UHFFFAOYSA-N 0.000 description 2
- 241000894006 Bacteria Species 0.000 description 2
- LSNNMFCWUKXFEE-UHFFFAOYSA-M Bisulfite Chemical compound OS([O-])=O LSNNMFCWUKXFEE-UHFFFAOYSA-M 0.000 description 2
- 241000233866 Fungi Species 0.000 description 2
- 102000001554 Hemoglobins Human genes 0.000 description 2
- 108010054147 Hemoglobins Proteins 0.000 description 2
- VEXZGXHMUGYJMC-UHFFFAOYSA-N Hydrochloric acid Chemical compound Cl VEXZGXHMUGYJMC-UHFFFAOYSA-N 0.000 description 2
- TWRXJAOTZQYOKJ-UHFFFAOYSA-L Magnesium chloride Chemical compound [Mg+2].[Cl-].[Cl-] TWRXJAOTZQYOKJ-UHFFFAOYSA-L 0.000 description 2
- QIAFMBKCNZACKA-UHFFFAOYSA-N N-benzoylglycine Chemical compound OC(=O)CNC(=O)C1=CC=CC=C1 QIAFMBKCNZACKA-UHFFFAOYSA-N 0.000 description 2
- SEQKRHFRPICQDD-UHFFFAOYSA-N N-tris(hydroxymethyl)methylglycine Chemical compound OCC(CO)(CO)[NH2+]CC([O-])=O SEQKRHFRPICQDD-UHFFFAOYSA-N 0.000 description 2
- 229910019142 PO4 Inorganic materials 0.000 description 2
- NBIIXXVUZAFLBC-UHFFFAOYSA-N Phosphoric acid Chemical compound OP(O)(O)=O NBIIXXVUZAFLBC-UHFFFAOYSA-N 0.000 description 2
- 239000002202 Polyethylene glycol Substances 0.000 description 2
- UIIMBOGNXHQVGW-UHFFFAOYSA-M Sodium bicarbonate Chemical compound [Na+].OC([O-])=O UIIMBOGNXHQVGW-UHFFFAOYSA-M 0.000 description 2
- QAOWNCQODCNURD-UHFFFAOYSA-N Sulfuric acid Chemical compound OS(O)(=O)=O QAOWNCQODCNURD-UHFFFAOYSA-N 0.000 description 2
- 239000002253 acid Substances 0.000 description 2
- 229910052783 alkali metal Inorganic materials 0.000 description 2
- 239000003146 anticoagulant agent Substances 0.000 description 2
- 229940127219 anticoagulant drug Drugs 0.000 description 2
- 239000007864 aqueous solution Substances 0.000 description 2
- 239000003125 aqueous solvent Substances 0.000 description 2
- 239000012503 blood component Substances 0.000 description 2
- 210000001185 bone marrow Anatomy 0.000 description 2
- 230000001413 cellular effect Effects 0.000 description 2
- 230000008859 change Effects 0.000 description 2
- 239000003086 colorant Substances 0.000 description 2
- 238000010586 diagram Methods 0.000 description 2
- XBDQKXXYIPTUBI-UHFFFAOYSA-N dimethylselenoniopropionate Natural products CCC(O)=O XBDQKXXYIPTUBI-UHFFFAOYSA-N 0.000 description 2
- 230000005284 excitation Effects 0.000 description 2
- 238000011534 incubation Methods 0.000 description 2
- 125000004491 isohexyl group Chemical group C(CCC(C)C)* 0.000 description 2
- 125000001972 isopentyl group Chemical group [H]C([H])([H])C([H])(C([H])([H])[H])C([H])([H])C([H])([H])* 0.000 description 2
- 125000001449 isopropyl group Chemical group [H]C([H])([H])C([H])(*)C([H])([H])[H] 0.000 description 2
- 150000002632 lipids Chemical class 0.000 description 2
- 238000004519 manufacturing process Methods 0.000 description 2
- 239000000463 material Substances 0.000 description 2
- 230000035800 maturation Effects 0.000 description 2
- 244000005700 microbiome Species 0.000 description 2
- 125000004108 n-butyl group Chemical group [H]C([H])([H])C([H])([H])C([H])([H])C([H])([H])* 0.000 description 2
- 125000001971 neopentyl group Chemical group [H]C([*])([H])C(C([H])([H])[H])(C([H])([H])[H])C([H])([H])[H] 0.000 description 2
- 125000000449 nitro group Chemical group [O-][N+](*)=O 0.000 description 2
- 239000010452 phosphate Substances 0.000 description 2
- XNGIFLGASWRNHJ-UHFFFAOYSA-N phthalic acid Chemical compound OC(=O)C1=CC=CC=C1C(O)=O XNGIFLGASWRNHJ-UHFFFAOYSA-N 0.000 description 2
- 239000002504 physiological saline solution Substances 0.000 description 2
- 229920001223 polyethylene glycol Polymers 0.000 description 2
- 239000003755 preservative agent Substances 0.000 description 2
- 230000002335 preservative effect Effects 0.000 description 2
- JUJWROOIHBZHMG-UHFFFAOYSA-O pyridinium Chemical compound C1=CC=[NH+]C=C1 JUJWROOIHBZHMG-UHFFFAOYSA-O 0.000 description 2
- 125000001453 quaternary ammonium group Chemical class 0.000 description 2
- YGSDEFSMJLZEOE-UHFFFAOYSA-N salicylic acid Chemical compound OC(=O)C1=CC=CC=C1O YGSDEFSMJLZEOE-UHFFFAOYSA-N 0.000 description 2
- 239000011780 sodium chloride Substances 0.000 description 2
- 239000000126 substance Substances 0.000 description 2
- XOAAWQZATWQOTB-UHFFFAOYSA-N taurine Chemical compound NCCS(O)(=O)=O XOAAWQZATWQOTB-UHFFFAOYSA-N 0.000 description 2
- 125000000999 tert-butyl group Chemical group [H]C([H])([H])C(*)(C([H])([H])[H])C([H])([H])[H] 0.000 description 2
- 125000001973 tert-pentyl group Chemical group [H]C([H])([H])C([H])([H])C(*)(C([H])([H])[H])C([H])([H])[H] 0.000 description 2
- ANRHNWWPFJCPAZ-UHFFFAOYSA-M thionine Chemical compound [Cl-].C1=CC(N)=CC2=[S+]C3=CC(N)=CC=C3N=C21 ANRHNWWPFJCPAZ-UHFFFAOYSA-M 0.000 description 2
- 239000002699 waste material Substances 0.000 description 2
- QZTKDVCDBIDYMD-UHFFFAOYSA-N 2,2'-[(2-amino-2-oxoethyl)imino]diacetic acid Chemical compound NC(=O)CN(CC(O)=O)CC(O)=O QZTKDVCDBIDYMD-UHFFFAOYSA-N 0.000 description 1
- IHPYMWDTONKSCO-UHFFFAOYSA-N 2,2'-piperazine-1,4-diylbisethanesulfonic acid Chemical compound OS(=O)(=O)CCN1CCN(CCS(O)(=O)=O)CC1 IHPYMWDTONKSCO-UHFFFAOYSA-N 0.000 description 1
- JKMHFZQWWAIEOD-UHFFFAOYSA-N 2-[4-(2-hydroxyethyl)piperazin-1-yl]ethanesulfonic acid Chemical compound OCC[NH+]1CCN(CCS([O-])(=O)=O)CC1 JKMHFZQWWAIEOD-UHFFFAOYSA-N 0.000 description 1
- AJTVSSFTXWNIRG-UHFFFAOYSA-N 2-[bis(2-hydroxyethyl)amino]ethanesulfonic acid Chemical compound OCC[NH+](CCO)CCS([O-])(=O)=O AJTVSSFTXWNIRG-UHFFFAOYSA-N 0.000 description 1
- 125000003903 2-propenyl group Chemical group [H]C([*])([H])C([H])=C([H])[H] 0.000 description 1
- DVLFYONBTKHTER-UHFFFAOYSA-N 3-(N-morpholino)propanesulfonic acid Chemical compound OS(=O)(=O)CCCN1CCOCC1 DVLFYONBTKHTER-UHFFFAOYSA-N 0.000 description 1
- NUFBIAUZAMHTSP-UHFFFAOYSA-N 3-(n-morpholino)-2-hydroxypropanesulfonic acid Chemical compound OS(=O)(=O)CC(O)CN1CCOCC1 NUFBIAUZAMHTSP-UHFFFAOYSA-N 0.000 description 1
- HVBSAKJJOYLTQU-UHFFFAOYSA-N 4-aminobenzenesulfonic acid Chemical compound NC1=CC=C(S(O)(=O)=O)C=C1 HVBSAKJJOYLTQU-UHFFFAOYSA-N 0.000 description 1
- ZCYVEMRRCGMTRW-UHFFFAOYSA-N 7553-56-2 Chemical compound [I] ZCYVEMRRCGMTRW-UHFFFAOYSA-N 0.000 description 1
- 239000007991 ACES buffer Substances 0.000 description 1
- 239000007988 ADA buffer Substances 0.000 description 1
- 239000007992 BES buffer Substances 0.000 description 1
- 239000007989 BIS-Tris Propane buffer Substances 0.000 description 1
- 239000005711 Benzoic acid Substances 0.000 description 1
- BTBUEUYNUDRHOZ-UHFFFAOYSA-N Borate Chemical compound [O-]B([O-])[O-] BTBUEUYNUDRHOZ-UHFFFAOYSA-N 0.000 description 1
- WKBOTKDWSSQWDR-UHFFFAOYSA-N Bromine atom Chemical compound [Br] WKBOTKDWSSQWDR-UHFFFAOYSA-N 0.000 description 1
- BVKZGUZCCUSVTD-UHFFFAOYSA-L Carbonate Chemical compound [O-]C([O-])=O BVKZGUZCCUSVTD-UHFFFAOYSA-L 0.000 description 1
- CXRFDZFCGOPDTD-UHFFFAOYSA-M Cetrimide Chemical compound [Br-].CCCCCCCCCCCCCC[N+](C)(C)C CXRFDZFCGOPDTD-UHFFFAOYSA-M 0.000 description 1
- ZAMOUSCENKQFHK-UHFFFAOYSA-N Chlorine atom Chemical compound [Cl] ZAMOUSCENKQFHK-UHFFFAOYSA-N 0.000 description 1
- KRKNYBCHXYNGOX-UHFFFAOYSA-K Citrate Chemical compound [O-]C(=O)CC(O)(CC([O-])=O)C([O-])=O KRKNYBCHXYNGOX-UHFFFAOYSA-K 0.000 description 1
- 208000027205 Congenital disease Diseases 0.000 description 1
- FBPFZTCFMRRESA-FSIIMWSLSA-N D-Glucitol Natural products OC[C@H](O)[C@H](O)[C@@H](O)[C@H](O)CO FBPFZTCFMRRESA-FSIIMWSLSA-N 0.000 description 1
- WQZGKKKJIJFFOK-QTVWNMPRSA-N D-mannopyranose Chemical compound OC[C@H]1OC(O)[C@@H](O)[C@@H](O)[C@@H]1O WQZGKKKJIJFFOK-QTVWNMPRSA-N 0.000 description 1
- SNRUBQQJIBEYMU-UHFFFAOYSA-N Dodecane Natural products CCCCCCCCCCCC SNRUBQQJIBEYMU-UHFFFAOYSA-N 0.000 description 1
- ZGTMUACCHSMWAC-UHFFFAOYSA-L EDTA disodium salt (anhydrous) Chemical compound [Na+].[Na+].OC(=O)CN(CC([O-])=O)CCN(CC(O)=O)CC([O-])=O ZGTMUACCHSMWAC-UHFFFAOYSA-L 0.000 description 1
- PXGOKWXKJXAPGV-UHFFFAOYSA-N Fluorine Chemical compound FF PXGOKWXKJXAPGV-UHFFFAOYSA-N 0.000 description 1
- WQZGKKKJIJFFOK-GASJEMHNSA-N Glucose Natural products OC[C@H]1OC(O)[C@H](O)[C@@H](O)[C@@H]1O WQZGKKKJIJFFOK-GASJEMHNSA-N 0.000 description 1
- 239000007995 HEPES buffer Substances 0.000 description 1
- OWXMKDGYPWMGEB-UHFFFAOYSA-N HEPPS Chemical compound OCCN1CCN(CCCS(O)(=O)=O)CC1 OWXMKDGYPWMGEB-UHFFFAOYSA-N 0.000 description 1
- 239000007996 HEPPS buffer Substances 0.000 description 1
- HTTJABKRGRZYRN-UHFFFAOYSA-N Heparin Chemical compound OC1C(NC(=O)C)C(O)OC(COS(O)(=O)=O)C1OC1C(OS(O)(=O)=O)C(O)C(OC2C(C(OS(O)(=O)=O)C(OC3C(C(O)C(O)C(O3)C(O)=O)OS(O)(=O)=O)C(CO)O2)NS(O)(=O)=O)C(C(O)=O)O1 HTTJABKRGRZYRN-UHFFFAOYSA-N 0.000 description 1
- DGAQECJNVWCQMB-PUAWFVPOSA-M Ilexoside XXIX Chemical compound C[C@@H]1CC[C@@]2(CC[C@@]3(C(=CC[C@H]4[C@]3(CC[C@@H]5[C@@]4(CC[C@@H](C5(C)C)OS(=O)(=O)[O-])C)C)[C@@H]2[C@]1(C)O)C)C(=O)O[C@H]6[C@@H]([C@H]([C@@H]([C@H](O6)CO)O)O)O.[Na+] DGAQECJNVWCQMB-PUAWFVPOSA-M 0.000 description 1
- 208000015710 Iron-Deficiency Anemia Diseases 0.000 description 1
- 239000007993 MOPS buffer Substances 0.000 description 1
- 206010027476 Metastases Diseases 0.000 description 1
- FSVCELGFZIQNCK-UHFFFAOYSA-N N,N-bis(2-hydroxyethyl)glycine Chemical compound OCCN(CCO)CC(O)=O FSVCELGFZIQNCK-UHFFFAOYSA-N 0.000 description 1
- DBXNUXBLKRLWFA-UHFFFAOYSA-N N-(2-acetamido)-2-aminoethanesulfonic acid Chemical compound NC(=O)CNCCS(O)(=O)=O DBXNUXBLKRLWFA-UHFFFAOYSA-N 0.000 description 1
- JOCBASBOOFNAJA-UHFFFAOYSA-N N-tris(hydroxymethyl)methyl-2-aminoethanesulfonic acid Chemical compound OCC(CO)(CO)NCCS(O)(=O)=O JOCBASBOOFNAJA-UHFFFAOYSA-N 0.000 description 1
- 239000007990 PIPES buffer Substances 0.000 description 1
- 208000031845 Pernicious anaemia Diseases 0.000 description 1
- 208000030118 Red blood cell disease Diseases 0.000 description 1
- 229930182558 Sterol Natural products 0.000 description 1
- QAOWNCQODCNURD-UHFFFAOYSA-L Sulfate Chemical compound [O-]S([O-])(=O)=O QAOWNCQODCNURD-UHFFFAOYSA-L 0.000 description 1
- UZMAPBJVXOGOFT-UHFFFAOYSA-N Syringetin Natural products COC1=C(O)C(OC)=CC(C2=C(C(=O)C3=C(O)C=C(O)C=C3O2)O)=C1 UZMAPBJVXOGOFT-UHFFFAOYSA-N 0.000 description 1
- 239000007994 TES buffer Substances 0.000 description 1
- 239000007997 Tricine buffer Substances 0.000 description 1
- GSEJCLTVZPLZKY-UHFFFAOYSA-N Triethanolamine Chemical compound OCCN(CCO)CCO GSEJCLTVZPLZKY-UHFFFAOYSA-N 0.000 description 1
- 239000007983 Tris buffer Substances 0.000 description 1
- 208000034953 Twin anemia-polycythemia sequence Diseases 0.000 description 1
- 238000000862 absorption spectrum Methods 0.000 description 1
- 150000007513 acids Chemical class 0.000 description 1
- 230000009471 action Effects 0.000 description 1
- 125000004442 acylamino group Chemical group 0.000 description 1
- 229910001508 alkali metal halide Inorganic materials 0.000 description 1
- 150000008045 alkali metal halides Chemical class 0.000 description 1
- 229910001615 alkaline earth metal halide Inorganic materials 0.000 description 1
- 150000003973 alkyl amines Chemical class 0.000 description 1
- 125000003282 alkyl amino group Chemical group 0.000 description 1
- 125000000304 alkynyl group Chemical group 0.000 description 1
- 229910000147 aluminium phosphate Inorganic materials 0.000 description 1
- 150000001413 amino acids Chemical class 0.000 description 1
- 239000002585 base Substances 0.000 description 1
- SRSXLGNVWSONIS-UHFFFAOYSA-N benzenesulfonic acid Chemical compound OS(=O)(=O)C1=CC=CC=C1 SRSXLGNVWSONIS-UHFFFAOYSA-N 0.000 description 1
- 229940092714 benzenesulfonic acid Drugs 0.000 description 1
- 235000010233 benzoic acid Nutrition 0.000 description 1
- WQZGKKKJIJFFOK-VFUOTHLCSA-N beta-D-glucose Chemical compound OC[C@H]1O[C@@H](O)[C@H](O)[C@@H](O)[C@@H]1O WQZGKKKJIJFFOK-VFUOTHLCSA-N 0.000 description 1
- 239000007998 bicine buffer Substances 0.000 description 1
- OWMVSZAMULFTJU-UHFFFAOYSA-N bis-tris Chemical compound OCCN(CCO)C(CO)(CO)CO OWMVSZAMULFTJU-UHFFFAOYSA-N 0.000 description 1
- HHKZCCWKTZRCCL-UHFFFAOYSA-N bis-tris propane Chemical compound OCC(CO)(CO)NCCCNC(CO)(CO)CO HHKZCCWKTZRCCL-UHFFFAOYSA-N 0.000 description 1
- 210000000988 bone and bone Anatomy 0.000 description 1
- GDTBXPJZTBHREO-UHFFFAOYSA-N bromine Substances BrBr GDTBXPJZTBHREO-UHFFFAOYSA-N 0.000 description 1
- 229910052794 bromium Inorganic materials 0.000 description 1
- 239000000872 buffer Substances 0.000 description 1
- 125000004369 butenyl group Chemical group C(=CCC)* 0.000 description 1
- 150000001720 carbohydrates Chemical class 0.000 description 1
- 150000007942 carboxylates Chemical class 0.000 description 1
- 239000004359 castor oil Substances 0.000 description 1
- 235000019438 castor oil Nutrition 0.000 description 1
- 210000000170 cell membrane Anatomy 0.000 description 1
- 210000003850 cellular structure Anatomy 0.000 description 1
- WOWHHFRSBJGXCM-UHFFFAOYSA-M cetyltrimethylammonium chloride Chemical compound [Cl-].CCCCCCCCCCCCCCCC[N+](C)(C)C WOWHHFRSBJGXCM-UHFFFAOYSA-M 0.000 description 1
- 239000000460 chlorine Substances 0.000 description 1
- 229910052801 chlorine Inorganic materials 0.000 description 1
- 229910001914 chlorine tetroxide Inorganic materials 0.000 description 1
- 238000003759 clinical diagnosis Methods 0.000 description 1
- 150000001875 compounds Chemical class 0.000 description 1
- 238000011109 contamination Methods 0.000 description 1
- 230000001276 controlling effect Effects 0.000 description 1
- 230000002596 correlated effect Effects 0.000 description 1
- 125000004093 cyano group Chemical group *C#N 0.000 description 1
- 125000003493 decenyl group Chemical group [H]C([*])=C([H])C([H])([H])C([H])([H])C([H])([H])C([H])([H])C([H])([H])C([H])([H])C([H])([H])C([H])([H])[H] 0.000 description 1
- 230000007423 decrease Effects 0.000 description 1
- 235000014113 dietary fatty acids Nutrition 0.000 description 1
- KCFYHBSOLOXZIF-UHFFFAOYSA-N dihydrochrysin Natural products COC1=C(O)C(OC)=CC(C2OC3=CC(O)=CC(O)=C3C(=O)C2)=C1 KCFYHBSOLOXZIF-UHFFFAOYSA-N 0.000 description 1
- 238000007865 diluting Methods 0.000 description 1
- QLBHNVFOQLIYTH-UHFFFAOYSA-L dipotassium;2-[2-[bis(carboxymethyl)amino]ethyl-(carboxylatomethyl)amino]acetate Chemical compound [K+].[K+].OC(=O)CN(CC([O-])=O)CCN(CC(O)=O)CC([O-])=O QLBHNVFOQLIYTH-UHFFFAOYSA-L 0.000 description 1
- 201000010099 disease Diseases 0.000 description 1
- 208000037265 diseases, disorders, signs and symptoms Diseases 0.000 description 1
- 125000005066 dodecenyl group Chemical group C(=CCCCCCCCCCC)* 0.000 description 1
- 230000000694 effects Effects 0.000 description 1
- 230000002449 erythroblastic effect Effects 0.000 description 1
- 208000019501 erythrocyte disease Diseases 0.000 description 1
- 239000000194 fatty acid Substances 0.000 description 1
- 229930195729 fatty acid Natural products 0.000 description 1
- 238000000684 flow cytometry Methods 0.000 description 1
- 229910052731 fluorine Inorganic materials 0.000 description 1
- 239000011737 fluorine Substances 0.000 description 1
- 239000008103 glucose Substances 0.000 description 1
- ZEMPKEQAKRGZGQ-XOQCFJPHSA-N glycerol triricinoleate Natural products CCCCCC[C@@H](O)CC=CCCCCCCCC(=O)OC[C@@H](COC(=O)CCCCCCCC=CC[C@@H](O)CCCCCC)OC(=O)CCCCCCCC=CC[C@H](O)CCCCCC ZEMPKEQAKRGZGQ-XOQCFJPHSA-N 0.000 description 1
- 239000008187 granular material Substances 0.000 description 1
- 238000009499 grossing Methods 0.000 description 1
- 229960002897 heparin Drugs 0.000 description 1
- 229920000669 heparin Polymers 0.000 description 1
- 125000003187 heptyl group Chemical group [H]C([*])([H])C([H])([H])C([H])([H])C([H])([H])C([H])([H])C([H])([H])C([H])([H])[H] 0.000 description 1
- 125000006038 hexenyl group Chemical group 0.000 description 1
- 229910052739 hydrogen Inorganic materials 0.000 description 1
- 239000001257 hydrogen Substances 0.000 description 1
- 238000000338 in vitro Methods 0.000 description 1
- 208000015181 infectious disease Diseases 0.000 description 1
- 238000007689 inspection Methods 0.000 description 1
- 230000002452 interceptive effect Effects 0.000 description 1
- 239000011630 iodine Substances 0.000 description 1
- 229910052740 iodine Inorganic materials 0.000 description 1
- 125000000555 isopropenyl group Chemical group [H]\C([H])=C(\*)C([H])([H])[H] 0.000 description 1
- 230000002934 lysing effect Effects 0.000 description 1
- 229910001629 magnesium chloride Inorganic materials 0.000 description 1
- 229940049920 malate Drugs 0.000 description 1
- BJEPYKJPYRNKOW-UHFFFAOYSA-N malic acid Chemical compound OC(=O)C(O)CC(O)=O BJEPYKJPYRNKOW-UHFFFAOYSA-N 0.000 description 1
- 230000007246 mechanism Effects 0.000 description 1
- 210000001237 metamyelocyte Anatomy 0.000 description 1
- 230000009401 metastasis Effects 0.000 description 1
- 210000003470 mitochondria Anatomy 0.000 description 1
- 230000000877 morphologic effect Effects 0.000 description 1
- 210000003887 myelocyte Anatomy 0.000 description 1
- 208000025113 myeloid leukemia Diseases 0.000 description 1
- 125000001421 myristyl group Chemical group [H]C([*])([H])C([H])([H])C([H])([H])C([H])([H])C([H])([H])C([H])([H])C([H])([H])C([H])([H])C([H])([H])C([H])([H])C([H])([H])C([H])([H])C([H])([H])C([H])([H])[H] 0.000 description 1
- 125000005064 octadecenyl group Chemical group C(=CCCCCCCCCCCCCCCCC)* 0.000 description 1
- 125000004365 octenyl group Chemical group C(=CCCCCCC)* 0.000 description 1
- XCOHAFVJQZPUKF-UHFFFAOYSA-M octyltrimethylammonium bromide Chemical compound [Br-].CCCCCCCC[N+](C)(C)C XCOHAFVJQZPUKF-UHFFFAOYSA-M 0.000 description 1
- 210000003463 organelle Anatomy 0.000 description 1
- 150000007524 organic acids Chemical class 0.000 description 1
- 125000000913 palmityl group Chemical group [H]C([*])([H])C([H])([H])C([H])([H])C([H])([H])C([H])([H])C([H])([H])C([H])([H])C([H])([H])C([H])([H])C([H])([H])C([H])([H])C([H])([H])C([H])([H])C([H])([H])C([H])([H])C([H])([H])[H] 0.000 description 1
- FJKROLUGYXJWQN-UHFFFAOYSA-N papa-hydroxy-benzoic acid Natural products OC(=O)C1=CC=C(O)C=C1 FJKROLUGYXJWQN-UHFFFAOYSA-N 0.000 description 1
- 125000002255 pentenyl group Chemical group C(=CCCC)* 0.000 description 1
- VLTRZXGMWDSKGL-UHFFFAOYSA-M perchlorate Chemical compound [O-]Cl(=O)(=O)=O VLTRZXGMWDSKGL-UHFFFAOYSA-M 0.000 description 1
- 230000035699 permeability Effects 0.000 description 1
- 229940085991 phosphate ion Drugs 0.000 description 1
- 229920005646 polycarboxylate Polymers 0.000 description 1
- 229920002503 polyoxyethylene-polyoxypropylene Polymers 0.000 description 1
- 230000001737 promoting effect Effects 0.000 description 1
- 210000004765 promyelocyte Anatomy 0.000 description 1
- 125000004368 propenyl group Chemical group C(=CC)* 0.000 description 1
- 235000019260 propionic acid Nutrition 0.000 description 1
- 150000003242 quaternary ammonium salts Chemical class 0.000 description 1
- IUVKMZGDUIUOCP-BTNSXGMBSA-N quinbolone Chemical compound O([C@H]1CC[C@H]2[C@H]3[C@@H]([C@]4(C=CC(=O)C=C4CC3)C)CC[C@@]21C)C1=CCCC1 IUVKMZGDUIUOCP-BTNSXGMBSA-N 0.000 description 1
- 229960004889 salicylic acid Drugs 0.000 description 1
- 238000005070 sampling Methods 0.000 description 1
- 230000011218 segmentation Effects 0.000 description 1
- 229910052708 sodium Inorganic materials 0.000 description 1
- 239000011734 sodium Substances 0.000 description 1
- 239000001509 sodium citrate Substances 0.000 description 1
- NLJMYIDDQXHKNR-UHFFFAOYSA-K sodium citrate Chemical compound O.O.[Na+].[Na+].[Na+].[O-]C(=O)CC(O)(CC([O-])=O)C([O-])=O NLJMYIDDQXHKNR-UHFFFAOYSA-K 0.000 description 1
- 229960001790 sodium citrate Drugs 0.000 description 1
- 239000000600 sorbitol Substances 0.000 description 1
- 230000003595 spectral effect Effects 0.000 description 1
- 125000004079 stearyl group Chemical group [H]C([*])([H])C([H])([H])C([H])([H])C([H])([H])C([H])([H])C([H])([H])C([H])([H])C([H])([H])C([H])([H])C([H])([H])C([H])([H])C([H])([H])C([H])([H])C([H])([H])C([H])([H])C([H])([H])C([H])([H])C([H])([H])[H] 0.000 description 1
- 210000000130 stem cell Anatomy 0.000 description 1
- 150000003432 sterols Chemical class 0.000 description 1
- 235000003702 sterols Nutrition 0.000 description 1
- 229950000244 sulfanilic acid Drugs 0.000 description 1
- 229960003080 taurine Drugs 0.000 description 1
- 230000002123 temporal effect Effects 0.000 description 1
- 125000005063 tetradecenyl group Chemical group C(=CCCCCCCCCCCCC)* 0.000 description 1
- 230000001225 therapeutic effect Effects 0.000 description 1
- 210000001519 tissue Anatomy 0.000 description 1
- 238000002834 transmittance Methods 0.000 description 1
- LENZDBCJOHFCAS-UHFFFAOYSA-N tris Chemical compound OCC(N)(CO)CO LENZDBCJOHFCAS-UHFFFAOYSA-N 0.000 description 1
- PJVWKTKQMONHTI-UHFFFAOYSA-N warfarin Chemical compound OC=1C2=CC=CC=C2OC(=O)C=1C(CC(=O)C)C1=CC=CC=C1 PJVWKTKQMONHTI-UHFFFAOYSA-N 0.000 description 1
- 229960005080 warfarin Drugs 0.000 description 1
- 238000005406 washing Methods 0.000 description 1
Images








Classifications
-
- G—PHYSICS
- G01—MEASURING; TESTING
- G01N—INVESTIGATING OR ANALYSING MATERIALS BY DETERMINING THEIR CHEMICAL OR PHYSICAL PROPERTIES
- G01N21/00—Investigating or analysing materials by the use of optical means, i.e. using sub-millimetre waves, infrared, visible or ultraviolet light
- G01N21/62—Systems in which the material investigated is excited whereby it emits light or causes a change in wavelength of the incident light
- G01N21/63—Systems in which the material investigated is excited whereby it emits light or causes a change in wavelength of the incident light optically excited
- G01N21/64—Fluorescence; Phosphorescence
-
- C—CHEMISTRY; METALLURGY
- C09—DYES; PAINTS; POLISHES; NATURAL RESINS; ADHESIVES; COMPOSITIONS NOT OTHERWISE PROVIDED FOR; APPLICATIONS OF MATERIALS NOT OTHERWISE PROVIDED FOR
- C09B—ORGANIC DYES OR CLOSELY-RELATED COMPOUNDS FOR PRODUCING DYES, e.g. PIGMENTS; MORDANTS; LAKES
- C09B23/00—Methine or polymethine dyes, e.g. cyanine dyes
- C09B23/02—Methine or polymethine dyes, e.g. cyanine dyes the polymethine chain containing an odd number of >CH- or >C[alkyl]- groups
- C09B23/04—Methine or polymethine dyes, e.g. cyanine dyes the polymethine chain containing an odd number of >CH- or >C[alkyl]- groups one >CH- group, e.g. cyanines, isocyanines, pseudocyanines
-
- G—PHYSICS
- G01—MEASURING; TESTING
- G01N—INVESTIGATING OR ANALYSING MATERIALS BY DETERMINING THEIR CHEMICAL OR PHYSICAL PROPERTIES
- G01N15/00—Investigating characteristics of particles; Investigating permeability, pore-volume or surface-area of porous materials
- G01N15/01—Investigating characteristics of particles; Investigating permeability, pore-volume or surface-area of porous materials specially adapted for biological cells, e.g. blood cells
-
- G—PHYSICS
- G01—MEASURING; TESTING
- G01N—INVESTIGATING OR ANALYSING MATERIALS BY DETERMINING THEIR CHEMICAL OR PHYSICAL PROPERTIES
- G01N15/00—Investigating characteristics of particles; Investigating permeability, pore-volume or surface-area of porous materials
- G01N15/10—Investigating individual particles
- G01N15/14—Optical investigation techniques, e.g. flow cytometry
- G01N15/1429—Signal processing
-
- G—PHYSICS
- G01—MEASURING; TESTING
- G01N—INVESTIGATING OR ANALYSING MATERIALS BY DETERMINING THEIR CHEMICAL OR PHYSICAL PROPERTIES
- G01N15/00—Investigating characteristics of particles; Investigating permeability, pore-volume or surface-area of porous materials
- G01N15/10—Investigating individual particles
- G01N15/14—Optical investigation techniques, e.g. flow cytometry
- G01N15/1434—Optical arrangements
-
- G—PHYSICS
- G01—MEASURING; TESTING
- G01N—INVESTIGATING OR ANALYSING MATERIALS BY DETERMINING THEIR CHEMICAL OR PHYSICAL PROPERTIES
- G01N15/00—Investigating characteristics of particles; Investigating permeability, pore-volume or surface-area of porous materials
- G01N15/10—Investigating individual particles
- G01N15/14—Optical investigation techniques, e.g. flow cytometry
- G01N15/1456—Optical investigation techniques, e.g. flow cytometry without spatial resolution of the texture or inner structure of the particle, e.g. processing of pulse signals
- G01N15/1459—Optical investigation techniques, e.g. flow cytometry without spatial resolution of the texture or inner structure of the particle, e.g. processing of pulse signals the analysis being performed on a sample stream
-
- G—PHYSICS
- G01—MEASURING; TESTING
- G01N—INVESTIGATING OR ANALYSING MATERIALS BY DETERMINING THEIR CHEMICAL OR PHYSICAL PROPERTIES
- G01N21/00—Investigating or analysing materials by the use of optical means, i.e. using sub-millimetre waves, infrared, visible or ultraviolet light
- G01N21/01—Arrangements or apparatus for facilitating the optical investigation
-
- G—PHYSICS
- G01—MEASURING; TESTING
- G01N—INVESTIGATING OR ANALYSING MATERIALS BY DETERMINING THEIR CHEMICAL OR PHYSICAL PROPERTIES
- G01N21/00—Investigating or analysing materials by the use of optical means, i.e. using sub-millimetre waves, infrared, visible or ultraviolet light
- G01N21/17—Systems in which incident light is modified in accordance with the properties of the material investigated
- G01N21/47—Scattering, i.e. diffuse reflection
-
- G—PHYSICS
- G01—MEASURING; TESTING
- G01N—INVESTIGATING OR ANALYSING MATERIALS BY DETERMINING THEIR CHEMICAL OR PHYSICAL PROPERTIES
- G01N21/00—Investigating or analysing materials by the use of optical means, i.e. using sub-millimetre waves, infrared, visible or ultraviolet light
- G01N21/62—Systems in which the material investigated is excited whereby it emits light or causes a change in wavelength of the incident light
- G01N21/63—Systems in which the material investigated is excited whereby it emits light or causes a change in wavelength of the incident light optically excited
- G01N21/64—Fluorescence; Phosphorescence
- G01N21/6428—Measuring fluorescence of fluorescent products of reactions or of fluorochrome labelled reactive substances, e.g. measuring quenching effects, using measuring "optrodes"
-
- G—PHYSICS
- G01—MEASURING; TESTING
- G01N—INVESTIGATING OR ANALYSING MATERIALS BY DETERMINING THEIR CHEMICAL OR PHYSICAL PROPERTIES
- G01N33/00—Investigating or analysing materials by specific methods not covered by groups G01N1/00 - G01N31/00
- G01N33/48—Biological material, e.g. blood, urine; Haemocytometers
- G01N33/50—Chemical analysis of biological material, e.g. blood, urine; Testing involving biospecific ligand binding methods; Immunological testing
- G01N33/5005—Chemical analysis of biological material, e.g. blood, urine; Testing involving biospecific ligand binding methods; Immunological testing involving human or animal cells
- G01N33/5094—Chemical analysis of biological material, e.g. blood, urine; Testing involving biospecific ligand binding methods; Immunological testing involving human or animal cells for blood cell populations
-
- G—PHYSICS
- G01—MEASURING; TESTING
- G01N—INVESTIGATING OR ANALYSING MATERIALS BY DETERMINING THEIR CHEMICAL OR PHYSICAL PROPERTIES
- G01N33/00—Investigating or analysing materials by specific methods not covered by groups G01N1/00 - G01N31/00
- G01N33/48—Biological material, e.g. blood, urine; Haemocytometers
- G01N33/50—Chemical analysis of biological material, e.g. blood, urine; Testing involving biospecific ligand binding methods; Immunological testing
- G01N33/58—Chemical analysis of biological material, e.g. blood, urine; Testing involving biospecific ligand binding methods; Immunological testing involving labelled substances
- G01N33/582—Chemical analysis of biological material, e.g. blood, urine; Testing involving biospecific ligand binding methods; Immunological testing involving labelled substances with fluorescent label
-
- G—PHYSICS
- G01—MEASURING; TESTING
- G01N—INVESTIGATING OR ANALYSING MATERIALS BY DETERMINING THEIR CHEMICAL OR PHYSICAL PROPERTIES
- G01N15/00—Investigating characteristics of particles; Investigating permeability, pore-volume or surface-area of porous materials
- G01N15/01—Investigating characteristics of particles; Investigating permeability, pore-volume or surface-area of porous materials specially adapted for biological cells, e.g. blood cells
- G01N2015/012—Red blood cells
-
- G—PHYSICS
- G01—MEASURING; TESTING
- G01N—INVESTIGATING OR ANALYSING MATERIALS BY DETERMINING THEIR CHEMICAL OR PHYSICAL PROPERTIES
- G01N15/00—Investigating characteristics of particles; Investigating permeability, pore-volume or surface-area of porous materials
- G01N15/01—Investigating characteristics of particles; Investigating permeability, pore-volume or surface-area of porous materials specially adapted for biological cells, e.g. blood cells
- G01N2015/012—Red blood cells
- G01N2015/014—Reticulocytes
-
- G—PHYSICS
- G01—MEASURING; TESTING
- G01N—INVESTIGATING OR ANALYSING MATERIALS BY DETERMINING THEIR CHEMICAL OR PHYSICAL PROPERTIES
- G01N15/00—Investigating characteristics of particles; Investigating permeability, pore-volume or surface-area of porous materials
- G01N15/01—Investigating characteristics of particles; Investigating permeability, pore-volume or surface-area of porous materials specially adapted for biological cells, e.g. blood cells
- G01N2015/016—White blood cells
-
- G—PHYSICS
- G01—MEASURING; TESTING
- G01N—INVESTIGATING OR ANALYSING MATERIALS BY DETERMINING THEIR CHEMICAL OR PHYSICAL PROPERTIES
- G01N15/00—Investigating characteristics of particles; Investigating permeability, pore-volume or surface-area of porous materials
- G01N15/01—Investigating characteristics of particles; Investigating permeability, pore-volume or surface-area of porous materials specially adapted for biological cells, e.g. blood cells
- G01N2015/018—Platelets
-
- G—PHYSICS
- G01—MEASURING; TESTING
- G01N—INVESTIGATING OR ANALYSING MATERIALS BY DETERMINING THEIR CHEMICAL OR PHYSICAL PROPERTIES
- G01N15/00—Investigating characteristics of particles; Investigating permeability, pore-volume or surface-area of porous materials
- G01N15/10—Investigating individual particles
- G01N2015/1006—Investigating individual particles for cytology
-
- G—PHYSICS
- G01—MEASURING; TESTING
- G01N—INVESTIGATING OR ANALYSING MATERIALS BY DETERMINING THEIR CHEMICAL OR PHYSICAL PROPERTIES
- G01N15/00—Investigating characteristics of particles; Investigating permeability, pore-volume or surface-area of porous materials
- G01N15/10—Investigating individual particles
- G01N15/14—Optical investigation techniques, e.g. flow cytometry
- G01N2015/1402—Data analysis by thresholding or gating operations performed on the acquired signals or stored data
-
- G—PHYSICS
- G01—MEASURING; TESTING
- G01N—INVESTIGATING OR ANALYSING MATERIALS BY DETERMINING THEIR CHEMICAL OR PHYSICAL PROPERTIES
- G01N15/00—Investigating characteristics of particles; Investigating permeability, pore-volume or surface-area of porous materials
- G01N15/10—Investigating individual particles
- G01N15/14—Optical investigation techniques, e.g. flow cytometry
- G01N15/1434—Optical arrangements
- G01N2015/1438—Using two lasers in succession
-
- G—PHYSICS
- G01—MEASURING; TESTING
- G01N—INVESTIGATING OR ANALYSING MATERIALS BY DETERMINING THEIR CHEMICAL OR PHYSICAL PROPERTIES
- G01N15/00—Investigating characteristics of particles; Investigating permeability, pore-volume or surface-area of porous materials
- G01N15/10—Investigating individual particles
- G01N15/14—Optical investigation techniques, e.g. flow cytometry
- G01N15/1456—Optical investigation techniques, e.g. flow cytometry without spatial resolution of the texture or inner structure of the particle, e.g. processing of pulse signals
- G01N2015/1461—Coincidence detecting; Circuits therefor
-
- G—PHYSICS
- G01—MEASURING; TESTING
- G01N—INVESTIGATING OR ANALYSING MATERIALS BY DETERMINING THEIR CHEMICAL OR PHYSICAL PROPERTIES
- G01N15/00—Investigating characteristics of particles; Investigating permeability, pore-volume or surface-area of porous materials
- G01N15/10—Investigating individual particles
- G01N15/14—Optical investigation techniques, e.g. flow cytometry
- G01N2015/1486—Counting the particles
-
- G—PHYSICS
- G01—MEASURING; TESTING
- G01N—INVESTIGATING OR ANALYSING MATERIALS BY DETERMINING THEIR CHEMICAL OR PHYSICAL PROPERTIES
- G01N21/00—Investigating or analysing materials by the use of optical means, i.e. using sub-millimetre waves, infrared, visible or ultraviolet light
- G01N21/17—Systems in which incident light is modified in accordance with the properties of the material investigated
- G01N21/47—Scattering, i.e. diffuse reflection
- G01N2021/4704—Angular selective
- G01N2021/4707—Forward scatter; Low angle scatter
-
- G—PHYSICS
- G01—MEASURING; TESTING
- G01N—INVESTIGATING OR ANALYSING MATERIALS BY DETERMINING THEIR CHEMICAL OR PHYSICAL PROPERTIES
- G01N21/00—Investigating or analysing materials by the use of optical means, i.e. using sub-millimetre waves, infrared, visible or ultraviolet light
- G01N21/62—Systems in which the material investigated is excited whereby it emits light or causes a change in wavelength of the incident light
- G01N21/63—Systems in which the material investigated is excited whereby it emits light or causes a change in wavelength of the incident light optically excited
- G01N21/64—Fluorescence; Phosphorescence
- G01N21/6428—Measuring fluorescence of fluorescent products of reactions or of fluorochrome labelled reactive substances, e.g. measuring quenching effects, using measuring "optrodes"
- G01N2021/6439—Measuring fluorescence of fluorescent products of reactions or of fluorochrome labelled reactive substances, e.g. measuring quenching effects, using measuring "optrodes" with indicators, stains, dyes, tags, labels, marks
Definitions
- the present invention relates to a method for analyzing blood cells.
- the present invention also relates to a reagent for blood cell analysis.
- the present invention also relates to a reagent kit for blood cell analysis.
- the present invention also relates to a method for fluorescently staining blood cells.
- Blood includes various blood cell components such as red blood cell, white blood cell, and platelet. Analysis of these blood cells can provide information valuable for clinical diagnosis of various diseases.
- a method with use of an automated hematology analyzer has been known for use in blood cell analysis. The analysis with use of the automated hematology analyzer usually measures a sample, which is prepared with use of a dedicated reagent suited to types of the blood cells.
- a reagent commonly applicable to a plurality of types of blood cells has, however, been desired from the viewpoints of labor-saving of inspection and simplicity of the apparatus.
- WO2022/100717 describes that white blood cell was classified and counted with use of one kind of fluorescent dye and a hemolysis reagent, and that reticulocyte and platelet are classified and counted with use of the same fluorescent dye and a dilution reagent.
- a recent known method of analysis is such as irradiating blood cells with a plurality of lights of different wavelengths, with use of a hematology analyzer equipped with a plurality of light sources.
- a method for analyzing blood cells with use of a reagent which is applicable to blood cell analysis under such plurality of lights. It is therefore an object of the present invention to provide a means for blood cell analysis, with use of a reagent which is commonly applicable to classification of white blood cell and classification of reticulocyte and platelet, as well as applicable to blood cell analysis under a plurality of lights.
- a cyanine-based fluorescent dye that can be excited by light, whose wavelength is 315 nm or longer and 600 nm or shorter, and can bind to a nucleic acid, is commonly applicable to classification of white blood cell, classification of reticulocyte and platelet, as well as blood cell analysis under a plurality of lights, thereby completing the invention described in [1] to [19] below.
- the present invention can provide a method for analyzing blood cells with use of a fluorescent dye that can be used in common for the classification of white blood cell, classification of platelet and reticulocyte, as well as applicable to blood cell analysis under a plurality of lights.
- the present invention can also provide a reagent for blood cell analysis and a reagent kit for blood cell analysis, which are applicable to this method.
- the present invention can also provide a method for fluorescently staining blood cells with use of the aforementioned fluorescent dye.
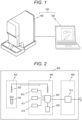
- An analysis system 500 has a measurement unit 400 as a measurement apparatus, and an analysis unit 300 as an analyzer.
- the analysis unit 300 is typically a personal computer having installed thereon software for analyzing specimen to be measured.
- the analysis unit 300 also takes part in operational control of the measurement unit 400.
- the analysis system 500 may alternatively be structured, with the analysis unit 300 incorporated in the measurement unit 400.
- the measurement unit 400 is a unit for measuring the specimen, and contains a flow cytometer.
- the specimen and a reagent are mixed to prepare a measurement sample.
- the measurement sample is prepared with use of reagents, which are a staining reagent and a hemolysis reagent.
- the measurement sample is prepared with use of reagents, which are a staining reagent and a dilution reagent.
- the staining reagent contains a fluorescent dye for staining particle.
- the hemolysis reagent contains a surfactant and a solvent.
- the dilution reagent contains a buffering agent and a solvent.
- the specimen, the staining reagent, the hemolysis reagent, and the dilution reagent will be detailed later.
- particles stained with the fluorescent dye in the measurement sample are analyzed.
- the "particles in the measurement sample” refers to elements contained in the measurement sample, which can be individually measured by an FCM detector 460 described later.
- the particles in the measurement sample are exemplified by cell contained in the specimen, red blood cell ghosts, platelet aggregation, lipid particle, fungi, and bacteria.
- the term "cell” encompasses various types of blood cell and platelet.
- the red blood cell ghost may be produced also due to hemolysis caused by other than the hemolysis reagent, that is, caused by physical impact on blood collection tube; or low pH or low osmotic pressure of the measurement sample.
- the measurement sample is measured with an FCM detector 460 (see Fig. 2 ), described later, in the measurement unit 400. From the measurement, acquired are an optical signal related to fluorescence emitted from the fluorescent dye on the stained particles in the measurement sample, and an optical signal related to scattered light emitted from the particle.
- the "fluorescent dye on the particle” refers to a fluorescent dye, which is bound to the particle by staining. Mode of binding between the particle and the fluorescent dye is not particularly limited, as long as the particle and the fluorescent dye are integrally measurable by the flow cytometer.
- the acquired optical signals are subjected to A/D conversion. Digital data is thus acquired.
- the analysis unit 300 analyzes the digital data obtained by the measurement unit 400, to identify and/or classify the particles in the measurement sample.
- the measurement unit 400 contains a sample preparation unit 440, a specimen suction unit 450, and the FCM detector 460.
- the sample preparation unit 440 contains a reagent containers 410, 411 and 414, a reaction chamber 420, and a waste liquid chamber 430.
- the reagent container 410 stores the dilution reagent
- the reagent container 411 stores the hemolysis reagent
- the reagent container 414 stores the staining reagent.
- the reagent containers 410, 411 and 414 are individually connected through liquid feeding tubes to the reaction chamber 420.
- the dilution reagent and the staining reagent are injected through the individual liquid feeding tubes into the reaction chamber 420.
- the specimen suction unit 450 contains a suction tube 200.
- the suction tube 200 sucks the specimen contained in the blood collection tube 100, and discharges the specimen into the reaction chamber 420.
- the reaction chamber 420 is connected through a liquid feeding tube, to the FCM detector 460.
- the reaction chamber 420 is a container for preparing a measurement sample.
- mixed are the specimen, the staining reagent that contains a fluorescent dye, and the hemolysis reagent or the dilution reagent, to prepare the measurement sample.
- the measurement sample in the reaction chamber 420 is fed through the liquid feeding tube to the FCM detector 460, and measured.
- the FCM detector 460 acquires various optical signals emitted from each particle in the measurement sample. After completion of the measurement with the FCM detector 460, the measurement sample that remained in the reaction chamber 420 is discarded in the waste liquid chamber 430.
- the reaction chamber 420 is washed with an unillustrated washing mechanism, before preparation of the next measurement sample.
- the sample preparation unit 440, the specimen suction unit 450, and the FCM detector 460 are connected to an interface (IF) unit 488.
- the FCM detector 460 is connected to an analog processor 481 and an A/D converter 482.
- Analog processor 481 processes an analog signal output from the FCM detector 460, and the A/D converter 482 converts the analog signal output from the analog processor 481 into a digital signal.
- the measurement unit 400 is connected through an IF unit 489 to the analysis unit 300.
- An IF unit 484, the IF unit 488, and the IF unit 489 are connected to a bus.
- the FCM detector 460 has a first light source 411a, a second light source 411b, a flow cell 413, dichroic mirrors 418a, 418b, 418c, side-scattered light receivers 412a, 412b, a forward-scattered light receiver 416, and side-fluorescence receivers 422a, 422b.
- the first light source 411a and the second light source 411b emit light of different wavelengths. For example, the first light source 411a emits light of a first wavelength, and the second light source 411b emits light of a second wavelength.
- the first wavelength is preferably a wavelength that hemoglobin can absorb. Such wavelength typically falls in the range from 315 nm or longer to 600 nm or shorter, preferably 400 nm or longer and 490 nm or shorter, more preferably 400 nm or longer and 450 nm or shorter, and yet more preferably 400 nm or longer and 410 nm or shorter.
- the second wavelength is different from the first wavelength, whose wavelength is preferably not absorbable by hemoglobin. Such wavelength typically falls in the range from 610 nm or longer to 750 nm or shorter, preferably 620 nm or longer and 700 nm or shorter, and more preferably 633 nm or longer and 643 nm or shorter.
- a semiconductor laser light source for example, is applicable to the first and second light sources.
- the measurement sample prepared in the reaction chamber 420 is fed to the flow cell 413 of the FCM detector 460.
- the measurement sample flows in a direction perpendicular to this page.
- light emitted from the first light source 411a is reflected on the dichroic mirror 418a, and then irradiated on each particle in the measurement sample that flows through the flow cell 413.
- Light emitted from the second light source 411b transmits through the dichroic mirror 418a, and then irradiated on each particle in the measurement sample that flows through the flow cell 413.
- the forward-scattered light receiver 416 is arranged so as to receive forward-scattered light emitted from the particle upon being irradiated with the light from the second light source 411b.
- the light receiver 416 may alternatively be arranged so as to receive the forward-scattered light emitted from the particle upon being irradiated with the light from the first light source 411a.
- an additional light receiver may be arranged so as to receive the forward-scattered light emitted from the particle upon being irradiated with the light from the first light source 411a.
- the forward-scattered light is typically a scattered light which may be received at a receiving angle of 0 to approximately 20 degrees.
- the forward-scattered light receiver 416 is typically a photodiode.
- the side-scattered light (first side-scattered light) that corresponds to the light irradiated by the first light source 411a is reflected on the dichroic mirror 418b, and then received by the side-scattered light receiver 412a.
- the side-scattered light (second side-scattered light) corresponded to the light irradiated by the second light source 411b is reflected on the dichroic mirror 418c, and then received by the side-scattered light receiver 412b.
- the side-scattered light is typically a scattered light which may be received at a receiving angle of approximately 20 degrees to approximately 90 degrees.
- the side-scattered light receivers 412a and 412b each are typically a photodiode.
- the fluorescent dye represented by formula (I) above is excited by the first wavelength.
- the side-fluorescence (first side-fluorescence) that corresponds to the light emitted upon excitation of the fluorescent dye transmits through the dichroic mirror 418b, and then received by the side-fluorescence receiver 422a.
- the example of Fig. 4 illustrates a structure capable of receiving the side-fluorescence (second side-fluorescence) that corresponds to the light emitted upon excitation of the fluorescent dye, for the convenience of explaining the optical system. That is, the second side-fluorescence transmits through dichroic mirror 418c, and then received by the side-fluorescence receiver 422b.
- the side-fluorescence receivers 422a and 422b each is typically an avalanche photodiode.
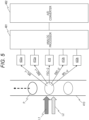
- the light emitted from the first light source 411a is light L1 of the first wavelength
- the light emitted from the second light source 411b is light L2 of the second wavelength.
- the particle P that passes through the flow cell 413 emits forward-scattered lights that individually correspond to the light of the first wavelength and the light of the second wavelength, ahead of the direction of travel of light.
- Fig. 5 illustrates only the second forward-scattered light (FSC-2) that corresponds to the light of the second wavelength, while omitting the first forward-scattered light (FSC-1) that corresponds to the light of the first wavelength.
- FSC-1 first side-scattered light
- SSC-2 second side-scattered light
- the particle P stained with the fluorescent dye that can be excited with the light of the first wavelength is the first side-fluorescence (SFL-1) excited with the light of the first wavelength, emitted laterally with respect to the direction of travel of light.
- the example of Fig. 5 illustrates a state in which both of SFL-1, and the second side-fluorescence (SFL-2) excited by the light of the second wavelength are generated, laterally to the direction of travel of light, for the convenience of explaining the optical system.
- FSC-2, SSC-1, SFL-1, SSC-2, and SFL-2 are received by the light receivers 416, 412a, 422a, 412b, and 422b, respectively.
- Each light receiving element outputs a wavy electric signal (also referred to as an analog signal) that contains a pulse corresponded to the received light intensity.
- the analog signal corresponded to FSC-2 is also referred to as the "second forward-scattered light signal", the analog signal corresponded to the SSC-1 also as the "first side-scattered light signal”, the analog signal corresponded to SFL-1 also as the "first fluorescence signal”, the analog signal corresponded to SSC-2 also as the "second side-scattered light signal”, and the analog signal corresponded to SFL-2 also as the "second fluorescence signal”.
- the analog signal corresponded to FSC-1 is also referred to as the "first forward-scattered light signal".
- One pulse of each analog signal corresponds to one particle (one cell, for example).
- the analog signals corresponded to the various types of light are individually input to the analog processor 481, and subjected to processes such as noise removal and smoothing.
- the A/D converter 482 samples analog signals output from the analog processor 481, at a predetermined sampling rate (for example, 1024 points sampled at 10 nanosecond intervals, or 128 points sampled at 80 nanosecond intervals, or 64 points sampled at 160 nanosecond intervals).
- the A/D converter 482 digitizes the sampled analog signal, to produce waveform data.
- the A/D converter 482 samples and digitizes five types of analog signals that correspond to the individual cells that flow through the flow cell 413, to create waveform data including the second forward-scattered light signal, the first side-scattered light signal, the first fluorescence signal, the second side-scattered light signal, and the second fluorescence signal. In a case where FSC-1 is received, also waveform data of the first forward-scattered light signal is created.
- the A/D converter 482 also calculates a feature parameter that represents a morphological feature of each cell, from the waveform data of each signal. Such feature parameter is exemplified by peak value (height of pulse peak), pulse width, pulse area, transmittance, Stokes shift, ratio, temporal change, and values correlated thereto.
- the optical information can be the aforementioned feature parameter.
- the optical information includes the fluorescence information and the scattered light information.
- the fluorescence information relates to the fluorescence generated from the fluorescent dye on the stained particle, upon irradiation of the measurement sample with light of the first wavelength.
- the fluorescence information is not particularly limited as long as it reflects the amount of the fluorescent dye that has stained the nucleic acid in nucleated cell.
- the fluorescence information is preferably peak value or pulse area of the first fluorescence signal, and is more preferably the peak value of the first fluorescence signal.
- the peak value of the first fluorescence signal herein is also referred to as "first fluorescence intensity".
- the first fluorescence intensity is understood to be intensity of fluorescence from the fluorescent dye on the particle irradiated with the light of the first wavelength.
- the scattered light information acquired herein may alternatively be a plurality of types of scattered light, which are typically a first scattered light information, a second scattered light information, and a third scattered light information.
- the first scattered light information can be information related to the side-scattered light generated from the particles, upon irradiation of the measurement sample with the light of the first wavelength.
- the second scattered light information can be information related to the side-scattered light generated from the particles, upon irradiation of the measurement sample with the light of the second wavelength.
- the third scattered light information can be information related to the forward-scattered light generated from the particles, upon irradiation of the measurement sample with the light of the second wavelength.
- Information on the side-scattered light is not particularly limited as long as it reflects internal information such as complexity of cellular structure, granule characteristic, nuclear structure, and degree of segmentation.
- Information on the forward-scattered light is not particularly limited as long as it reflects size of the particle.
- the first scattered light information is preferably peak value or pulse area of the first side-scattered light signal, and is more preferably the peak value of the first side-scattered light signal.
- the second scattered light information is preferably a peak value or a pulse area of the second side-scattered light signal, and is more preferably the peak value of the second side-scattered light signal.
- the third scattered light information is preferably a peak value or a pulse area of the second forward-scattered light signal, and is more preferably the peak value of the second forward-scattered light signal.
- the peak value of the first side-scattered light signal is also referred to as "first side-scattered light intensity”
- the peak value of the second side-scattered light signal is also referred to as “second side-scattered light intensity”
- the peak value of the second forward-scattered light signal is also referred to as "second forward-scattered light intensity”.
- the first side-scattered light intensity is understood to be intensity of the first side-scattered light emitted from the particle irradiated with the light of the first wavelength.
- the second side-scattered light intensity is understood to be intensity of the second side-scattered light emitted from the particle irradiated with the light of the second wavelength.
- the second forward-scattered light intensity is understood to be intensity of the forward-scattered light emitted from the particle irradiated with the light of the second wavelength.
- the analysis unit 300 is electrically connected through the interface unit 304 to the measurement unit 400.
- the interface unit 304 is typically an USB interface.
- the analysis unit 300 contains a controller 301, a bus 302, a storage unit 303, an interface unit 304, a display 305, and an operation unit 306.
- the analysis unit 300 is typically constituted by a personal computer (see the analysis unit 300 in Fig. 1 ), and executes a program product stored in the storage unit 303, to control the measurement unit 400 of the analysis system 500.
- the analysis unit 300 analyzes data that includes the optical information acquired by the measurement unit 400, and displays an analysis result on the display 305.
- the analysis unit 300 may also classify the cells with reference to the optical information.
- the storage unit 303 typically stores a program product for controlling the measurement unit 400, and a program product for analyzing data acquired by the measurement unit 400.
- the display 305 typically displays result of analysis of data acquired by the measurement unit 400.
- the operation unit 306 has a keyboard, and a pointing device that contains a mouse or a touch panel.
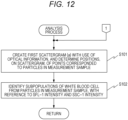
- step S 11 the controller 301 of the analysis unit 300 receives a measurement start instruction from the user, through the operation unit 306. Upon receiving the measurement start instruction, the controller 301 transmits instruction data for instructing the measurement start to the measurement unit 400. The measurement unit 400 receives the instruction data, and executes a measurement process in step S12.
- the method for analyzing blood cells of this embodiment typically encompasses a first embodiment and a second embodiment below.
- first embodiment a measurement sample prepared under hemolytic conditions is measured, and white blood cell in the measurement sample is classified.
- second embodiment the measurement process and the analysis process will vary, depending on a target to be measured designated by the user. With white blood cell designated, the measurement process and the analysis process will take place in the same manner as in the first embodiment. With reticulocyte and platelet designated, the measurement sample prepared under non-hemolytic conditions is measured, and reticulocyte and platelet are classified from the particles in the measurement sample.
- step S21 the controller 301 of the analysis unit 300 instructs the measurement unit 400 to prepare the measurement sample from the specimen, under hemolytic conditions. More specifically, the measurement unit 400 mixes the specimen, the staining reagent, and the hemolysis reagent in the reaction chamber 420, to prepare the measurement sample.
- step S22 the controller 301 instructs the measurement unit 400 to feed the measurement sample to the FCM detector 460, and to implement optical measurement by flow cytometry. The measurement unit 400 thus detects optical information of each particle in the measurement sample, typically including waveform data of SSC-1, SSC-2, FSC-2, and SFL-1.
- step S23 the controller 301 instructs the measurement unit 400 to transmit the optical information to the analysis unit 300. The measurement process thus finishes.
- the analysis unit 300 then implements the analysis process in step S13 in Fig. 7 .
- step S31 the controller 301 of the analysis unit 300 receives a measurement start instruction from the user, through the operation unit 306.
- the target to be measured corresponds to any type of blood cell to be analyzed, which is exemplified by white blood cell, reticulocyte, and platelet.
- Input for designating the target to be measured is acceptable, typically through a screen for selecting the target to be measured, displayed on the display 305. More specifically, the controller 301 displays a selection screen on which the target to be measured is designated, on the display 305.
- the user can designate the target to be measured, which is white blood cell, or, reticulocyte and platelet. After designating the target to be measured, and upon user's decision regarding the measurement start made on the screen, the measurement takes place.
- the controller 301 Upon acceptance, by the controller 301 in step S31, of a designation of white blood cell as the target to be measured, the controller 301 then causes in step S32 the measurement unit 400 to prepare the measurement sample from the specimen under hemolytic conditions. Preparation of the measurement sample under hemolytic conditions is as described previously.
- step S31 upon acceptance, by the controller 301 in step S31, of a designation of reticulocyte and platelet as the target to be measured, the controller 301 then causes in step S33 the measurement unit 400 to prepare the measurement sample from the specimen under non-hemolytic conditions. More specifically, the measurement unit 400 mixes the specimen, the staining reagent, and the dilution reagent in the reaction chamber 420, to prepare the measurement sample. The hemolysis reagent is not used under the non-hemolytic conditions. Steps S34 and S35 are the same as steps S22 and S23, respectively.
- the analysis unit 300 then implements the analysis process in step S13 in Fig. 7 . Exemplary analysis processes of the individual embodiments will be described later.
- the specimen is blood specimen.
- the blood specimen is exemplified by whole blood, and dilution of the whole blood.
- the whole blood is typically peripheral blood collected from the subject.
- the blood specimen may contain an anticoagulant.
- the anticoagulants is exemplified by ethylenediaminetetraacetate (EDTA), EDTA salts (EDTA ⁇ 2K, EDTA 2Na, for example), sodium citrate, heparin, and warfarin.
- EDTA ethylenediaminetetraacetate
- EDTA ⁇ 2K, EDTA 2Na, for example sodium citrate
- heparin heparin
- warfarin ethylenediaminetetraacetate
- the dilution of whole blood is obtainable typically by diluting the whole blood with a suitable aqueous solvent, preferably with a dilution reagent described later.
- the aqueous solvent is exemplified by water, physiological saline, and aque
- the particles in the measurement sample are derived from blood components of the specimen.
- the "blood components” encompass the elements having been known to reside in blood, and abnormal cell.
- the elements having been known to reside in blood are typically blood cells usually contained in peripheral blood of healthy person. Such blood cells are exemplified by white blood cell, mature red blood cell, reticulocyte, and platelet.
- the "mature red blood cell” is a terminally differentiated red blood cell having neither nucleus nor nucleic acid.
- the term “mature red blood cell” herein is used for distinguishing this cell from reticulocyte.
- the mature red blood cell and reticulocyte if not needed to be distinguished herein, may be collectively referred to as "red blood cell” or "RBC”.
- the "reticulocyte” is a young red blood cell derived from erythroblastic cell in bone marrow, which is immediately after enucleated and released into peripheral blood.
- the reticulocyte usually becomes mature red blood cell in approximately one day.
- the reticulocyte contains therein a small amount of ribonucleic acid, and organelles such as ribosome and mitochondria, all of which are not found in mature red blood cell.
- platelet herein encompasses immature platelet and large platelet.
- Immature platelet also referred to as reticulated platelet, is a young platelet that has just been released into the peripheral blood.
- the mature platelet does not contain nucleic acid, whereas the immature platelet contains a small amount of ribonucleic acid.
- the "large platelet” has a diameter of 4 ⁇ m or larger. The platelet is usually 2 to 3 ⁇ m in diameter.
- abnormal cell refers to a cell that does not normally appear in blood.
- the abnormal cell is exemplified by immature granulocyte.
- the immature granulocyte is a progenitor cell of granulocyte, and is exemplified by promyelocyte, myelocyte, and metamyelocyte.
- the immature granulocyte usually found in bone marrow, may occasionally appear in blood, typically due to myeloid leukemia, bone metastasis, or severe infection.
- white blood cell also encompasses the immature granulocyte.
- the abnormal cell also encompasses non-cellular particle and microorganism.
- the non-cellular particle is exemplified by platelet aggregation, red blood cell ghost, and lipid particle.
- the microorganism is exemplified by bacteria and fungi.
- the platelet aggregation occurs in a blood collection tube, due to contamination with tissue fluid during blood collection, insufficient mixing, or action of EDTA.
- the hemolysis reagent used for preparing the measurement sample will be described.
- the hemolysis reagent is a reagent for lysing red blood cell in the specimen, upon mixed with the specimen.
- the hemolysis reagent contains a surfactant, and is used in combination with a staining reagent that contains a fluorescent dye.
- the surfactant can hemolyze red blood cells in the specimen, and can cause damage to cell membrane of cells other than red blood cell, to an extent enough to allow the fluorescent dye to pass therethrough.
- the surfactant is exemplified by nonionic surfactant, cationic surfactant, and combinations thereof.
- the hemolysis reagent preferably contains the nonionic surfactant.
- the nonionic surfactant is exemplified by those represented by formula (II) below: R 1 -R 2 -(CH 2 CH 2 O) n -H (II) (where, R 1 represents an alkyl group, an alkenyl group or an alkynyl group having 8 or more and 25 or less carbon atoms, and R 2 represents an oxygen atom, -(COO)- or a group represented by formula (III) below: where, n represents an integer of 10 or larger and 50 or smaller).
- Concentration of the nonionic surfactant represented by formula (II), in the hemolysis reagent, is typically 0.5 g/L or higher and 5 g/L or lower.
- the nonionic surfactant represented by formula (II) is specifically exemplified by polyoxyethylene alkyl ether, polyoxyethylene sterol, polyoxyethylene castor oil, polyoxyethylene sorbitol fatty acid ester, polyoxyethylene alkylamine, polyoxyethylene polyoxypropylene alkyl ether, and combinations thereof. Among them, polyoxyethylene alkyl ether is preferred. Only one kind, or two or more kinds of the nonionic surfactant may be contained in the hemolysis reagent.
- the hemolysis reagent may further contain a nonionic surfactant, besides the nonionic surfactant represented by formula (II).
- the hemolysis reagent may further contain a cationic surfactant.
- the cationic surfactant is exemplified by quaternary ammonium salt-type surfactant, pyridinium salt-type surfactant, and combinations thereof.
- the quaternary ammonium salt-type surfactant suitably used herein is preferably a surfactant having 9 to 30 carbon atoms in total, represented by formula (IV) below. Only one kind, or two or more kinds of the cationic surfactant may be contained in the hemolysis reagent.
- R 1 represents an alkyl group or an alkenyl group having 6 to 18 carbon atoms
- each of R 2 and R 3 identically or differently, represents an alkyl group having 1 to 4 carbon atoms, or an alkenyl group
- R 4 represents an alkyl group having 1 to 4 carbon atoms, an alkenyl group, or a benzyl group
- X - represents a halogen ion.
- the "halogen” is fluorine, chlorine, bromine, or iodine.
- R 1 preferably represents an alkyl group or an alkenyl group having 6, 8, 10, 12, or 14 carbon atoms.
- a linear alkyl group is particularly preferred.
- R 1 is more specifically exemplified by an octyl group, a decyl group, or a dodecyl group.
- each of R 2 and R 3 identically or differently, represents a methyl group, an ethyl group, or a propyl group.
- R 4 preferably represents a methyl group, an ethyl group, or a propyl group.
- the pyridinium salt-type surfactant is typically exemplified by a surfactant represented by formula (V):
- the hemolysis reagent may contain a buffering agent for keeping pH constant.
- the buffering agent is exemplified by inorganic acid salt, organic acid salt, Good's buffer, and combinations thereof.
- the inorganic acid salt is exemplified by phosphate, borate, and combinations thereof.
- the organic acid salt is exemplified by citrate, malate, and combinations thereof.
- the Good's buffer is exemplified by MES, Bis-Tris, ADA, PIPES, Bis-Tris-Propane, ACES, MOPS, MOPSO, BES, TES, HEPES, HEPPS, Tricine, Tris, Bicine, TAPS, and combinations thereof.
- the hemolysis reagent may further contain an aromatic organic acid. Concentration of the aromatic organic acid in the hemolysis reagent is not particularly limited.
- the aromatic organic acid herein means acid that has at least one aromatic ring in the molecule, and salt thereof.
- the aromatic organic acid is exemplified by aromatic carboxylic acid, and aromatic sulfonic acid.
- the aromatic carboxylic acid is exemplified by phthalic acid, benzoic acid, salicylic acid, hippuric acid, salts thereof, and combinations thereof.
- the aromatic sulfonic acid is exemplified by p-aminobenzenesulfonic acid, benzenesulfonic acid, salts thereof, and combinations thereof.
- aromatic organic acid Only one kind, or two or more kinds of the aromatic organic acid may be contained in the hemolysis reagent. Some aromatic organic acid can occasionally demonstrate a buffering function. When using the aromatic organic acid with the buffering function, use of the buffering agent is optional. The aromatic organic acid may be combined with the buffering agent.
- the hemolysis reagent is preferably a liquid reagent.
- a solvent is not particularly limited as long as it can dissolve the individual components such as the aforementioned surfactant.
- the solvent is exemplified by water, organic solvent, and mixtures thereof.
- the organic solvent is preferably a water-miscible solvent, and is exemplified by alcohol having 1 to 6 carbon atoms, ethylene glycol, diethylene glycol, polyethylene glycol, and DMSO.
- pH of the hemolysis reagent is not particularly limited.
- the pH of the hemolysis reagent is typically 4.5 or higher, and preferably 5 or higher.
- the pH of the hemolysis reagent is typically 11 or lower, and preferably 10 or lower.
- the pH is adjustable with use of any of known bases (such as sodium hydroxide) or acids (such as hydrochloric acid).
- the hemolysis reagent may have an osmotic pressure not particularly limited, which is preferably 150 mOsm/kg ⁇ H 2 O or lower from the viewpoint of hemolysis efficiency of red blood cell.
- the osmotic pressure may be adjusted by adding an appropriate osmoregulator.
- the osmoregulator is exemplified by sugar, amino acid, organic solvent, sodium chloride, and combinations thereof.
- the hemolysis reagent usable herein may be any of commercially available hemolysis reagents for blood cell analysis. Such reagents are exemplified by Lysercell WDF (Sysmex Corporation) and Lysercell WDF II (Sysmex Corporation).
- the dilution reagent used for preparing the measurement sample will be described.
- the dilution reagent preferably contains a solution of the buffering agent.
- Preferred example of the solvent includes water and physiological saline. Water is particularly preferred.
- the buffering agent preferably demonstrates a buffering function within a pH range from 6 or higher and 11 or lower. Such buffers is selectable typically from carboxylate, phosphate, Good's buffer, taurine, and triethanolamine.
- the dilution reagent typically has a pH of 6 or higher and 11 or lower, which is preferably 7 or higher and 10 or lower, and more preferably 8 or higher and 9.5 or lower.
- a preferred dilution reagent is an aqueous solution of the buffering agent, having a pH of 6 or higher and 11 or lower.
- the dilution reagent may further contain, besides the buffering agent, components such as osmotic pressure compensator, staining accelerator, highly-charged anion, and preservative.
- the osmotic pressure compensator is a substance capable of maintaining osmotic pressure of the dilution reagent within an appropriate range.
- the osmotic pressure compensator is exemplified by alkali metal salt of organic acid such as propionic acid; saccharide such as glucose or mannose; alkali metal halide such as sodium chloride; and alkaline earth metal halide such as magnesium chloride.
- the osmotic pressure compensator may be used singly or in combination of two or more kinds thereof.
- the osmotic pressure compensator when used, is added to the dilution reagent, so as to adjust the osmotic pressure of the dilution reagent preferably to 150 mOsm/kg ⁇ H 2 O or higher and 600 mOsm/kg ⁇ H 2 O or lower.
- the staining accelerator is a substance capable of promoting permeability of the fluorescent dye into the blood cells.
- the staining accelerator is exemplified by surfactant, which is preferably cationic surfactant.
- Quaternary ammonium salt type surfactant is particularly preferred as the cationic surfactant, which is exemplified by decyltrimethylammonium bromide (DTAB), lauryltrimethylammonium chloride (LTAC), octyltrimethylammonium bromide, cetyltrimethylammonium chloride, and myristyltrimethylammonium bromide.
- the cationic surfactant may be used singly or in combination of two or more kinds thereof.
- the highly-charged anion is added to the dilution reagent, in order to suppress non-specific staining of red blood cell with the fluorescent dye.
- the highly-charged anion is exemplified by sulfate ion, phosphate ion, carbonate ion, and polycarboxylate ion. Compounds capable of supplying these ions are exemplified by citric acid, sulfuric acid, phosphoric acid, EDTA, and alkali metal salts thereof.
- the highly-charged anion may be used singly or in combination of two or more kinds thereof.
- the preservative contained in the dilution reagent is exemplified by sodium 2-pyridylthio-1-oxide and ⁇ -phenethyl alcohol.
- the method for analyzing blood cells of this embodiment may employ a commercially available dilution reagent.
- the commercially available dilution reagent is exemplified by CELLPACK (registered trademark) DFL (Sysmex Corporation).
- the fluorescent dye suitable for the staining reagent is a fluorescent dye represented by formula (I) above.
- This fluorescent dye is a cyanine-based fluorescent dye that can be excited by the light of the first wavelength, and can bind to nucleic acid. With such binding property to nucleic acid, the fluorescent dye makes it possible to distinguish nucleic acid-free cells such as mature red blood cell and platelet, from nucleic acid-containing cells such as reticulocyte and white blood cells. Since the fluorescent dye represented by formula (I) above has a maximum absorption wavelength fallen in the range of the first wavelength, so that the fluorescence from this fluorescence dye may be suppressed from interfering with the scattered light that corresponds to the light of the second wavelength.
- alkyl group can be either linear or branched.
- the alkyl group having 1 to 18 carbon atoms represented by R 1 to R 4 and R 6 to R 8 in formula (I), is exemplified by methyl, ethyl, propyl, isopropyl, t-butyl, n-butyl, isopentyl, neopentyl, t-pentyl, isohexyl, heptyl, octyl, decyl, dodecyl, tetradecyl, hexadecyl, and octadecyl.
- the alkyl group preferably has 1 to 10 carbon atoms, in which the number of carbon atoms is more preferably 1 to 6, and is particularly 1 to 3.
- Preferred examples of the alkyl group include methyl, ethyl, propyl, isopropyl, t-butyl, n-butyl, isopentyl, neopentyl, t-pentyl, and isohexyl.
- the alkyl group represented by R 5 in formula (I) preferably has 1 to 3 carbon atoms.
- alkenyl group can be either linear or branched.
- the alkenyl group having 3 to 20 carbon atoms, represented by R 1 and R 2 in formula (I), is exemplified by allyl, propenyl, isopropenyl, butenyl, isobutenyl, pentenyl, isopentenyl, hexenyl, heptenyl, octenyl, decenyl, dodecenyl, tetradecenyl, hexadecenyl, octadecenyl, and icosenyl.
- the alkenyl group preferably has 3 to 14 carbon atoms, in which the number of carbon atoms is more preferably 3 to 10, and is particularly 3 to 6.
- the substituent of the phenyl group is exemplified by -NH 2 , halogen, -OH, - SH, -CN, -NO 2 , -COOH, and alkyl group having 1 to 6 carbon atoms.
- the substituent on the benzyl group is exemplified by -CN, -COOH, -NH 2 , -NO 2 , -OH, -SH, alkyl group having 1 to 18 carbon atoms, alkoxy group having 1 to 6 carbon atoms, alkylamino group having 1 to 6 carbon atoms, acylamino group having 1 to 6 carbon atoms, halogen, and haloalkyl group having 1 to 6 carbon atoms.
- "Haloalkyl group” is an alkyl group having at least one hydrogen substituted with halogen. In the haloalkyl group having two or more halogens, types of such halogens may be same or different.
- the fluorescent dye represented by formula (I) is exemplified by 3-methyl-2-[(3-methyl-2-benzoxazolinylidene)methyl]benzoxazolium, 3-ethyl-2-[(3-ethyl-2-benzothiazolinylidene)methyl]benzothiazolium, 3-ethyl-2-[(3-ethyl-6-methyl-2-benzothiazolinylidene)methyl]-6-methyl-benzothiazolium, 3-ethyl-2-[(3-ethyl-2-benzoxazolinylidene)methyl]benzoxazolium, 3-ethyl-2-[(3-ethyl-2-benzothiazolinylidene)methyl]benzoxazolium, 3-ethyl-6-methyl-2-[(3-ethyl-6-methyl-2-benzothiazolinylidene)methyl]benzothiazolium, 3-methyl-2-[(1,3,3
- Preferred fluorescent dyes include 3-ethyl-2-[(3-ethyl-2-benzothiazolinylidene)methyl]benzothiazolium, 3-ethyl-2-[(3-ethyl-6-methyl-2-benzothiazolinylidene)methyl]-6-methyl-benzothiazolium, 3-ethyl-2-[(3-ethyl-2-benzothiazolinylidene)methyl]benzoxazolium, 3-ethyl-6-methyl-2-[(3-ethyl-6-methyl-2-benzothiazolinylidene)methyl]benzothiazolium, 3-methyl-2-[(1,3,3-trimethyl-2-indolinylidene)methyl]benzothiazolium, and 1,3,3-trimethyl-2-[(3-methyl-2-benzoxazolinylidene)methyl]-3H-indolium.
- the staining reagent preferably contains a solvent of the fluorescent dye.
- the solvent is not particularly limited as long as it can dissolve the fluorescent dye.
- the solvent is exemplified by water, organic solvent, and mixtures thereof.
- the organic solvent is exemplified by alcohol having 1 to 6 carbon atoms, ethylene glycol, diethylene glycol, polyethylene glycol, and dimethyl sulfoxide (DMSO).
- Concentration of the fluorescent dye in the staining reagent may be suitably determined, depending on types of the fluorescent dye.
- the concentration of the fluorescent dye is typically 100 ppm or higher, preferably 500 ppm or higher, and more preferably 1000 ppm or higher.
- Concentration of the fluorescent dye is typically 100000 ppm or lower, preferably 50000 ppm or lower, and more preferably 10000 ppm or lower.
- the method for analyzing blood cells of this embodiment no longer needs staining of the cells with use of an antibody labeled with the fluorescent dye.
- the fluorescent dye does not contain an antibody.
- the staining reagent that contains the fluorescent dye may also be provided as a reagent for blood cell analysis, used for the method for analyzing blood cells of this embodiment.
- the reagent for blood cell analysis of this embodiment may typically have a form such that a solution of the fluorescent dye is filled in a container.
- reference sign 11 denotes a container, having the reagent for blood cell analysis of this embodiment filled therein.
- the container 11, when enclosed in a package box, may be typically accompanied by a package insert that describes composition of the reagent for blood cell analysis, directions for use, storage and so forth, and a cushion material for cushioning external impact, enclosed therein.
- the staining reagent that contains the fluorescent dye, and the hemolysis reagent may also be provided in the form of a reagent kit for blood cell analysis, used for the method for analyzing blood cells of this embodiment.
- the reagent for blood cell analysis of this embodiment may typically be in the form such that a solution of the fluorescent dye, and the hemolysis reagent are individually filled in containers.
- reference sign 21 denotes a reagent kit for blood cell analysis of this embodiment
- reference sign 22 denotes a first container that contains a solution of the fluorescent dye
- reference sign 23 denotes a second container that contains the hemolysis reagent.
- the reagent kit for blood cell analysis of this embodiment may be enclosed in a package box.
- the reagent kit 21, when enclosed in the package box, may be typically accompanied by a package insert and cushion material enclosed therein.
- the reagent kit of this embodiment may further contain, for example, the dilution reagent or a calibrator.
- a further embodiment relates to use of the fluorescent dye, for manufacture of the reagent for blood cell analysis. Details of the fluorescent dye and the reagent for blood cell analysis are as described above.
- a further embodiment relates to use of the fluorescent dye and the hemolysis reagent, for manufacture of the reagent kit for blood cell analysis. Details of the fluorescent dye, the hemolysis reagent, and the reagent kit for blood cell analysis are as described above.
- the fluorescent dye represented by formula (I) above is mixed with the specimen and the dilution reagent, so that the concentration (final concentration) in the measurement sample falls within a predetermined range.
- a preferred final concentration of the fluorescent dye in the measurement sample is 1000 ppm or lower, which is more preferably 100 ppm or lower, and even more preferably 10 ppm or lower.
- a preferred final concentration of the fluorescent dye in the measurement sample is 0.001 ppm or higher, which is more preferably 0.01 ppm or higher, and even more preferably 0.1 ppm or higher.
- a ratio of mixing of the hemolysis reagent, the staining reagent, and the specimen may be appropriately determined, according to the concentration of the fluorescent dye in the staining reagent, or to the types of the specimen.
- the ratio of mixing of the hemolysis reagent, the staining reagent, and the specimen is, for example, preferably 1000 : (1 or above) : (1 or above) on the volume basis.
- the ratio is more preferably 1000 : (10 or above) : (10 or above), and even more preferably 1000 : (15 or above) : (15 or above).
- the ratio of mixing of the hemolysis reagent, the staining reagent, and the specimen is preferably, for example, 1000 : (50 or below) : (50 or below) on the volume basis.
- the ratio is more preferably 1000 : (30 or below) : (30 or below), and even more preferably 1000 : (25 or below) : (25 or below).
- the ratio of mixing of the staining reagent and the specimen may be
- Red blood cell is the most abundant blood cell in the blood specimen. Since the hemolysis reagent can lyse red blood cell, so that use thereof in analysis of blood cell which is not lysed with the hemolysis reagent (white blood cell, for example) can exclude influence of red blood cell. Use of the hemolysis reagent can also promote staining of white blood cell with the fluorescent dye, with the aid of the surfactant contained therein. As can be seen, preparation of the measurement sample under hemolytic conditions is suitable for the analysis of white blood cell.
- the fluorescent dye represented by formula (I) above is mixed with the specimen and the dilution reagent, so that the final concentration falls within a predetermined range.
- a preferred final concentration of the fluorescent dye in the measurement sample is 500 ppm or lower, which is more preferably 100 ppm or lower, and even more preferably 50 ppm or lower.
- a preferred final concentration of the fluorescent dye in the measurement sample is 0.01 ppm or higher, which is more preferably 0.1 ppm or higher, and even more preferably 1 ppm or higher.
- the ratio of mixing of the dilution reagent, the staining reagent, and the specimen may be appropriately determined, according to the concentration of the fluorescent dye in the staining reagent, or types of the specimen.
- the ratio of mixing of the hemolytic reagent, the staining reagent, and the specimen is preferably, for example, 1000 : (0.1 or above) : (1 or above) on the volume basis.
- the ratio is more preferably 1000 : (0.5 or above) : (5 or above), and even more preferably 1000 : (1 or above) : (10 or above).
- the ratio of mixing of the dilution reagent, the staining reagent, and the specimen is preferably, for example, 1000 : (50 or below) : (100 or below) on the volume basis.
- the ratio is more preferably 1000 : (30 or below) : (50 or below), and even more preferably 1000 : (20 or below) : (25 or below).
- reticulocyte is lysed with the hemolysis reagent similarly to mature red blood cell, so that preparation of the measurement sample under non-hemolytic conditions is suitable for the analysis of reticulocyte.
- the prior method although capable of classifying and counting reticulocyte and platelet by a one-time measurement, has occasionally suffered from poor accuracy of acquired platelet count, depending on specimens. An additional measurement has therefore been necessary to count platelet more accurately, under conditions suited to the platelet measurement.
- the method for analyzing blood cells of this embodiment can classify and count reticulocyte and platelet more accurately, with a one-time measurement of the measurement sample prepared under non-hemolytic conditions.
- preparation of the measurement sample under non-hemolytic conditions is suitable for the analysis of reticulocyte and platelet.
- the measurement sample does not contain the hemolysis reagent. That is, the measurement sample is prepared without going through a process for hemolyzing red blood cell.
- a further embodiment relates to a method for fluorescently staining blood cells, including contacting the fluorescent dye represented by formula (I) above, with the blood cells.
- This method can stain the blood cells, by mixing the fluorescent dye, with a specimen that contains the blood cells.
- the method may also use the aforementioned staining reagent, as the fluorescent dye.
- the hemolysis reagent or the dilution reagent may be further mixed. Concentrations and ratios of mixing of the fluorescent dye and the individual reagents in the mixing are the same as those described for the preparation of the measurement sample. Details of the fluorescent dye, the specimen, the hemolysis reagent, the dilution reagent, and the measurement sample are as described previously.
- White blood cell will also be denoted as "WBC”, mature red blood cell as “mRBC”, and reticulocyte as "RET”.
- the analysis process in the first embodiment classifies WBC in the measurement sample into subpopulations.
- the measurement sample prepared with use of the hemolysis reagent, contains a red blood cell ghost which is produced as a result of hemolysis of mRBC and RET.
- WBC is classified into subpopulations by identifying the individual subpopulations of WBC from the particles in the measurement sample, with reference to the fluorescence information and the first scattered light information, and/or, the fluorescence information and the second scattered light information.
- This example employs the first side-fluorescence intensity (also referred to as “SFL-1 intensity”) as the fluorescence information, the first side-scattered light intensity (also referred to as “SSC-1 intensity”) as the first scattered light information, and the second side-scattered light intensity (also referred to as “SSC-2 intensity”) as the second scattered light information.
- SFL-1 intensity the first side-fluorescence intensity
- SSC-1 intensity the first side-scattered light intensity
- SSC-2 intensity second side-scattered light intensity
- WBC may be classified into subpopulations, typically by analysis on scattergrams.
- a scattergram for classifying WBC into subpopulations with reference to the fluorescence information and the first scattered light information is also referred to as "first scattergram (a)”.
- a scattergram for classifying WBC into subpopulations with reference to the fluorescence information and the second scattered light information is also referred to as "first scattergram (b)".
- first scattergram (a) or (b) is created.
- both the first scattergrams (a) and (b) may be created.
- the analysis unit 300 in step S101 creates the first scattergram (a), with reference to the acquired optical information.
- the first scattergram (a) has the SSC-1 intensity and the SFL-1 intensity plotted on two coordinate axes.
- the analysis unit 300 may alternatively create the first scattergram (b), with reference to the acquired optical information.
- the first scattergram (b) has the SSC-2 intensity and the SFL-1 intensity plotted on two coordinate axes.
- the abscissa and the ordinate of the first scattergrams (a) and (b) may be expressed in either logarithmic or linear scale.
- the abscissa of the first scattergrams (a) and (b) is given in a logarithmic scale, meanwhile the ordinate in a linear scale.
- Step S101 determines positions of points corresponded to the individual particles in the measurement sample, on the thus created first scattergram (a).
- positions of points corresponded to the individual particles in the measurement sample are determined on the first scattergram (b).
- the analysis unit 300 identifies the individual subpopulations of white blood cell from the particles in the measurement sample, with reference to the thus determined SFL-1 intensity, and the SSC-1 intensity or the SSC-2 intensity of the individual points.
- At least the lymphocyte population, the monocyte population, and the granulocyte population are determined as the subpopulations.
- granulocyte includes neutrophil, eosinophil, and basophil. If possible, granulocyte is further classified to identify at least a neutrophil population, an eosinophil population, and a basophil population.
- the lymphocyte population, the monocyte population, the neutrophil population, and the eosinophil population are identified from the particles in the measurement sample.
- the lymphocyte population, the monocyte population, the neutrophil population, the eosinophil population, and the basophil population are identified from the particles in the measurement sample.
- a population of immature granulocytes, when contained in the measurement sample, may be identified, besides the individual subpopulations of white blood cell.
- An algorithm per se for identifying the individual subpopulations of white blood cell has been known. For example, white blood cell can be classified into the subpopulations, with use of a program product stored in the storage unit 303 of the analysis unit 300.
- the positions where the individual subpopulations of white blood cell appear on the scattergram are already known, so that the individual subpopulations of white blood cell may be identified with reference to the scattergram.
- FIG. 13 illustrates exemplary first scattergrams (a) and (b) on which white blood cell is classified into three types or five types of subpopulations.
- An area surrounded by the broken line in each scattergram indicates an area where immature granulocyte appears.
- “Lymp” stands for the lymphocyte population
- “Mono” for the monocyte population
- “Gran” for the granulocyte population
- “Neut” for the neutrophil population
- Eo for the eosinophil population
- Baso for the basophil population.
- IG stands for immature granulocytes.
- the immature granulocyte when contained in the measurement sample, appears in an area where the SFL-1 intensity is higher than that of the granulocyte population, and the SSC-1 intensity or the SSC-2 intensity is higher than that of the monocyte population, as indicated by the broken line.
- white blood cell can be classified typically into five subpopulations.
- (C) and (D) in Fig. 13 five populations of lymphocyte, monocyte, neutrophil, eosinophil, and basophil distribute as the subpopulations of white blood cell, on both of the first scattergrams (a) and (b). Immature granulocytes, when contained in the measurement sample, appears in an area where the fluorescence intensity is higher than that of the neutrophil population, and the SSC-1 intensity or the SSC-2 intensity is higher than that of the monocyte population, as indicated by the broken line.
- White blood cell exemplified in Fig. 13 is classified into, but not limited to, three or five subpopulations.
- White blood cell may alternatively be classified into four subpopulations of lymphocyte, monocyte, neutrophil, and eosinophil. Cells contained in the individual subpopulations may be optionally counted. The cells are counted with use of the analysis unit 300. After completion of the classification of white blood cell, the analysis unit 300 finishes the analysis process. The process then advances to step S14 in Fig. 7 .
- step S13 in Fig. 7 will be explained, while referring to Figs. 14 to 17 , without limiting the invention.
- Platelet herein is also referred to as "PLT”.
- PLT Platelet herein is also referred to as "PLT”.
- the measurement sample in this case is prepared without using the hemolysis reagent, and therefore contains mRBC and RET.
- the measurement sample also contains WBC and PLT.
- the RET population and the PLT population are classified from the particles in the measurement sample. This identifies RET and PLT.
- the RET population, the PLT population, and the mRBC population may be classified from the particles in the measurement sample. This identifies RET, PLT, and RBC.
- the fluorescence information is preferably the SFL-1 intensity.
- the third scattered light information is preferably the second forward-scattered light intensity (also referred to as "FSC-2 intensity").
- the particles in the measurement sample may be classified, typically by analysis on the scattergrams.
- a scattergram for classifying the RET population and the PLT population from the particles in the measurement sample, with reference to the fluorescence information and the third scattered light information is also referred to as "second scattergram".
- This example employs the SFL-1 intensity as the fluorescence information, and the FSC-2 intensity as the third scattered light information.
- the second scattergram is created typically with reference to the SFL-1 intensity and the FSC-2 intensity.
- the analysis unit 300 in step S202 creates the second scattergram.
- the analysis unit 300 creates a scattergram having the SFL-1 intensity and the FSC-2 intensity plotted on two coordinate axes, with reference to the acquired optical information.
- Positions of points corresponded to the individual particles in the measurement sample are then determined, on the thus created second scattergram.
- the abscissa and the ordinate of the second scattergram may be expressed in either logarithmic or linear scale.
- the second scattergram, with the abscissa and the ordinate expressed in logarithmic scales, is suitable for PLT analysis.
- the second scattergram, with the abscissa and the ordinate expressed in linear scales is suitable for RET and RBC analyses.
- the analysis unit 300 classifies the blood cells other than WBC, into the RET population, the PLT population, and the mRBC population, with reference to the SFL-1 intensity and the FSC-2 intensity.
- the RET population demonstrates higher SFL-1 intensity, than the mRBC population.
- the PLT population demonstrates lower FSC-2 intensity, than the RET population.
- the fluorescence intensity and the scattered light intensity of the particle populations on the scattergram may also be compared, typically with use of statistical representative values of the fluorescence intensity and scattered light intensity of the individual particle populations.
- the statistical representative values of the fluorescence intensity and the scattered light intensity of a certain particle population are values that can be acquired from the fluorescence intensity and the scattered light intensity of the particles that constitute the particle population.
- the statistical representative values are exemplified by median value, mean value, and mode value. The median value is preferred.
- Fig. 15A illustrates examples of the second scattergram (in logarithmic scale) and the second scattergram (in linear scale).
- the RET population the PLT population
- the mRBC population appeared on the individual second scattergrams.
- the RET and mRBC populations appear in areas where the FSC-2 intensity is high, meanwhile the PLT population appears in an area where the FSC-2 intensity is low.
- the PLT population appears in an area where the FSC-2 intensity is low, meanwhile the RET population appears in an area where the FSC-2 intensity is higher than that of the PLT population.
- the RET population appears in the areas where the SFL-1 intensity is higher than that of the mRBC population. Paragraphs below will explain how the particles in the measurement sample are classified into the RET population, the mRBC population, and the PLT population, on the second scattergrams.
- the PLT has the smallest size among the blood cells, and thus produces the forward-scattered light whose intensity is lower than that of RET.
- the PLT population therefore appears on the second scattergram, in the area where the FSC-2 intensity is lower than that of the RET population.
- RET and PLT are thus discriminable, with reference to the FSC-2 intensity.
- RET contains a small amount of ribonucleic acid, meanwhile mRBC contains neither nucleus nor nucleic acid.
- the RET population therefore appears in the area where the fluorescence intensity is higher than that of the mRBC population.
- mRBC and RET are thus discriminable, with reference to the SFL-1 intensity.
- the particles in the measurement sample are classified into the RET population, the PLT population, and the mRBC population, on the second scattergrams.
- the analysis unit 300 in step S203 identifies the RET population, the PLT population, and the mRBC population from the particles in the measurement sample.
- RET matures to mRBC, and this makes it difficult to exactly define the boundary between the RET population and the mRBC population. It is therefore conceived, for example, to set a threshold value of the SFL-1 intensity at which the mRBC population and the RET population are dividable, typically with reference to a range of the SFL-1 intensity that can be usually demonstrated by mRBC, or an average level of the mRBC count.
- Such threshold value may be defined as a boundary between the mRBC population and the RET population on the second scattergram.
- the areas where mRBC and RET individually appear may be set with reference to the threshold value and the FSC-2 intensity, typically as indicated by broken lines in Fig. 15B .
- Particles in the thus set area where mRBC appears can be identified as mRBC.
- particles in the thus set area where RET appears can be identified as RET.
- the population that appears in an area where the FSC-2 intensity is low may be identified by the user as the PLT population on the second scattergram (in logarithmic scale), if the population that appears in an area where the FSC-2 intensity is high, and the population that appears in an area where the FSC-2 intensity is lower are clearly separated.
- the areas where the RET, PLT, and mRBC populations will appear are preliminarily determined on the second scattergram, by accumulating measurement data from a plurality of specimens, and the particles that appears in the individual areas may be identified as RET, PLT and mRBC.
- the thus identified RET, PLT, and RBC may be optionally counted.
- the cells are counted with use of the analysis unit 300.
- step S204 the analysis unit 300 classifies the RET population, into particle that appears in the LFR area, particle that appears in the MFR area, and particle that appears in the HFR area, with reference to the SFL-1 intensity.
- the SFL-1 intensity of the cell measured by FCM reflects the nucleic acid level in the cell. The degree of maturation of RET may therefore be analyzed with reference to the SFL-1 intensity.
- the area where RET appears on the second scattergram can be divided into three areas of LFR, MFR, and HFR with reference to the SFL-1 intensity. RET that appears in the individual areas may be counted. RET that appears in the HFR area is most nucleic acid-rich, and therefore represents most immature RET.
- RET that appears in the individual areas of LFR, MFR, and HFR may be analyzed to acquire a mean value of the fluorescence intensity (SFL-1 intensity) and a mean value of the forward-scattered light intensity (FSC-2 intensity).
- the particle in an area where mRBC appears (that is, mRBC) may be analyzed to acquire mean values of the SFL-1 intensity and the FSC-2 intensity.
- Therapeutic effect on red blood cell diseases for example, pernicious anemia, iron deficiency anemia, etc.
- the mean values of the SFL-1 intensity and the FSC-2 intensity in the individual areas of LFR, MFR, and HFR are plotted on a graph having the SFL-1 intensity and the FSC-2 intensity plotted on two coordinate axes, and an approximate straight line is acquired by the least squares method. A slope value of the approximate straight line is then acquired. The slope value is periodically acquired from the day the treatment starts, so as to monitor any change in the value, whereby the effect of the treatment can be determined.
- step S205 the process advances to step S205.
- the PLT population is further analyzed.
- the analysis unit 300 identifies immature platelet and large platelet from the PLT population on the second scattergram (in logarithmic scale), with reference to the SFL-1 intensity and the FSC-2 intensity.
- the mature platelet does not contain nucleic acid, meanwhile the immature platelet contains a small amount of ribonucleic acid.
- PLT that demonstrates high SFL-1 intensity may be identified as immature platelet, from among the PLT population on the second scattergram. For example, as illustrated in (A) in Fig.
- PLT other than immature platelet may be identified as mature platelet.
- the identified immature platelet may be counted.
- Immature platelet fraction (IPF) may be estimated, if the platelet count has already been acquired by counting the PLT population.
- IPF represents a ratio of platelet count in an area with high fluorescence intensity (the area surrounded by a solid-lined square), to the platelet count. IPF has been known as an index of platelet productivity.
- the large platelet has larger size than that of normal PLT, so that PLT that demonstrates high FSC-2 intensity, from among the PLT population on the second scattergram, may be identified as the large platelet.
- PLT that appears in an area where FSC-2 is high (the area surrounded by the broken line) may be identified as large platelet.
- PLT other than the large platelet may be identified as normal-sized PLT.
- the identified large platelet may be counted. Percentage of large platelet (P-LCR) may be estimated, if the platelet count has already been acquired by counting the PLT population.
- P-LCR represents a ratio of platelet count in an area with high forward-scattered light intensity (the area surrounded by a broken-lined square), to the platelet count. P-LCR has been known as an index of platelet productivity and congenital diseases.
- step S201 upon acceptance, in step S201 by the controller 301 of the analysis unit 300, of a designation of WBC as the target to be measured, the process then advances to step S101 in Fig. 12 .
- the analysis process classification of WBC
- the analysis unit 300 finishes the analysis process.
- the process then advances to step S14 in Fig. 7 .
- the controller 301 in step S14 outputs analysis result on the display 305.
- the process thus finishes.
- the paragraphs above have described the process for analyzing WBC in the measurement sample, while referring to Figs. 12 and 13 .
- the paragraphs above have also described the process for analyzing reticulocyte and platelet in the measurement sample, while referring to Figs. 14 to 17 .
- the analysis process may, however, only be implemented in a part thereof, or may be implemented entirely.
- An analysis result screen that is output on the display 305 may contain, for example, the number of subpopulations of white blood cell; reticulocyte count; platelet count; particle counts in the individual areas of LFR, MFR, and HFR; IPF; and P-LCR. Besides these information, the screen may contain a scattergram created with reference to the optical information. The screen may further contain a flag based on the analysis result.
- the method for analyzing blood cells of this embodiment can provide a medical worker such as doctor or medical technician, with analysis result of white blood cell, such as information on the number of subpopulations of white blood cell contained in the specimen.
- the method can also provide analysis result of reticulocyte and platelet, such as information on the counts of reticulocyte and platelet contained in the specimen.
- the method can yet also provide analysis result of red blood cell.
- the medical worker can make decision from the acquired analysis results, on whether the specimen should further be inspected or not. All of the aforementioned preparation of the measurement sample and analysis of the specimen take place in vitro.
- the white blood cell in the blood specimen was classified into the subpopulations by the method for analyzing blood cells of this embodiment, with use of various fluorescent dyes which can be excited by the light of the first wavelength (315 nm or longer and 600 nm or shorter). Also results of the classification of white blood cell were compared with those from the prior method.
- Whole blood peripheral blood was collected from a plurality of subjects, with use of an EDTA-2K blood collection tube, and stored at room temperature (25 ⁇ 2°C). The whole blood was fractionated from the blood collection tube, to be used as each blood specimen. From among the blood specimens, those determined to contain 2% or more of immature granulocyte and 2% or more of reticulocytes, by analysis with an automated hematology analyzer XR-20 (Sysmex Corporation), were used in Example 1.
- Lysercell (registered trademark) WDF II (Sysmex Corporation) was used as the hemolysis reagent.
- Each staining reagent was prepared by dissolving each of various fluorescent dyes in a special-grade ethylene glycol (1 L). The fluorescent dyes used herein were
- the prototype was fabricated as follows.
- the original XF-1600 has been equipped with three semiconductor laser light sources that emit blue-violet (405 nm) light, blue light (488 nm) and red (639 nm) light, detectors for scattered light of the individual colors, and detectors for fluorescence excited by lights of the individual colors.
- the XF-1600 was then modified, by detaching the semiconductor laser light source that emits blue (488 nm) light, to an FCM system having two semiconductor laser light sources.
- the prototype has the hardware design illustrated in Figs. 1 to 3 , and an FCM detector has a structure illustrated in Fig. 4 .
- XR-20 For the measurement of Comparative Example 1, an automated hematology analyzer XR-20 (Sysmex Corporation) was used. XR-20 has been equipped with a semiconductor laser light source that emits red (639 nm) light, a detector for red forward-scattered light, a detector for red side-scattered light, and a detector for fluorescence (660 nm or longer) excited by the red light.
- the preparation and measurement of the measurement sample were implemented according to a manual attached to XF-1600, except that the aforementioned staining reagents were used.
- the measurement sample was prepared by mixing 1000 ⁇ L of Lysercell (registered trademark) WDF II, 17 ⁇ L of whole blood, and 0.5 to 2 ⁇ L of each staining reagent. The final concentration of each fluorescent dye in the measurement sample was 0.1 to 0.5 ppm.
- the measurement sample was measured after incubation at 41°C for 25 seconds. Data was analyzed with the aid of software installed on the analyzer.
- Comparative Example 1 XR-20 (Sysmex Corporation) was used for the measurement, and XR-WDF channel was used for the analysis.
- the individual measurement samples were measured with the analyzer, to acquire the fluorescence information, the first scattered light information, and the second scattered light information.
- the fluorescence information corresponded to the fluorescence intensity, obtained by irradiating the particles in the measurement sample with a blue-violet laser (also referred to as “fluorescence intensity (blue-violet)" or "V-SFL", hereinafter).
- a blue-violet laser also referred to as "fluorescence intensity (blue-violet)" or "V-SFL”, hereinafter
- red laser also referred to as “fluorescence intensity (red)" or "R-SFL”, hereinafter
- the first scattered light information corresponded to the side-scattered light intensity, obtained by irradiating the particles in the measurement sample with a blue-violet laser (also referred to as “side-scattered light intensity (blue-violet)" or “V-SSC", hereinafter).
- the second scattered light information was the side-scattered light intensity obtained by irradiating the particles in the measurement sample with a red laser (also referred to as “side-scattered light intensity (red)” or "R-SSC”, hereinafter).
- Scattergrams were created for the individual measurement samples, with the side-scattered light intensity (blue-violet) plotted on the abscissa, and with the fluorescence intensity (blue-violet) plotted on the ordinate (also referred to as “first scattergram (a)", hereinafter). Also scattergrams were created for the individual measurement samples, with the side-scattered light intensity (red) plotted on the abscissa, and with the fluorescence intensity (blue-violet) plotted on the ordinate (also referred to as "first scattergram (b)", hereinafter).
- Comparative Example 1 a scattergram was created with the side-scattered light intensity (red) plotted on the abscissa, and with the fluorescence intensity (red) plotted on the ordinate.
- the individual scattergrams are illustrated in Figs. 18 and 19 .
- the analysis result of Comparative Example 1 corresponds to the classification result of white blood cell by a prior method.
- Fig. 18 “Lymp” stands for lymphocyte, "Mono” for monocyte, “Neut” for neutrophil, “Eo” for eosinophil, "Baso” for basophil, and "IG” for immature granulocyte.
- the scattergram of Comparative Example 1 demonstrated that white blood cell was classified into five subpopulations of lymphocyte, monocyte, neutrophil, eosinophil, and basophil. Also a population of immature granulocyte was observed in an area where the fluorescence intensity is higher than that of the neutrophil population.
- white blood cell was classified into five subpopulations on the first scattergrams (a) and (b), when analyzed with use of any of the aforementioned fluorescent dyes.
- the immature granulocyte population was observed in an area where the fluorescence intensity is higher than that of the neutrophil population, and the side-scattered light intensity is higher than that in the monocyte population.
- the method for analyzing blood cells of this embodiment was proved to classify white blood cell, similarly to the prior method. The method was also proved to count white blood cell and the individual subpopulations, by counting the particles contained in each of the thus classified population.
- Reticulocyte and platelet in the blood specimen were classified by the method for analyzing blood cells of this embodiment, with use of various fluorescent dyes which can be excited by the light of the first wavelength. Also results of the classification of reticulocyte and platelet were compared with those from the prior method.
- Example 2 the same blood specimen as in Example 1 was used.
- the staining reagent was prepared in the same manner as in Example 1.
- the fluorescent dyes used herein were the same as in Example 1.
- Fluorocell (registered trademark) RET (Sysmex Corporation) and Fluorocell (registered trademark) PLT (Sysmex Corporation) were used for comparison.
- Fluorocell RET and Fluorocell PLT are staining reagents each containing a fluorescent dye excited by the light of the second wavelength (610 nm or longer and 750 nm or shorter).
- the measurement sample prepared with use of Fluorocell RET and CELLPACK DFL is also referred to as "Comparative Example 2", hereinafter.
- the measurement sample prepared with use of Fluorocell PLT and CELLPACK DFL is also referred to as "Comparative Example 3", hereinafter.
- the preparation and measurement of the measurement sample were implemented according to a manual attached to XF-1600, except that CELLPACK DFL and the aforementioned staining reagents were used.
- the measurement sample was prepared by mixing 1000 ⁇ L of CELLPACK DFL, 17 ⁇ L of whole blood, and 20 ⁇ L of the staining reagent. The final concentration of each fluorescent dye in the measurement sample was 51.25 ppm. The measurement sample was measured after incubation at 41°C for 30 seconds.
- the individual measurement samples were measured with the analyzer, to acquire the fluorescence information, and the third scattered light information.
- the fluorescence information corresponds to the fluorescence intensity (blue-violet).
- the fluorescence intensity (red) was obtained, for Comparative Examples 2 and 3.
- the third scattered light information corresponds to the forward-scattered light intensity, obtained by irradiating the particles in the measurement sample with a red laser (also referred to as "forward-scattered light intensity (red)" or "R-FSC", hereinafter).
- the scattergrams were created for the individual measurement samples, with the fluorescence intensity (blue-violet) plotted on the abscissa, and the forward-scattered light intensity (red) plotted on the ordinate (also referred to as "second scattergram", hereinafter).
- the second scattergrams were created in two ways, in linear scale and in logarithmic scale.
- the individual scattergrams are illustrated in Figs. 20 and 21 .
- Analysis result of Comparative Example 2 corresponds to the classification result of reticulocyte by the prior method, meanwhile analysis result of Comparative Example 3 corresponds to the classification result of platelet by the prior method.
- the scattergram of Comparative Example 2 demonstrated the mature red blood cell population appeared in an area where R-SFL is low and R-FSC is high.
- the reticulocyte population appeared in an area where R-SFL is higher than that of the mature red blood cell population.
- the platelet population appeared in an area where R-FSC is low.
- mature red blood cell, reticulocyte, and platelet were clearly classified on the scattergram of Comparative Example 2.
- Figs. 20 and 21 mature red blood cell, reticulocyte, and platelet were clearly classified on the second scattergrams in a linear scale, when analyzed with use of any of the aforementioned fluorescent dyes.
- the method for analyzing blood cells of this embodiment was proved to classify mature red blood cell and reticulocyte, similarly to the prior method.
- the scattergram of Comparative Example 3 demonstrated the platelet population appeared in an area where R-FSC and R-SFL are low. As can be seen, platelet was clearly classified from the particles in the measurement sample, on the scattergram of Comparative Example 3.
- the populations of mature red blood cell and reticulocyte appeared in areas where R-FSC is high on the second scattergrams in a logarithmic scale, when analyzed with use of any of the aforementioned fluorescent dyes.
- the platelet population appeared in an area where R-FSC is lower than that of the populations of mature red blood cell and reticulocyte.
- the populations of mature red blood cell and the reticulocyte were clearly distinguishable from the platelet population.
- the method for analyzing blood cells of this embodiment was proved to classify platelet, similarly to the prior method.
Landscapes
- Health & Medical Sciences (AREA)
- Chemical & Material Sciences (AREA)
- Life Sciences & Earth Sciences (AREA)
- Immunology (AREA)
- Physics & Mathematics (AREA)
- Pathology (AREA)
- General Physics & Mathematics (AREA)
- General Health & Medical Sciences (AREA)
- Biochemistry (AREA)
- Analytical Chemistry (AREA)
- Engineering & Computer Science (AREA)
- Dispersion Chemistry (AREA)
- Biomedical Technology (AREA)
- Urology & Nephrology (AREA)
- Molecular Biology (AREA)
- Hematology (AREA)
- Cell Biology (AREA)
- Food Science & Technology (AREA)
- Medicinal Chemistry (AREA)
- Microbiology (AREA)
- Biotechnology (AREA)
- Ecology (AREA)
- Tropical Medicine & Parasitology (AREA)
- Nuclear Medicine, Radiotherapy & Molecular Imaging (AREA)
- Chemical Kinetics & Catalysis (AREA)
- Optics & Photonics (AREA)
- Signal Processing (AREA)
- Organic Chemistry (AREA)
- Investigating Or Analysing Biological Materials (AREA)
- Investigating, Analyzing Materials By Fluorescence Or Luminescence (AREA)
Abstract
Disclosed is a method for analyzing blood cells, the method includes:irradiating a measurement sample that contains particles stained with a fluorescent dye with at least one light, to acquire fluorescence information and scattered light information generated from the particle; andclassifying blood cells from the particles in the measurement sample, with reference to the fluorescence information and the scattered light information,the fluorescent dye being represented by formula (I) below:(where, each of R<sub>1</sub> and R<sub>2</sub>, identically or differently, is a halogen, an alkyl group having 1 to 18 carbon atoms, an alkenyl group having 3 to 20 carbon atoms, an alkyl group having 1 to 18 carbon atoms and a hydroxy group, an alkyl group having 1 to 18 carbon atoms and a carboxy group, an alkyl group having 1 to 18 carbon atoms and a sulfo group, -(CH<sub>2</sub>)<sub>m</sub>-NR<sub>6</sub>R<sub>7</sub>, -(CH<sub>2</sub>)<sub>n</sub>-O-R<sub>8</sub>, or a benzyl group optionally having a substituent;each of R<sub>3</sub> and R<sub>4</sub>, identically or differently, is a hydrogen atom, a halogen, an alkyl group having 1 to 18 carbon atoms, a phenyl group optionally having a substituent, an alkoxy group having 1 to 6 carbon atoms, or -(CH<sub>2</sub>)<sub>m</sub>-O-R<sub>8</sub>;R<sub>5</sub> is a hydrogen atom, a halogen, an alkyl group having 1 to 6 carbon atoms, an alkyl group having 1 to 6 carbon atoms and a hydroxy group, an alkyl group having 1 to 6 carbon atoms and a carboxy group, an alkyl group having 1 to 6 carbon atoms and a sulfo group, a phenyl group optionally having a substituent, a benzyl group optionally having a substituent, or -(CH<sub>2</sub>)<sub>n</sub>-O-R<sub>6</sub>;each of R<sub>6</sub> and R<sub>7</sub>, identically or differently, is a hydrogen atom or an alkyl group having 1 to 18 carbon atoms;R<sub>8</sub> is a hydrogen atom, an alkyl group having 1 to 18 carbon atoms, or a phenyl group optionally having a substituent;m is an integer of 1 to 18, and n is an integer of 1 to 6;each of X and Y, identically or differently, is a sulfur atom, an oxygen atom, a selenium atom, or CR<sub>9</sub>R<sub>10</sub>;each of R<sub>9</sub> and R<sub>10</sub>, identically or differently, is an alkyl group having 1 to 3 carbon atoms; andZ<sup>-</sup> is a counter ion).
Description
- The present invention relates to a method for analyzing blood cells. The present invention also relates to a reagent for blood cell analysis. The present invention also relates to a reagent kit for blood cell analysis. The present invention also relates to a method for fluorescently staining blood cells.
- Blood includes various blood cell components such as red blood cell, white blood cell, and platelet. Analysis of these blood cells can provide information valuable for clinical diagnosis of various diseases. A method with use of an automated hematology analyzer has been known for use in blood cell analysis. The analysis with use of the automated hematology analyzer usually measures a sample, which is prepared with use of a dedicated reagent suited to types of the blood cells. A reagent commonly applicable to a plurality of types of blood cells has, however, been desired from the viewpoints of labor-saving of inspection and simplicity of the apparatus. For example,
WO2022/100717 describes that white blood cell was classified and counted with use of one kind of fluorescent dye and a hemolysis reagent, and that reticulocyte and platelet are classified and counted with use of the same fluorescent dye and a dilution reagent. - A recent known method of analysis is such as irradiating blood cells with a plurality of lights of different wavelengths, with use of a hematology analyzer equipped with a plurality of light sources. There is, therefore, a need for a method for analyzing blood cells, with use of a reagent which is applicable to blood cell analysis under such plurality of lights. It is therefore an object of the present invention to provide a means for blood cell analysis, with use of a reagent which is commonly applicable to classification of white blood cell and classification of reticulocyte and platelet, as well as applicable to blood cell analysis under a plurality of lights.
- The present inventor found that a cyanine-based fluorescent dye that can be excited by light, whose wavelength is 315 nm or longer and 600 nm or shorter, and can bind to a nucleic acid, is commonly applicable to classification of white blood cell, classification of reticulocyte and platelet, as well as blood cell analysis under a plurality of lights, thereby completing the invention described in [1] to [19] below.
- [1] A method for analyzing blood cells, the method including:
- irradiating a measurement sample that contains particles stained with a fluorescent dye with at least one light, to acquire fluorescence information and scattered light information generated from the particle; and
- classifying blood cells from the particles in the measurement sample, with reference to the fluorescence information and the scattered light information,
- the fluorescent dye being represented by formula (I) below:

- (where, each of R1 and R2, identically or differently, is a halogen, an alkyl group having 1 to 18 carbon atoms, an alkenyl group having 3 to 20 carbon atoms, an alkyl group having 1 to 18 carbon atoms and a hydroxy group, an alkyl group having 1 to 18 carbon atoms and a carboxy group, an alkyl group having 1 to 18 carbon atoms and a sulfo group, -(CH2)m-NR6R7, -(CH2)n-O-R8, or a benzyl group optionally having a substituent;
- each of R3 and R4, identically or differently, is a hydrogen atom, a halogen, an alkyl group having 1 to 18 carbon atoms, a phenyl group optionally having a substituent, an alkoxy group having 1 to 6 carbon atoms, or -(CH2)m-O-R8;
- R5 is a hydrogen atom, a halogen, an alkyl group having 1 to 6 carbon atoms, an alkyl group having 1 to 6 carbon atoms and a hydroxy group, an alkyl group having 1 to 6 carbon atoms and a carboxy group, an alkyl group having 1 to 6 carbon atoms and a sulfo group, a phenyl group optionally having a substituent, a benzyl group optionally having a substituent, or -(CH2)n-O-R6;
- each of R6 and R7, identically or differently, is a hydrogen atom or an alkyl group having 1 to 18 carbon atoms;
- R8 is a hydrogen atom, an alkyl group having 1 to 18 carbon atoms, or a phenyl group optionally having a substituent;
- m is an integer of 1 to 18, and n is an integer of 1 to 6;
- each of X and Y, identically or differently, is a sulfur atom, an oxygen atom, a selenium atom, or CR9R10;
- each of R9 and R10, identically or differently, is an alkyl group having 1 to 3 carbon atoms; and
- Z- is a counter ion).
- [2] The method according to [1], in which in formula (I), with either X or Y given by an oxygen atom, the other is a sulfur atom, a selenium atom, or C(CH3)2.
- [3] The method according to [1] or [2], in which the fluorescent dye is at least one selected from the group consisting of 3-ethyl-2-[(3-ethyl-2-benzothiazolinylidene)methyl] benzothiazolium, 3-ethyl-2-[(3-ethyl-6-methyl-2-benzothiazolinylidene)methyl]-6-methyl-benzothiazolium, 3-ethyl-2-[(3-ethyl-2-benzothiazolinylidene)methyl]benzoxazolium, 3-ethyl-6-methyl-2-[(3-ethyl-6-methyl-2-benzothiazolinylidene)methyl]benzothiazolium, 3-methyl-2-[(1,3,3-trimethyl-2-indolinylidene)methyl]benzothiazolium, and 1,3,3-trimethyl-2-[(3-methyl-2-benzoxazolinylidene)methyl]-3H-indolium.
- [4] The method according to any one of [1] to [3], in which the measurement sample is prepared by mixing the fluorescent dye, a hemolysis reagent, and whole blood, and
in the step of classifying, white blood cell in the measurement sample is classified into subpopulations. - [5] The method according to [4], in which the at least one light is a light of a first wavelength from 315 nm or longer and 600 nm or shorter,
- the fluorescence information is information related to fluorescence generated from the fluorescent dye on the particles upon irradiation of the measurement sample with the light of the first wavelength, and
- the scattered light information is information related to side-scattered light generated from the particles upon irradiation of the measurement sample with the light of the first wavelength.
- [6] The method according to [4], in which the at least one light is a light of a first wavelength from 315 nm or longer and 600 nm or shorter, and a light of a second wavelength from 610 nm or longer and 750 nm or shorter,
- the fluorescence information is information related to fluorescence generated from the fluorescent dye on the particles upon irradiation of the measurement sample with the light of the first wavelength, and
- the scattered light information is information related to side-scattered light generated from the particles upon irradiation of the measurement sample with the light of the first wavelength,
- and information related to side-scattered light generated from the particles upon irradiation of the measurement sample with the light of the second wavelength.
- [7] The method according to [5] or [6], in which the fluorescence information is fluorescence intensity, and the scattered light information is side-scattered light intensity, and
in the step of classifying, white blood cell in the measurement sample is classified into subpopulations, with reference to the fluorescence intensity and the side-scattered light intensity. - [8] The method according to [7], wherein a scattergram is created with reference to the fluorescence intensity and the side-scattered light intensity, and the white blood cell is classified into subpopulations.
- [9] The method according to [8], in which the subpopulations include lymphocyte population, monocyte population, and granulocyte population.
- [10] The method according to [8], in which the subpopulations include lymphocyte population, monocyte population, neutrophil population, eosinophil population, and basophil population.
- [11] The method according to any one of [1] to [3], in which the measurement sample is prepared by mixing the fluorescent dye, a dilution reagent, and whole blood, and
in the step of classifying, reticulocyte and platelet are classified from the particles in the measurement sample. - [12] The method according to [11], in which the measurement sample is free of a hemolysis reagent.
- [13] The method according to [11] or [12], in which the at least one light is a light of a first wavelength from 315 nm or longer and 600 nm or shorter, and a light of a second wavelength from 610 nm or longer and 750 nm or shorter,
- the fluorescence information is information related to fluorescence generated from the fluorescent dye on the particles upon irradiation of the measurement sample with the light of the first wavelength, and
- the scattered light information is information related to forward-scattered light generated from the particles upon irradiation of the measurement sample with the light of the second wavelength.
- [14] The method according to [13], in which the fluorescence information is fluorescence intensity, and the scattered light information is forward-scattered light intensity, and
in the step of classifying, the particles in the measurement sample are classified into reticulocyte, platelet, and mature red blood cell, with reference to the fluorescence intensity and the forward-scattered light intensity. - [15] The method according to [14], wherein a scattergram is created with reference to the fluorescence intensity and the forward-scattered light intensity, and the particles in the measurement sample are classified into reticulocyte population, platelet population, and mature red blood cell population, on the scattergram.
- [16] The method according to any one of [1] to [15], in which the first wavelength is 315 nm or longer and 490 nm or shorter.
- [17] A reagent for blood cell analysis, including the fluorescent dye represented by formula (I) above, and for use in the method according to any one of [1] to [16].
- [18] A reagent kit for blood cell analysis, including a staining reagent that contains the fluorescent dye represented by formula (I) above, and a hemolysis reagent, for use in the method according to any one of [1] to [16].
- [19] A method for fluorescently staining blood cells, the method including contacting a fluorescent dye with the blood cells, the fluorescent dye being represented by formula (I) below:

- (where, each of R1 and R2, identically or differently, is a halogen, an alkyl group having 1 to 18 carbon atoms, an alkenyl group having 3 to 20 carbon atoms, an alkyl group having 1 to 18 carbon atoms and a hydroxy group, an alkyl group having 1 to 18 carbon atoms and a carboxy group, an alkyl group having 1 to 18 carbon atoms and a sulfo group, -(CH2)m-NR6R7, -(CH2)n-O-R8, or a benzyl group optionally having a substituent;
- each of R3 and R4, identically or differently, is a hydrogen atom, a halogen, an alkyl group having 1 to 18 carbon atoms, a phenyl group optionally having a substituent, an alkoxy group having 1 to 6 carbon atoms, or -(CH2)m-O-R8;
- R5 is a hydrogen atom, a halogen, an alkyl group having 1 to 6 carbon atoms, an alkyl group having 1 to 6 carbon atoms and a hydroxy group, an alkyl group having 1 to 6 carbon atoms and a carboxy group, an alkyl group having 1 to 6 carbon atoms and a sulfo group, a phenyl group optionally having a substituent, a benzyl group optionally having a substituent, or -(CH2)n-O-R6;
- each of R6 and R7, identically or differently, is a hydrogen atom, or an alkyl group having 1 to 18 carbon atoms;
- R8 is a hydrogen atom, an alkyl group having 1 to 18 carbon atoms, or a phenyl group optionally having a substituent;
- m is an integer of 1 to 18, and n is an integer of 1 to 6;
- each of X and Y, identically or differently, is a sulfur atom, an oxygen atom, a selenium atom, or CR9R10;
- each of R9 and R10, identically or differently, is an alkyl group having 1 to 3 carbon atoms; and
- Z- is a counter ion).
- The present invention can provide a method for analyzing blood cells with use of a fluorescent dye that can be used in common for the classification of white blood cell, classification of platelet and reticulocyte, as well as applicable to blood cell analysis under a plurality of lights. The present invention can also provide a reagent for blood cell analysis and a reagent kit for blood cell analysis, which are applicable to this method. The present invention can also provide a method for fluorescently staining blood cells with use of the aforementioned fluorescent dye.
-
-
Fig. 1 is a perspective view illustrating an analysis system suitable for the method for analyzing blood cells of this embodiment. -
Fig. 2 is a drawing illustrating a fluid circuit in a measurement unit, which involves a specimen suction unit, a sample preparation unit, and a flow cytometer (FCM) detector. -
Fig. 3 is a block diagram illustrating a structure of the measurement unit. -
Fig. 4 is a schematic drawing illustrating an exemplary structure of an optical system of the FCM detector. -
Fig. 5 is a schematic drawing illustrating various kinds of light emitted from a particle that passes through a flow cell under irradiation with light, received by the optical system of the FCM detector. -
Fig. 6 is a block diagram illustrating a structure of an analysis unit. -
Fig. 7 is a flowchart illustrating a flow of operations of the analysis system. -
Fig. 8 is a flowchart illustrating procedures of a measurement process in a first embodiment. -
Fig. 9 is a flowchart illustrating procedures of a measurement process in a second embodiment, where, "WBC" stands for white blood cell. -
Fig. 10 is an absorption spectral chart of fluorescent dyes in ethanol. -
Fig. 11A is a perspective view illustrating an exemplary reagent for blood cell analysis of this embodiment. -
Fig. 11B is a perspective view illustrating an exemplary reagent kit for blood cell analysis of this embodiment. -
Fig. 12 is a flowchart illustrating procedures of an analysis process in the first embodiment. -
Fig. 13 contains schematic drawings, where (A) and (C) are first scattergrams (a), with a first side-scattered light (SSC-1) intensity plotted on the abscissa, and with a first fluorescence (SFL-1) intensity plotted on the ordinate, exemplifying positions where the individual subpopulations of white blood cell appear; and (B) and (D) are first scattergrams (b), with the second side-scattered light (SSC-2) intensity plotted on the abscissa, and with the SFL-1 intensity plotted on the ordinate, exemplifying positions where the individual subpopulations of white blood cell appear. The granulocyte is a generic term for neutrophil, eosinophil, and basophil. -
Fig. 14 is a flowchart illustrating procedures of an analysis process in the second embodiment. -
Fig. 15A contains schematic drawings, where (A) is a second scattergram (in logarithmic scale), with a logarithm of the first fluorescence intensity (SFL-1(log)) plotted on the abscissa, and with a logarithm of the second forward-scattered light intensity (FSC-2(log)) plotted on the ordinate, exemplifying positions where a RET population, an mRBC population, and a PLT population appear. (B) is a second scattergram (in linear scale), with the SFL-1 intensity plotted on the abscissa, and with the FSC-2 intensity plotted on the ordinate, exemplifying positions where the RET population, the mRBC population, and the PLT population appear. -
Fig. 15B contains schematic drawings, where (A) is the second scattergram (in logarithmic scale), exemplifying areas where mRBC and RET individually appear; and (B) is the second scattergram (in linear scale), exemplifying areas where mRBC and RET individually appear. -
Fig. 16 is a schematic drawing of the second scattergram (in linear scale), exemplifying an area where mRBC appears, a low fluorescence rate (LFR) area, a middle fluorescence rate (MFR) area, and a high fluorescence rate (HFR) area. -
Fig. 17 contains schematic drawings, where (A) is the second scattergram (in logarithmic scale), exemplifying an area where immature platelet appears; and (B) is the second scattergram (in logarithmic scale), exemplifying an area where large platelet appears. -
Fig. 18 contains a scattergram of Comparative Example 1, and the first scattergrams (a) and (b) of Example 1. -
Fig. 19 contains the first scattergrams (a) and (b) of Example 1. -
Fig. 20 contains scattergrams of Comparative Examples 2 and 3, and the second scattergrams of Example 2. -
Fig. 21 contains the second scattergrams of Example 2. - First, an analysis system suitable for a method for analyzing blood cells of this embodiment will be described, while referring to
Fig. 1 . Ananalysis system 500 has ameasurement unit 400 as a measurement apparatus, and ananalysis unit 300 as an analyzer. Theanalysis unit 300 is typically a personal computer having installed thereon software for analyzing specimen to be measured. Theanalysis unit 300 also takes part in operational control of themeasurement unit 400. Theanalysis system 500 may alternatively be structured, with theanalysis unit 300 incorporated in themeasurement unit 400. - The
measurement unit 400 is a unit for measuring the specimen, and contains a flow cytometer. In themeasurement unit 400, the specimen and a reagent are mixed to prepare a measurement sample. For classification of white blood cell in the specimen, the measurement sample is prepared with use of reagents, which are a staining reagent and a hemolysis reagent. For classification of reticulocyte and platelet in the specimen, the measurement sample is prepared with use of reagents, which are a staining reagent and a dilution reagent. The staining reagent contains a fluorescent dye for staining particle. The hemolysis reagent contains a surfactant and a solvent. The dilution reagent contains a buffering agent and a solvent. The specimen, the staining reagent, the hemolysis reagent, and the dilution reagent will be detailed later. In analysis of the particles in the specimen with this analysis system, particles stained with the fluorescent dye in the measurement sample are analyzed. The "particles in the measurement sample" refers to elements contained in the measurement sample, which can be individually measured by anFCM detector 460 described later. The particles in the measurement sample are exemplified by cell contained in the specimen, red blood cell ghosts, platelet aggregation, lipid particle, fungi, and bacteria. The term "cell" encompasses various types of blood cell and platelet. The red blood cell ghost may be produced also due to hemolysis caused by other than the hemolysis reagent, that is, caused by physical impact on blood collection tube; or low pH or low osmotic pressure of the measurement sample. - The measurement sample is measured with an FCM detector 460 (see
Fig. 2 ), described later, in themeasurement unit 400. From the measurement, acquired are an optical signal related to fluorescence emitted from the fluorescent dye on the stained particles in the measurement sample, and an optical signal related to scattered light emitted from the particle. The "fluorescent dye on the particle" refers to a fluorescent dye, which is bound to the particle by staining. Mode of binding between the particle and the fluorescent dye is not particularly limited, as long as the particle and the fluorescent dye are integrally measurable by the flow cytometer. The acquired optical signals are subjected to A/D conversion. Digital data is thus acquired. Theanalysis unit 300 analyzes the digital data obtained by themeasurement unit 400, to identify and/or classify the particles in the measurement sample. - A structure of a fluid system in the
measurement unit 400 will be described, while referring toFig. 2 . Themeasurement unit 400 contains asample preparation unit 440, aspecimen suction unit 450, and theFCM detector 460. Thesample preparation unit 440 contains areagent containers reaction chamber 420, and awaste liquid chamber 430. For example, thereagent container 410 stores the dilution reagent, thereagent container 411 stores the hemolysis reagent, and thereagent container 414 stores the staining reagent. Thereagent containers reaction chamber 420. In thesample preparation unit 440, the dilution reagent and the staining reagent are injected through the individual liquid feeding tubes into thereaction chamber 420. Thespecimen suction unit 450 contains asuction tube 200. Thesuction tube 200 sucks the specimen contained in theblood collection tube 100, and discharges the specimen into thereaction chamber 420. Thereaction chamber 420 is connected through a liquid feeding tube, to theFCM detector 460. - The
reaction chamber 420 is a container for preparing a measurement sample. In thereaction chamber 420, mixed are the specimen, the staining reagent that contains a fluorescent dye, and the hemolysis reagent or the dilution reagent, to prepare the measurement sample. The measurement sample in thereaction chamber 420 is fed through the liquid feeding tube to theFCM detector 460, and measured. TheFCM detector 460 acquires various optical signals emitted from each particle in the measurement sample. After completion of the measurement with theFCM detector 460, the measurement sample that remained in thereaction chamber 420 is discarded in thewaste liquid chamber 430. Thereaction chamber 420 is washed with an unillustrated washing mechanism, before preparation of the next measurement sample. - Electrical connection of the individual components in the
measurement unit 400 will be described, while referring toFig. 3 . Thesample preparation unit 440, thespecimen suction unit 450, and theFCM detector 460 are connected to an interface (IF)unit 488. TheFCM detector 460 is connected to ananalog processor 481 and an A/D converter 482.Analog processor 481 processes an analog signal output from theFCM detector 460, and the A/D converter 482 converts the analog signal output from theanalog processor 481 into a digital signal. Themeasurement unit 400 is connected through an IFunit 489 to theanalysis unit 300. An IFunit 484, theIF unit 488, and theIF unit 489 are connected to a bus. - The
FCM detector 460, theanalog processor 481, and the A/D converter 482 will be described, while referring toFig. 4 . TheFCM detector 460 has afirst light source 411a, a secondlight source 411b, aflow cell 413,dichroic mirrors light receivers light receiver 416, and side-fluorescence receivers first light source 411a and the secondlight source 411b emit light of different wavelengths. For example, thefirst light source 411a emits light of a first wavelength, and the secondlight source 411b emits light of a second wavelength. The first wavelength is preferably a wavelength that hemoglobin can absorb. Such wavelength typically falls in the range from 315 nm or longer to 600 nm or shorter, preferably 400 nm or longer and 490 nm or shorter, more preferably 400 nm or longer and 450 nm or shorter, and yet more preferably 400 nm or longer and 410 nm or shorter. The second wavelength is different from the first wavelength, whose wavelength is preferably not absorbable by hemoglobin. Such wavelength typically falls in the range from 610 nm or longer to 750 nm or shorter, preferably 620 nm or longer and 700 nm or shorter, and more preferably 633 nm or longer and 643 nm or shorter. A semiconductor laser light source, for example, is applicable to the first and second light sources. - The measurement sample prepared in the
reaction chamber 420 is fed to theflow cell 413 of theFCM detector 460. In the illustration ofFig. 4 , the measurement sample flows in a direction perpendicular to this page. With the measurement sample kept flowed through theflow cell 413, light emitted from thefirst light source 411a is reflected on thedichroic mirror 418a, and then irradiated on each particle in the measurement sample that flows through theflow cell 413. Light emitted from the secondlight source 411b transmits through thedichroic mirror 418a, and then irradiated on each particle in the measurement sample that flows through theflow cell 413. - In the example of
Fig. 4 , the forward-scatteredlight receiver 416 is arranged so as to receive forward-scattered light emitted from the particle upon being irradiated with the light from the secondlight source 411b. Thelight receiver 416 may alternatively be arranged so as to receive the forward-scattered light emitted from the particle upon being irradiated with the light from thefirst light source 411a. Still alternatively, an additional light receiver may be arranged so as to receive the forward-scattered light emitted from the particle upon being irradiated with the light from thefirst light source 411a. The forward-scattered light is typically a scattered light which may be received at a receiving angle of 0 to approximately 20 degrees. The forward-scatteredlight receiver 416 is typically a photodiode. The side-scattered light (first side-scattered light) that corresponds to the light irradiated by thefirst light source 411a is reflected on thedichroic mirror 418b, and then received by the side-scatteredlight receiver 412a. The side-scattered light (second side-scattered light) corresponded to the light irradiated by the secondlight source 411b is reflected on thedichroic mirror 418c, and then received by the side-scatteredlight receiver 412b. The side-scattered light is typically a scattered light which may be received at a receiving angle of approximately 20 degrees to approximately 90 degrees. The side-scatteredlight receivers - The fluorescent dye represented by formula (I) above is excited by the first wavelength. The side-fluorescence (first side-fluorescence) that corresponds to the light emitted upon excitation of the fluorescent dye transmits through the
dichroic mirror 418b, and then received by the side-fluorescence receiver 422a. Although the method for analyzing blood cells of this embodiment does not use any fluorescent dye that can be excited at the second wavelength, the example ofFig. 4 illustrates a structure capable of receiving the side-fluorescence (second side-fluorescence) that corresponds to the light emitted upon excitation of the fluorescent dye, for the convenience of explaining the optical system. That is, the second side-fluorescence transmits throughdichroic mirror 418c, and then received by the side-fluorescence receiver 422b. The side-fluorescence receivers - Relations of the various types of light emitted from a particle P that passes through the
flow cell 413, with the optical system of theFCM detector 460 will be explained, while referring toFig. 5 . InFig. 5 , the light emitted from thefirst light source 411a is light L1 of the first wavelength, and the light emitted from the secondlight source 411b is light L2 of the second wavelength. Upon being irradiated with lights L1 and L2, the particle P that passes through theflow cell 413 emits forward-scattered lights that individually correspond to the light of the first wavelength and the light of the second wavelength, ahead of the direction of travel of light. Since thelight receiver 416 herein receives the forward-scattered light that corresponds to the light of the second wavelength,Fig. 5 illustrates only the second forward-scattered light (FSC-2) that corresponds to the light of the second wavelength, while omitting the first forward-scattered light (FSC-1) that corresponds to the light of the first wavelength. Referring now toFig. 5 , there are generated the first side-scattered light (SSC-1) that corresponds to light of the first wavelength, and the second side-scattered light (SSC-2) that corresponds to the light of the second wavelength, emitted laterally with respect to the direction of travel of light. With the particle P stained with the fluorescent dye that can be excited with the light of the first wavelength, obtainable is the first side-fluorescence (SFL-1) excited with the light of the first wavelength, emitted laterally with respect to the direction of travel of light. Although the method for analyzing blood cells of this embodiment does not use any fluorescent dye that can be excited at the second wavelength, the example ofFig. 5 illustrates a state in which both of SFL-1, and the second side-fluorescence (SFL-2) excited by the light of the second wavelength are generated, laterally to the direction of travel of light, for the convenience of explaining the optical system. - As has been described, FSC-2, SSC-1, SFL-1, SSC-2, and SFL-2 are received by the
light receivers - The analog signals corresponded to the various types of light are individually input to the
analog processor 481, and subjected to processes such as noise removal and smoothing. The A/D converter 482 samples analog signals output from theanalog processor 481, at a predetermined sampling rate (for example, 1024 points sampled at 10 nanosecond intervals, or 128 points sampled at 80 nanosecond intervals, or 64 points sampled at 160 nanosecond intervals). The A/D converter 482 digitizes the sampled analog signal, to produce waveform data. The A/D converter 482 samples and digitizes five types of analog signals that correspond to the individual cells that flow through theflow cell 413, to create waveform data including the second forward-scattered light signal, the first side-scattered light signal, the first fluorescence signal, the second side-scattered light signal, and the second fluorescence signal. In a case where FSC-1 is received, also waveform data of the first forward-scattered light signal is created. The A/D converter 482 also calculates a feature parameter that represents a morphological feature of each cell, from the waveform data of each signal. Such feature parameter is exemplified by peak value (height of pulse peak), pulse width, pulse area, transmittance, Stokes shift, ratio, temporal change, and values correlated thereto. - Optical information can be the aforementioned feature parameter. The optical information includes the fluorescence information and the scattered light information. The fluorescence information relates to the fluorescence generated from the fluorescent dye on the stained particle, upon irradiation of the measurement sample with light of the first wavelength. The fluorescence information is not particularly limited as long as it reflects the amount of the fluorescent dye that has stained the nucleic acid in nucleated cell. The fluorescence information is preferably peak value or pulse area of the first fluorescence signal, and is more preferably the peak value of the first fluorescence signal. The peak value of the first fluorescence signal herein is also referred to as "first fluorescence intensity". The first fluorescence intensity is understood to be intensity of fluorescence from the fluorescent dye on the particle irradiated with the light of the first wavelength.
- The scattered light information acquired herein may alternatively be a plurality of types of scattered light, which are typically a first scattered light information, a second scattered light information, and a third scattered light information. For example, the first scattered light information can be information related to the side-scattered light generated from the particles, upon irradiation of the measurement sample with the light of the first wavelength. The second scattered light information can be information related to the side-scattered light generated from the particles, upon irradiation of the measurement sample with the light of the second wavelength. The third scattered light information can be information related to the forward-scattered light generated from the particles, upon irradiation of the measurement sample with the light of the second wavelength. Information on the side-scattered light is not particularly limited as long as it reflects internal information such as complexity of cellular structure, granule characteristic, nuclear structure, and degree of segmentation. Information on the forward-scattered light is not particularly limited as long as it reflects size of the particle. The first scattered light information is preferably peak value or pulse area of the first side-scattered light signal, and is more preferably the peak value of the first side-scattered light signal. The second scattered light information is preferably a peak value or a pulse area of the second side-scattered light signal, and is more preferably the peak value of the second side-scattered light signal. The third scattered light information is preferably a peak value or a pulse area of the second forward-scattered light signal, and is more preferably the peak value of the second forward-scattered light signal. In this specification, the peak value of the first side-scattered light signal is also referred to as "first side-scattered light intensity", the peak value of the second side-scattered light signal is also referred to as "second side-scattered light intensity", and the peak value of the second forward-scattered light signal is also referred to as "second forward-scattered light intensity". The first side-scattered light intensity is understood to be intensity of the first side-scattered light emitted from the particle irradiated with the light of the first wavelength. The second side-scattered light intensity is understood to be intensity of the second side-scattered light emitted from the particle irradiated with the light of the second wavelength. The second forward-scattered light intensity is understood to be intensity of the forward-scattered light emitted from the particle irradiated with the light of the second wavelength.
- Referring now to
Fig. 6 , theanalysis unit 300 is electrically connected through theinterface unit 304 to themeasurement unit 400. Theinterface unit 304 is typically an USB interface. Theanalysis unit 300 contains acontroller 301, abus 302, astorage unit 303, aninterface unit 304, adisplay 305, and anoperation unit 306. Theanalysis unit 300 is typically constituted by a personal computer (see theanalysis unit 300 inFig. 1 ), and executes a program product stored in thestorage unit 303, to control themeasurement unit 400 of theanalysis system 500. Theanalysis unit 300 analyzes data that includes the optical information acquired by themeasurement unit 400, and displays an analysis result on thedisplay 305. Theanalysis unit 300 may also classify the cells with reference to the optical information. - The
storage unit 303 typically stores a program product for controlling themeasurement unit 400, and a program product for analyzing data acquired by themeasurement unit 400. Thedisplay 305 typically displays result of analysis of data acquired by themeasurement unit 400. Theoperation unit 306 has a keyboard, and a pointing device that contains a mouse or a touch panel. - Exemplary operations of the
analysis system 500 will now be described while referring toFig. 7 , without limiting the invention. Instep S 11, thecontroller 301 of theanalysis unit 300 receives a measurement start instruction from the user, through theoperation unit 306. Upon receiving the measurement start instruction, thecontroller 301 transmits instruction data for instructing the measurement start to themeasurement unit 400. Themeasurement unit 400 receives the instruction data, and executes a measurement process in step S12. - The method for analyzing blood cells of this embodiment typically encompasses a first embodiment and a second embodiment below. In the "first embodiment", a measurement sample prepared under hemolytic conditions is measured, and white blood cell in the measurement sample is classified. In the "second embodiment", the measurement process and the analysis process will vary, depending on a target to be measured designated by the user. With white blood cell designated, the measurement process and the analysis process will take place in the same manner as in the first embodiment. With reticulocyte and platelet designated, the measurement sample prepared under non-hemolytic conditions is measured, and reticulocyte and platelet are classified from the particles in the measurement sample.
- Exemplary measurement process in step S12 in
Fig. 7 according to the first embodiment will be explained while referring toFig. 8 , without limiting the invention. In step S21, thecontroller 301 of theanalysis unit 300 instructs themeasurement unit 400 to prepare the measurement sample from the specimen, under hemolytic conditions. More specifically, themeasurement unit 400 mixes the specimen, the staining reagent, and the hemolysis reagent in thereaction chamber 420, to prepare the measurement sample. In step S22, thecontroller 301 instructs themeasurement unit 400 to feed the measurement sample to theFCM detector 460, and to implement optical measurement by flow cytometry. Themeasurement unit 400 thus detects optical information of each particle in the measurement sample, typically including waveform data of SSC-1, SSC-2, FSC-2, and SFL-1. In step S23, thecontroller 301 instructs themeasurement unit 400 to transmit the optical information to theanalysis unit 300. The measurement process thus finishes. Theanalysis unit 300 then implements the analysis process in step S13 inFig. 7 . - Exemplary measurement process in step S12 in
Fig. 7 according to the second embodiment will be explained, while referring toFig. 9 , without limiting the invention. In step S31, thecontroller 301 of theanalysis unit 300 receives a measurement start instruction from the user, through theoperation unit 306. The target to be measured corresponds to any type of blood cell to be analyzed, which is exemplified by white blood cell, reticulocyte, and platelet. Input for designating the target to be measured is acceptable, typically through a screen for selecting the target to be measured, displayed on thedisplay 305. More specifically, thecontroller 301 displays a selection screen on which the target to be measured is designated, on thedisplay 305. On the selection screen, the user can designate the target to be measured, which is white blood cell, or, reticulocyte and platelet. After designating the target to be measured, and upon user's decision regarding the measurement start made on the screen, the measurement takes place. Upon acceptance, by thecontroller 301 in step S31, of a designation of white blood cell as the target to be measured, thecontroller 301 then causes in step S32 themeasurement unit 400 to prepare the measurement sample from the specimen under hemolytic conditions. Preparation of the measurement sample under hemolytic conditions is as described previously. Meanwhile, upon acceptance, by thecontroller 301 in step S31, of a designation of reticulocyte and platelet as the target to be measured, thecontroller 301 then causes in step S33 themeasurement unit 400 to prepare the measurement sample from the specimen under non-hemolytic conditions. More specifically, themeasurement unit 400 mixes the specimen, the staining reagent, and the dilution reagent in thereaction chamber 420, to prepare the measurement sample. The hemolysis reagent is not used under the non-hemolytic conditions. Steps S34 and S35 are the same as steps S22 and S23, respectively. After completion of the measurement process, theanalysis unit 300 then implements the analysis process in step S13 inFig. 7 . Exemplary analysis processes of the individual embodiments will be described later. - The specimen is blood specimen. The blood specimen is exemplified by whole blood, and dilution of the whole blood. The whole blood is typically peripheral blood collected from the subject. The blood specimen may contain an anticoagulant. The anticoagulants is exemplified by ethylenediaminetetraacetate (EDTA), EDTA salts (EDTA·2K, EDTA 2Na, for example), sodium citrate, heparin, and warfarin. The dilution of whole blood is obtainable typically by diluting the whole blood with a suitable aqueous solvent, preferably with a dilution reagent described later. The aqueous solvent is exemplified by water, physiological saline, and aqueous solution of buffering agent.
- The particles in the measurement sample are derived from blood components of the specimen. As referred herein, the "blood components" encompass the elements having been known to reside in blood, and abnormal cell. The elements having been known to reside in blood are typically blood cells usually contained in peripheral blood of healthy person. Such blood cells are exemplified by white blood cell, mature red blood cell, reticulocyte, and platelet. The "mature red blood cell" is a terminally differentiated red blood cell having neither nucleus nor nucleic acid. The term "mature red blood cell" herein is used for distinguishing this cell from reticulocyte. The mature red blood cell and reticulocyte, if not needed to be distinguished herein, may be collectively referred to as "red blood cell" or "RBC". The "reticulocyte" is a young red blood cell derived from erythroblastic cell in bone marrow, which is immediately after enucleated and released into peripheral blood. The reticulocyte usually becomes mature red blood cell in approximately one day. The reticulocyte contains therein a small amount of ribonucleic acid, and organelles such as ribosome and mitochondria, all of which are not found in mature red blood cell. The term "platelet" herein encompasses immature platelet and large platelet. "Immature platelet", also referred to as reticulated platelet, is a young platelet that has just been released into the peripheral blood. The mature platelet does not contain nucleic acid, whereas the immature platelet contains a small amount of ribonucleic acid. The "large platelet" has a diameter of 4 µm or larger. The platelet is usually 2 to 3 µm in diameter.
- The "abnormal cell" refers to a cell that does not normally appear in blood. The abnormal cell is exemplified by immature granulocyte. The immature granulocyte is a progenitor cell of granulocyte, and is exemplified by promyelocyte, myelocyte, and metamyelocyte. The immature granulocyte, usually found in bone marrow, may occasionally appear in blood, typically due to myeloid leukemia, bone metastasis, or severe infection. In a case where immature granulocyte is possibly contained in the blood specimen, the term "white blood cell" also encompasses the immature granulocyte. The abnormal cell also encompasses non-cellular particle and microorganism. The non-cellular particle is exemplified by platelet aggregation, red blood cell ghost, and lipid particle. The microorganism is exemplified by bacteria and fungi. The platelet aggregation occurs in a blood collection tube, due to contamination with tissue fluid during blood collection, insufficient mixing, or action of EDTA.
- The hemolysis reagent used for preparing the measurement sample will be described. The hemolysis reagent is a reagent for lysing red blood cell in the specimen, upon mixed with the specimen. The hemolysis reagent contains a surfactant, and is used in combination with a staining reagent that contains a fluorescent dye. The surfactant can hemolyze red blood cells in the specimen, and can cause damage to cell membrane of cells other than red blood cell, to an extent enough to allow the fluorescent dye to pass therethrough. The surfactant is exemplified by nonionic surfactant, cationic surfactant, and combinations thereof. The hemolysis reagent preferably contains the nonionic surfactant.
- The nonionic surfactant is exemplified by those represented by formula (II) below:
R1-R2-(CH2CH2O)n-H (II)
(where, R1 represents an alkyl group, an alkenyl group or an alkynyl group having 8 or more and 25 or less carbon atoms, and R2 represents an oxygen atom, -(COO)- or a group represented by formula (III) below:
- Concentration of the nonionic surfactant represented by formula (II), in the hemolysis reagent, is typically 0.5 g/L or higher and 5 g/L or lower. The nonionic surfactant represented by formula (II) is specifically exemplified by polyoxyethylene alkyl ether, polyoxyethylene sterol, polyoxyethylene castor oil, polyoxyethylene sorbitol fatty acid ester, polyoxyethylene alkylamine, polyoxyethylene polyoxypropylene alkyl ether, and combinations thereof. Among them, polyoxyethylene alkyl ether is preferred. Only one kind, or two or more kinds of the nonionic surfactant may be contained in the hemolysis reagent. The hemolysis reagent may further contain a nonionic surfactant, besides the nonionic surfactant represented by formula (II).
- The hemolysis reagent may further contain a cationic surfactant. The cationic surfactant is exemplified by quaternary ammonium salt-type surfactant, pyridinium salt-type surfactant, and combinations thereof. The quaternary ammonium salt-type surfactant suitably used herein is preferably a surfactant having 9 to 30 carbon atoms in total, represented by formula (IV) below. Only one kind, or two or more kinds of the cationic surfactant may be contained in the hemolysis reagent.

- In the formula (IV), R1 represents an alkyl group or an alkenyl group having 6 to 18 carbon atoms; each of R2 and R3, identically or differently, represents an alkyl group having 1 to 4 carbon atoms, or an alkenyl group; R4 represents an alkyl group having 1 to 4 carbon atoms, an alkenyl group, or a benzyl group; and X- represents a halogen ion. The "halogen" is fluorine, chlorine, bromine, or iodine.
- In formula (IV), R1 preferably represents an alkyl group or an alkenyl group having 6, 8, 10, 12, or 14 carbon atoms. A linear alkyl group is particularly preferred. R1 is more specifically exemplified by an octyl group, a decyl group, or a dodecyl group. Preferably, each of R2 and R3, identically or differently, represents a methyl group, an ethyl group, or a propyl group. R4 preferably represents a methyl group, an ethyl group, or a propyl group.
- The pyridinium salt-type surfactant is typically exemplified by a surfactant represented by formula (V):

- In formula (V), R1 represents an alkyl group or an alkenyl group having 6 to 18 carbon atoms; and X- represents a halogen ion.
- In formula (V), R1 preferably represents an alkyl group or an alkenyl group having 6, 8, 10, 12, or 14 carbon atoms. A linear alkyl group is particularly preferred. R1 is more specifically exemplified by an octyl group, a decyl group, or a dodecyl group.
- Concentration of the cationic surfactant in the hemolysis reagent is suitably selectable, depending on types of the surfactant. Concentration of the cationic surfactant in the hemolysis reagent is typically 10 ppm or higher and 10,000 ppm or lower.
- The hemolysis reagent may contain a buffering agent for keeping pH constant. The buffering agent is exemplified by inorganic acid salt, organic acid salt, Good's buffer, and combinations thereof. The inorganic acid salt is exemplified by phosphate, borate, and combinations thereof. The organic acid salt is exemplified by citrate, malate, and combinations thereof. The Good's buffer is exemplified by MES, Bis-Tris, ADA, PIPES, Bis-Tris-Propane, ACES, MOPS, MOPSO, BES, TES, HEPES, HEPPS, Tricine, Tris, Bicine, TAPS, and combinations thereof.
- The hemolysis reagent may further contain an aromatic organic acid. Concentration of the aromatic organic acid in the hemolysis reagent is not particularly limited. The aromatic organic acid herein means acid that has at least one aromatic ring in the molecule, and salt thereof. The aromatic organic acid is exemplified by aromatic carboxylic acid, and aromatic sulfonic acid. The aromatic carboxylic acid is exemplified by phthalic acid, benzoic acid, salicylic acid, hippuric acid, salts thereof, and combinations thereof. The aromatic sulfonic acid is exemplified by p-aminobenzenesulfonic acid, benzenesulfonic acid, salts thereof, and combinations thereof. Only one kind, or two or more kinds of the aromatic organic acid may be contained in the hemolysis reagent. Some aromatic organic acid can occasionally demonstrate a buffering function. When using the aromatic organic acid with the buffering function, use of the buffering agent is optional. The aromatic organic acid may be combined with the buffering agent.
- The hemolysis reagent is preferably a liquid reagent. A solvent is not particularly limited as long as it can dissolve the individual components such as the aforementioned surfactant. The solvent is exemplified by water, organic solvent, and mixtures thereof. The organic solvent is preferably a water-miscible solvent, and is exemplified by alcohol having 1 to 6 carbon atoms, ethylene glycol, diethylene glycol, polyethylene glycol, and DMSO.
- pH of the hemolysis reagent is not particularly limited. The pH of the hemolysis reagent is typically 4.5 or higher, and preferably 5 or higher. The pH of the hemolysis reagent is typically 11 or lower, and preferably 10 or lower. The pH is adjustable with use of any of known bases (such as sodium hydroxide) or acids (such as hydrochloric acid).
- The hemolysis reagent may have an osmotic pressure not particularly limited, which is preferably 150 mOsm/kg·H2O or lower from the viewpoint of hemolysis efficiency of red blood cell. The osmotic pressure may be adjusted by adding an appropriate osmoregulator. The osmoregulator is exemplified by sugar, amino acid, organic solvent, sodium chloride, and combinations thereof.
- The hemolysis reagent usable herein may be any of commercially available hemolysis reagents for blood cell analysis. Such reagents are exemplified by Lysercell WDF (Sysmex Corporation) and Lysercell WDF II (Sysmex Corporation).
- The dilution reagent used for preparing the measurement sample will be described. The dilution reagent preferably contains a solution of the buffering agent. Preferred example of the solvent includes water and physiological saline. Water is particularly preferred. The buffering agent preferably demonstrates a buffering function within a pH range from 6 or higher and 11 or lower. Such buffers is selectable typically from carboxylate, phosphate, Good's buffer, taurine, and triethanolamine. The dilution reagent typically has a pH of 6 or higher and 11 or lower, which is preferably 7 or higher and 10 or lower, and more preferably 8 or higher and 9.5 or lower. With the dilution reagent whose pH is 6 or above, red blood cell will be less likely to hemolyze in the measurement sample. This successfully suppresses red blood cell ghost from occurring. With the dilution reagent whose pH is 11 or below, red blood cells and red blood cell ghost may be prevented from being non-specifically stained with the fluorescent dye. A preferred dilution reagent is an aqueous solution of the buffering agent, having a pH of 6 or higher and 11 or lower.
- The dilution reagent may further contain, besides the buffering agent, components such as osmotic pressure compensator, staining accelerator, highly-charged anion, and preservative. The osmotic pressure compensator is a substance capable of maintaining osmotic pressure of the dilution reagent within an appropriate range. The osmotic pressure compensator is exemplified by alkali metal salt of organic acid such as propionic acid; saccharide such as glucose or mannose; alkali metal halide such as sodium chloride; and alkaline earth metal halide such as magnesium chloride. The osmotic pressure compensator may be used singly or in combination of two or more kinds thereof. The osmotic pressure compensator, when used, is added to the dilution reagent, so as to adjust the osmotic pressure of the dilution reagent preferably to 150 mOsm/kg■H2O or higher and 600 mOsm/kg■H2O or lower.
- The staining accelerator is a substance capable of promoting permeability of the fluorescent dye into the blood cells. The staining accelerator is exemplified by surfactant, which is preferably cationic surfactant. Quaternary ammonium salt type surfactant is particularly preferred as the cationic surfactant, which is exemplified by decyltrimethylammonium bromide (DTAB), lauryltrimethylammonium chloride (LTAC), octyltrimethylammonium bromide, cetyltrimethylammonium chloride, and myristyltrimethylammonium bromide. The cationic surfactant may be used singly or in combination of two or more kinds thereof.
- The concentration of the cationic surfactant in the dilution reagent is not particularly limited as long as hemolysis of red blood cell may be suppressed. The concentration may be appropriately determined typically within the range from 50 ppm or higher and 20,000 ppm or lower. In a specific case of using DTAB, the concentration thereof in the dilution reagent is preferably 500 ppm or higher and 3000 ppm or lower. In a case of using LTAC, the concentration thereof in the dilution reagent is preferably 100 ppm or higher and 500 ppm or lower. With such concentration of the cationic surfactant contained therein, the dilution reagent can suppress hemolysis of red blood cell, and can promote staining of the blood cells with the fluorescent dye.
- The highly-charged anion is added to the dilution reagent, in order to suppress non-specific staining of red blood cell with the fluorescent dye. The highly-charged anion is exemplified by sulfate ion, phosphate ion, carbonate ion, and polycarboxylate ion. Compounds capable of supplying these ions are exemplified by citric acid, sulfuric acid, phosphoric acid, EDTA, and alkali metal salts thereof. The highly-charged anion may be used singly or in combination of two or more kinds thereof.
- The preservative contained in the dilution reagent is exemplified by sodium 2-pyridylthio-1-oxide and β-phenethyl alcohol.
- The method for analyzing blood cells of this embodiment may employ a commercially available dilution reagent. The commercially available dilution reagent is exemplified by CELLPACK (registered trademark) DFL (Sysmex Corporation).
- Staining reagent used for preparing the measurement sample will be described. The fluorescent dye suitable for the staining reagent is a fluorescent dye represented by formula (I) above. This fluorescent dye is a cyanine-based fluorescent dye that can be excited by the light of the first wavelength, and can bind to nucleic acid. With such binding property to nucleic acid, the fluorescent dye makes it possible to distinguish nucleic acid-free cells such as mature red blood cell and platelet, from nucleic acid-containing cells such as reticulocyte and white blood cells. Since the fluorescent dye represented by formula (I) above has a maximum absorption wavelength fallen in the range of the first wavelength, so that the fluorescence from this fluorescence dye may be suppressed from interfering with the scattered light that corresponds to the light of the second wavelength.
- The "alkyl group" can be either linear or branched. The alkyl group having 1 to 18 carbon atoms, represented by R1 to R4 and R6 to R8 in formula (I), is exemplified by methyl, ethyl, propyl, isopropyl, t-butyl, n-butyl, isopentyl, neopentyl, t-pentyl, isohexyl, heptyl, octyl, decyl, dodecyl, tetradecyl, hexadecyl, and octadecyl. The alkyl group preferably has 1 to 10 carbon atoms, in which the number of carbon atoms is more preferably 1 to 6, and is particularly 1 to 3. Preferred examples of the alkyl group include methyl, ethyl, propyl, isopropyl, t-butyl, n-butyl, isopentyl, neopentyl, t-pentyl, and isohexyl. The alkyl group represented by R5 in formula (I) preferably has 1 to 3 carbon atoms.
- The "alkenyl group" can be either linear or branched. The alkenyl group having 3 to 20 carbon atoms, represented by R1 and R2 in formula (I), is exemplified by allyl, propenyl, isopropenyl, butenyl, isobutenyl, pentenyl, isopentenyl, hexenyl, heptenyl, octenyl, decenyl, dodecenyl, tetradecenyl, hexadecenyl, octadecenyl, and icosenyl. The alkenyl group preferably has 3 to 14 carbon atoms, in which the number of carbon atoms is more preferably 3 to 10, and is particularly 3 to 6.
- The substituent of the phenyl group is exemplified by -NH2, halogen, -OH, - SH, -CN, -NO2, -COOH, and alkyl group having 1 to 6 carbon atoms. The substituent on the benzyl group is exemplified by -CN, -COOH, -NH2, -NO2, -OH, -SH, alkyl group having 1 to 18 carbon atoms, alkoxy group having 1 to 6 carbon atoms, alkylamino group having 1 to 6 carbon atoms, acylamino group having 1 to 6 carbon atoms, halogen, and haloalkyl group having 1 to 6 carbon atoms. "Haloalkyl group" is an alkyl group having at least one hydrogen substituted with halogen. In the haloalkyl group having two or more halogens, types of such halogens may be same or different.
- In formula (I) above, with either X or Y given by an oxygen atom, the other preferably represents a sulfur atom, a selenium atom, or C(CH3)2. The counter ion Z- in formula (I) is exemplified by F-, Cl-, Br-, I-, CF3SO3 -, BF4 -, and ClO4 -.
- The fluorescent dye represented by formula (I) is exemplified by 3-methyl-2-[(3-methyl-2-benzoxazolinylidene)methyl]benzoxazolium, 3-ethyl-2-[(3-ethyl-2-benzothiazolinylidene)methyl]benzothiazolium, 3-ethyl-2-[(3-ethyl-6-methyl-2-benzothiazolinylidene)methyl]-6-methyl-benzothiazolium, 3-ethyl-2-[(3-ethyl-2-benzoxazolinylidene)methyl]benzoxazolium, 3-ethyl-2-[(3-ethyl-2-benzothiazolinylidene)methyl]benzoxazolium, 3-ethyl-6-methyl-2-[(3-ethyl-6-methyl-2-benzothiazolinylidene)methyl]benzothiazolium, 3-methyl-2-[(1,3,3-trimethyl-2-indolinylidene)methyl]benzothiazolium, and 1,3,3-trimethyl-2-[(3-methyl-2-benzoxazolinylidene)methyl]-3H-indolium. Absorption spectra of these fluorescent dyes in ethanol are illustrated in
Fig. 10 . Maximum absorption wavelengths (λmax) of these fluorescent dyes are summarized in Table 1.[Table 1] Fluorescence dye λmax (nm) 3-ethyl-2-[(3-ethyl-2-benzothiazolinylidene)methyl]benzothiazolium 424 3-ethyl-2-[(3-ethyl-2-benzoxazolinylidene)methyl]benzoxazolium 376 3-methyl-2-[(3-methyl-2-benzoxazolinylidene)methyl]benzoxazolium 376 1,3,3-trimethyl-2-[(3-methyl-2-benzoxazolinylidene)methyl]-3H-indolium 398 3-methyl-2-[(1,3,3-trimethyl-2-indolinylidene)methyl]benzothiazolium 434 3-ethyl-2-[(3-ethyl-2-benzothiazolinylidene)methyl]benzoxazolium 402 3-ethyl-2-[(3-ethyl-6-methyl-2-benzothiazolinylidene)methyl]-6-methyl- benzothiazolium 430 3-ethyl-6-methyl-2-[(3-ethyl-6-methyl-2-benzothiazolinylidene)methyl]benzothiazolium 401 - Preferred fluorescent dyes include 3-ethyl-2-[(3-ethyl-2-benzothiazolinylidene)methyl]benzothiazolium, 3-ethyl-2-[(3-ethyl-6-methyl-2-benzothiazolinylidene)methyl]-6-methyl-benzothiazolium, 3-ethyl-2-[(3-ethyl-2-benzothiazolinylidene)methyl]benzoxazolium, 3-ethyl-6-methyl-2-[(3-ethyl-6-methyl-2-benzothiazolinylidene)methyl]benzothiazolium, 3-methyl-2-[(1,3,3-trimethyl-2-indolinylidene)methyl]benzothiazolium, and 1,3,3-trimethyl-2-[(3-methyl-2-benzoxazolinylidene)methyl]-3H-indolium.
- The staining reagent preferably contains a solvent of the fluorescent dye. The solvent is not particularly limited as long as it can dissolve the fluorescent dye. The solvent is exemplified by water, organic solvent, and mixtures thereof. The organic solvent is exemplified by alcohol having 1 to 6 carbon atoms, ethylene glycol, diethylene glycol, polyethylene glycol, and dimethyl sulfoxide (DMSO). Concentration of the fluorescent dye in the staining reagent may be suitably determined, depending on types of the fluorescent dye. The concentration of the fluorescent dye is typically 100 ppm or higher, preferably 500 ppm or higher, and more preferably 1000 ppm or higher. Concentration of the fluorescent dye is typically 100000 ppm or lower, preferably 50000 ppm or lower, and more preferably 10000 ppm or lower.
- Since the fluorescent dye itself can bind to the nucleic acid of the cell as described above, the method for analyzing blood cells of this embodiment no longer needs staining of the cells with use of an antibody labeled with the fluorescent dye. Hence in the method for analyzing blood cells of this embodiment, the fluorescent dye does not contain an antibody.
- The staining reagent that contains the fluorescent dye may also be provided as a reagent for blood cell analysis, used for the method for analyzing blood cells of this embodiment. The reagent for blood cell analysis of this embodiment may typically have a form such that a solution of the fluorescent dye is filled in a container. Referring now to
Fig. 11A ,reference sign 11 denotes a container, having the reagent for blood cell analysis of this embodiment filled therein. Thecontainer 11, when enclosed in a package box, may be typically accompanied by a package insert that describes composition of the reagent for blood cell analysis, directions for use, storage and so forth, and a cushion material for cushioning external impact, enclosed therein. - The staining reagent that contains the fluorescent dye, and the hemolysis reagent may also be provided in the form of a reagent kit for blood cell analysis, used for the method for analyzing blood cells of this embodiment. The reagent for blood cell analysis of this embodiment may typically be in the form such that a solution of the fluorescent dye, and the hemolysis reagent are individually filled in containers. Referring now to
Fig. 11B ,reference sign 21 denotes a reagent kit for blood cell analysis of this embodiment,reference sign 22 denotes a first container that contains a solution of the fluorescent dye, andreference sign 23 denotes a second container that contains the hemolysis reagent. The reagent kit for blood cell analysis of this embodiment may be enclosed in a package box. Thereagent kit 21, when enclosed in the package box, may be typically accompanied by a package insert and cushion material enclosed therein. The reagent kit of this embodiment may further contain, for example, the dilution reagent or a calibrator. - A further embodiment relates to use of the fluorescent dye, for manufacture of the reagent for blood cell analysis. Details of the fluorescent dye and the reagent for blood cell analysis are as described above. A further embodiment relates to use of the fluorescent dye and the hemolysis reagent, for manufacture of the reagent kit for blood cell analysis. Details of the fluorescent dye, the hemolysis reagent, and the reagent kit for blood cell analysis are as described above.
- The fluorescent dye represented by formula (I) above is mixed with the specimen and the dilution reagent, so that the concentration (final concentration) in the measurement sample falls within a predetermined range. A preferred final concentration of the fluorescent dye in the measurement sample is 1000 ppm or lower, which is more preferably 100 ppm or lower, and even more preferably 10 ppm or lower. A preferred final concentration of the fluorescent dye in the measurement sample is 0.001 ppm or higher, which is more preferably 0.01 ppm or higher, and even more preferably 0.1 ppm or higher.
- A ratio of mixing of the hemolysis reagent, the staining reagent, and the specimen may be appropriately determined, according to the concentration of the fluorescent dye in the staining reagent, or to the types of the specimen. The ratio of mixing of the hemolysis reagent, the staining reagent, and the specimen is, for example, preferably 1000 : (1 or above) : (1 or above) on the volume basis. The ratio is more preferably 1000 : (10 or above) : (10 or above), and even more preferably 1000 : (15 or above) : (15 or above). The ratio of mixing of the hemolysis reagent, the staining reagent, and the specimen is preferably, for example, 1000 : (50 or below) : (50 or below) on the volume basis. The ratio is more preferably 1000 : (30 or below) : (30 or below), and even more preferably 1000 : (25 or below) : (25 or below). The ratio of mixing of the staining reagent and the specimen may be the same or different.
- Red blood cell is the most abundant blood cell in the blood specimen. Since the hemolysis reagent can lyse red blood cell, so that use thereof in analysis of blood cell which is not lysed with the hemolysis reagent (white blood cell, for example) can exclude influence of red blood cell. Use of the hemolysis reagent can also promote staining of white blood cell with the fluorescent dye, with the aid of the surfactant contained therein. As can be seen, preparation of the measurement sample under hemolytic conditions is suitable for the analysis of white blood cell.
- The fluorescent dye represented by formula (I) above is mixed with the specimen and the dilution reagent, so that the final concentration falls within a predetermined range. A preferred final concentration of the fluorescent dye in the measurement sample is 500 ppm or lower, which is more preferably 100 ppm or lower, and even more preferably 50 ppm or lower. A preferred final concentration of the fluorescent dye in the measurement sample is 0.01 ppm or higher, which is more preferably 0.1 ppm or higher, and even more preferably 1 ppm or higher.
- The ratio of mixing of the dilution reagent, the staining reagent, and the specimen may be appropriately determined, according to the concentration of the fluorescent dye in the staining reagent, or types of the specimen. The ratio of mixing of the hemolytic reagent, the staining reagent, and the specimen is preferably, for example, 1000 : (0.1 or above) : (1 or above) on the volume basis. The ratio is more preferably 1000 : (0.5 or above) : (5 or above), and even more preferably 1000 : (1 or above) : (10 or above). The ratio of mixing of the dilution reagent, the staining reagent, and the specimen is preferably, for example, 1000 : (50 or below) : (100 or below) on the volume basis. The ratio is more preferably 1000 : (30 or below) : (50 or below), and even more preferably 1000 : (20 or below) : (25 or below). The ratio of mixing of the staining reagent and the specimen may be the same or different.
- Since reticulocyte is lysed with the hemolysis reagent similarly to mature red blood cell, so that preparation of the measurement sample under non-hemolytic conditions is suitable for the analysis of reticulocyte. The prior method, although capable of classifying and counting reticulocyte and platelet by a one-time measurement, has occasionally suffered from poor accuracy of acquired platelet count, depending on specimens. An additional measurement has therefore been necessary to count platelet more accurately, under conditions suited to the platelet measurement. In contrast, the method for analyzing blood cells of this embodiment can classify and count reticulocyte and platelet more accurately, with a one-time measurement of the measurement sample prepared under non-hemolytic conditions. As can be seen, preparation of the measurement sample under non-hemolytic conditions is suitable for the analysis of reticulocyte and platelet. When classifying reticulocyte and platelet by the method for blood cell analysis of this embodiment, the measurement sample does not contain the hemolysis reagent. That is, the measurement sample is prepared without going through a process for hemolyzing red blood cell.
- A further embodiment relates to a method for fluorescently staining blood cells, including contacting the fluorescent dye represented by formula (I) above, with the blood cells. This method can stain the blood cells, by mixing the fluorescent dye, with a specimen that contains the blood cells. The method may also use the aforementioned staining reagent, as the fluorescent dye. In the mixing of the fluorescent dye with the specimen, the hemolysis reagent or the dilution reagent may be further mixed. Concentrations and ratios of mixing of the fluorescent dye and the individual reagents in the mixing are the same as those described for the preparation of the measurement sample. Details of the fluorescent dye, the specimen, the hemolysis reagent, the dilution reagent, and the measurement sample are as described previously.
- Exemplary analysis process in step S13 in
Fig. 7 according to the first embodiment will be explained, while referring toFigs. 12 and13 , without limiting the invention. White blood cell will also be denoted as "WBC", mature red blood cell as "mRBC", and reticulocyte as "RET". - Referring now to
Fig. 12 , the analysis process in the first embodiment classifies WBC in the measurement sample into subpopulations. In the first embodiment, the measurement sample, prepared with use of the hemolysis reagent, contains a red blood cell ghost which is produced as a result of hemolysis of mRBC and RET. WBC is classified into subpopulations by identifying the individual subpopulations of WBC from the particles in the measurement sample, with reference to the fluorescence information and the first scattered light information, and/or, the fluorescence information and the second scattered light information. This example employs the first side-fluorescence intensity (also referred to as "SFL-1 intensity") as the fluorescence information, the first side-scattered light intensity (also referred to as "SSC-1 intensity") as the first scattered light information, and the second side-scattered light intensity (also referred to as "SSC-2 intensity") as the second scattered light information. - WBC may be classified into subpopulations, typically by analysis on scattergrams. A scattergram for classifying WBC into subpopulations with reference to the fluorescence information and the first scattered light information is also referred to as "first scattergram (a)". A scattergram for classifying WBC into subpopulations with reference to the fluorescence information and the second scattered light information is also referred to as "first scattergram (b)". In the analysis process of the first embodiment, either the first scattergram (a) or (b) is created. Alternatively, both the first scattergrams (a) and (b) may be created.
- Referring now to
Fig. 12 , theanalysis unit 300 in step S101 creates the first scattergram (a), with reference to the acquired optical information. The first scattergram (a) has the SSC-1 intensity and the SFL-1 intensity plotted on two coordinate axes. In step S101, theanalysis unit 300 may alternatively create the first scattergram (b), with reference to the acquired optical information. The first scattergram (b) has the SSC-2 intensity and the SFL-1 intensity plotted on two coordinate axes. The abscissa and the ordinate of the first scattergrams (a) and (b) may be expressed in either logarithmic or linear scale. Preferably, the abscissa of the first scattergrams (a) and (b) is given in a logarithmic scale, meanwhile the ordinate in a linear scale. Step S101 determines positions of points corresponded to the individual particles in the measurement sample, on the thus created first scattergram (a). In an alternative case where the first scattergram (b) was created, positions of points corresponded to the individual particles in the measurement sample are determined on the first scattergram (b). - In step S102, the
analysis unit 300 identifies the individual subpopulations of white blood cell from the particles in the measurement sample, with reference to the thus determined SFL-1 intensity, and the SSC-1 intensity or the SSC-2 intensity of the individual points. At least the lymphocyte population, the monocyte population, and the granulocyte population are determined as the subpopulations. As described previously, granulocyte includes neutrophil, eosinophil, and basophil. If possible, granulocyte is further classified to identify at least a neutrophil population, an eosinophil population, and a basophil population. Preferably, the lymphocyte population, the monocyte population, the neutrophil population, and the eosinophil population are identified from the particles in the measurement sample. More preferably, the lymphocyte population, the monocyte population, the neutrophil population, the eosinophil population, and the basophil population are identified from the particles in the measurement sample. Also a population of immature granulocytes, when contained in the measurement sample, may be identified, besides the individual subpopulations of white blood cell. An algorithm per se for identifying the individual subpopulations of white blood cell has been known. For example, white blood cell can be classified into the subpopulations, with use of a program product stored in thestorage unit 303 of theanalysis unit 300. Alternatively, since the positions where the individual subpopulations of white blood cell appear on the scattergram are already known, so that the individual subpopulations of white blood cell may be identified with reference to the scattergram.Fig. 13 illustrates exemplary first scattergrams (a) and (b) on which white blood cell is classified into three types or five types of subpopulations. An area surrounded by the broken line in each scattergram indicates an area where immature granulocyte appears. In the drawings, "Lymp" stands for the lymphocyte population, "Mono" for the monocyte population, "Gran" for the granulocyte population, "Neut" for the neutrophil population, "Eo" for the eosinophil population, and "Baso" for the basophil population. "IG" stands for immature granulocytes. - Referring now to (A) and (B) in
Fig. 13 , three populations of lymphocyte, monocyte, and granulocyte appear to distribute as the individual subpopulations of white blood cell, on the first scattergrams (a) and (b). Also debris such as red blood cell ghost appears in a region where the SFL-1 intensity is low. As can be seen from these drawings, whichever of the first scattergrams (a) and (b) can classify white blood cell into three subpopulations of lymphocyte, monocyte, and granulocyte. The immature granulocyte, when contained in the measurement sample, appears in an area where the SFL-1 intensity is higher than that of the granulocyte population, and the SSC-1 intensity or the SSC-2 intensity is higher than that of the monocyte population, as indicated by the broken line. - If granulocyte can be classified into subpopulations, then white blood cell can be classified typically into five subpopulations. Referring now to (C) and (D) in
Fig. 13 , five populations of lymphocyte, monocyte, neutrophil, eosinophil, and basophil distribute as the subpopulations of white blood cell, on both of the first scattergrams (a) and (b). Immature granulocytes, when contained in the measurement sample, appears in an area where the fluorescence intensity is higher than that of the neutrophil population, and the SSC-1 intensity or the SSC-2 intensity is higher than that of the monocyte population, as indicated by the broken line. White blood cell exemplified inFig. 13 is classified into, but not limited to, three or five subpopulations. White blood cell may alternatively be classified into four subpopulations of lymphocyte, monocyte, neutrophil, and eosinophil. Cells contained in the individual subpopulations may be optionally counted. The cells are counted with use of theanalysis unit 300. After completion of the classification of white blood cell, theanalysis unit 300 finishes the analysis process. The process then advances to step S14 inFig. 7 . - Exemplary analysis process in step S13 in
Fig. 7 according to the second embodiment will be explained, while referring toFigs. 14 to 17 , without limiting the invention. Platelet herein is also referred to as "PLT". Referring now toFig. 14 , upon acceptance by thecontroller 301 of theanalysis unit 300 in step S201, of a designation of RET and PLT as the target to be measured, the process then advances to step S202. The measurement sample in this case is prepared without using the hemolysis reagent, and therefore contains mRBC and RET. The measurement sample also contains WBC and PLT. In this analysis process, the RET population and the PLT population are classified from the particles in the measurement sample. This identifies RET and PLT. Alternatively, the RET population, the PLT population, and the mRBC population may be classified from the particles in the measurement sample. This identifies RET, PLT, and RBC. This example will be described regarding an exemplary case where the RET population, the PLT population, and the RBC population are classified from the particles in a measurement sample, with reference to the fluorescence information and the third scattered light information. The fluorescence information is preferably the SFL-1 intensity. The third scattered light information is preferably the second forward-scattered light intensity (also referred to as "FSC-2 intensity"). - The particles in the measurement sample may be classified, typically by analysis on the scattergrams. A scattergram for classifying the RET population and the PLT population from the particles in the measurement sample, with reference to the fluorescence information and the third scattered light information, is also referred to as "second scattergram". This example employs the SFL-1 intensity as the fluorescence information, and the FSC-2 intensity as the third scattered light information. The second scattergram is created typically with reference to the SFL-1 intensity and the FSC-2 intensity. Referring now to
Fig. 14 , theanalysis unit 300 in step S202 creates the second scattergram. For example, theanalysis unit 300 creates a scattergram having the SFL-1 intensity and the FSC-2 intensity plotted on two coordinate axes, with reference to the acquired optical information. Positions of points corresponded to the individual particles in the measurement sample are then determined, on the thus created second scattergram. The abscissa and the ordinate of the second scattergram may be expressed in either logarithmic or linear scale. The second scattergram, with the abscissa and the ordinate expressed in logarithmic scales, is suitable for PLT analysis. Meanwhile, the second scattergram, with the abscissa and the ordinate expressed in linear scales, is suitable for RET and RBC analyses. - In step S203, the
analysis unit 300 classifies the blood cells other than WBC, into the RET population, the PLT population, and the mRBC population, with reference to the SFL-1 intensity and the FSC-2 intensity. The RET population demonstrates higher SFL-1 intensity, than the mRBC population. The PLT population demonstrates lower FSC-2 intensity, than the RET population. Now, the fluorescence intensity and the scattered light intensity of the particle populations on the scattergram may also be compared, typically with use of statistical representative values of the fluorescence intensity and scattered light intensity of the individual particle populations. The statistical representative values of the fluorescence intensity and the scattered light intensity of a certain particle population are values that can be acquired from the fluorescence intensity and the scattered light intensity of the particles that constitute the particle population. The statistical representative values are exemplified by median value, mean value, and mode value. The median value is preferred. -
Fig. 15A illustrates examples of the second scattergram (in logarithmic scale) and the second scattergram (in linear scale). There are the RET population, the PLT population, and the mRBC population appeared on the individual second scattergrams. In the second scattergram (in logarithmic scale), the RET and mRBC populations appear in areas where the FSC-2 intensity is high, meanwhile the PLT population appears in an area where the FSC-2 intensity is low. In the second scattergram (in linear scale), the PLT population appears in an area where the FSC-2 intensity is low, meanwhile the RET population appears in an area where the FSC-2 intensity is higher than that of the PLT population. In both scattergrams, the RET population appears in the areas where the SFL-1 intensity is higher than that of the mRBC population. Paragraphs below will explain how the particles in the measurement sample are classified into the RET population, the mRBC population, and the PLT population, on the second scattergrams. - As has been described previously, the PLT has the smallest size among the blood cells, and thus produces the forward-scattered light whose intensity is lower than that of RET. The PLT population therefore appears on the second scattergram, in the area where the FSC-2 intensity is lower than that of the RET population. RET and PLT are thus discriminable, with reference to the FSC-2 intensity. As has been described previously, RET contains a small amount of ribonucleic acid, meanwhile mRBC contains neither nucleus nor nucleic acid. The RET population therefore appears in the area where the fluorescence intensity is higher than that of the mRBC population. mRBC and RET are thus discriminable, with reference to the SFL-1 intensity. As can be seen, the particles in the measurement sample are classified into the RET population, the PLT population, and the mRBC population, on the second scattergrams.
- Referring now to
Fig. 14 , theanalysis unit 300 in step S203 identifies the RET population, the PLT population, and the mRBC population from the particles in the measurement sample. RET matures to mRBC, and this makes it difficult to exactly define the boundary between the RET population and the mRBC population. It is therefore conceived, for example, to set a threshold value of the SFL-1 intensity at which the mRBC population and the RET population are dividable, typically with reference to a range of the SFL-1 intensity that can be usually demonstrated by mRBC, or an average level of the mRBC count. Such threshold value may be defined as a boundary between the mRBC population and the RET population on the second scattergram. The areas where mRBC and RET individually appear may be set with reference to the threshold value and the FSC-2 intensity, typically as indicated by broken lines inFig. 15B . Particles in the thus set area where mRBC appears can be identified as mRBC. Meanwhile, particles in the thus set area where RET appears can be identified as RET. The population that appears in an area where the FSC-2 intensity is low may be identified by the user as the PLT population on the second scattergram (in logarithmic scale), if the population that appears in an area where the FSC-2 intensity is high, and the population that appears in an area where the FSC-2 intensity is lower are clearly separated. Alternatively, the areas where the RET, PLT, and mRBC populations will appear are preliminarily determined on the second scattergram, by accumulating measurement data from a plurality of specimens, and the particles that appears in the individual areas may be identified as RET, PLT and mRBC. The thus identified RET, PLT, and RBC may be optionally counted. The cells are counted with use of theanalysis unit 300. - Referring now to
Fig. 14 , the process advances to step S204. In step S204, theanalysis unit 300 classifies the RET population, into particle that appears in the LFR area, particle that appears in the MFR area, and particle that appears in the HFR area, with reference to the SFL-1 intensity. It has been known that the younger the RET, the more abundant the nucleic acid (RNA) in the cell. As RET matures, the RNA level in the cell decreases. That is, the RNA level in RET indicates the degree of maturation of RET. Now, the SFL-1 intensity of the cell measured by FCM reflects the nucleic acid level in the cell. The degree of maturation of RET may therefore be analyzed with reference to the SFL-1 intensity. Referring now toFig. 16 , the area where RET appears on the second scattergram (in linear scale) can be divided into three areas of LFR, MFR, and HFR with reference to the SFL-1 intensity. RET that appears in the individual areas may be counted. RET that appears in the HFR area is most nucleic acid-rich, and therefore represents most immature RET. - Alternatively, RET that appears in the individual areas of LFR, MFR, and HFR may be analyzed to acquire a mean value of the fluorescence intensity (SFL-1 intensity) and a mean value of the forward-scattered light intensity (FSC-2 intensity). Yet alternatively, the particle in an area where mRBC appears (that is, mRBC) may be analyzed to acquire mean values of the SFL-1 intensity and the FSC-2 intensity. Therapeutic effect on red blood cell diseases (for example, pernicious anemia, iron deficiency anemia, etc.) can be monitored with reference to the mean values of the SFL-1 intensity and FSC-2 intensity of RET and mRBC that appear in the individual areas, according to the method described in
Japanese Examined Patent No. 4474135 - Referring now to
Fig. 14 , the process advances to step S205. In this step, the PLT population is further analyzed. In step S205, theanalysis unit 300 identifies immature platelet and large platelet from the PLT population on the second scattergram (in logarithmic scale), with reference to the SFL-1 intensity and the FSC-2 intensity. As has been described previously, the mature platelet does not contain nucleic acid, meanwhile the immature platelet contains a small amount of ribonucleic acid. Hence, PLT that demonstrates high SFL-1 intensity may be identified as immature platelet, from among the PLT population on the second scattergram. For example, as illustrated in (A) inFig. 17 , PLT that appears in an area where SFL-1 is high (the area surrounded by the broken line) on the second scattergram, may be identified as immature platelet. PLT other than immature platelet may be identified as mature platelet. Thus, the PLT population is classified into immature platelet and mature platelet. The identified immature platelet may be counted. Immature platelet fraction (IPF) may be estimated, if the platelet count has already been acquired by counting the PLT population. IPF represents a ratio of platelet count in an area with high fluorescence intensity (the area surrounded by a solid-lined square), to the platelet count. IPF has been known as an index of platelet productivity. - Since the large platelet has larger size than that of normal PLT, so that PLT that demonstrates high FSC-2 intensity, from among the PLT population on the second scattergram, may be identified as the large platelet. For example, as illustrated in the second scattergram named (B) in
Fig. 17 , PLT that appears in an area where FSC-2 is high (the area surrounded by the broken line) may be identified as large platelet. PLT other than the large platelet may be identified as normal-sized PLT. Thus, the PLT population is classified into large platelet and normal-sized platelet. The identified large platelet may be counted. Percentage of large platelet (P-LCR) may be estimated, if the platelet count has already been acquired by counting the PLT population. P-LCR represents a ratio of platelet count in an area with high forward-scattered light intensity (the area surrounded by a broken-lined square), to the platelet count. P-LCR has been known as an index of platelet productivity and congenital diseases. After completion of the analysis of PLT, theanalysis unit 300 finishes the analysis process. The process then advances to step S14 inFig. 7 . - Referring now to
Fig. 14 , upon acceptance, in step S201 by thecontroller 301 of theanalysis unit 300, of a designation of WBC as the target to be measured, the process then advances to step S101 inFig. 12 . In this case, the analysis process (classification of WBC) of the first embodiment takes place. After completion of the classification of WBC, theanalysis unit 300 finishes the analysis process. The process then advances to step S14 inFig. 7 . - Referring now to
Fig. 7 , upon completion of the aforementioned analysis process, thecontroller 301 in step S14 outputs analysis result on thedisplay 305. The process thus finishes. The paragraphs above have described the process for analyzing WBC in the measurement sample, while referring toFigs. 12 and13 . The paragraphs above have also described the process for analyzing reticulocyte and platelet in the measurement sample, while referring toFigs. 14 to 17 . The analysis process may, however, only be implemented in a part thereof, or may be implemented entirely. - An analysis result screen that is output on the
display 305 may contain, for example, the number of subpopulations of white blood cell; reticulocyte count; platelet count; particle counts in the individual areas of LFR, MFR, and HFR; IPF; and P-LCR. Besides these information, the screen may contain a scattergram created with reference to the optical information. The screen may further contain a flag based on the analysis result. - As has been described, the method for analyzing blood cells of this embodiment can provide a medical worker such as doctor or medical technician, with analysis result of white blood cell, such as information on the number of subpopulations of white blood cell contained in the specimen. The method can also provide analysis result of reticulocyte and platelet, such as information on the counts of reticulocyte and platelet contained in the specimen. The method can yet also provide analysis result of red blood cell. The medical worker can make decision from the acquired analysis results, on whether the specimen should further be inspected or not. All of the aforementioned preparation of the measurement sample and analysis of the specimen take place in vitro.
- The present invention will be further detailed below, while referring to Examples, to which the present invention is however not limited.
- The white blood cell in the blood specimen was classified into the subpopulations by the method for analyzing blood cells of this embodiment, with use of various fluorescent dyes which can be excited by the light of the first wavelength (315 nm or longer and 600 nm or shorter). Also results of the classification of white blood cell were compared with those from the prior method.
- Whole blood (peripheral blood) was collected from a plurality of subjects, with use of an EDTA-2K blood collection tube, and stored at room temperature (25 ± 2°C). The whole blood was fractionated from the blood collection tube, to be used as each blood specimen. From among the blood specimens, those determined to contain 2% or more of immature granulocyte and 2% or more of reticulocytes, by analysis with an automated hematology analyzer XR-20 (Sysmex Corporation), were used in Example 1.
- Lysercell (registered trademark) WDF II (Sysmex Corporation) was used as the hemolysis reagent. Each staining reagent was prepared by dissolving each of various fluorescent dyes in a special-grade ethylene glycol (1 L). The fluorescent dyes used herein were
- 3-ethyl-2-[(3-ethyl-2-benzothiazolinylidene)methyl]benzothiazolium, 1,3,3-trimethyl-2-[(3-methyl-2-benzoxazolinylidene)methyl]-3H-indolium, 3-ethyl-2-[(3-ethyl-2-benzothiazolinylidene)methyl]benzoxazolium, 3-ethyl-2-[(3-ethyl-6-methyl-2-benzothiazolinylidene)methyl]-6-methyl-benzothiazolium, and
- 3-ethyl-6-methyl-2-[(3-ethyl-6-methyl-2-benzothiazolinylidene)methyl]benzothiazolium. Fluorocell (registered trademark) WDF (Sysmex Corporation) was used for comparison. Fluorocell WDF is a staining reagent that contains a fluorescent dye excited by the light of the second wavelength (610 nm or longer and 750 nm or shorter). The measurement sample prepared with use of Fluorocell WDF and Lysercell WDF II is also referred to as "Comparative Example 1", hereinafter.
- A prototype, modified from a flow cytometer XF-1600 (Sysmex Corporation) was used as the analyzer. The prototype was fabricated as follows. The original XF-1600 has been equipped with three semiconductor laser light sources that emit blue-violet (405 nm) light, blue light (488 nm) and red (639 nm) light, detectors for scattered light of the individual colors, and detectors for fluorescence excited by lights of the individual colors. The XF-1600 was then modified, by detaching the semiconductor laser light source that emits blue (488 nm) light, to an FCM system having two semiconductor laser light sources. The prototype has the hardware design illustrated in
Figs. 1 to 3 , and an FCM detector has a structure illustrated inFig. 4 . For the measurement of Comparative Example 1, an automated hematology analyzer XR-20 (Sysmex Corporation) was used. XR-20 has been equipped with a semiconductor laser light source that emits red (639 nm) light, a detector for red forward-scattered light, a detector for red side-scattered light, and a detector for fluorescence (660 nm or longer) excited by the red light. - The preparation and measurement of the measurement sample were implemented according to a manual attached to XF-1600, except that the aforementioned staining reagents were used. The measurement sample was prepared by mixing 1000 µL of Lysercell (registered trademark) WDF II, 17 µL of whole blood, and 0.5 to 2 µL of each staining reagent. The final concentration of each fluorescent dye in the measurement sample was 0.1 to 0.5 ppm. The measurement sample was measured after incubation at 41°C for 25 seconds. Data was analyzed with the aid of software installed on the analyzer. In Comparative Example 1, XR-20 (Sysmex Corporation) was used for the measurement, and XR-WDF channel was used for the analysis.
- The individual measurement samples were measured with the analyzer, to acquire the fluorescence information, the first scattered light information, and the second scattered light information. The fluorescence information corresponded to the fluorescence intensity, obtained by irradiating the particles in the measurement sample with a blue-violet laser (also referred to as "fluorescence intensity (blue-violet)" or "V-SFL", hereinafter). In Comparative Example 1, the fluorescence intensity, obtained by irradiating the particles in the measurement sample with a red laser (also referred to as "fluorescence intensity (red)" or "R-SFL", hereinafter), was acquired as the fluorescence information. The first scattered light information corresponded to the side-scattered light intensity, obtained by irradiating the particles in the measurement sample with a blue-violet laser (also referred to as "side-scattered light intensity (blue-violet)" or "V-SSC", hereinafter). The second scattered light information was the side-scattered light intensity obtained by irradiating the particles in the measurement sample with a red laser (also referred to as "side-scattered light intensity (red)" or "R-SSC", hereinafter).
- Scattergrams were created for the individual measurement samples, with the side-scattered light intensity (blue-violet) plotted on the abscissa, and with the fluorescence intensity (blue-violet) plotted on the ordinate (also referred to as "first scattergram (a)", hereinafter). Also scattergrams were created for the individual measurement samples, with the side-scattered light intensity (red) plotted on the abscissa, and with the fluorescence intensity (blue-violet) plotted on the ordinate (also referred to as "first scattergram (b)", hereinafter). In Comparative Example 1, a scattergram was created with the side-scattered light intensity (red) plotted on the abscissa, and with the fluorescence intensity (red) plotted on the ordinate. The individual scattergrams are illustrated in
Figs. 18 and19 . Note that the analysis result of Comparative Example 1 corresponds to the classification result of white blood cell by a prior method. InFig. 18 , "Lymp" stands for lymphocyte, "Mono" for monocyte, "Neut" for neutrophil, "Eo" for eosinophil, "Baso" for basophil, and "IG" for immature granulocyte. - Referring now to
Fig. 18 , the scattergram of Comparative Example 1 demonstrated that white blood cell was classified into five subpopulations of lymphocyte, monocyte, neutrophil, eosinophil, and basophil. Also a population of immature granulocyte was observed in an area where the fluorescence intensity is higher than that of the neutrophil population. Referring now toFigs. 18 and19 , white blood cell was classified into five subpopulations on the first scattergrams (a) and (b), when analyzed with use of any of the aforementioned fluorescent dyes. In any of all scattergrams, the immature granulocyte population was observed in an area where the fluorescence intensity is higher than that of the neutrophil population, and the side-scattered light intensity is higher than that in the monocyte population. As can be seen, the method for analyzing blood cells of this embodiment was proved to classify white blood cell, similarly to the prior method. The method was also proved to count white blood cell and the individual subpopulations, by counting the particles contained in each of the thus classified population. - Reticulocyte and platelet in the blood specimen were classified by the method for analyzing blood cells of this embodiment, with use of various fluorescent dyes which can be excited by the light of the first wavelength. Also results of the classification of reticulocyte and platelet were compared with those from the prior method.
- In Example 2, the same blood specimen as in Example 1 was used. CELLPACK (registered trademark) DFL (Sysmex Corporation) was used as the dilution reagent. The staining reagent was prepared in the same manner as in Example 1. The fluorescent dyes used herein were the same as in Example 1. Fluorocell (registered trademark) RET (Sysmex Corporation) and Fluorocell (registered trademark) PLT (Sysmex Corporation) were used for comparison. Fluorocell RET and Fluorocell PLT are staining reagents each containing a fluorescent dye excited by the light of the second wavelength (610 nm or longer and 750 nm or shorter). The measurement sample prepared with use of Fluorocell RET and CELLPACK DFL is also referred to as "Comparative Example 2", hereinafter. The measurement sample prepared with use of Fluorocell PLT and CELLPACK DFL is also referred to as "Comparative Example 3", hereinafter.
- A prototype, modified from XF-1600 (Sysmex Corporation) was used as the analyzer, similarly to as in Example 1. Meanwhile, XR-20 (Sysmex Corporation) was used for the measurement in Comparative Examples 2 and 3. The preparation and measurement of the measurement sample were implemented according to a manual attached to XF-1600, except that CELLPACK DFL and the aforementioned staining reagents were used. The measurement sample was prepared by mixing 1000 µL of CELLPACK DFL, 17 µL of whole blood, and 20 µL of the staining reagent. The final concentration of each fluorescent dye in the measurement sample was 51.25 ppm. The measurement sample was measured after incubation at 41°C for 30 seconds.
- The individual measurement samples were measured with the analyzer, to acquire the fluorescence information, and the third scattered light information. The fluorescence information corresponds to the fluorescence intensity (blue-violet). The fluorescence intensity (red) was obtained, for Comparative Examples 2 and 3. The third scattered light information corresponds to the forward-scattered light intensity, obtained by irradiating the particles in the measurement sample with a red laser (also referred to as "forward-scattered light intensity (red)" or "R-FSC", hereinafter). The scattergrams were created for the individual measurement samples, with the fluorescence intensity (blue-violet) plotted on the abscissa, and the forward-scattered light intensity (red) plotted on the ordinate (also referred to as "second scattergram", hereinafter). The second scattergrams were created in two ways, in linear scale and in logarithmic scale. The individual scattergrams are illustrated in
Figs. 20 and21 . Analysis result of Comparative Example 2 corresponds to the classification result of reticulocyte by the prior method, meanwhile analysis result of Comparative Example 3 corresponds to the classification result of platelet by the prior method. - Referring now to
Fig. 20 , the scattergram of Comparative Example 2 demonstrated the mature red blood cell population appeared in an area where R-SFL is low and R-FSC is high. The reticulocyte population appeared in an area where R-SFL is higher than that of the mature red blood cell population. The platelet population appeared in an area where R-FSC is low. As can be seen, mature red blood cell, reticulocyte, and platelet were clearly classified on the scattergram of Comparative Example 2. Referring now toFigs. 20 and21 , mature red blood cell, reticulocyte, and platelet were clearly classified on the second scattergrams in a linear scale, when analyzed with use of any of the aforementioned fluorescent dyes. Hence, the method for analyzing blood cells of this embodiment was proved to classify mature red blood cell and reticulocyte, similarly to the prior method. - Referring now to
Fig. 20 , the scattergram of Comparative Example 3 demonstrated the platelet population appeared in an area where R-FSC and R-SFL are low. As can be seen, platelet was clearly classified from the particles in the measurement sample, on the scattergram of Comparative Example 3. Referring now toFigs. 20 and21 , the populations of mature red blood cell and reticulocyte appeared in areas where R-FSC is high on the second scattergrams in a logarithmic scale, when analyzed with use of any of the aforementioned fluorescent dyes. The platelet population appeared in an area where R-FSC is lower than that of the populations of mature red blood cell and reticulocyte. The populations of mature red blood cell and the reticulocyte were clearly distinguishable from the platelet population. As can be seen, the method for analyzing blood cells of this embodiment was proved to classify platelet, similarly to the prior method.
Claims (19)
- A method for analyzing blood cells, the method comprising:irradiating a measurement sample that contains particles stained with a fluorescent dye with at least one light, to acquire fluorescence information and scattered light information generated from the particle; andclassifying blood cells from the particles in the measurement sample, with reference to the fluorescence information and the scattered light information,the fluorescent dye being represented by formula (I) below:
 each of R3 and R4, identically or differently, is a hydrogen atom, a halogen, an alkyl group having 1 to 18 carbon atoms, a phenyl group optionally having a substituent, an alkoxy group having 1 to 6 carbon atoms, or -(CH2)m-O-R8;R5 is a hydrogen atom, a halogen, an alkyl group having 1 to 6 carbon atoms, an alkyl group having 1 to 6 carbon atoms and a hydroxy group, an alkyl group having 1 to 6 carbon atoms and a carboxy group, an alkyl group having 1 to 6 carbon atoms and a sulfo group, a phenyl group optionally having a substituent, a benzyl group optionally having a substituent, or -(CH2)n-O-R6;each of R6 and R7, identically or differently, is a hydrogen atom or an alkyl group having 1 to 18 carbon atoms;R8 is a hydrogen atom, an alkyl group having 1 to 18 carbon atoms, or a phenyl group optionally having a substituent;m is an integer of 1 to 18, and n is an integer of 1 to 6;each of X and Y, identically or differently, is a sulfur atom, an oxygen atom, a selenium atom, or CR9R10;each of R9 and R10, identically or differently, is an alkyl group having 1 to 3 carbon atoms; andZ- is a counter ion).
 - The method according to claim 1, wherein in formula (I) above, with either X or Y given by an oxygen atom, the other is a sulfur atom, a selenium atom, or C(CH3)2.
- The method according to claim 1 or 2, wherein the fluorescent dye is at least one selected from the group consisting of 3-ethyl-2-[(3-ethyl-2-benzothiazolinylidene)methyl] benzothiazolium, 3-ethyl-2-[(3-ethyl-6-methyl-2-benzothiazolinylidene)methyl]-6-methyl-benzothiazolium, 3-ethyl-2-[(3-ethyl-2-benzothiazolinylidene)methyl]benzoxazolium, 3-ethyl-6-methyl-2-[(3-ethyl-6-methyl-2-benzothiazolinylidene)methyl]benzothiazolium, 3-methyl-2-[(1,3,3-trimethyl-2-indolinylidene)methyl]benzothiazolium, and 1,3,3-trimethyl-2-[(3-methyl-2-benzoxazolinylidene)methyl]-3H-indolium.
- The method according to any of claims 1 to 3, wherein the measurement sample is prepared by mixing the fluorescent dye, a hemolysis reagent, and whole blood, and
in the step of classifying, white blood cell in the measurement sample is classified into subpopulations. - The method according to claim 4, wherein the at least one light is a light of a first wavelength from 315 nm or longer and 600 nm or shorter,the fluorescence information is information related to fluorescence generated from the fluorescent dye on the particles upon irradiation of the measurement sample with the light of the first wavelength, andthe scattered light information is information related to side-scattered light generated from the particles upon irradiation of the measurement sample with the light of the first wavelength.
- The method according to claim 4, wherein the at least one light is a light of a first wavelength from 315 nm or longer and 600 nm or shorter, and a light of a second wavelength from 610 nm or longer and 750 nm or shorter,the fluorescence information is information related to fluorescence generated from the fluorescent dye on the particles upon irradiation of the measurement sample with the light of the first wavelength, andthe scattered light information is information related to side-scattered light generated from the particles upon irradiation of the measurement sample with the light of the first wavelength,and information related to side-scattered light generated from the particles upon irradiation of the measurement sample with the light of the second wavelength.
- The method according to claim 5 or 6, wherein the fluorescence information is fluorescence intensity, and the scattered light information is side-scattered light intensity, and
in the step of classifying, white blood cell in the measurement sample is classified into subpopulations, with reference to the fluorescence intensity and the side-scattered light intensity. - The method according to claim 7, wherein a scattergram is created with reference to the fluorescence intensity and the side-scattered light intensity, and the white blood cell is classified into subpopulations.
- The method according to claim 8, wherein the subpopulations comprise lymphocyte population, monocyte population, and granulocyte population.
- The method according to claim 8, wherein the subpopulations comprise lymphocyte population, monocyte population, neutrophil population, eosinophil population, and basophil population.
- The method according to any of claims 1 to 3, wherein the measurement sample is prepared by mixing the fluorescent dye, a dilution reagent, and whole blood, and
in the step of classifying, reticulocyte and platelet are classified from the particles in the measurement sample. - The method according to claim 11, wherein the measurement sample is free of a hemolysis reagent.
- The method according to claim 11 or 12, wherein the at least one light is a light of a first wavelength from 315 nm or longer and 600 nm or shorter, and a light of a second wavelength from 610 nm or longer and 750 nm or shorter,the fluorescence information is information related to fluorescence generated from the fluorescent dye on the particles upon irradiation of the measurement sample with the light of the first wavelength, andthe scattered light information is information related to forward-scattered light generated from the particles upon irradiation of the measurement sample with the light of the second wavelength.
- The method according to claim 13, wherein the fluorescence information is fluorescence intensity, and the scattered light information is forward-scattered light intensity, and
in the step of classifying, the particles in the measurement sample are classified into reticulocyte, platelet, and mature red blood cell, with reference to the fluorescence intensity and the forward-scattered light intensity. - The method according to claim 14, wherein a scattergram is created with reference to the fluorescence intensity and the forward-scattered light intensity, and the particles in the measurement sample are classified into reticulocyte population, platelet population, and mature red blood cell population, on the scattergram.
- The method according to any of claims 1 to 15, wherein the first wavelength is 315 nm or longer and 490 nm or shorter.
- A reagent for blood cell analysis, comprising the fluorescent dye represented by formula (I) above, for use in the method according to any of claims 1 to 16.
- A reagent kit for blood cell analysis, comprising a staining reagent that contains the fluorescent dye represented by formula (I) above, and a hemolysis reagent, and for use in the method according to any of claims 1 to 16..
- A method for fluorescently staining blood cells, the method comprising contacting a fluorescent dye with the blood cells, the fluorescent dye being represented by formula (I) below:
 each of R3 and R4, identically or differently, is a hydrogen atom, a halogen, an alkyl group having 1 to 18 carbon atoms, a phenyl group optionally having a substituent, an alkoxy group having 1 to 6 carbon atoms, or -(CH2)m-O-R8;R5 is a hydrogen atom, a halogen, an alkyl group having 1 to 6 carbon atoms, an alkyl group having 1 to 6 carbon atoms and a hydroxy group, an alkyl group having 1 to 6 carbon atoms and a carboxy group, an alkyl group having 1 to 6 carbon atoms and a sulfo group, a phenyl group optionally having a substituent, a benzyl group optionally having a substituent, or -(CH2)n-O-R6;each of R6 and R7, identically or differently, is a hydrogen atom, or an alkyl group having 1 to 18 carbon atoms;R8 is a hydrogen atom, an alkyl group having 1 to 18 carbon atoms, or a phenyl group optionally having a substituent;m is an integer of 1 to 18, and n is an integer of 1 to 6;each of X and Y, identically or differently, is a sulfur atom, an oxygen atom, a selenium atom, or CR9R10;each of R9 and R10, identically or differently, is an alkyl group having 1 to 3 carbon atoms; andZ- is a counter ion).
Applications Claiming Priority (3)
| Application Number | Priority Date | Filing Date | Title |
|---|---|---|---|
| JP2023113309A JP2025010969A (en) | 2023-07-10 | 2023-07-10 | Method for detecting platelet aggregation |
| JP2023113311A JP2025010970A (en) | 2023-07-10 | 2023-07-10 | Blood cell analysis method, blood cell analysis reagent, blood cell analysis reagent kit, and method for fluorescent staining of blood cells |
| JP2023113305A JP2025010968A (en) | 2023-07-10 | 2023-07-10 | Blood cell analysis method and blood cell analysis reagent |
Publications (1)
| Publication Number | Publication Date |
|---|---|
| EP4491675A1 true EP4491675A1 (en) | 2025-01-15 |
Family
ID=91853515
Family Applications (3)
| Application Number | Title | Priority Date | Filing Date |
|---|---|---|---|
| EP24186805.8A Pending EP4491675A1 (en) | 2023-07-10 | 2024-07-05 | Method for analyzing blood cells, reagent for blood cell analysis, reagent kit for blood cell analysis, and method for fluorescently staining blood cells |
| EP24186808.2A Pending EP4492037A1 (en) | 2023-07-10 | 2024-07-05 | Method for detecting platelet aggregation |
| EP24186810.8A Pending EP4492038A1 (en) | 2023-07-10 | 2024-07-05 | Method for analyzing blood cells and reagent for blood cell analysis |
Family Applications After (2)
| Application Number | Title | Priority Date | Filing Date |
|---|---|---|---|
| EP24186808.2A Pending EP4492037A1 (en) | 2023-07-10 | 2024-07-05 | Method for detecting platelet aggregation |
| EP24186810.8A Pending EP4492038A1 (en) | 2023-07-10 | 2024-07-05 | Method for analyzing blood cells and reagent for blood cell analysis |
Country Status (3)
| Country | Link |
|---|---|
| US (3) | US20250020573A1 (en) |
| EP (3) | EP4491675A1 (en) |
| CN (3) | CN119290715A (en) |
Citations (5)
| Publication number | Priority date | Publication date | Assignee | Title |
|---|---|---|---|---|
| CN87107216A (en) * | 1986-10-31 | 1988-05-11 | 史密丝克莱恩贝克曼公司 | Viable cell labelling |
| EP2166353A1 (en) * | 2007-06-25 | 2010-03-24 | Sysmex Corporation | Reagent and reagent kit for analysis of primitive leukocyte |
| JP4474135B2 (en) | 2002-09-10 | 2010-06-02 | シスメックス株式会社 | Method and apparatus for measuring reticulocyte |
| CN114317673A (en) * | 2020-09-29 | 2022-04-12 | 深圳市帝迈生物技术有限公司 | Reagents for sorting nucleated red blood cells, basophils and other white blood cells |
| WO2022100717A1 (en) | 2020-11-13 | 2022-05-19 | 大连理工大学 | Leukocyte classification reagent, erythrocyte analysis reagent, kits, and analysis method |
Family Cites Families (8)
| Publication number | Priority date | Publication date | Assignee | Title |
|---|---|---|---|---|
| JPS5994037A (en) * | 1982-11-19 | 1984-05-30 | Shimadzu Corp | Apparatus for counting corpuscle |
| JP2941041B2 (en) * | 1990-11-16 | 1999-08-25 | シスメックス株式会社 | Classification of leukocytes by flow cytometry |
| JP4484375B2 (en) * | 2001-01-10 | 2010-06-16 | シスメックス株式会社 | Abnormal cell detection method |
| JP4976038B2 (en) * | 2006-03-29 | 2012-07-18 | シスメックス株式会社 | Method for measuring hematological samples |
| JP6352750B2 (en) * | 2014-09-26 | 2018-07-04 | シスメックス株式会社 | Blood analyzer and blood analysis method |
| EP3644041B1 (en) | 2017-06-20 | 2022-11-02 | Shenzhen Mindray Bio-Medical Electronics Co., Ltd. | Method and device for identifying platelet aggregation, and cell analyzer |
| WO2019206298A1 (en) | 2018-04-28 | 2019-10-31 | 深圳迈瑞生物医疗电子股份有限公司 | Reagent, method for analyzing platelets and blood cell analyzer |
| CN114252386A (en) * | 2020-09-23 | 2022-03-29 | 深圳迈瑞生物医疗电子股份有限公司 | Sample detection method and sample analyzer |
-
2024
- 2024-07-05 EP EP24186805.8A patent/EP4491675A1/en active Pending
- 2024-07-05 EP EP24186808.2A patent/EP4492037A1/en active Pending
- 2024-07-05 EP EP24186810.8A patent/EP4492038A1/en active Pending
- 2024-07-08 CN CN202410906598.4A patent/CN119290715A/en active Pending
- 2024-07-08 CN CN202410905786.5A patent/CN119286970A/en active Pending
- 2024-07-08 CN CN202410905789.9A patent/CN119290826A/en active Pending
- 2024-07-09 US US18/766,842 patent/US20250020573A1/en active Pending
- 2024-07-09 US US18/766,916 patent/US20250027878A1/en active Pending
- 2024-07-09 US US18/766,805 patent/US20250027933A1/en active Pending
Patent Citations (5)
| Publication number | Priority date | Publication date | Assignee | Title |
|---|---|---|---|---|
| CN87107216A (en) * | 1986-10-31 | 1988-05-11 | 史密丝克莱恩贝克曼公司 | Viable cell labelling |
| JP4474135B2 (en) | 2002-09-10 | 2010-06-02 | シスメックス株式会社 | Method and apparatus for measuring reticulocyte |
| EP2166353A1 (en) * | 2007-06-25 | 2010-03-24 | Sysmex Corporation | Reagent and reagent kit for analysis of primitive leukocyte |
| CN114317673A (en) * | 2020-09-29 | 2022-04-12 | 深圳市帝迈生物技术有限公司 | Reagents for sorting nucleated red blood cells, basophils and other white blood cells |
| WO2022100717A1 (en) | 2020-11-13 | 2022-05-19 | 大连理工大学 | Leukocyte classification reagent, erythrocyte analysis reagent, kits, and analysis method |
Also Published As
| Publication number | Publication date |
|---|---|
| US20250027933A1 (en) | 2025-01-23 |
| CN119286970A (en) | 2025-01-10 |
| EP4492037A1 (en) | 2025-01-15 |
| CN119290826A (en) | 2025-01-10 |
| US20250020573A1 (en) | 2025-01-16 |
| EP4492038A1 (en) | 2025-01-15 |
| US20250027878A1 (en) | 2025-01-23 |
| CN119290715A (en) | 2025-01-10 |
Similar Documents
| Publication | Publication Date | Title |
|---|---|---|
| US7892841B2 (en) | Method and apparatus for measuring hematological sample | |
| US9267931B2 (en) | Method for discriminating red blood cells from white blood cells by using forward scattering from a laser in an automated hematology analyzer | |
| EP1412740B1 (en) | Method for measurement of nucleated red blood cells | |
| EP0485945B1 (en) | Method of classifying leukocytes by flow cytometry | |
| US9797824B2 (en) | Method for hematology analysis | |
| EP3654014B1 (en) | Bone marrow fluid analysis method, sample analyzer, and non-transitory storage medium | |
| JPH0534251A (en) | Method for preparing sample for classifying and counting leucocyte | |
| JP2005506525A5 (en) | ||
| JP2004537727A5 (en) | ||
| JP2004537727A (en) | Analysis of nucleated red blood cells in blood samples | |
| US20240219391A1 (en) | Bone marrow aspirate analysis method, sample analyzer, and computer program | |
| US20250027878A1 (en) | Method for analyzing blood cells, reagent for blood cell analysis, reagent kit for blood cell analysis, and method for fluorescently staining blood cells | |
| JP2025010970A (en) | Blood cell analysis method, blood cell analysis reagent, blood cell analysis reagent kit, and method for fluorescent staining of blood cells | |
| EP4439042B1 (en) | Method for analyzing specimen | |
| JP2025010968A (en) | Blood cell analysis method and blood cell analysis reagent | |
| US20240329036A1 (en) | Blood cell analysis method | |
| JP2025010969A (en) | Method for detecting platelet aggregation | |
| JP2024146252A (en) | Blood cell analysis method and blood cell analysis reagent | |
| WO2026070927A1 (en) | Measurement device, reagent, and analysis method |
Legal Events
| Date | Code | Title | Description |
|---|---|---|---|
| PUAI | Public reference made under article 153(3) epc to a published international application that has entered the european phase |
Free format text: ORIGINAL CODE: 0009012 |
|
| STAA | Information on the status of an ep patent application or granted ep patent |
Free format text: STATUS: THE APPLICATION HAS BEEN PUBLISHED |
|
| AK | Designated contracting states |
Kind code of ref document: A1 Designated state(s): AL AT BE BG CH CY CZ DE DK EE ES FI FR GB GR HR HU IE IS IT LI LT LU LV MC ME MK MT NL NO PL PT RO RS SE SI SK SM TR |
|
| STAA | Information on the status of an ep patent application or granted ep patent |
Free format text: STATUS: REQUEST FOR EXAMINATION WAS MADE |
|
| 17P | Request for examination filed |
Effective date: 20250402 |