EP4491132A1 - Program, information processing method, and information processing apparatus - Google Patents
Program, information processing method, and information processing apparatus Download PDFInfo
- Publication number
- EP4491132A1 EP4491132A1 EP23779237.9A EP23779237A EP4491132A1 EP 4491132 A1 EP4491132 A1 EP 4491132A1 EP 23779237 A EP23779237 A EP 23779237A EP 4491132 A1 EP4491132 A1 EP 4491132A1
- Authority
- EP
- European Patent Office
- Prior art keywords
- renal status
- status index
- urine
- urinary
- renal
- Prior art date
- Legal status (The legal status is an assumption and is not a legal conclusion. Google has not performed a legal analysis and makes no representation as to the accuracy of the status listed.)
- Pending
Links
Images







Classifications
-
- G—PHYSICS
- G16—INFORMATION AND COMMUNICATION TECHNOLOGY [ICT] SPECIALLY ADAPTED FOR SPECIFIC APPLICATION FIELDS
- G16H—HEALTHCARE INFORMATICS, i.e. INFORMATION AND COMMUNICATION TECHNOLOGY [ICT] SPECIALLY ADAPTED FOR THE HANDLING OR PROCESSING OF MEDICAL OR HEALTHCARE DATA
- G16H50/00—ICT specially adapted for medical diagnosis, medical simulation or medical data mining; ICT specially adapted for detecting, monitoring or modelling epidemics or pandemics
- G16H50/30—ICT specially adapted for medical diagnosis, medical simulation or medical data mining; ICT specially adapted for detecting, monitoring or modelling epidemics or pandemics for calculating health indices; for individual health risk assessment
-
- A—HUMAN NECESSITIES
- A61—MEDICAL OR VETERINARY SCIENCE; HYGIENE
- A61B—DIAGNOSIS; SURGERY; IDENTIFICATION
- A61B5/00—Measuring for diagnostic purposes; Identification of persons
-
- A—HUMAN NECESSITIES
- A61—MEDICAL OR VETERINARY SCIENCE; HYGIENE
- A61B—DIAGNOSIS; SURGERY; IDENTIFICATION
- A61B5/00—Measuring for diagnostic purposes; Identification of persons
- A61B5/02—Detecting, measuring or recording for evaluating the cardiovascular system, e.g. pulse, heart rate, blood pressure or blood flow
- A61B5/0205—Simultaneously evaluating both cardiovascular conditions and different types of body conditions, e.g. heart and respiratory condition
-
- A—HUMAN NECESSITIES
- A61—MEDICAL OR VETERINARY SCIENCE; HYGIENE
- A61B—DIAGNOSIS; SURGERY; IDENTIFICATION
- A61B5/00—Measuring for diagnostic purposes; Identification of persons
- A61B5/02—Detecting, measuring or recording for evaluating the cardiovascular system, e.g. pulse, heart rate, blood pressure or blood flow
- A61B5/026—Measuring blood flow
-
- A—HUMAN NECESSITIES
- A61—MEDICAL OR VETERINARY SCIENCE; HYGIENE
- A61B—DIAGNOSIS; SURGERY; IDENTIFICATION
- A61B5/00—Measuring for diagnostic purposes; Identification of persons
- A61B5/145—Measuring characteristics of blood in vivo, e.g. gas concentration or pH-value ; Measuring characteristics of body fluids or tissues, e.g. interstitial fluid or cerebral tissue
-
- A—HUMAN NECESSITIES
- A61—MEDICAL OR VETERINARY SCIENCE; HYGIENE
- A61B—DIAGNOSIS; SURGERY; IDENTIFICATION
- A61B5/00—Measuring for diagnostic purposes; Identification of persons
- A61B5/145—Measuring characteristics of blood in vivo, e.g. gas concentration or pH-value ; Measuring characteristics of body fluids or tissues, e.g. interstitial fluid or cerebral tissue
- A61B5/1455—Measuring characteristics of blood in vivo, e.g. gas concentration or pH-value ; Measuring characteristics of body fluids or tissues, e.g. interstitial fluid or cerebral tissue using optical sensors, e.g. spectral photometrical oximeters
- A61B5/14551—Measuring characteristics of blood in vivo, e.g. gas concentration or pH-value ; Measuring characteristics of body fluids or tissues, e.g. interstitial fluid or cerebral tissue using optical sensors, e.g. spectral photometrical oximeters for measuring blood gases
-
- A—HUMAN NECESSITIES
- A61—MEDICAL OR VETERINARY SCIENCE; HYGIENE
- A61B—DIAGNOSIS; SURGERY; IDENTIFICATION
- A61B5/00—Measuring for diagnostic purposes; Identification of persons
- A61B5/20—Measuring for diagnostic purposes; Identification of persons for measuring urological functions restricted to the evaluation of the urinary system
-
- A—HUMAN NECESSITIES
- A61—MEDICAL OR VETERINARY SCIENCE; HYGIENE
- A61B—DIAGNOSIS; SURGERY; IDENTIFICATION
- A61B5/00—Measuring for diagnostic purposes; Identification of persons
- A61B5/20—Measuring for diagnostic purposes; Identification of persons for measuring urological functions restricted to the evaluation of the urinary system
- A61B5/201—Assessing renal or kidney functions
-
- G—PHYSICS
- G16—INFORMATION AND COMMUNICATION TECHNOLOGY [ICT] SPECIALLY ADAPTED FOR SPECIFIC APPLICATION FIELDS
- G16H—HEALTHCARE INFORMATICS, i.e. INFORMATION AND COMMUNICATION TECHNOLOGY [ICT] SPECIALLY ADAPTED FOR THE HANDLING OR PROCESSING OF MEDICAL OR HEALTHCARE DATA
- G16H10/00—ICT specially adapted for the handling or processing of patient-related medical or healthcare data
- G16H10/40—ICT specially adapted for the handling or processing of patient-related medical or healthcare data for data related to laboratory analysis, e.g. patient specimen analysis
-
- A—HUMAN NECESSITIES
- A61—MEDICAL OR VETERINARY SCIENCE; HYGIENE
- A61B—DIAGNOSIS; SURGERY; IDENTIFICATION
- A61B5/00—Measuring for diagnostic purposes; Identification of persons
- A61B5/20—Measuring for diagnostic purposes; Identification of persons for measuring urological functions restricted to the evaluation of the urinary system
- A61B5/207—Sensing devices adapted to collect urine
- A61B5/208—Sensing devices adapted to collect urine adapted to determine urine quantity, e.g. flow, volume
-
- A—HUMAN NECESSITIES
- A61—MEDICAL OR VETERINARY SCIENCE; HYGIENE
- A61B—DIAGNOSIS; SURGERY; IDENTIFICATION
- A61B5/00—Measuring for diagnostic purposes; Identification of persons
- A61B5/48—Other medical applications
- A61B5/4836—Diagnosis combined with treatment in closed-loop systems or methods
- A61B5/4839—Diagnosis combined with treatment in closed-loop systems or methods combined with drug delivery
Definitions
- the present invention relates to a program, an information processing method, and an information processing apparatus.
- a catheter for measurement of urinary oxygen tension in a bladder has been proposed in which a urinary catheter body and a probe that is inserted into the bladder through a urinary catheter to measure the urinary oxygen tension in the bladder are combined (Patent Literature 1).
- Patent Literature 1 JP 2021-62073 A
- the urinary oxygen tension measured by the catheter of Patent Literature 1 is one of parameters indicating a status of kidneys.
- a medical worker such as a physician or a nurse comprehensively judges urinary oxygen tension and vital sign data of blood pressure or the like to grasp a status of kidneys of a patient.
- an object is to provide a program or the like that displays an index suitable for grasping a status of kidneys.
- a program causes a computer to execute processing of acquiring urine information including urinary oxygen tension, calculating a renal status index on the basis of the urine information, and outputting the renal status index.
- a status of kidneys is evaluated on the basis of an evaluation index such as a serum creatinine level, a creatinine clearance, a glomerular filtration rate (GFR), or a urine flow rate.
- an evaluation index such as a serum creatinine level, a creatinine clearance, a glomerular filtration rate (GFR), or a urine flow rate.
- the serum creatinine level changes after about one day to three days from a kidney disorder event.
- the creatinine clearance and the glomerular filtration rate are calculated by using the serum creatinine level, similarly to the serum creatinine level, a change in the creatinine clearance and the glomerular filtration rate occurs after one day to three days after the kidney disorder. It is known that the urine flow rate may not change even after a kidney disorder.
- a bladder-indwelling catheter is often used during whole body management in a surgery and in an ICU. Therefore, the urinary oxygen tension in the bladder can be measured in real time by using, for example, the catheter of Patent Literature 1 without increasing the degree of invasion into the patient.
- the present inventors measured changes in renal tissue oxygen tension, urinary oxygen tension, urine flow rates, and pulse pressures of pigs while changing concentration of Oxygen concentration in respiratory gas during anesthesia from the pigs.
- the pulse pressure is a difference between a systolic blood pressure and a diastolic blood pressure.
- the number of samples, that is, the number of pigs used, is six.
- a correlation coefficient r between the urinary oxygen tension and the renal tissue oxygen tension was calculated on the basis of data from the measurement, and the correlation coefficient r was 0.6581.
- the value of the calculated correlation coefficient r was equivalent to a correlation coefficient r in a prior art document, and it was confirmed that appropriate measurement was performed.
- Renal medulla is a type of renal tissue and is a portion located inside a kidney.
- renal medullary oxygen tension is an exemplification of renal tissue oxygen tension. It can be seen from Table 1 that the renal medullary oxygen tension, which is an objective variable, can be estimated with high accuracy by using a multiple regression equation that is calculated by using, as explanatory variables, three data of the urinary oxygen tension, urine flow rate, and pulse pressure.
- the renal medullary oxygen tension which is the objective variable, can be estimated with high accuracy that is equal to or more than accuracy of the multiple regression equation in which the urinary oxygen tension and the pulse pressure are used as explanatory variables.
- the urinary oxygen tension can be measured in real time by inserting the oxygen sensor into the bladder through the bladder-indwelling catheter as described above.
- the oxygen sensor may be disposed in a middle of the bladder-indwelling catheter, or in a middle between a terminal of the bladder-indwelling catheter and an opening of a urine bag connected by a tube from the terminal of the catheter.
- the urine flow rate can be measured in real time on the basis of, for example, a change in weight of the urine bag.
- the bladder-indwelling catheter may be provided with a flow sensor.
- a mode of the sensor for measuring the urine flow rate is not limited.
- the renal medullary oxygen tension greatly varies among individuals depending on the circulatory dynamics and management status of the patient. Therefore, it is appropriate to judge a sign of a change in renal medullary oxygen tension leading to acute kidney injury, on the basis of a change from an initial state, for example, at a start of surgery, at a time of entering the ICU, or the like, in addition to on the basis of an absolute value of the renal medullary oxygen tension.
- an index related to an estimated value of the renal medullary oxygen tension is displayed by using a relative value with an initial value at the start of surgery, at the time of entering the ICU, or the like, set to 100. That is, the display value is calculated by Mathematical Formula (1).
- Display value Real-time renal medullary oxygen tension
- the urinary oxygen tension and the urine flow rate are examples of urine information of the patient.
- the urine information may be, for example, a urinary output, urinary color, urine absorbance, a urinary sodium amount, a urinary potassium amount, or a urinary creatinine amount.
- the urinary output is a total amount of urine output from the bladder of the patient after the measurement is started and can be measured in real time on the basis of, for example, a weight of the urine bag.
- the urinary color and urine absorbance can be measured in real time by, for example, inserting an optical fiber connected to an optical measurement device, such as a spectrophotometer, into the bladder-indwelling catheter.
- the urinary creatinine amount can be measured by using an enzymatic method or absorbance.
- the urinary sodium amount and the urinary potassium amount can be measured in real time, for example, by using a fluorescent dye that specifically reacts in a system up to the bladder-indwelling catheter and the urine bag.
- the pulse pressure is an example of the circulatory dynamics information.
- the circulatory dynamics information may be, for example, a systolic blood pressure, a diastolic blood pressure, a mean blood pressure, a heart rate, and blood oxygen saturation.
- the mean blood pressure is a value calculated by diastolic blood pressure + (systolic blood pressure - diastolic blood pressure)/3.
- numerical processing of, for example, a moving average at a time of calculation, or adjustment of a calculation formula may be performed, and thus it is only required to use an equivalent value.
- the circulatory dynamics information can be tissue oxygen saturation of each part of a body.
- the tissue oxygen saturation of each part of a brain or body can be measured in real time in a minimally invasive manner, and is used in clinical practice as a hemodynamic monitor.
- the renal medullary oxygen tension is an example of a renal status index capable of quickly detecting a change in status of the kidneys.
- the renal status index may be, for example, an estimated value of renal artery blood flow.
- the estimated value of the renal artery blood flow is used, data for which the renal artery blood flow can be used as the objective variable in the above-described experiment is acquired, and a multiple regression analysis is performed.
- any index capable of detecting abnormality of the kidneys can be used.
- the multiple regression equation calculated by using the urinary oxygen tension and the urine flow rate as explanatory variables and by using the renal medullary oxygen tension as the objective variable as described in No. 1 in Table 1 is an example of an algorithm for calculating the renal status index on the basis of the urinary oxygen tension and the urine flow rate.
- the mean blood pressure, the pulse pressure, the heart rate, the renal artery blood flow, and the glomerular filtration rate can also be measured.
- the multiple regression equation can be calculated by using the urinary oxygen tension, the urine flow rate, the mean blood pressure, the pulse pressure, and the heart rate as the explanatory variables, and by using the renal artery blood flow rate as the objective variable.
- the multiple regression equation calculated in this manner is an example of an algorithm for calculating the renal status index related to the estimated value of the renal artery blood flow on the basis of the urinary oxygen tension, the urine flow rate, the mean blood pressure, the pulse pressure, and the heart rate.
- the multiple regression equation can be calculated with the same experimental data by using the urinary oxygen tension, the urine flow rate, the mean blood pressure, the pulse pressure, and the heart rate as the explanatory variables, and by using the renal medullary oxygen tension as the objective variable.
- the multiple regression equation calculated in this manner is an example of an algorithm for calculating the renal status index related to the estimated value of the renal tissue oxygen tension on the basis of the urinary oxygen tension, the urine flow rate, the mean blood pressure, the pulse pressure, and the heart rate.
- the multiple regression equation can be calculated by using the urinary oxygen tension and the urine flow rate as the explanatory variables, and by using the renal artery blood flow rate as the objective variable.
- the multiple regression equation calculated in this manner is an example of an algorithm for calculating the renal status index related to the estimated value of the renal artery blood flow on the basis of the urinary oxygen tension and the urine flow rate.
- a simple regression equation may be used.
- the simple regression equation can be calculated by using the urinary oxygen tension or the urine flow rate as the explanatory variables, and by using the renal artery blood flow rate as the objective variable.
- the simple regression equation calculated in this manner is an example of an algorithm for calculating the renal status index related to the estimated value of the renal artery blood flow on the basis of either the urinary oxygen tension or the urine flow rate.
- the multiple regression equation or the simple regression equation may be calculated by using the glomerular filtration rate instead of the renal artery blood flow.
- the multiple regression equation or simple regression equation calculated in this manner is an example of an algorithm for calculating the renal status index related to the estimated value of the glomerular filtration rate.
- an algorithm for calculating an arbitrary index can be generated by calculating the multiple regression equation using a combination of arbitrary measured parameters.
- a table showing a relationship between the explanatory variable and the objective variable on the basis of the multiple regression equation may be created and recorded in an auxiliary storage device 23 (refer to Fig. 1 ).
- the explanatory variables are two of the urinary oxygen tension and the urine flow rate
- the objective variable is the renal artery blood flow rate
- a three-dimensional table is created.
- a six-dimensional table is created in a case where the explanatory variables are five of the urinary oxygen tension, the urine flow rate, the mean blood pressure, the pulse pressure, and the heart rate, and where the objective variable is the renal medullary oxygen tension.
- a control unit 21 searches the table by using the explanatory variables measured in real time as keys, and acquires the objective variable.
- the control unit 21 may calculate the objective variable by performing interpolation between the parameters recorded in the table with a known method.
- the table is an example of an algorithm for calculating the objective variable on the basis of the explanatory variables.
- the renal status index is the renal medullary oxygen tension
- the renal medullary oxygen tension is estimated on the basis of the urinary oxygen tension, the urine flow rate, and the pulse pressure.
- Fig. 1 is an explanatory diagram describing a configuration of an information processing system 10.
- the information processing system 10 includes, for example, an information processing apparatus 20, a urine measurement device 31, the vital sign monitor 33, a syringe pump 34, an infusion pump 35, and an electronic medical record system 17 that are connected via a network such as a hospital information system (HIS).
- a hospital information system HIS
- the urine measurement device 31 measures and outputs urine information such as urinary oxygen tension and a urine flow rate by using a urine sensor 311.
- the vital sign monitor 33 is connected to various sensors (not illustrated), and measures and outputs the circulatory dynamics information such as blood pressure or pulse pressure.
- the urine measurement device 31 and the vital sign monitor 33 may be configured to be integrated with each other.
- the syringe pump 34 is used for drug administration to the patient.
- the infusion pump 35 is used for infusion administration to the patient.
- the infusion pump 35 may have a function of mixing a drug with infusion.
- a nurse or the like may administer a drug to the patient by using a syringe.
- the infusion pump 35 may not be connected to the network, and may be manually operated by the nurse or the like.
- the syringe pump 34 and the infusion pump 35 are examples of a drug administration device.
- the electronic medical record system 17 records patient information such as age, sex, height, weight, a biochemical test result, a medical history, or a course of ongoing treatment, of the patient.
- the course of ongoing treatment includes a type and amount of drug administered to the patient.
- the medical history includes the type and amount of the drug administered to the patient in a past surgery and treatment, a condition of the patient after the administration, and the like. Data such as a renal status index to be described later may be sequentially recorded in the electronic medical record system 17.
- the information processing apparatus 20 includes the control unit 21, a main storage device 22, the auxiliary storage device 23, a communication unit 24, a display unit 25, an input unit 26, and a bus.
- the control unit 21 is an arithmetic control device that executes a program of the present embodiment.
- CPUs central processing units
- GPUs graphics processing units
- TPUs tensor processing units
- the control unit 21 is connected to each of hardware components that constitute the information processing apparatus 20 via the bus.
- the main storage device 22 is a storage device such as a static random access memory (SRAM), a dynamic random access memory (DRAM), or a flash memory.
- SRAM static random access memory
- DRAM dynamic random access memory
- flash memory a storage device such as a static random access memory (SRAM), a dynamic random access memory (DRAM), or a flash memory.
- the main storage device 22 temporarily saves necessary information in the middle of processing performed by the control unit 21 and a program being executed by the control unit 21.
- the auxiliary storage device 23 is a storage device such as an SRAM, a flash memory, a hard disk, or a magnetic tape.
- the auxiliary storage device 23 saves a program to be executed by the control unit 21 and various kinds of data necessary for executing the program.
- the communication unit 24 is an interface that performs communication between the information processing apparatus 20 and a network.
- the display unit 25 is a liquid crystal display device, an organic electro-luminescence (EL) display device, or the like, for example.
- the input unit 26 is, for example, an input device such as a keyboard, a mouse, a trackball, or a microphone.
- the display unit 25 and the input unit 26 may be integrally stacked to constitute a touch panel.
- the information processing apparatus 20 of the present embodiment is an information device such as a general-purpose personal computer, tablet, smartphone, or server computer.
- the information processing apparatus 20 may be a large computer, a virtual machine operating on a large computer, a cloud computing system, a quantum computer, a plurality of personal computers that performs distributed processing, or the like.
- the information processing apparatus 20 may be configured to be integrated with, for example, the urine measurement device 31, the vital sign monitor 33, or the electronic medical record system 17.
- control unit 21 performs software processing
- various models may be implemented by dedicated hardware.
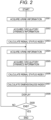
- FIG. 2 is a flowchart describing a flow of processing according to a program.
- a user such as a physician activates the program described with reference to Fig. 2 after attaching various sensors to a body of the patient who has entered a surgery room or the ICU.
- the control unit 21 acquires the urine information from the urine measurement device 31 (step S501).
- the control unit 21 acquires the circulatory dynamics information from the vital sign monitor 33 (step S502).
- the control unit 21 calculates the renal status index by substituting the urine information acquired in step S501 and the circulatory dynamics information acquired in step S502 into the multiple regression equation calculated in advance (step S503).
- the renal status index calculated in step S503 is an initial value of the renal status index.
- the control unit 21 acquires the urine information from the urine measurement device 31 (step S504).
- the control unit 21 acquires the circulatory dynamics information from the vital sign monitor 33 (step S505).
- the control unit 21 calculates the renal status index by substituting the urine information acquired in step S504 and the circulatory dynamics information acquired in step S505 into the multiple regression equation calculated in advance (step S506).
- the renal status index calculated in step S506 is a real-time renal status index.
- the control unit 21 calculates a dimensionless renal status index by multiplying a value, which is obtained by dividing the real-time renal status index acquired in step S506 by the initial value of the renal status index acquired in step S503, by 100 (step S507).
- a dimensionless index at a start of the measurement is 100. Note that in a case where the real-time renal status index exceeds the initial value, the dimensionless index is a value exceeding 100.
- the control unit 21 displays the calculated renal status index on the display unit 25 (step S508).
- the control unit 21 may output the renal status index to another device connected to an output device, such as the vital sign monitor 33 or the electronic medical record system 17.
- the control unit 21 determines whether or not to end the processing (step S509). For example, in a case where an end instruction is received from the user, the control unit 21 determines to end the processing.
- the control unit 21 may determine to end the processing when the urine information and the circulatory dynamics information cannot be acquired from the urine measurement device 31 and the vital sign monitor 33.
- control unit 21 determines not to end the processing (NO in step S509), the control unit 21 returns to step S504. If the control unit 21 determines to end the processing (YES in step S509), the control unit 21 ends the processing.
- Figs. 3 to 6 are examples of a screen.
- the control unit 21 displays the screens illustrated in Figs. 3 to 6 in step S508 of the program described with reference to Fig. 2 .
- the control unit 21 may display the screens illustrated in Figs. 3 to 6 on a display device disposed in, for example, a nurse station, or the like.
- the control unit 21 may receive selection of a screen to be displayed from the user.
- the screen illustrated in Fig. 3 has a renal status index field 72, a connection state field 71, a urinary oxygen tension field 731, a urine flow rate field 732, a mean blood pressure field 733, a heart rate field 734, and a patient information field 74.
- a menu button is disposed in the upper left of the screen, and an indicator indicating a state of charge of a battery is disposed in the upper right of the screen.
- a date, day of the week, time, air temperature, and atmospheric pressure are displayed to the right side of the menu button.
- the air temperature and the air pressure are acquired from, for example, a sensor module that is connected to the information processing apparatus 20 and is capable of acquiring temperature and atmospheric pressure.
- the air temperature and the air pressure may be acquired from a world wide web (WWW) site that provides weather information via a network.
- WWW world wide web
- the renal status index field 72 is disposed at the center of the screen, and the dimensionless index calculated in step S507 is displayed in real time.
- a renal status indicator 721 is disposed next to the renal status index field 72.
- the renal status indicator 721 has an inverted triangular shape, and illustrates the renal status index field 72 in three stages of, for example, less than 30%, 30% or more and less than 70%, and 70% or more.
- the urinary oxygen tension field 731 the urinary oxygen tension among the urine information acquired in step S501 is displayed.
- the urine flow rate field 732 the urine flow rate among the urine information acquired in step S501 is displayed.
- the mean blood pressure field 733 the mean blood pressure among the circulatory dynamics information acquired in step S502 is displayed.
- the heart rate field 734 the heart rate among the circulatory dynamics information acquired in step S502 is displayed.
- the patient information field 74 the patient information acquired from the electronic medical record system 17 is displayed.
- the patient weighs 54 kilograms, and is 167 centimeters tall, male, and 59 years old.
- an icon indicating the syringe pump 34 and an icon indicating the infusion pump 35 are displayed in the connection state field 71.
- the user can confirm that the syringe pump 34 and the infusion pump 35 are operating in a usable state.
- the control unit 21 may display only one icon indicating a syringe pump 34 or may display the same number of icons as the number of the connected syringe pumps 34.
- a renal status graph 75 is disposed to the right side of the renal status index field 72. Because the screen is similar to the screen in Fig. 3 other than the renal status graph 75, the description of the screen other than the renal status graph 75 is omitted.
- the horizontal axis of the renal status graph 75 represents time. The right end of the horizontal axis represents a current time.
- the vertical axis of the renal status graph 75 represents the dimensionless renal status index. The user can easily check a temporal change of the dimensionless index with the renal status graph 75.
- the renal status graph 75 is displayed such that a line graph extends toward the right side after the start of measurement.
- the control unit 21 scrolls the renal status graph 75 by one piece of data on the right side each time new data is acquired and displays latest data at the right end of the renal status graph 75.
- time may be displayed in a compressed manner to display all data.
- a range indicator 751 indicating a variation range of the renal status index is displayed at the left end of the renal status graph 75.
- the upper and lower ends of the thick portion of the range indicator 751 correspond to a maximum value and minimum value of the renal status index displayed in the renal status graph 75, respectively.
- Error bars indicating a calculation error of the renal status index are displayed above and below the range indicator 751. The user can easily grasp a variation range and error range of the renal status index with the range indicator 751.
- the urinary oxygen tension field 731, the urine flow rate field 732, the mean blood pressure field 733, the heart rate field 734, an arterial oxygen saturation field 735, and an inhaled oxygen concentration field 736 are arranged in tiles.
- a graph illustrating a temporal change in the urinary oxygen tension and a latest urinary oxygen tension are displayed.
- the horizontal axis represents the time
- the vertical axis represents the urinary oxygen tension.
- a graph illustrating a temporal change in the urine flow rate and a latest urine flow rate are displayed.
- the horizontal axis represents the time
- the vertical axis represents the urine flow rate.
- the mean blood pressure field 733 a graph illustrating a temporal change in the mean blood pressure and a latest mean blood pressure are displayed.
- the horizontal axis represents the time
- the vertical axis represents the mean blood pressure.
- the heart rate field 734 a graph illustrating a temporal change in the heart rate and a latest heart rate are displayed.
- the horizontal axis represents the time
- the vertical axis represents the heart rate.
- the arterial oxygen saturation field 735 a graph illustrating a temporal change in arterial oxygen saturation (saturation of percutaneous oxygen: SpO2) and a latest arterial oxygen saturation are displayed.
- the horizontal axis represents the time
- the vertical axis represents the arterial oxygen saturation.
- the inhaled oxygen concentration field 736 a graph illustrating a temporal change in inhaled oxygen concentration (fraction of inspiratory oxygen: FiO2) and a latest inhaled oxygen concentration are displayed.
- the horizontal axis represents the time
- the vertical axis represents the inhaled oxygen concentration.
- the inhaled oxygen concentration is calculated on the basis of a type of an oxygen administrator, such as a nasal cannula, a mask with a reservoir or a venturi mask, attached to the patient, and the oxygen flow rate.
- the inhaled oxygen concentration may be acquired from an anesthetic machine (not illustrated).
- the horizontal axes of the six types of graphs illustrated in Fig. 6 are all the same. Therefore, instead of arranging the six graphs in tiles, the six line graphs may be displayed in one graph.
- the graphs illustrated in Figs. 4 to 6 may be bar charts.
- the examples of screens described with reference to Figs. 3 to 6 are all examples.
- the control unit 21 may receive a change instruction from the user regarding items displayed on the screens and layout of each of the items.
- Fig. 7 is an example of a screen display.
- a condition selection field 761 is displayed on the left side of the screen
- a correlation graph field 762 is displayed on the right side of the screen.
- the horizontal axis of the graph illustrated in the correlation graph field 762 represents an item selected from "X-axis item” in the condition selection field 761.
- the vertical axis of the graph illustrated in the correlation graph field 762 represents an item selected from "Y-axis item” in the condition selection field 761.
- the control unit 21 plots data averaged over a time selected in "data average section" in the correlation graph field 762.
- An item selected in "calculation parameter” is displayed in an upper part of the correlation graph field 762.
- Fig. 7 an approximation formula obtained by approximating plotted data with a linear function and a Pearson's correlation coefficient are displayed. The user can check a relation between the data items by using the screen in Fig. 7 .
- the information processing system 10 that outputs a renal status index suitable for grasping the status of the kidneys.
- a renal status index suitable for grasping the status of the kidneys.
- the information processing system 10 capable of easily grasping a temporal change in the renal status index with the renal status graph 75 illustrated in Figs. 4 and 5 .
- the control unit 21 may call attention of the user with sound, flashing of the display unit 25, or the like.
- the information processing system 10 with which the user can simultaneously grasp a plurality of items with the screens described with reference to Fig. 6 .
- a combination of the graphs illustrated in Fig. 6 is exemplary. It is desirable that the user can select the combination of graphs to be displayed.
- the renal status graph 75 illustrated in Figs. 4 and 5 may be one of the graphs displayed on the screen of Fig. 6 .
- the information processing system 10 with which the user can grasp a correlation of a plurality of data items with the screens described with reference to Fig. 7 .
- the present embodiment relates to an information processing system 10 that uses a trained model generated by machine learning instead of using a multiple regression equation. Description of portions common to the first embodiment will be omitted.
- Fig. 8 is an explanatory diagram describing a renal status model 42.
- the renal status model 42 is a trained model that receives input of an explanatory variable and outputs an objective variable.
- the present inventors generated two renal status models 42 with machine learning using an XGBoost algorithm by using the experimental data described in the first embodiment as training data.
- the explanatory variable, objective variable, and determination coefficient of each of the renal status models 42 are shown in Table 2. [Table 2] No. Explanatory variable Objective variable Determination coefficient R 2 4 Urinary oxygen tension Renal medullary oxygen tension 0.904 Urine flow rate 5 Urinary oxygen tension Renal medullary oxygen tension 0.915 Urine flow rate Mean blood pressure Pulse pressure
- XGBoost is an example of a machine learning algorithm.
- the trained model may be generated by using an algorithm such as random forests or convolutional neural network (CNN), for example.
- CNN convolutional neural network
- the renal status models 42 shown in Table 2 are exemplary.
- a renal status model 42 using an explanatory variable and objective variable different from those in No. 4 and No. 5 may be generated.
- the explanatory variable may include patient information, such as, for example, age, sex, height, weight, a biochemical test result, a medical history, and a course of ongoing treatment, of the patient.
- the renal status model 42 is stored in an auxiliary storage device 23 or an external mass storage device connected to an information processing apparatus 20.
- a control unit 21 inputs an explanatory variable to the renal status model 42 to acquire the renal medullary oxygen tension.
- control unit 21 may select and use the renal status model 42 of No. 4. After calculating each objective variable and reliability by using each of the plurality of renal status models 42, the control unit 21 may adopt an objective variable output by the renal status model 42 having high reliability.
- the control unit 21 may adopt representative values of a plurality of objective variables calculated by using each of the plurality of renal status models 42.
- representative values for example, any statistical value such as an arithmetic mean value, a geometric mean value, a maximum value, or a minimum value can be used.
- the information processing system 10 that accurately displays a renal status index.
- the highly accurate renal status index it is possible to provide the information processing system 10 that displays highly reliable information regarding a state of kidneys.
- the present embodiment relates to an information processing system 10 that displays a treatment guideline. Description of portions common to the second embodiment will be omitted.
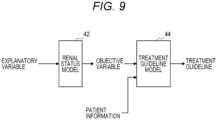
- Fig. 9 is an explanatory diagram describing a treatment guideline model 44.
- the treatment guideline model 44 is a model that receives an objective variable output from the above-described renal status model 42 and patient information including age, sex, height, weight, a biochemical test result, and a medical history of a patient, and information related to drug administered by using a syringe pump 34 and an infusion pump 35, and outputs a treatment guideline.
- the objective variable output from the renal status model 42 is a renal status index such as, for example, an estimated value of renal medullary oxygen tension or an estimated value of renal artery blood flow.
- the treatment guideline model 44 may receive an input of a dimensionless index obtained by non-dimensionalizing the objective variable output from the renal status model 42, with an initial value.
- the renal status model 42 may receive, instead of the objective variable output from the renal status model 42, input of an objective variable calculated on the basis of the multiple regression equation described in the first embodiment.
- the treatment guideline model 44 is generated by machine learning using an algorithm of random forests, XGBoost, or the like, for example.
- Machine learning of the treatment guideline model 44 uses training data in which a large number of sets of an objective variable and patient information, a renal status index and a treatment status, and a treatment guideline judged by a specialist are recorded.
- the treatment guideline is represented by, for example, a type and dosage of a drug administered by using the syringe pump 34 or the infusion pump 35.
- a treatment guideline model 44 that outputs a treatment guideline intended to optimize a balance between a urine flow rate and urinary oxygen is generated by using training data in which a treatment guideline or the like intended to optimize a balance between a urine flow rate and urinary oxygen is recorded.
- a treatment guideline model 44 that outputs a treatment guideline or the like intended to bring the renal status index into a predetermined value is generated by using training data in which a treatment guideline or the like intended to bring the renal status index into a predetermined value is recorded.
- the treatment guideline model 44 may be an algorithm such as a decision tree created on the basis of a rule in accordance with, for example, a guideline related to a standard treatment method defined by medical society, each medical institution, or the like.
- Retraining of the treatment guideline model 44 may be performed by using a database (DB) in which treatment results of a plurality of patients are recorded.
- the retraining may be performed by a large computer or the like different from an information processing apparatus 20, and an updated treatment guideline model 44 may be delivered to the information processing apparatus 20 via a network. It is possible to implement the information processing system 10 that improves accuracy of the treatment guideline model 44 as needed.
- Fig. 10 is a flowchart describing a flow of processing according to a program of a third embodiment.
- a flow of processing up to step S507 is the same as the flow of processing of a program in the first embodiment described with reference to Fig. 2 , and therefore, the description thereof is omitted.
- a control unit 21 inputs, to the treatment guideline model 44, the patient information acquired from an electronic medical record system 17, the syringe pump 34, and the infusion pump 35, and the renal status index calculated in step S506 or step S507 to acquire the treatment guideline (step S521).
- the control unit 21 displays the renal status index and the treatment guideline on a display unit 25 (step S522).
- the control unit 21 determines whether or not to end the processing (step S509). Because a subsequent processing flow is the same as the processing flow of the program according to the embodiment described with reference to Fig. 2 , the description thereof will be omitted.
- Figs. 11 and 12 are examples of a screen according to the third embodiment.
- a renal status index field 72 in addition to a renal status index field 72, a renal status indicator 721, a connection state field 71, and a patient information field 74, two syringe pump fields 771, two infusion pump fields 772, and a proposal field 78 are arranged.
- the proposal field 78 is blank.
- syringe pump fields 771 types and setting states of drugs prepared in the syringe pumps 34 are displayed.
- “Syringe pump 1" represents a state in which preparation for drug administration is completed.
- “Syringe pump 2” represents a state in which preparation for drug administration is not completed.
- types and administration rates of drugs prepared in the infusion pumps 35 are displayed.
- Fig. 11 rightward triangles indicate that infusion is being injected into a body of the patient from "infusion pump 1" and "infusion pump 2".
- Fig. 11 there is no proposal for the treatment guideline, and the proposal field 78 is blank.
- Fig. 12 a treatment guideline including two items of "stop of infusion pump 2" and "start of syringe pump 1" is displayed in the proposal field 78. According to the present embodiment, it is possible to provide the information processing system 10 that displays a treatment guideline
- control unit 21 may transmit control signals to the syringe pumps 34 and the infusion pumps 35 to execute the treatment guideline displayed in the proposal field 78. It is possible to provide the information processing system 10 with which the physician can execute the displayed treatment guideline with a simple instruction.
- the present embodiment relates to an information processing system 10 that predicts a change in a renal status index. Description of portions common to the second embodiment will be omitted.
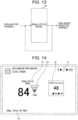
- Fig. 13 is an explanatory diagram describing a renal status model 42 of a fourth embodiment.
- the renal status model 42 of the present embodiment receives an explanatory variable and outputs a time-series objective variable. That is, the renal status model 42 of the present embodiment outputs a predicted value related to an objective variable of a case where treatment, such as a current medication, is continued, in addition to an objective variable at the present time.
- the renal status model 42 is generated by machine learning by using a training database in which a large number of sets of explanatory variables and time-series data of objective variables are recorded.
- the explanatory variable may include time-series data such as a time-series change in vital sign data and a time-series change in dosage.
- an algorithm suitable for processing time-series data such as, for example, a long short term memory (LSTM) or a transformer, is used.
- LSTM long short term memory
- a reinforcement learning method may be used.
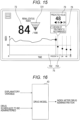
- Figs. 14 and 15 are examples of a screen according to the fourth embodiment.
- a predicted value field 79 is disposed to the right side of a renal status index field 72.
- a predicted value of a renal status index after six hours is displayed in the predicted value field 79.
- a control unit 21 displays a predicted value for a renal status index after 24 hours.
- a renal status graph 75 is disposed under the renal status index field 72 and the predicted value field 79.
- the horizontal axis of the renal status graph 75 represents time.
- the vertical axis of the renal status graph 75 represents the dimensionless renal status index.
- the renal status graph 75 includes an actual value graph 752 and a predicted value graph 753.
- actual value graph 752 actual data of the renal status index is displayed.
- predicted value graph 753 predicted values of the renal status index after six hours, 24 hours, 48 hours, and 72 hours are plotted.
- the predicted value graph 753 has a long time-per-unit length on the horizontal axis as compare to the actual value graph 752.
- Fig. 15 indicates that the renal status index decreases to nearly half of a current level after six hours if a current treatment is continued. "Review of treatment is recommended" is displayed in a proposal field 78. A user can prevent acute kidney injury by avoiding a significant change in the renal status index by changing a drug or the like.
- step S503 and step S506 in the flowchart described with reference to Fig. 2 the control unit 21 inputs an explanatory variable to the renal status model 42 described with reference to Fig. 8 to acquire time-series renal medullary oxygen tension.
- the information processing system 10 that displays a predicted value of the renal status index.
- the present embodiment relates to an information processing system 10 including a drug model 43 that estimates a future objective variable. Description of portions common to the first embodiment will be omitted.
- Fig. 16 is an explanatory diagram describing the drug model 43.
- the drug model 43 is a trained model that receives an explanatory variable described with reference to Fig. 8 and the like and information related to a drug to be administered, and outputs a predicted value of an index at a time point when a predetermined time has elapsed after the drug is administered as scheduled.
- the index is a value that can be measured in real time, such as urinary oxygen tension, a urine flow rate, a mean blood pressure, a pulse pressure, a heart rate, or blood oxygen saturation, for example.
- the index may be an index that can be estimated in real time, such as an estimated value of renal artery blood flow or an estimated value of renal tissue oxygen tension.
- the drug model 43 may output a plurality of indices.
- the drug model 43 is generated by machine learning by using, for example, training data acquired by an animal experiment using pigs, as described in the first embodiment. In a case where safety of the drug to be administered is sufficiently ensured, training data in which a large number of sets of explanatory variables related to an actual patient and an index after medication are recorded may be used.
- the drug model 43 may be a rule-based algorithm created on the basis of a pharmacological effect of a drug.
- a drug that affects a condition of kidneys may be administered repeatedly.
- a drug dosage to the individual patient on the basis of a change in a physical condition after the drug administration, it is possible to avoid a sudden change in the condition of the patient.
- a change in an index after a predetermined time has elapsed is larger than a prediction output from the drug model 43 after administration of a drug according to a treatment guideline output from a treatment guideline model 44 as described with reference to Fig. 9 , it can be judged that the patient is a type of patient having a strong reaction to the drug.
- a physician can prevent kidney injury by reducing subsequent dosage of the drug from an amount output from the treatment guideline model 44.
- a control unit 21 may integrate a coefficient, which is calculated on the basis of a difference between a predicted value of an index after the drug administration, the predicted value being output from the drug model 43, and an index actually measured after a predetermined time has elapsed after the drug administration, with respect to predicted values of indices output from the drug model 43 from next time onwards, and display the predicted values.
- the control unit 21 may perform retraining of the drug model 43 on the basis of a difference between the predicted value of the index after the drug administration, the predicted value being output from the drug model 43, and the index actually measured after the drug administration.
- the information processing system 10 that outputs an index corresponding to an individual patient can be provided.
- Fig. 17 is a flowchart describing a flow of processing according to a program of a fifth embodiment.
- the control unit 21 acquires urine information from a urine measurement device 31 (step S541).
- the control unit 21 acquires circulatory dynamics information from a vital sign monitor 33 (step S542).
- the control unit 21 acquires patient information from an electronic medical record system 17 (step S543).
- the patient information includes, for example, age, sex, height, weight, a biochemical test result, a medical history, and a course of ongoing treatment, of the patient.
- the control unit 21 acquires information related to a drug scheduled to be administered (step S544).
- the information related to the drug scheduled to be administered is acquired from, for example, the treatment guideline model 44 described with reference to Fig. 9 .
- the control unit 21 may receive input of information related to a drug scheduled to be administered by a user.
- the control unit 21 inputs, to the drug model 43, the explanatory variable and information related to the drug scheduled to be administered to the patient, and acquires a predictive index at a time after the predetermined time has elapsed after the drug is administered (step S545).
- the control unit 21 determines whether or not the drug is administered according to a schedule acquired in step S544 (step S546).
- a status of the administration of the drug is acquired from, for example, a syringe pump 34 or an infusion pump 35.
- the control unit 21 may receive an input by the user regarding a drug administration status.
- step S546 If it is determined that the drug administration as scheduled has not been performed (NO in step S546), the control unit 21 returns to step S541. If it is determined that the drug administration as scheduled has been performed (YES in step S546), the control unit 21 waits for the predetermined time for determining an effect of the drug to pass (step S547).
- the control unit 21 acquires a measured value of an index on the basis of latest urine information or circulatory dynamics information (step S548).
- the control unit 21 calculates a difference between the predicted value acquired in step S545 and the measured value acquired in step S548 (step S549).
- the control unit 21 determines whether or not the difference is equal to or smaller than a predetermined threshold value (step S550).
- the control unit 21 corrects the drug model 43 so that output data output from the drug model 43 approaches the measured value (step S551). Specifically, for example, the control unit 21 sets a display program so as to output a correction value obtained by integrating, with respect to the output from the drug model 43, a coefficient obtained by dividing the measured value acquired in step S548 by the predicted value acquired in step S545.
- the control unit 21 may receive an input by the user regarding a method for correcting the output from the drug model 43.
- the control unit 21 may perform retraining of the drug model 43.
- step S550 determines whether or not to end the processing. If the control unit 21 determines not to end the processing (NO in step S552), the control unit 21 returns to step S541. If the control unit 21 determines to end the processing (YES in step S552), the control unit 21 ends the processing.
- the information processing system 10 that predicts an effect of a drug on an individual patient.
- Fig. 18 is an explanatory diagram describing a configuration of an information processing system 10 of a sixth embodiment.
- the present embodiment relates to a mode in which an information processing apparatus 20 is implemented by causing a general-purpose computer 90 and a program 97 to operate in combination. Description of portions common to the first embodiment will be omitted.
- the computer 90 includes a reading unit 29 in addition to the above-described control unit 21, main storage device 22, auxiliary storage device 23, communication unit 24, display unit 25, input unit 26, and bus.
- a program 97 is recorded in a portable recording medium 96.
- the control unit 21 reads the program 97 via the reading unit 29 and saves the read program 97 in the auxiliary storage device 23.
- the control unit 21 may read the program 97 stored in a semiconductor memory 98 such as a flash memory mounted in the computer 90.
- the control unit 21 may download the program 97 from another server computer (not illustrated) connected via the communication unit 24 and a network (not illustrated) and save the downloaded program 97 in the auxiliary storage device 23.
- the program 97 is installed as a control program for the computer 90 and is loaded into the main storage device 22 to be executed. As described above, the information processing apparatus 20 described in the first embodiment is implemented.
- the program 97 of the present embodiment is an example of a program product.
Landscapes
- Health & Medical Sciences (AREA)
- Life Sciences & Earth Sciences (AREA)
- Public Health (AREA)
- Medical Informatics (AREA)
- Engineering & Computer Science (AREA)
- General Health & Medical Sciences (AREA)
- Physics & Mathematics (AREA)
- Biomedical Technology (AREA)
- Pathology (AREA)
- Molecular Biology (AREA)
- Veterinary Medicine (AREA)
- Biophysics (AREA)
- Heart & Thoracic Surgery (AREA)
- Surgery (AREA)
- Animal Behavior & Ethology (AREA)
- Physiology (AREA)
- Cardiology (AREA)
- Epidemiology (AREA)
- Primary Health Care (AREA)
- Pulmonology (AREA)
- Data Mining & Analysis (AREA)
- Databases & Information Systems (AREA)
- Optics & Photonics (AREA)
- Urology & Nephrology (AREA)
- Spectroscopy & Molecular Physics (AREA)
- Hematology (AREA)
- Measuring And Recording Apparatus For Diagnosis (AREA)
Abstract
Description
- The present invention relates to a program, an information processing method, and an information processing apparatus.
- A catheter for measurement of urinary oxygen tension in a bladder has been proposed in which a urinary catheter body and a probe that is inserted into the bladder through a urinary catheter to measure the urinary oxygen tension in the bladder are combined (Patent Literature 1).
- Patent Literature 1:
JP 2021-62073 A - The urinary oxygen tension measured by the catheter of
Patent Literature 1 is one of parameters indicating a status of kidneys. A medical worker such as a physician or a nurse comprehensively judges urinary oxygen tension and vital sign data of blood pressure or the like to grasp a status of kidneys of a patient. - However, for example, during whole body management in a surgery and in an intensive care unit (ICU), a medical worker performs various tasks simultaneously in parallel, and cannot concentrate on grasping a status of the kidneys.
- In one aspect, an object is to provide a program or the like that displays an index suitable for grasping a status of kidneys.
- A program causes a computer to execute processing of acquiring urine information including urinary oxygen tension, calculating a renal status index on the basis of the urine information, and outputting the renal status index.
- In one aspect, it is possible to provide a program or the like for displaying an index suitable for grasping a status of kidneys.
-
-
Fig. 1 is an explanatory diagram describing a configuration of an information processing system. -
Fig. 2 is a flowchart describing a flow of processing according to a program. -
Fig. 3 is an example of a screen display. -
Fig. 4 is an example of a screen display. -
Fig. 5 is an example of a screen display. -
Fig. 6 is an example of a screen display. -
Fig. 7 is an example of a screen display. -
Fig. 8 is an explanatory diagram describing a renal status model. -
Fig. 9 is an explanatory diagram describing a treatment guideline model. -
Fig. 10 is a flowchart describing a flow of processing according to a program of a third embodiment. -
Fig. 11 is an example of a screen display of the third embodiment. -
Fig. 12 is an example of a screen display of the third embodiment. -
Fig. 13 is an explanatory diagram describing a renal status model of a fourth embodiment. -
Fig. 14 is an example of a screen display of the fourth embodiment. -
Fig. 15 is an example of a screen display of the fourth embodiment. -
Fig. 16 is an explanatory diagram describing a drug model. -
Fig. 17 is a flowchart describing a flow of processing according to a program of a fifth embodiment. -
Fig. 18 is an explanatory diagram describing a configuration of an information processing system of a sixth embodiment. - It is known that a patient requiring a whole body management in a surgery and ICU has a high risk of having acute kidney injury (AKI) with which a renal function of the patient deteriorates in a short period of time. Because prognosis of the acute kidney injury is poor, it is desirable to grasp a status of kidneys of the patient at all times to grasp a sign of the acute kidney injury, and perform an appropriate preventive treatment before the acute kidney injury actually occurs.
- A status of kidneys is evaluated on the basis of an evaluation index such as a serum creatinine level, a creatinine clearance, a glomerular filtration rate (GFR), or a urine flow rate. However, the serum creatinine level changes after about one day to three days from a kidney disorder event. Because the creatinine clearance and the glomerular filtration rate are calculated by using the serum creatinine level, similarly to the serum creatinine level, a change in the creatinine clearance and the glomerular filtration rate occurs after one day to three days after the kidney disorder. It is known that the urine flow rate may not change even after a kidney disorder.
- Therefore, only with conventional evaluation indices, it is difficult to quickly find a sign of an acute kidney injury and perform a preventive treatment.
- It is known that a change in renal tissue oxygen tension quickly reflects a change in a status of kidneys. However, in order to measure the renal tissue oxygen tension, it is necessary to insert an oxygen sensor into a renal tissue. Insertion of the oxygen sensor into a renal tissue has a high degree of invasion into a patient, and thus damages kidneys.
- Meanwhile, a bladder-indwelling catheter is often used during whole body management in a surgery and in an ICU. Therefore, the urinary oxygen tension in the bladder can be measured in real time by using, for example, the catheter of
Patent Literature 1 without increasing the degree of invasion into the patient. - The present inventors measured changes in renal tissue oxygen tension, urinary oxygen tension, urine flow rates, and pulse pressures of pigs while changing concentration of Oxygen concentration in respiratory gas during anesthesia from the pigs. The pulse pressure is a difference between a systolic blood pressure and a diastolic blood pressure. The number of samples, that is, the number of pigs used, is six.
- A correlation coefficient r between the urinary oxygen tension and the renal tissue oxygen tension was calculated on the basis of data from the measurement, and the correlation coefficient r was 0.6581. The value of the calculated correlation coefficient r was equivalent to a correlation coefficient r in a prior art document, and it was confirmed that appropriate measurement was performed.
- Results of three multiple regression analyses using the measurement data obtained in this experiment are shown in Table 1.
[Table 1] No. Explanatory variable Objective variable Determination coefficient R 21 Urinary oxygen tension Renal medullary oxygen tension 0.627 Urine flow rate 2 Urinary oxygen tension Renal medullary oxygen tension 0.625 Pulse pressure 3 Urinary oxygen tension Renal medullary oxygen tension 0.774 Urine flow rate Pulse pressure - Renal medulla is a type of renal tissue and is a portion located inside a kidney. Thus, renal medullary oxygen tension is an exemplification of renal tissue oxygen tension. It can be seen from Table 1 that the renal medullary oxygen tension, which is an objective variable, can be estimated with high accuracy by using a multiple regression equation that is calculated by using, as explanatory variables, three data of the urinary oxygen tension, urine flow rate, and pulse pressure.
- Furthermore, it is also found from Table 1 that, by using the multiple regression equation in which the urinary oxygen tension and the urine flow rate are used as explanatory variables, the renal medullary oxygen tension, which is the objective variable, can be estimated with high accuracy that is equal to or more than accuracy of the multiple regression equation in which the urinary oxygen tension and the pulse pressure are used as explanatory variables.
- Methods for calculating the explanatory variables will be described. The urinary oxygen tension can be measured in real time by inserting the oxygen sensor into the bladder through the bladder-indwelling catheter as described above. The oxygen sensor may be disposed in a middle of the bladder-indwelling catheter, or in a middle between a terminal of the bladder-indwelling catheter and an opening of a urine bag connected by a tube from the terminal of the catheter.
- The urine flow rate can be measured in real time on the basis of, for example, a change in weight of the urine bag. The bladder-indwelling catheter may be provided with a flow sensor. A mode of the sensor for measuring the urine flow rate is not limited. During whole body management in a surgery and in an ICU, a patient is usually monitored by a vital sign monitor 33 at all times for circulatory dynamics information including blood pressure and heart rate (refer to
Fig. 1 ). - As described above, by using the multiple regression equation, it is possible to estimate the renal medullary oxygen tension in real time with high accuracy without increasing the degree of invasion into the patient.
- The renal medullary oxygen tension greatly varies among individuals depending on the circulatory dynamics and management status of the patient. Therefore, it is appropriate to judge a sign of a change in renal medullary oxygen tension leading to acute kidney injury, on the basis of a change from an initial state, for example, at a start of surgery, at a time of entering the ICU, or the like, in addition to on the basis of an absolute value of the renal medullary oxygen tension.
- In the present embodiment, an index related to an estimated value of the renal medullary oxygen tension is displayed by using a relative value with an initial value at the start of surgery, at the time of entering the ICU, or the like, set to 100. That is, the display value is calculated by Mathematical Formula (1).
[Mathematical Formula 1]
- The urinary oxygen tension and the urine flow rate are examples of urine information of the patient. The urine information may be, for example, a urinary output, urinary color, urine absorbance, a urinary sodium amount, a urinary potassium amount, or a urinary creatinine amount. The urinary output is a total amount of urine output from the bladder of the patient after the measurement is started and can be measured in real time on the basis of, for example, a weight of the urine bag.
- The urinary color and urine absorbance can be measured in real time by, for example, inserting an optical fiber connected to an optical measurement device, such as a spectrophotometer, into the bladder-indwelling catheter. The urinary creatinine amount can be measured by using an enzymatic method or absorbance. In addition, the urinary sodium amount and the urinary potassium amount can be measured in real time, for example, by using a fluorescent dye that specifically reacts in a system up to the bladder-indwelling catheter and the urine bag.
- The pulse pressure is an example of the circulatory dynamics information. The circulatory dynamics information may be, for example, a systolic blood pressure, a diastolic blood pressure, a mean blood pressure, a heart rate, and blood oxygen saturation. The mean blood pressure is a value calculated by diastolic blood pressure + (systolic blood pressure - diastolic blood pressure)/3. However, numerical processing of, for example, a moving average at a time of calculation, or adjustment of a calculation formula may be performed, and thus it is only required to use an equivalent value.
- These pieces of circulatory dynamics information can be measured by the
vital sign monitor 33. The circulatory dynamics information may be tissue oxygen saturation of each part of a body. The tissue oxygen saturation of each part of a brain or body can be measured in real time in a minimally invasive manner, and is used in clinical practice as a hemodynamic monitor. - The renal medullary oxygen tension is an example of a renal status index capable of quickly detecting a change in status of the kidneys. The renal status index may be, for example, an estimated value of renal artery blood flow. In a case where the estimated value of the renal artery blood flow is used, data for which the renal artery blood flow can be used as the objective variable in the above-described experiment is acquired, and a multiple regression analysis is performed. In addition, any index capable of detecting abnormality of the kidneys can be used.
- The multiple regression equation calculated by using the urinary oxygen tension and the urine flow rate as explanatory variables and by using the renal medullary oxygen tension as the objective variable as described in No. 1 in Table 1 is an example of an algorithm for calculating the renal status index on the basis of the urinary oxygen tension and the urine flow rate.
- In the measurement using the pigs as described above, in addition to the urinary oxygen tension, the urine flow rate, and the renal medullary oxygen tension, the mean blood pressure, the pulse pressure, the heart rate, the renal artery blood flow, and the glomerular filtration rate can also be measured. The multiple regression equation can be calculated by using the urinary oxygen tension, the urine flow rate, the mean blood pressure, the pulse pressure, and the heart rate as the explanatory variables, and by using the renal artery blood flow rate as the objective variable. The multiple regression equation calculated in this manner is an example of an algorithm for calculating the renal status index related to the estimated value of the renal artery blood flow on the basis of the urinary oxygen tension, the urine flow rate, the mean blood pressure, the pulse pressure, and the heart rate.
- The multiple regression equation can be calculated with the same experimental data by using the urinary oxygen tension, the urine flow rate, the mean blood pressure, the pulse pressure, and the heart rate as the explanatory variables, and by using the renal medullary oxygen tension as the objective variable. The multiple regression equation calculated in this manner is an example of an algorithm for calculating the renal status index related to the estimated value of the renal tissue oxygen tension on the basis of the urinary oxygen tension, the urine flow rate, the mean blood pressure, the pulse pressure, and the heart rate.
- The multiple regression equation can be calculated by using the urinary oxygen tension and the urine flow rate as the explanatory variables, and by using the renal artery blood flow rate as the objective variable. The multiple regression equation calculated in this manner is an example of an algorithm for calculating the renal status index related to the estimated value of the renal artery blood flow on the basis of the urinary oxygen tension and the urine flow rate.
- Instead of the multiple regression equation, a simple regression equation may be used. For example, the simple regression equation can be calculated by using the urinary oxygen tension or the urine flow rate as the explanatory variables, and by using the renal artery blood flow rate as the objective variable. The simple regression equation calculated in this manner is an example of an algorithm for calculating the renal status index related to the estimated value of the renal artery blood flow on the basis of either the urinary oxygen tension or the urine flow rate.
- For the explanatory variables, the multiple regression equation or the simple regression equation may be calculated by using the glomerular filtration rate instead of the renal artery blood flow. The multiple regression equation or simple regression equation calculated in this manner is an example of an algorithm for calculating the renal status index related to the estimated value of the glomerular filtration rate.
- In addition, an algorithm for calculating an arbitrary index can be generated by calculating the multiple regression equation using a combination of arbitrary measured parameters.
- A table showing a relationship between the explanatory variable and the objective variable on the basis of the multiple regression equation may be created and recorded in an auxiliary storage device 23 (refer to
Fig. 1 ). In a case where the explanatory variables are two of the urinary oxygen tension and the urine flow rate, and the objective variable is the renal artery blood flow rate, a three-dimensional table is created. A six-dimensional table is created in a case where the explanatory variables are five of the urinary oxygen tension, the urine flow rate, the mean blood pressure, the pulse pressure, and the heart rate, and where the objective variable is the renal medullary oxygen tension. - A control unit 21 (refer to
Fig. 1 ) searches the table by using the explanatory variables measured in real time as keys, and acquires the objective variable. Thecontrol unit 21 may calculate the objective variable by performing interpolation between the parameters recorded in the table with a known method. The table is an example of an algorithm for calculating the objective variable on the basis of the explanatory variables. - In the following description, there will be described a case, as an example, where the renal status index is the renal medullary oxygen tension, and the renal medullary oxygen tension is estimated on the basis of the urinary oxygen tension, the urine flow rate, and the pulse pressure.
-
Fig. 1 is an explanatory diagram describing a configuration of aninformation processing system 10. Theinformation processing system 10 includes, for example, aninformation processing apparatus 20, aurine measurement device 31, thevital sign monitor 33, asyringe pump 34, aninfusion pump 35, and an electronicmedical record system 17 that are connected via a network such as a hospital information system (HIS). - The
urine measurement device 31 measures and outputs urine information such as urinary oxygen tension and a urine flow rate by using aurine sensor 311. The vital sign monitor 33 is connected to various sensors (not illustrated), and measures and outputs the circulatory dynamics information such as blood pressure or pulse pressure. Theurine measurement device 31 and the vital sign monitor 33 may be configured to be integrated with each other. - The
syringe pump 34 is used for drug administration to the patient. Theinfusion pump 35 is used for infusion administration to the patient. Theinfusion pump 35 may have a function of mixing a drug with infusion. Instead of using thesyringe pump 34, a nurse or the like may administer a drug to the patient by using a syringe. Theinfusion pump 35 may not be connected to the network, and may be manually operated by the nurse or the like. Thesyringe pump 34 and theinfusion pump 35 are examples of a drug administration device. - The electronic
medical record system 17 records patient information such as age, sex, height, weight, a biochemical test result, a medical history, or a course of ongoing treatment, of the patient. The course of ongoing treatment includes a type and amount of drug administered to the patient. The medical history includes the type and amount of the drug administered to the patient in a past surgery and treatment, a condition of the patient after the administration, and the like. Data such as a renal status index to be described later may be sequentially recorded in the electronicmedical record system 17. - The
information processing apparatus 20 includes thecontrol unit 21, amain storage device 22, theauxiliary storage device 23, acommunication unit 24, adisplay unit 25, aninput unit 26, and a bus. Thecontrol unit 21 is an arithmetic control device that executes a program of the present embodiment. For thecontrol unit 21, one or a plurality of central processing units (CPUs), graphics processing units (GPUs), tensor processing units (TPUs), a multi-core CPU, or the like, is used. Thecontrol unit 21 is connected to each of hardware components that constitute theinformation processing apparatus 20 via the bus. - The
main storage device 22 is a storage device such as a static random access memory (SRAM), a dynamic random access memory (DRAM), or a flash memory. Themain storage device 22 temporarily saves necessary information in the middle of processing performed by thecontrol unit 21 and a program being executed by thecontrol unit 21. - The
auxiliary storage device 23 is a storage device such as an SRAM, a flash memory, a hard disk, or a magnetic tape. Theauxiliary storage device 23 saves a program to be executed by thecontrol unit 21 and various kinds of data necessary for executing the program. Thecommunication unit 24 is an interface that performs communication between theinformation processing apparatus 20 and a network. - The
display unit 25 is a liquid crystal display device, an organic electro-luminescence (EL) display device, or the like, for example. Theinput unit 26 is, for example, an input device such as a keyboard, a mouse, a trackball, or a microphone. Thedisplay unit 25 and theinput unit 26 may be integrally stacked to constitute a touch panel. - The
information processing apparatus 20 of the present embodiment is an information device such as a general-purpose personal computer, tablet, smartphone, or server computer. Theinformation processing apparatus 20 may be a large computer, a virtual machine operating on a large computer, a cloud computing system, a quantum computer, a plurality of personal computers that performs distributed processing, or the like. Theinformation processing apparatus 20 may be configured to be integrated with, for example, theurine measurement device 31, thevital sign monitor 33, or the electronicmedical record system 17. - In the following description, a case where the
control unit 21 performs software processing will be mainly described as an example. Processing described with reference to the flowchart, and various models may be implemented by dedicated hardware. -
FIG. 2 is a flowchart describing a flow of processing according to a program. A user such as a physician activates the program described with reference toFig. 2 after attaching various sensors to a body of the patient who has entered a surgery room or the ICU. - The
control unit 21 acquires the urine information from the urine measurement device 31 (step S501). Thecontrol unit 21 acquires the circulatory dynamics information from the vital sign monitor 33 (step S502). Thecontrol unit 21 calculates the renal status index by substituting the urine information acquired in step S501 and the circulatory dynamics information acquired in step S502 into the multiple regression equation calculated in advance (step S503). The renal status index calculated in step S503 is an initial value of the renal status index. - The
control unit 21 acquires the urine information from the urine measurement device 31 (step S504). Thecontrol unit 21 acquires the circulatory dynamics information from the vital sign monitor 33 (step S505). Thecontrol unit 21 calculates the renal status index by substituting the urine information acquired in step S504 and the circulatory dynamics information acquired in step S505 into the multiple regression equation calculated in advance (step S506). The renal status index calculated in step S506 is a real-time renal status index. - The
control unit 21 calculates a dimensionless renal status index by multiplying a value, which is obtained by dividing the real-time renal status index acquired in step S506 by the initial value of the renal status index acquired in step S503, by 100 (step S507). A dimensionless index at a start of the measurement is 100. Note that in a case where the real-time renal status index exceeds the initial value, the dimensionless index is a value exceeding 100. - The
control unit 21 displays the calculated renal status index on the display unit 25 (step S508). Thecontrol unit 21 may output the renal status index to another device connected to an output device, such as the vital sign monitor 33 or the electronicmedical record system 17. - The
control unit 21 determines whether or not to end the processing (step S509). For example, in a case where an end instruction is received from the user, thecontrol unit 21 determines to end the processing. Thecontrol unit 21 may determine to end the processing when the urine information and the circulatory dynamics information cannot be acquired from theurine measurement device 31 and thevital sign monitor 33. - If the
control unit 21 determines not to end the processing (NO in step S509), thecontrol unit 21 returns to step S504. If thecontrol unit 21 determines to end the processing (YES in step S509), thecontrol unit 21 ends the processing. -
Figs. 3 to 6 are examples of a screen. Thecontrol unit 21 displays the screens illustrated inFigs. 3 to 6 in step S508 of the program described with reference toFig. 2 . Thecontrol unit 21 may display the screens illustrated inFigs. 3 to 6 on a display device disposed in, for example, a nurse station, or the like. Thecontrol unit 21 may receive selection of a screen to be displayed from the user. - The screen illustrated in
Fig. 3 has a renalstatus index field 72, aconnection state field 71, a urinaryoxygen tension field 731, a urineflow rate field 732, a meanblood pressure field 733, aheart rate field 734, and apatient information field 74. A menu button is disposed in the upper left of the screen, and an indicator indicating a state of charge of a battery is disposed in the upper right of the screen. A date, day of the week, time, air temperature, and atmospheric pressure are displayed to the right side of the menu button. The air temperature and the air pressure are acquired from, for example, a sensor module that is connected to theinformation processing apparatus 20 and is capable of acquiring temperature and atmospheric pressure. The air temperature and the air pressure may be acquired from a world wide web (WWW) site that provides weather information via a network. - The renal
status index field 72 is disposed at the center of the screen, and the dimensionless index calculated in step S507 is displayed in real time. Arenal status indicator 721 is disposed next to the renalstatus index field 72. Therenal status indicator 721 has an inverted triangular shape, and illustrates the renalstatus index field 72 in three stages of, for example, less than 30%, 30% or more and less than 70%, and 70% or more. - In the urinary
oxygen tension field 731, the urinary oxygen tension among the urine information acquired in step S501 is displayed. In the urineflow rate field 732, the urine flow rate among the urine information acquired in step S501 is displayed. In the meanblood pressure field 733, the mean blood pressure among the circulatory dynamics information acquired in step S502 is displayed. In theheart rate field 734, the heart rate among the circulatory dynamics information acquired in step S502 is displayed. - In the
patient information field 74, the patient information acquired from the electronicmedical record system 17 is displayed. In the example illustrated inFig. 3 , the patient weighs 54 kilograms, and is 167 centimeters tall, male, and 59 years old. - In
Fig. 3 , an icon indicating thesyringe pump 34 and an icon indicating theinfusion pump 35 are displayed in theconnection state field 71. The user can confirm that thesyringe pump 34 and theinfusion pump 35 are operating in a usable state. For example, in a case where a plurality of syringe pumps 34 is connected to the network, thecontrol unit 21 may display only one icon indicating asyringe pump 34 or may display the same number of icons as the number of the connected syringe pumps 34. - In the screen illustrated in
Fig. 4 , arenal status graph 75 is disposed to the right side of the renalstatus index field 72. Because the screen is similar to the screen inFig. 3 other than therenal status graph 75, the description of the screen other than therenal status graph 75 is omitted. The horizontal axis of therenal status graph 75 represents time. The right end of the horizontal axis represents a current time. The vertical axis of therenal status graph 75 represents the dimensionless renal status index. The user can easily check a temporal change of the dimensionless index with therenal status graph 75. - The
renal status graph 75 is displayed such that a line graph extends toward the right side after the start of measurement. In a case where the right end of therenal status graph 75 is reached as illustrated inFig. 4 , thecontrol unit 21 scrolls therenal status graph 75 by one piece of data on the right side each time new data is acquired and displays latest data at the right end of therenal status graph 75. Alternatively, for example, time may be displayed in a compressed manner to display all data. - In the screen illustrated in
Fig. 5 , arange indicator 751 indicating a variation range of the renal status index is displayed at the left end of therenal status graph 75. The upper and lower ends of the thick portion of therange indicator 751 correspond to a maximum value and minimum value of the renal status index displayed in therenal status graph 75, respectively. Error bars indicating a calculation error of the renal status index are displayed above and below therange indicator 751. The user can easily grasp a variation range and error range of the renal status index with therange indicator 751. - In
Fig. 6 , the urinaryoxygen tension field 731, the urineflow rate field 732, the meanblood pressure field 733, theheart rate field 734, an arterialoxygen saturation field 735, and an inhaledoxygen concentration field 736 are arranged in tiles. In the urinaryoxygen tension field 731, a graph illustrating a temporal change in the urinary oxygen tension and a latest urinary oxygen tension are displayed. In the graph in the urinaryoxygen tension field 731, the horizontal axis represents the time, and the vertical axis represents the urinary oxygen tension. - In the urine
flow rate field 732, a graph illustrating a temporal change in the urine flow rate and a latest urine flow rate are displayed. In the graph in the urineflow rate field 732, the horizontal axis represents the time, and the vertical axis represents the urine flow rate. In the meanblood pressure field 733, a graph illustrating a temporal change in the mean blood pressure and a latest mean blood pressure are displayed. In the graph in the meanblood pressure field 733, the horizontal axis represents the time, and the vertical axis represents the mean blood pressure. In theheart rate field 734, a graph illustrating a temporal change in the heart rate and a latest heart rate are displayed. In the graph in theheart rate field 734, the horizontal axis represents the time, and the vertical axis represents the heart rate. - In the arterial
oxygen saturation field 735, a graph illustrating a temporal change in arterial oxygen saturation (saturation of percutaneous oxygen: SpO2) and a latest arterial oxygen saturation are displayed. In the graph in the arterialoxygen saturation field 735, the horizontal axis represents the time, and the vertical axis represents the arterial oxygen saturation. - In the inhaled
oxygen concentration field 736, a graph illustrating a temporal change in inhaled oxygen concentration (fraction of inspiratory oxygen: FiO2) and a latest inhaled oxygen concentration are displayed. In the graph in the inhaledoxygen concentration field 736, the horizontal axis represents the time, and the vertical axis represents the inhaled oxygen concentration. The inhaled oxygen concentration is calculated on the basis of a type of an oxygen administrator, such as a nasal cannula, a mask with a reservoir or a venturi mask, attached to the patient, and the oxygen flow rate. During general anesthesia, the inhaled oxygen concentration may be acquired from an anesthetic machine (not illustrated). - The horizontal axes of the six types of graphs illustrated in
Fig. 6 are all the same. Therefore, instead of arranging the six graphs in tiles, the six line graphs may be displayed in one graph. The graphs illustrated inFigs. 4 to 6 may be bar charts. - The examples of screens described with reference to
Figs. 3 to 6 are all examples. Thecontrol unit 21 may receive a change instruction from the user regarding items displayed on the screens and layout of each of the items. -
Fig. 7 is an example of a screen display. InFig. 7 , acondition selection field 761 is displayed on the left side of the screen, and acorrelation graph field 762 is displayed on the right side of the screen. The horizontal axis of the graph illustrated in thecorrelation graph field 762 represents an item selected from "X-axis item" in thecondition selection field 761. The vertical axis of the graph illustrated in thecorrelation graph field 762 represents an item selected from "Y-axis item" in thecondition selection field 761. - The
control unit 21 plots data averaged over a time selected in "data average section" in thecorrelation graph field 762. An item selected in "calculation parameter" is displayed in an upper part of thecorrelation graph field 762. InFig. 7 , an approximation formula obtained by approximating plotted data with a linear function and a Pearson's correlation coefficient are displayed. The user can check a relation between the data items by using the screen inFig. 7 . - According to the present embodiment, it is possible to provide the
information processing system 10 that outputs a renal status index suitable for grasping the status of the kidneys. By displaying the dimensionless renal status, it is possible to support the user so that the user can notice a sign of acute kidney injury at an early stage, and that necessary treatment can be performed. Because it is not necessary to simultaneously grasp both the urinary oxygen tension and urine flow rate measured by theurine measurement device 31, and the pulse pressure measured by thevital sign monitor 33, it is possible to provide theinformation processing system 10 that reduces burden on the user. Note that, instead of the urinary oxygen tension, urinary oxygen concentration may be used. - According to the present embodiment, it is possible to provide the
information processing system 10 capable of easily grasping a temporal change in the renal status index with therenal status graph 75 illustrated inFigs. 4 and5 . For example, in a case where the renal status index rapidly decreases, it can be judged that a risk of developing acute kidney injury is high. Note that, in a case where a value of the renal status index or a slope of the renal status index exceeds a predetermined threshold value, thecontrol unit 21 may call attention of the user with sound, flashing of thedisplay unit 25, or the like. - According to the present embodiment, it is possible to provide the
information processing system 10 with which the user can simultaneously grasp a plurality of items with the screens described with reference toFig. 6 . Note that a combination of the graphs illustrated inFig. 6 is exemplary. It is desirable that the user can select the combination of graphs to be displayed. For example, therenal status graph 75 illustrated inFigs. 4 and5 may be one of the graphs displayed on the screen ofFig. 6 . - According to the present embodiment, it is possible to provide the
information processing system 10 with which the user can grasp a correlation of a plurality of data items with the screens described with reference toFig. 7 . - The present embodiment relates to an
information processing system 10 that uses a trained model generated by machine learning instead of using a multiple regression equation. Description of portions common to the first embodiment will be omitted. -
Fig. 8 is an explanatory diagram describing arenal status model 42. Therenal status model 42 is a trained model that receives input of an explanatory variable and outputs an objective variable. The present inventors generated tworenal status models 42 with machine learning using an XGBoost algorithm by using the experimental data described in the first embodiment as training data. The explanatory variable, objective variable, and determination coefficient of each of therenal status models 42 are shown in Table 2.[Table 2] No. Explanatory variable Objective variable Determination coefficient R2 4 Urinary oxygen tension Renal medullary oxygen tension 0.904 Urine flow rate 5 Urinary oxygen tension Renal medullary oxygen tension 0.915 Urine flow rate Mean blood pressure Pulse pressure - Because both No. 4 and No. 5 have a determination coefficient larger than the multiple regression analyses shown in Table 1, it can be seen that renal medullary oxygen tension can be estimated more accurately than with the multiple regression analyses in shown
embodiment 1 or the multiple regression equation. From No. 1 shown in Table 1 and No. 4 shown in Table 2, the renal medullary oxygen tension can be accurately estimated on the basis of two parameters of urinary oxygen tension and urine flow rate by using therenal status model 42. - XGBoost is an example of a machine learning algorithm. The trained model may be generated by using an algorithm such as random forests or convolutional neural network (CNN), for example. The
renal status models 42 shown in Table 2 are exemplary. - A
renal status model 42 using an explanatory variable and objective variable different from those in No. 4 and No. 5 may be generated. The explanatory variable may include patient information, such as, for example, age, sex, height, weight, a biochemical test result, a medical history, and a course of ongoing treatment, of the patient. By adding the patient information to the explanatory variable, arenal status model 42 with a highly accurate objective variable to be output can be generated. - The
renal status model 42 is stored in anauxiliary storage device 23 or an external mass storage device connected to aninformation processing apparatus 20. In the present embodiment, in step S503 and step S506 in the flowchart described with reference toFig. 2 , acontrol unit 21 inputs an explanatory variable to therenal status model 42 to acquire the renal medullary oxygen tension. - For example, the
control unit 21 may select and use therenal status model 42 of No. 4. After calculating each objective variable and reliability by using each of the plurality ofrenal status models 42, thecontrol unit 21 may adopt an objective variable output by therenal status model 42 having high reliability. Thecontrol unit 21 may adopt representative values of a plurality of objective variables calculated by using each of the plurality ofrenal status models 42. As the representative values, for example, any statistical value such as an arithmetic mean value, a geometric mean value, a maximum value, or a minimum value can be used. - According to the present embodiment, it is possible to provide the
information processing system 10 that accurately displays a renal status index. By using the highly accurate renal status index, it is possible to provide theinformation processing system 10 that displays highly reliable information regarding a state of kidneys. - The present embodiment relates to an
information processing system 10 that displays a treatment guideline. Description of portions common to the second embodiment will be omitted. -
Fig. 9 is an explanatory diagram describing atreatment guideline model 44. Thetreatment guideline model 44 is a model that receives an objective variable output from the above-describedrenal status model 42 and patient information including age, sex, height, weight, a biochemical test result, and a medical history of a patient, and information related to drug administered by using asyringe pump 34 and aninfusion pump 35, and outputs a treatment guideline. - As described above, the objective variable output from the
renal status model 42 is a renal status index such as, for example, an estimated value of renal medullary oxygen tension or an estimated value of renal artery blood flow. Thetreatment guideline model 44 may receive an input of a dimensionless index obtained by non-dimensionalizing the objective variable output from therenal status model 42, with an initial value. - The
renal status model 42 may receive, instead of the objective variable output from therenal status model 42, input of an objective variable calculated on the basis of the multiple regression equation described in the first embodiment. - The
treatment guideline model 44 is generated by machine learning using an algorithm of random forests, XGBoost, or the like, for example. Machine learning of thetreatment guideline model 44 uses training data in which a large number of sets of an objective variable and patient information, a renal status index and a treatment status, and a treatment guideline judged by a specialist are recorded. The treatment guideline is represented by, for example, a type and dosage of a drug administered by using thesyringe pump 34 or theinfusion pump 35. - For example, a
treatment guideline model 44 that outputs a treatment guideline intended to optimize a balance between a urine flow rate and urinary oxygen is generated by using training data in which a treatment guideline or the like intended to optimize a balance between a urine flow rate and urinary oxygen is recorded. For example, atreatment guideline model 44 that outputs a treatment guideline or the like intended to bring the renal status index into a predetermined value is generated by using training data in which a treatment guideline or the like intended to bring the renal status index into a predetermined value is recorded. - The
treatment guideline model 44 may be an algorithm such as a decision tree created on the basis of a rule in accordance with, for example, a guideline related to a standard treatment method defined by medical society, each medical institution, or the like. - Retraining of the
treatment guideline model 44 may be performed by using a database (DB) in which treatment results of a plurality of patients are recorded. The retraining may be performed by a large computer or the like different from aninformation processing apparatus 20, and an updatedtreatment guideline model 44 may be delivered to theinformation processing apparatus 20 via a network. It is possible to implement theinformation processing system 10 that improves accuracy of thetreatment guideline model 44 as needed. -
Fig. 10 is a flowchart describing a flow of processing according to a program of a third embodiment. A flow of processing up to step S507 is the same as the flow of processing of a program in the first embodiment described with reference toFig. 2 , and therefore, the description thereof is omitted. - A
control unit 21 inputs, to thetreatment guideline model 44, the patient information acquired from an electronicmedical record system 17, thesyringe pump 34, and theinfusion pump 35, and the renal status index calculated in step S506 or step S507 to acquire the treatment guideline (step S521). - The
control unit 21 displays the renal status index and the treatment guideline on a display unit 25 (step S522). Thecontrol unit 21 determines whether or not to end the processing (step S509). Because a subsequent processing flow is the same as the processing flow of the program according to the embodiment described with reference toFig. 2 , the description thereof will be omitted. -
Figs. 11 and 12 are examples of a screen according to the third embodiment. On the screen illustrated inFig. 11 , in addition to a renalstatus index field 72, arenal status indicator 721, aconnection state field 71, and apatient information field 74, two syringe pump fields 771, two infusion pump fields 772, and aproposal field 78 are arranged. InFig. 11 , there is no proposal for the treatment guideline, and theproposal field 78 is blank. - In the syringe pump fields 771, types and setting states of drugs prepared in the syringe pumps 34 are displayed. "
Syringe pump 1" represents a state in which preparation for drug administration is completed. "Syringe pump 2" represents a state in which preparation for drug administration is not completed. In the infusion pump fields 772, types and administration rates of drugs prepared in the infusion pumps 35 are displayed. InFig. 11 , rightward triangles indicate that infusion is being injected into a body of the patient from "infusion pump 1" and "infusion pump 2". - In
Fig. 11 , there is no proposal for the treatment guideline, and theproposal field 78 is blank. InFig. 12 , a treatment guideline including two items of "stop ofinfusion pump 2" and "start ofsyringe pump 1" is displayed in theproposal field 78. According to the present embodiment, it is possible to provide theinformation processing system 10 that displays a treatment guideline - For example, in a case where a physician triple-taps the
proposal field 78, thecontrol unit 21 may transmit control signals to the syringe pumps 34 and the infusion pumps 35 to execute the treatment guideline displayed in theproposal field 78. It is possible to provide theinformation processing system 10 with which the physician can execute the displayed treatment guideline with a simple instruction. - The present embodiment relates to an
information processing system 10 that predicts a change in a renal status index. Description of portions common to the second embodiment will be omitted. -
Fig. 13 is an explanatory diagram describing arenal status model 42 of a fourth embodiment. Therenal status model 42 of the present embodiment receives an explanatory variable and outputs a time-series objective variable. That is, therenal status model 42 of the present embodiment outputs a predicted value related to an objective variable of a case where treatment, such as a current medication, is continued, in addition to an objective variable at the present time. - The
renal status model 42 is generated by machine learning by using a training database in which a large number of sets of explanatory variables and time-series data of objective variables are recorded. The explanatory variable may include time-series data such as a time-series change in vital sign data and a time-series change in dosage. As therenal status model 42 of the present embodiment, an algorithm suitable for processing time-series data, such as, for example, a long short term memory (LSTM) or a transformer, is used. A reinforcement learning method may be used. -
Figs. 14 and15 are examples of a screen according to the fourth embodiment. In the screen illustrated inFig. 14 , a predictedvalue field 79 is disposed to the right side of a renalstatus index field 72. InFig. 14 , a predicted value of a renal status index after six hours is displayed in the predictedvalue field 79. When receiving selection of a triangle disposed on the right side of "6 h", acontrol unit 21 displays a predicted value for a renal status index after 24 hours. - In the screen illustrated in
Fig. 15 , arenal status graph 75 is disposed under the renalstatus index field 72 and the predictedvalue field 79. The horizontal axis of therenal status graph 75 represents time. The vertical axis of therenal status graph 75 represents the dimensionless renal status index. - The
renal status graph 75 includes anactual value graph 752 and a predictedvalue graph 753. In theactual value graph 752, actual data of the renal status index is displayed. In the predictedvalue graph 753, predicted values of the renal status index after six hours, 24 hours, 48 hours, and 72 hours are plotted. The predictedvalue graph 753 has a long time-per-unit length on the horizontal axis as compare to theactual value graph 752. -
Fig. 15 indicates that the renal status index decreases to nearly half of a current level after six hours if a current treatment is continued. "Review of treatment is recommended" is displayed in aproposal field 78. A user can prevent acute kidney injury by avoiding a significant change in the renal status index by changing a drug or the like. - In the present embodiment, in step S503 and step S506 in the flowchart described with reference to
Fig. 2 , thecontrol unit 21 inputs an explanatory variable to therenal status model 42 described with reference toFig. 8 to acquire time-series renal medullary oxygen tension. - According to the present embodiment, it is possible to provide the
information processing system 10 that displays a predicted value of the renal status index. - The present embodiment relates to an
information processing system 10 including adrug model 43 that estimates a future objective variable. Description of portions common to the first embodiment will be omitted. -
Fig. 16 is an explanatory diagram describing thedrug model 43. Thedrug model 43 is a trained model that receives an explanatory variable described with reference toFig. 8 and the like and information related to a drug to be administered, and outputs a predicted value of an index at a time point when a predetermined time has elapsed after the drug is administered as scheduled. The index is a value that can be measured in real time, such as urinary oxygen tension, a urine flow rate, a mean blood pressure, a pulse pressure, a heart rate, or blood oxygen saturation, for example. The index may be an index that can be estimated in real time, such as an estimated value of renal artery blood flow or an estimated value of renal tissue oxygen tension. Thedrug model 43 may output a plurality of indices. - The
drug model 43 is generated by machine learning by using, for example, training data acquired by an animal experiment using pigs, as described in the first embodiment. In a case where safety of the drug to be administered is sufficiently ensured, training data in which a large number of sets of explanatory variables related to an actual patient and an index after medication are recorded may be used. Thedrug model 43 may be a rule-based algorithm created on the basis of a pharmacological effect of a drug. - There are individual differences in reaction to a drug. Even if the
drug model 43 generated on the basis of experimental data from pigs or data from a large number of past patients is used, it is difficult to accurately predict how each patient will react to the administered drug. - For prolonged surgery and whole body management in an ICU, a drug that affects a condition of kidneys may be administered repeatedly. By adjusting a drug dosage to the individual patient on the basis of a change in a physical condition after the drug administration, it is possible to avoid a sudden change in the condition of the patient.
- For example, in a case where a change in an index after a predetermined time has elapsed is larger than a prediction output from the
drug model 43 after administration of a drug according to a treatment guideline output from atreatment guideline model 44 as described with reference toFig. 9 , it can be judged that the patient is a type of patient having a strong reaction to the drug. A physician can prevent kidney injury by reducing subsequent dosage of the drug from an amount output from thetreatment guideline model 44. - A
control unit 21 may integrate a coefficient, which is calculated on the basis of a difference between a predicted value of an index after the drug administration, the predicted value being output from thedrug model 43, and an index actually measured after a predetermined time has elapsed after the drug administration, with respect to predicted values of indices output from thedrug model 43 from next time onwards, and display the predicted values. Thecontrol unit 21 may perform retraining of thedrug model 43 on the basis of a difference between the predicted value of the index after the drug administration, the predicted value being output from thedrug model 43, and the index actually measured after the drug administration. As described above, theinformation processing system 10 that outputs an index corresponding to an individual patient can be provided. -
Fig. 17 is a flowchart describing a flow of processing according to a program of a fifth embodiment. Thecontrol unit 21 acquires urine information from a urine measurement device 31 (step S541). Thecontrol unit 21 acquires circulatory dynamics information from a vital sign monitor 33 (step S542). Thecontrol unit 21 acquires patient information from an electronic medical record system 17 (step S543). As described above, the patient information includes, for example, age, sex, height, weight, a biochemical test result, a medical history, and a course of ongoing treatment, of the patient. - The
control unit 21 acquires information related to a drug scheduled to be administered (step S544). The information related to the drug scheduled to be administered is acquired from, for example, thetreatment guideline model 44 described with reference toFig. 9 . Thecontrol unit 21 may receive input of information related to a drug scheduled to be administered by a user. - The
control unit 21 inputs, to thedrug model 43, the explanatory variable and information related to the drug scheduled to be administered to the patient, and acquires a predictive index at a time after the predetermined time has elapsed after the drug is administered (step S545). Thecontrol unit 21 determines whether or not the drug is administered according to a schedule acquired in step S544 (step S546). A status of the administration of the drug is acquired from, for example, asyringe pump 34 or aninfusion pump 35. Thecontrol unit 21 may receive an input by the user regarding a drug administration status. - If it is determined that the drug administration as scheduled has not been performed (NO in step S546), the
control unit 21 returns to step S541. If it is determined that the drug administration as scheduled has been performed (YES in step S546), thecontrol unit 21 waits for the predetermined time for determining an effect of the drug to pass (step S547). - The
control unit 21 acquires a measured value of an index on the basis of latest urine information or circulatory dynamics information (step S548). Thecontrol unit 21 calculates a difference between the predicted value acquired in step S545 and the measured value acquired in step S548 (step S549). Thecontrol unit 21 determines whether or not the difference is equal to or smaller than a predetermined threshold value (step S550). - If it is determined that the difference is not equal to or smaller than the threshold value (NO in step S550), the
control unit 21 corrects thedrug model 43 so that output data output from thedrug model 43 approaches the measured value (step S551). Specifically, for example, thecontrol unit 21 sets a display program so as to output a correction value obtained by integrating, with respect to the output from thedrug model 43, a coefficient obtained by dividing the measured value acquired in step S548 by the predicted value acquired in step S545. Thecontrol unit 21 may receive an input by the user regarding a method for correcting the output from thedrug model 43. Thecontrol unit 21 may perform retraining of thedrug model 43. - If it is determined that the difference is equal to or smaller than the threshold value (YES in step S550), or after an end of step S551, the
control unit 21 determines whether or not to end the processing (step S552). If thecontrol unit 21 determines not to end the processing (NO in step S552), thecontrol unit 21 returns to step S541. If thecontrol unit 21 determines to end the processing (YES in step S552), thecontrol unit 21 ends the processing. - According to the present embodiment, it is possible to provide the
information processing system 10 that predicts an effect of a drug on an individual patient. -
Fig. 18 is an explanatory diagram describing a configuration of aninformation processing system 10 of a sixth embodiment. The present embodiment relates to a mode in which aninformation processing apparatus 20 is implemented by causing a general-purpose computer 90 and aprogram 97 to operate in combination. Description of portions common to the first embodiment will be omitted. - The
computer 90 includes areading unit 29 in addition to the above-describedcontrol unit 21,main storage device 22,auxiliary storage device 23,communication unit 24,display unit 25,input unit 26, and bus. - A
program 97 is recorded in aportable recording medium 96. Thecontrol unit 21 reads theprogram 97 via thereading unit 29 and saves theread program 97 in theauxiliary storage device 23. In addition, thecontrol unit 21 may read theprogram 97 stored in asemiconductor memory 98 such as a flash memory mounted in thecomputer 90. Furthermore, thecontrol unit 21 may download theprogram 97 from another server computer (not illustrated) connected via thecommunication unit 24 and a network (not illustrated) and save the downloadedprogram 97 in theauxiliary storage device 23. - The
program 97 is installed as a control program for thecomputer 90 and is loaded into themain storage device 22 to be executed. As described above, theinformation processing apparatus 20 described in the first embodiment is implemented. Theprogram 97 of the present embodiment is an example of a program product. - The technical features (components) described in the respective embodiments can be combined with each other, and new technical features can be formed by the combination.
- It should be understood that the embodiments disclosed herein are examples in all respects and are not restrictive. The scope of the present invention is indicated not by the above meaning but by the claims, and is intended to include all changes within the meaning and scope equivalent to the claims.
-
- 10
- Information processing system
- 17
- Electronic medical record system
- 20
- Information processing apparatus
- 21
- Control unit
- 22
- Main storage device
- 23
- Auxiliary storage device
- 24
- Communication unit
- 25
- Display unit
- 26
- Input unit
- 29
- Reading unit
- 31
- Urine measurement device
- 311
- Urine sensor
- 33
- Vital sign monitor
- 34
- Syringe pump
- 35
- Infusion pump
- 42
- Renal status model
- 43
- Drug model
- 44
- Treatment guideline model
- 71
- Connection state field
- 72
- Renal status index field
- 721
- Renal status indicator
- 731
- Urinary oxygen tension field
- 732
- Urine flow rate field
- 733
- Mean blood pressure field
- 734
- Heart rate field
- 735
- Arterial oxygen saturation field
- 736
- Inhaled oxygen concentration field
- 74
- Patient information field
- 75
- Renal status graph
- 751
- Range indicator
- 752
- Actual value graph
- 753
- Predicted value graph
- 761
- Condition selection field
- 762
- Correlation graph field
- 771
- Syringe pump field
- 772
- Infusion pump field
- 78
- Proposal field
- 79
- Predicted value field
- 90
- Computer
- 96
- Portable recording medium
- 97
- Program
- 98
- Semiconductor memory
Claims (25)
- A program that causes a computer to execute processing comprising:acquiring urine information including urinary oxygen tension;calculating a renal status index on the basis of the urine information; andoutputting the renal status index.
- The program according to claim 1, wherein
the urine information includes at least one or more of a urinary output, a urine flow rate, urinary color, urine absorbance, a urinary sodium amount, and a urinary creatinine amount, in addition to the urinary oxygen tension. - The program according to claim 1 or 2, whereinthe renal status index is an index related to an estimated value of renal artery blood flow,the urine information includes at least one or more of the urinary oxygen tension and a urine flow rate, andthe program calculates the renal status index on the basis of the urinary oxygen tension and the urine flow rate, by using a predetermined algorithm.
- The program according to claim 1 or 2, whereinthe renal status index is an index related to an estimated value of renal tissue oxygen tension,the urine information includes at least one or more of the urinary oxygen tension and a urine flow rate, andthe program calculates the renal status index on the basis of the urinary oxygen tension and the urine flow rate, by using a predetermined algorithm.
- The program according to claim 1 or 2, whereinthe renal status index is an index related to an estimated value of a glomerular filtration rate,the urine information includes at least one or more of the urinary oxygen tension and a urine flow rate, andthe program calculates the renal status index on the basis of the urinary oxygen tension and the urine flow rate, by using a predetermined algorithm.
- The program according to any one of claims 1 to 5,
outputting urine information and vital sign data together with the renal status index. - The program according to claim 1 or 2,acquiring circulatory dynamics information, andcalculating the renal status index on the basis of the urine information and the circulatory dynamics information.
- The program according to claim 7, wherein
the circulatory dynamics information includes at least one or more of a mean blood pressure, a pulse pressure, a heart rate, blood oxygen saturation, and tissue oxygen saturation. - The program according to claim 7 or 8, whereinthe renal status index is an index related to an estimated value of renal artery blood flow,the urine information includes at least one or more of the urinary oxygen tension and a urine flow rate,the circulatory dynamics information includes a mean blood pressure, a pulse pressure, and a heart rate, andthe program calculates the renal status index on the basis of the urinary oxygen tension, the urine flow rate, the mean blood pressure, the pulse pressure, and the heart rate, by using a predetermined algorithm.
- The program according to claim 7 or 8, whereinthe renal status index is an index related to an estimated value of renal tissue oxygen tension,the urine information includes at least one or more of the urinary oxygen tension and a urine flow rate,the circulatory dynamics information includes a mean blood pressure, a pulse pressure, and a heart rate, andthe program calculates the renal status index on the basis of the urinary oxygen tension, the urine flow rate, the mean blood pressure, the pulse pressure, and the heart rate, by using a predetermined algorithm.
- The program according to claim 7 or 8, whereinthe renal status index is an index related to an estimated value of a glomerular filtration rate,the urine information includes at least one or more of the urinary oxygen tension and a urine flow rate,the circulatory dynamics information includes a mean blood pressure, a pulse pressure, and a heart rate, andthe program calculates the renal status index on the basis of the urinary oxygen tension, the urine flow rate, the mean blood pressure, the pulse pressure, and the heart rate, by using a predetermined algorithm.
- The program according to any one of claims 7 to 11,
outputting the urine information, the circulatory dynamics information, and vital sign data together with the renal status index. - The program according to any one of claims 1 to 12,repeatedly calculating the renal status index in time series, andoutputting a newly calculated renal status index by using a relative value with a renal status index calculated in past.
- The program according to any one of claims 1 to 13,acquiring information related to a drug scheduled to be administered,calculating a predicted value of the renal status index of a case where the drug administration is executed, andoutputting the predicted value.
- The program according to any one of claims 1 to 13,calculating a predicted value of the renal status index at a time after a predetermined time has elapsed is executed, andoutputting the predicted value.
- The program according to claim 15,calculating a difference between the predicted value and the renal status index at the time after the predetermined time has elapsed, andcalculating a predicted value of a renal status index in a future by using the difference.
- The program according to any one of claims 1 to 16,
outputting a treatment guideline on the basis of the renal status index. - The program according to claim 17, wherein
the treatment guideline is a treatment guideline intended to bring a relation between a urine flow rate and urinary oxygen tension into a predetermined status. - The program according to claim 17, wherein
the treatment guideline is a treatment guideline intended to bring a renal status index into a predetermined value. - The program according to any one of claims 17 to 19,
causing a drug administration device to administer a drug on the basis of the treatment guideline. - The program according to claim 20,repeatedly calculating the renal status index in time series, andchanging an amount of a drug that the drug administration device is caused to administer on the basis of a change in the renal status index after the drug administration device administers the drug.
- The program according to any one of claims 17 to 21,acquiring, in a case where a renal status index and a treatment guideline are input, a predicted value of a renal status index after drug administration based on the treatment guideline is executed, by using a trained model that outputs a renal status index after drug administration based on the treatment guideline is executed,calculating a difference between the predicted value and an actual renal status index after drug administration based on the treatment guideline is executed, andperforming retraining of the trained model on the basis of the difference.
- The program according to any one of claims 17 to 21,acquiring, in a case where a renal status index and a treatment guideline are input, a predicted value of a renal status index after drug administration based on the treatment guideline is executed, by using a trained model that outputs a renal status index after drug administration based on the treatment guideline is executed,calculating a difference between the predicted value and an actual renal status index after drug administration based on the treatment guideline is executed, andadjusting output data of the trained model on the basis of the difference.
- An information processing method, whereina computer execute processing includingacquiring urine information including urinary oxygen tension,calculating a renal status index on the basis of the urine information, andoutputting the renal status index.
- An information processing apparatus comprising a control unit, whereinthe control unitacquires urine information including urinary oxygen tension,calculates a renal status index on the basis of the urine information, andoutputs the renal status index.
Applications Claiming Priority (2)
| Application Number | Priority Date | Filing Date | Title |
|---|---|---|---|
| JP2022061027 | 2022-03-31 | ||
| PCT/JP2023/008084 WO2023189208A1 (en) | 2022-03-31 | 2023-03-03 | Program, information processing method, and information processing apparatus |
Publications (2)
| Publication Number | Publication Date |
|---|---|
| EP4491132A1 true EP4491132A1 (en) | 2025-01-15 |
| EP4491132A4 EP4491132A4 (en) | 2025-06-18 |
Family
ID=88201259
Family Applications (1)
| Application Number | Title | Priority Date | Filing Date |
|---|---|---|---|
| EP23779237.9A Pending EP4491132A4 (en) | 2022-03-31 | 2023-03-03 | Program, information processing method, and information processing apparatus |
Country Status (4)
| Country | Link |
|---|---|
| US (1) | US20250014759A1 (en) |
| EP (1) | EP4491132A4 (en) |
| JP (1) | JPWO2023189208A1 (en) |
| WO (1) | WO2023189208A1 (en) |
Family Cites Families (6)
| Publication number | Priority date | Publication date | Assignee | Title |
|---|---|---|---|---|
| WO2013049697A1 (en) * | 2011-09-29 | 2013-04-04 | Mayo Foundation For Medical Education And Research | Aromatic-cationic peptides and methods for using same |
| EP3282948A4 (en) * | 2015-04-15 | 2019-04-03 | The Johns Hopkins University | URINE DETECTION SYSTEM AND DEVICES AND METHOD FOR MONITORING RENAL FUNCTION |
| CN109152532B (en) * | 2016-06-10 | 2021-12-14 | 泰尔茂株式会社 | Oxygen measurement device |
| US11660032B2 (en) * | 2017-09-07 | 2023-05-30 | SWSA Medical Ventures, LLC | Catheter assemblies, oxygen-sensing assemblies, and related methods |
| JP7301291B2 (en) | 2019-10-15 | 2023-07-03 | 株式会社塚田メディカル・リサーチ | Catheter and oxygen partial pressure measurement method |
| EP4115815A4 (en) * | 2020-03-27 | 2023-08-09 | TERUMO Kabushiki Kaisha | DEVICE FOR EVALUATION OF BIOLOGICAL FUNCTIONS AND METHOD FOR ESTIMATION OF BIOLOGICAL FUNCTIONS |
-
2023
- 2023-03-03 JP JP2024511559A patent/JPWO2023189208A1/ja active Pending
- 2023-03-03 WO PCT/JP2023/008084 patent/WO2023189208A1/en not_active Ceased
- 2023-03-03 EP EP23779237.9A patent/EP4491132A4/en active Pending
-
2024
- 2024-09-19 US US18/890,054 patent/US20250014759A1/en active Pending
Also Published As
| Publication number | Publication date |
|---|---|
| US20250014759A1 (en) | 2025-01-09 |
| EP4491132A4 (en) | 2025-06-18 |
| JPWO2023189208A1 (en) | 2023-10-05 |
| WO2023189208A1 (en) | 2023-10-05 |
Similar Documents
| Publication | Publication Date | Title |
|---|---|---|
| US12183467B2 (en) | System and methods for transitioning patient care from signal based monitoring to risk based monitoring | |
| US11723562B2 (en) | Method, system and computer program product for CGM-based prevention of hypoglycemia via hypoglycemia risk assessment and smooth reduction insulin delivery | |
| EP3779994B1 (en) | Method of continuous prediction of patient severity of illness and mortality | |
| Gross et al. | Performance evaluation of the MiniMed® continuous glucose monitoring system during patient home use | |
| EP2257217B1 (en) | Hemodynamic monitors and alarms | |
| US5921920A (en) | Intensive care information graphical display | |
| JP4514141B2 (en) | System for determining insulin dose using insulin ratio of carbohydrate and insulin sensitivity factor | |
| EP2596448B1 (en) | System and method considering the effect of physical activity on the glucoregulatory system | |
| US20160203275A1 (en) | Systems, devices, and methods for analyte monitoring and/or drug delivery | |
| US20080183057A1 (en) | Display, data storage and alarm features of an adaptive oxygen controller | |
| US20210169744A1 (en) | Systems and methods for dynamic control of enteral feeding according to energy expenditure | |
| US20060094947A1 (en) | Method, system, and computer program product for the evaluation of glycemic control in diabetes from self-monitoring data | |
| US20080108888A1 (en) | Diabetes care management system | |
| US9092553B2 (en) | Method and system for calculating daily weighted averages of glucose measurements (or derived quantities) with time based-weights | |
| US20080126124A1 (en) | Quantitative assessment, evaluation and triage of the health status of an individual | |
| WO2009086216A1 (en) | Method and apparatus for providing treatment profile management | |
| IL264507A (en) | Systems and methods for transitioning patient care from signal-based monitoring to risk-based monitoring | |
| EP2763029A1 (en) | Biological information monitor and biological information monitoring system | |
| JP7076967B2 (en) | Data processing equipment, data processing method and data processing program | |
| WO2022209694A1 (en) | Measurement device, measurement system, information processing method, and program | |
| US20080076970A1 (en) | Fluid management measurement module | |
| US20250014759A1 (en) | Program, information processing method, and information processing apparatus | |
| Omamageswari et al. | Patient iv and oxygen control system using iot | |
| JP7761910B1 (en) | Anesthetic effect prediction system and program | |
| Doufas et al. | An Overview of TCI and TIVA. |
Legal Events
| Date | Code | Title | Description |
|---|---|---|---|
| STAA | Information on the status of an ep patent application or granted ep patent |
Free format text: STATUS: THE INTERNATIONAL PUBLICATION HAS BEEN MADE |
|
| PUAI | Public reference made under article 153(3) epc to a published international application that has entered the european phase |
Free format text: ORIGINAL CODE: 0009012 |
|
| STAA | Information on the status of an ep patent application or granted ep patent |
Free format text: STATUS: REQUEST FOR EXAMINATION WAS MADE |
|
| 17P | Request for examination filed |
Effective date: 20241008 |
|
| AK | Designated contracting states |
Kind code of ref document: A1 Designated state(s): AL AT BE BG CH CY CZ DE DK EE ES FI FR GB GR HR HU IE IS IT LI LT LU LV MC ME MK MT NL NO PL PT RO RS SE SI SK SM TR |
|
| REG | Reference to a national code |
Ref country code: DE Ref legal event code: R079 Free format text: PREVIOUS MAIN CLASS: A61B0010000000 Ipc: G16H0050300000 |
|
| A4 | Supplementary search report drawn up and despatched |
Effective date: 20250519 |
|
| RIC1 | Information provided on ipc code assigned before grant |
Ipc: A61B 5/20 20060101ALI20250513BHEP Ipc: A61B 5/145 20060101ALI20250513BHEP Ipc: A61B 5/026 20060101ALI20250513BHEP Ipc: A61B 10/00 20060101ALI20250513BHEP Ipc: G16H 50/30 20180101AFI20250513BHEP |
|
| DAV | Request for validation of the european patent (deleted) | ||
| DAX | Request for extension of the european patent (deleted) |