EP4485245A1 - Incident event cause identification system and incident event cause identification method - Google Patents
Incident event cause identification system and incident event cause identification method Download PDFInfo
- Publication number
- EP4485245A1 EP4485245A1 EP24160245.7A EP24160245A EP4485245A1 EP 4485245 A1 EP4485245 A1 EP 4485245A1 EP 24160245 A EP24160245 A EP 24160245A EP 4485245 A1 EP4485245 A1 EP 4485245A1
- Authority
- EP
- European Patent Office
- Prior art keywords
- cause
- log information
- processing unit
- causality graph
- incident
- Prior art date
- Legal status (The legal status is an assumption and is not a legal conclusion. Google has not performed a legal analysis and makes no representation as to the accuracy of the status listed.)
- Granted
Links
Images





Classifications
-
- G—PHYSICS
- G06—COMPUTING OR CALCULATING; COUNTING
- G06F—ELECTRIC DIGITAL DATA PROCESSING
- G06F21/00—Security arrangements for protecting computers, components thereof, programs or data against unauthorised activity
- G06F21/50—Monitoring users, programs or devices to maintain the integrity of platforms, e.g. of processors, firmware or operating systems
- G06F21/55—Detecting local intrusion or implementing counter-measures
- G06F21/552—Detecting local intrusion or implementing counter-measures involving long-term monitoring or reporting
-
- G—PHYSICS
- G06—COMPUTING OR CALCULATING; COUNTING
- G06F—ELECTRIC DIGITAL DATA PROCESSING
- G06F11/00—Error detection; Error correction; Monitoring
- G06F11/07—Responding to the occurrence of a fault, e.g. fault tolerance
- G06F11/0703—Error or fault processing not based on redundancy, i.e. by taking additional measures to deal with the error or fault not making use of redundancy in operation, in hardware, or in data representation
- G06F11/079—Root cause analysis, i.e. error or fault diagnosis
-
- G—PHYSICS
- G05—CONTROLLING; REGULATING
- G05B—CONTROL OR REGULATING SYSTEMS IN GENERAL; FUNCTIONAL ELEMENTS OF SUCH SYSTEMS; MONITORING OR TESTING ARRANGEMENTS FOR SUCH SYSTEMS OR ELEMENTS
- G05B23/00—Testing or monitoring of control systems or parts thereof
- G05B23/02—Electric testing or monitoring
- G05B23/0205—Electric testing or monitoring by means of a monitoring system capable of detecting and responding to faults
- G05B23/0259—Electric testing or monitoring by means of a monitoring system capable of detecting and responding to faults characterized by the response to fault detection
- G05B23/0264—Control of logging system, e.g. decision on which data to store; time-stamping measurements
-
- G—PHYSICS
- G06—COMPUTING OR CALCULATING; COUNTING
- G06F—ELECTRIC DIGITAL DATA PROCESSING
- G06F11/00—Error detection; Error correction; Monitoring
- G06F11/07—Responding to the occurrence of a fault, e.g. fault tolerance
- G06F11/0703—Error or fault processing not based on redundancy, i.e. by taking additional measures to deal with the error or fault not making use of redundancy in operation, in hardware, or in data representation
- G06F11/0751—Error or fault detection not based on redundancy
-
- G—PHYSICS
- G06—COMPUTING OR CALCULATING; COUNTING
- G06F—ELECTRIC DIGITAL DATA PROCESSING
- G06F11/00—Error detection; Error correction; Monitoring
- G06F11/07—Responding to the occurrence of a fault, e.g. fault tolerance
- G06F11/0703—Error or fault processing not based on redundancy, i.e. by taking additional measures to deal with the error or fault not making use of redundancy in operation, in hardware, or in data representation
- G06F11/0766—Error or fault reporting or storing
-
- G—PHYSICS
- G05—CONTROLLING; REGULATING
- G05B—CONTROL OR REGULATING SYSTEMS IN GENERAL; FUNCTIONAL ELEMENTS OF SUCH SYSTEMS; MONITORING OR TESTING ARRANGEMENTS FOR SUCH SYSTEMS OR ELEMENTS
- G05B2219/00—Program-control systems
- G05B2219/20—Pc systems
- G05B2219/24—Pc safety
- G05B2219/24065—Real time diagnostics
Definitions
- the present invention relates to an incident event cause identification system and an incident event cause identification method.
- Patent Literature 1 describes a technique of storing one or more attack patterns that are types obtained by classifying a group of alerts anticipated to occur when an industrial control system is subjected to a cyberattack into sequences based on a temporal stage of the cyberattack and sequences based on a spatial stage of an asset attacked by the cyberattack, and diagnosing the presence or absence of a cyberattack on the industrial control system on the basis of consistency between the group of alerts and the attack patterns.
- Patent Literature 1 JP 2022-86181 A
- Patent Literature 1 it is possible to determine whether an alert is an attack or a failure as a chain relationship of alerts is defined as an attack pattern or a failure pattern in advance.
- logs of unmonitored devices are hardly utilized for analysis, and utilizing these logs for analysis depends on knowledge of an analyst.
- an object of the present invention to provide an incident event cause identification system and an incident event cause identification method which are capable of efficiently performing incident cause identification.
- the present application includes a plurality of means for solving the above problem, but as an example thereof, provided is an incident event cause identification system that includes a device log information holding unit that holds log information output from a target device, a causality graph holding unit that holds a causality graph in which a relationship between an incident event and a cause thereof is associated in advance, an incident detection processing unit that detects an incident event in the target device, a necessary log information determination processing unit that extracts the causality graph of an associated type for the incident event detected by the incident detection processing unit, and determines device log information necessary for cause identification based on the extracted causality graph, a necessary log information collection processing unit that collects the device log information determined by the necessary log information determination processing unit, a cause analysis processing unit that analyzes a cause of an incident event by using the device log information collected by the necessary log information collection processing unit and the causality graph, and an output unit that outputs the cause identified by the cause analysis processing unit or an analysis status.
- the present invention it is possible to extract only information necessary for an alert from among log information can be used in a device and identify a cause. Accordingly, a time for information scrutiny is reduced, and an information storage capacity is optimized, and thus it is possible to efficiently identify a cause of an incident.
- FIG. 1 illustrates an overall configuration example of an incident event cause identification system of the present example.
- the incident event cause identification system of the present example is configured by connecting one or a plurality of target devices (A device 2a, B device 2b, ..., N device 2n: N is any integer) to a cause analysis device 1 via a network.
- the cause analysis device 1 detects the occurrence of an incident in each of the devices 2a to 2n, collects device log information, and analyzes a cause.
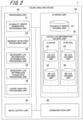
- FIG. 2 illustrates a configuration example of the cause analysis device 1.
- the cause analysis device 1 includes a processing unit 20, a storage unit 30, an input/output unit 40, and a communication unit 50.
- the processing unit 20 includes a causality graph generation processing unit 21, an incident detection processing unit 22, a necessary log information determination processing unit 23, a necessary log information collection processing unit 24, and a cause analysis processing unit 25.
- Each of these processing units 21 to 25 is configured on a work memory (not illustrated) included in the processing unit 20 such that the processing unit 20 executes, for example, a program held by the processing unit 20 or the storage unit 30, that is, a program implementing an incident event cause identification method.
- the processing unit 20 includes, for example, an arithmetic device (computer) including a central processing unit (CPU) and the like.
- the causality graph generation processing unit 21 performs a process of generating a causality graph regarding an incident that is information in which a relationship between an incident event and a cause thereof is associated.
- the causality graph is created by a plurality of classifications for each detection node or each cause node that is an event indicating an attack or a failure.
- the classification here includes, for example, a failure occurrence likelihood related to a command, a failure occurrence likelihood related to device state checking, and the like.
- the causality graph may be created by an input from an input terminal by an analyst or a SOC-responsible personnel who monitors the incident in advance or may be automatically created by reading publicly known information summarizing causes of incidents.
- each cause node of the created causality graph and a determination condition thereof are changed, basically as a parameter tuning part, by the SOC-responsible personnel as needed.
- the SOC-responsible personnel may add or correct the detection node or the cause node when a new threat is found.
- the causality graph generated by the causality graph generation processing unit 21 is held in a causality graph holding unit 31 of the storage unit 30.
- the incident detection processing unit 22 detects the occurrence of an incident in the target devices (A device 2a, B device 2b, ..., N device 2n). Information of the detected incident is transmitted to the necessary log information determination processing unit 23.
- the necessary log information determination processing unit 23 acquires the causality graph associated with the type of the detected incident and determines a device log necessary for analysis.
- the necessary log information collection processing unit 24 collects the device log necessary for the analysis of the incident from the target devices (A device 2a, B device 2b, ..., N device 2n) .
- the cause analysis processing unit 25 executes a cause analysis process by using the causality graph and the device log information.
- the storage unit 30 includes a causality graph holding unit 31 and a device log information holding unit 32.
- the causality graph holding unit 31 performs a causality graph holding process of holding the causality graph generated by the causality graph generation processing unit 21 as a causality table.
- the causality graph is generated in advance and held in the causality graph holding unit 31.
- An example of the causality table will be described later with reference to FIG. 9 .
- the device log information holding unit 32 performs a device log information holding process of classifying the log information of each target device for each type and holding the log information as a log information table.
- the device log information holding unit 32 includes an AA log holding unit 33 that holds an AA log of the A device 2a and an AB log holding unit 34 that holds an AB log of the A device 2a.
- the device log information holding unit 32 includes a BA log holding unit 35 that holds a BA log of the B device 2a and a BB log holding unit 36 that holds a BB log of the A device 2a.
- the device log information holding unit 32 sequentially collects and holds the device log information.
- An example of the log information table will be described later with reference to FIG. 8 .
- the input/output unit 40 performs an output process of the analysis result in the cause analysis processing unit 25. Examples of the output process performed by the input/output unit 40 include a process of displaying an analysis result on a display. Further, the input/output unit 40 performs an input process of information necessary for analysis or the like.
- FIG. 3 is a flowchart illustrating a flow of the processes performed by the units of the cause analysis device 1.
- the incident detection processing unit 22 detects the occurrence of an incident in the target device, and transmits information of the detected incident to the necessary log information determination processing unit 23 (step S101).
- the necessary log information determination processing unit 23 that has received the information of the incident acquires the causality graph associated with the type of the detected incident from the causality graph holding unit 31 (step S102).
- the necessary log information determination processing unit 23 determines the device log necessary for the cause analysis from the information of the incident (step S103). After this determination, the necessary log information collection processing unit 24 collects necessary device log information from the device log information holding unit 32 (step S104). This collection process is a necessary log information collection process.
- the necessary log information determination processing unit 23 transmits the acquired causality graph and the collected necessary device log information to the cause analysis processing unit 25 (step S105) .
- the cause analysis processing unit 25 that has received these pieces of information performs the cause analysis process by using the received causality graph and device log information (step S106).
- the cause analysis processing unit 25 transmits an analysis process result for the incident cause to the input/output unit 40 (step S107).
- the input/output unit 40 executes the output process (display or the like) of the analysis process result for the incident cause.
- a display example of the analysis process result will be described later with reference to FIG. 11 .
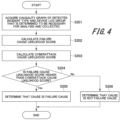
- FIG. 4 is a flowchart illustrating details of the cause analysis process in the cause analysis processing unit 25.
- the cause analysis processing unit 25 first acquires the causality graph of the detected incident type and the device log group that is determined to be necessary for analysis and collected (step S201) .
- the cause analysis processing unit 25 calculates a score of a failure cause likelihood of the device (step S202). Further, the cause analysis processing unit 25 calculates a score of a cyberattack cause likelihood (step S203). The details of these score calculation processes will be described later with reference to FIG. 5 .
- the cause analysis processing unit 25 compares the failure cause likelihood score obtained in step S202 with the cyberattack cause likelihood score obtained in step S20. In this comparison, the cause analysis processing unit 25 determines whether or not the failure cause likelihood score is higher than the cyberattack cause likelihood score (step S204).
- the cause analysis processing unit 25 determines that it is the failure-caused incident (step S205). On the other hand, in a case in which the failure cause likelihood score is not higher than the cyberattack cause likelihood score in the determination in step S204 (No in step S204), the cause analysis processing unit 25 determines that the incident is not caused by the failure (step S206).
- FIG. 5 is a flowchart illustrating the details of the calculation of the score of the failure cause likelihood of the device (step S202 in FIG. 4 ) and the calculation of the score of the cyberattack cause likelihood (step S203 in FIG. 4 ).
- the calculation of the score of the failure cause likelihood of the device and the calculation of the score of the cyberattack cause likelihood are executed through the same processing procedure.
- the cause analysis processing unit 25 first acquires the causality graph of the detected incident type and the device log group that is determined to be necessary for analysis and collected (step S301).
- the cause analysis processing unit 25 selects one piece of device log information from the collected device log group and acquires the log information group in a designation range (step S302).
- a range (designation range) for acquiring the log information group is designated in advance.
- the designation range may be designated each time a work is performed.
- the cause analysis processing unit 25 acquires a determination condition of the log information from the acquired causality graph (step S303). Thereafter, the cause analysis processing unit 25 searches for the presence or absence of a log that satisfies the determination condition from the log information group, and calculates the degree of relevance of the causality graph designation (step S304).
- step S305 determines whether there is device log information for which a score has not been calculated. In a case in which it is determined in step S305 that there is device log information for which a score has not been calculated (Yes in step S305), the cause analysis processing unit 25 returns to step S302 and performs the process for other device log information.
- step S305 In a case in which it is determined in step S305 that there is no device log information for which a score has not been calculated (No in step S305), the cause analysis processing unit 25 acquires a relational condition (AND/OR) between the device log information from the causality graph (step S306).
- the cause analysis processing unit 25 calculates the degree of relevance of the device log information in accordance with the acquired relational condition, and calculates the cause likelihood score (step S307).
- the cause likelihood score includes the failure cause likelihood score and the cyberattack cause likelihood score.
- the method of calculating the score for example, as a method of calculating the relational condition between the device log information, in the case of the AND condition, the minimum value of each degree of relevance is taken as the score. Further, in the case of the OR condition, the maximum value of each degree of relevance is taken as a score.
- FIGS. 6 and 7 show examples of the causality graphs.
- FIG. 6 is a causality graph of the failure cause
- FIG. 7 is a causality graph of the cyberattack cause.
- a failure 411 of a command issuance source a transmission device failure 412, a command reception device failure 413, a command execution device failure 414, ..., are included as the detection node of one type of the incident.
- command issuance-related failure occurrence 431 is obtained as the cause node, and invalid command issuance 441 is registered as an upper node.
- a statusdetermining device failure 421, a status sensor failure 422, ..., and the like are included as another type of detection node of the incident.
- status checking-related failure occurrence 432 is obtained as the cause node, and invalid terminal status checking 442 is registered as an upper node.
- an incident type "terminal status-inconsistent command issuance detection" 400a is registered in the causality graph by the OR condition of the invalid command issuance 441 and the invalid terminal status checking 442.
- an invalid command parameter range scan function 461, a sensor value/control value parameter range scan 462, ..., and the like are included as the detection node of another type of incident.
- functional safety-related command execution 492 is obtained by the AND condition of the invalid command execution attempt 481 and the functional safety design circumvention attempt 482.
- invalid control value/sensor value network (NW) intrusion 471 terminal status-holding data tampering 472, sensor function tampering 473, ..., and the like are included as the detection node of still another type of incident.
- NW invalid control value/sensor value network
- terminal status tampering attempt 483 is obtained as the cause node
- terminal status tampering 493 is further obtained as an upper node of the cause node.
- an incident type "terminal status-inconsistent command issuance detection" 400b is registered in the causality graph by the OR condition of the functional safety-unrelated command issuance 491, the functional safety-related command execution 492, and terminal status tampering 493.
- FIG. 8 illustrates an example of the log information table held by the device log information holding unit 32.
- the log information table is generated for each of the log information holding units 33, 34, 35, and 36 illustrated in FIG. 2 , and includes any number of AA log information tables 500a to ZZ log information tables 500z.
- one log information table includes a log information table ID 501, device information 502, date information 503, log information 504, and response department information 505.
- the log information table ID 501 is an identification number assigned to each log information table.
- the device information 502 is an address of the target device serving as a collection source of the device log information.
- the date information 503 is a date and time when the device log information is collected.
- the log information 504 is actually collected device log information.
- the response department information 505 is information of a department capable of performing determination on the associated device log information.
- response department information 505 capable of performing the determination is associated and held as described above, it is possible to determine the incident in detail in the associated department. For example, when the cause is a failure, information of the department capable of performing determination on the failure is recorded, and thus the failure can be handled.
- FIG. 9 illustrates an example of the causality graph information table 600 held by the causality graph holding unit 31.
- the causality graph information table 600 includes incident type information 601, a graph ID 602, device log information 603, a log table ID 604, a determination condition 605, and a degree of relevance calculation coefficient 606.
- the incident type information 601 is an incident type.
- the incident type "terminal status-inconsistent command issuance detection" or the like is stored.
- the graph ID 602 is an identification number assigned to each causality graph.
- the device log information 603 is device log information of a determination source of the causality. For example, it is information such as an A device AB log.
- the log table ID 604 is a log table ID holding the device log information indicated by the device log information 603.
- the determination condition 605 indicates a detection parameter necessary for determination.
- the degree of relevance calculation coefficient 606 indicates a coefficient value for calculating the degree of relevance.
- the causality graph illustrated in FIGS. 6 and 7 is generated on the basis of the information of the causality graph information table 600.
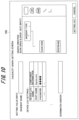
- FIG. 10 illustrates an example of a causality graph setting screen 700 displayed on the display unit constituting the input/output unit 40 of the cause analysis device 1 when the causality graph is generated by the causality graph generation processing unit 21.
- the causality graph setting screen 700 includes an input field of an incident name, the details of device log settings, and an input field of a determination condition as setting value inputs, and a responsible personnel (analyst) working on the setting screen 700 can input these details.
- the responsible personnel can create the causality graph illustrated in FIGS. 6 and 7 by inputting the determination conditions (the AND condition, the OR condition, and the like) of these nodes and a connection line indicating a connection relationship of each node.
- causality graph setting screen 700 On the lower right of the causality graph setting screen 700, there are a "setting OK” button and a “cancel” button, and when the responsible personnel selects the "setting OK” button, the causality graph created on the causality graph setting screen 700 is held in the causality graph holding unit 31.
- FIG. 11 illustrates an example in which a cause analysis result screen 800 of the cause analysis processing unit 25 is displayed on the display unit constituting the input/output unit 40.
- the cause analysis result screen 800 includes a display field of a cause of a detected incident, a display field of a failure cause score, and a display field of a cyberattack cause score.
- Each score is a score obtained when the cause analysis process is performed in the cause analysis processing unit 25, and the cause of the detected incident (the failure cause or the cyberattack cause) is displayed in the display field of the cause of the detected incident on the basis of the determination of step S204 of the flowchart of FIG. 4 with the values of both scores.
- the analysis causality graph (the lower left in FIG. 11 ) used for the analysis and a list of analyzed device logs (the lower right in FIG. 11 ) are displayed. Further, in FIG. 11 , the texts in the analysis causality graph are omitted, but the details of the analysis causality graph are actually displayed in the form illustrated in FIGS. 6 and 7 .
- Download buttons are displayed at portions in which the analysis causality graph and the list of device logs are displayed.
- the responsible personnel can download the details of the analysis causality graph (for example, the information illustrated in FIG. 9 ) and download the details of the device logs (for example, the information illustrated in FIG. 8 ), and then cause the details to be displayed on the screen.
- a result print button is provided on the cause analysis result screen 800, and the cause analysis result can be printed by the operation of the responsible personnel.
- the incident event cause identification system of the present example it is possible to extract only information necessary for the alert from among various types of log information that can be used in the device and identify the cause. Accordingly, a time for information scrutiny is reduced, and an information storage capacity is optimized, and thus it is possible to efficiently identify a cause of an incident. Further, it is possible to appropriately identify the cause without being affected by the skill of the responsible personnel (analyst).
- the cause analysis processing unit 25 calculates the failure cause likelihood score and the attack cause likelihood score by using the device log information collected by the necessary log information determination processing unit 23 and the prepared causality graph, and identifies the cause of the incident event. Accordingly, it is possible to appropriately determine whether the cause of the incident event is the failure cause or the cyberattack cause.
- the cause analysis processing unit 25 determines that it is not the failure cause when the attack cause likelihood score is higher than the failure cause likelihood score, and determines that it is the failure cause when the attack cause likelihood score is not higher than the failure cause likelihood score. Accordingly, it is possible to appropriately determine the cause from the score values.
- the cause analysis processing unit 25 acquires the determination condition of the device log information from the causality graph of the detected incident type, searches for the presence or absence of a log satisfying the determination condition from the device log group that is determined to be necessary for analysis and collected, and calculates the degree of relevance of the causality graph designation. Accordingly, it is possible to appropriately calculate each score on the basis of the degree of relevance of the causality graph designation, thereby improving the cause determination accuracy.
- the causality graph has the information of the department capable of performing the determination is associated and held, and thus the department that handles the associated incident can make a determination, whereby the incident can be quickly handled.
- causality graph generation processing unit 21 that generates the causality graph held by the causality graph holding unit 31 is provided, and the generated causality graph is held by the causality graph holding unit 31, and thus it is possible to easily create or revise the causality graph.
- an appropriate causality graph can be created such that the causality graph is created in the causality graph setting screen 700 illustrated in FIG. 10 by the analyst or the SOC-responsible personnel or is automatically created by reading publicly known information summarizing the causes of the incidents.
- the input/output unit 40 outputs the causality graph and the necessary log -information as an analysis status as illustrated in FIG. 11 , and thus the details of the cause determination reason can be understood.
- the cause analysis processing unit 25 performs the cause determination, and outputs, as the cause analysis result, the determination result.
- the cause analysis processing unit 25 may choose not to perform the cause determination but instead perform the calculation of the failure cause likelihood score and the attack cause likelihood score and display the scores. The responsible personnel (analyst) who has checked this display can estimate the cause from the scores.
- control lines or information lines considered to be necessary for description are illustrated, and not all control lines or information lines on a product are necessarily illustrated. In practice, almost all the configurations may be considered to be connected to each other.
- FIGS. 10 and 11 are also examples, and the present invention is not limited to these displays.
- the cause analysis device 1 illustrated in FIG. 2 including the processing unit 20 which is a computer on which a program (a program implementing the incident event cause identification method) is installed is also an example, and it may be implemented by the cause analysis device 1 and other configurations.
- the whole or part of the cause analysis device 1 may be implemented by dedicated hardware such as a field programmable gate array (FPGA) or an application specific integrated circuit (ASIC).
- FPGA field programmable gate array
- ASIC application specific integrated circuit
- some components of the cause analysis device 1 may be disposed in other processing devices such as a server connected via a network, and an analysis process similar to that of the cause analysis device 1 may be performed by exchanging data among a plurality of processing devices.
- the program executing the incident event cause identification method may be prepared in a storage device in the computer, or may be installed in a recording medium such as an external memory, an IC card, an SD card, or an optical disk and transferred.
Landscapes
- Engineering & Computer Science (AREA)
- Theoretical Computer Science (AREA)
- Physics & Mathematics (AREA)
- General Physics & Mathematics (AREA)
- General Engineering & Computer Science (AREA)
- Quality & Reliability (AREA)
- Software Systems (AREA)
- Computer Security & Cryptography (AREA)
- Biomedical Technology (AREA)
- Health & Medical Sciences (AREA)
- Computer Hardware Design (AREA)
- Automation & Control Theory (AREA)
- Debugging And Monitoring (AREA)
Abstract
Description
- The present invention relates to an incident event cause identification system and an incident event cause identification method.
- In recent years, cyberattacks on various control systems frequently occur, and it is crucial to accurately determine whether an incident detected in a control system is due to a cyberattack or simply a failure of the system itself.
- That is, in a security operation center (SOC) monitoring incidents in the control systems, when an incident is detected, it is necessary to determine whether the detected incident is cyber-related or caused by a mechanical failure, and appropriately escalate the incident to the relevant department and take necessary actions. In particular, in order to prevent the spread of the damage or influence caused by the cyberattack, it is important to correctly determine the cause of the incident first.
-
Patent Literature 1 describes a technique of storing one or more attack patterns that are types obtained by classifying a group of alerts anticipated to occur when an industrial control system is subjected to a cyberattack into sequences based on a temporal stage of the cyberattack and sequences based on a spatial stage of an asset attacked by the cyberattack, and diagnosing the presence or absence of a cyberattack on the industrial control system on the basis of consistency between the group of alerts and the attack patterns. - Patent Literature 1:
JP 2022-86181 A - According to the technique disclosed in
Patent Literature 1, it is possible to determine whether an alert is an attack or a failure as a chain relationship of alerts is defined as an attack pattern or a failure pattern in advance. - However, in actual systems, among pieces of information that can be output from system-related devices, information serving as a monitoring target of alert monitoring is often limited. That is, not only systems with many types of alerts but also systems with no sufficient number of types of alerts from which a chain relationship can be created in advance are included in actual systems.
- In addition, logs of unmonitored devices are hardly utilized for analysis, and utilizing these logs for analysis depends on knowledge of an analyst.
- In light of the foregoing, it is an object of the present invention to provide an incident event cause identification system and an incident event cause identification method which are capable of efficiently performing incident cause identification.
- In order to solve the above problem, for example, the configurations set forth in claims are adopted.
- The present application includes a plurality of means for solving the above problem, but as an example thereof, provided is an incident event cause identification system that includes a device log information holding unit that holds log information output from a target device, a causality graph holding unit that holds a causality graph in which a relationship between an incident event and a cause thereof is associated in advance, an incident detection processing unit that detects an incident event in the target device, a necessary log information determination processing unit that extracts the causality graph of an associated type for the incident event detected by the incident detection processing unit, and determines device log information necessary for cause identification based on the extracted causality graph, a necessary log information collection processing unit that collects the device log information determined by the necessary log information determination processing unit, a cause analysis processing unit that analyzes a cause of an incident event by using the device log information collected by the necessary log information collection processing unit and the causality graph, and an output unit that outputs the cause identified by the cause analysis processing unit or an analysis status.
- According to the present invention, it is possible to extract only information necessary for an alert from among log information can be used in a device and identify a cause. Accordingly, a time for information scrutiny is reduced, and an information storage capacity is optimized, and thus it is possible to efficiently identify a cause of an incident.
- Problems, configurations, and effects other than those described above will be clarified by the following description of embodiments.
-
-
FIG. 1 is a diagram illustrating an overall configuration example of an incident event cause identification system according to an embodiment of the present invention; -
FIG. 2 is a block diagram illustrating a configuration example of a cause analysis device according to an embodiment of the present invention; -
FIG. 3 is a flowchart illustrating an overall process example of the cause analysis device according to an embodiment of the present invention; -
FIG. 4 is a flowchart illustrating a cause analysis process example according to an embodiment of the present invention; -
FIG. 5 is a flowchart illustrating a cause likelihood score calculation process example according to an embodiment of the present invention; -
FIG. 6 is a diagram illustrating a causality graph (an example of an attack cause) according to an embodiment of the present invention; -
FIG. 7 is a diagram illustrating a causality graph (an example of a failure cause) according to an embodiment of the present invention; -
FIG. 8 is a diagram illustrating an example of a log information table according to an embodiment of the present invention; -
FIG. 9 is a diagram illustrating an example of a causality graph information table according to an embodiment of the present invention; -
FIG. 10 is a diagram illustrating an example of a causality graph setting screen according to an embodiment of the present invention; and -
FIG. 11 is a diagram illustrating an example of a cause analysis result presentation screen according to an embodiment of the present invention. - Hereinafter, an incident event cause identification system and an incident event cause identification method according to an embodiment of the present invention (hereinafter, referred to as "the present example") will be described with reference to the accompanying drawings.
-
FIG. 1 illustrates an overall configuration example of an incident event cause identification system of the present example. - The incident event cause identification system of the present example is configured by connecting one or a plurality of target devices (A
device 2a,B device 2b, ...,N device 2n: N is any integer) to acause analysis device 1 via a network. - The
cause analysis device 1 detects the occurrence of an incident in each of thedevices 2a to 2n, collects device log information, and analyzes a cause. -
FIG. 2 illustrates a configuration example of thecause analysis device 1. - The
cause analysis device 1 includes aprocessing unit 20, astorage unit 30, an input/output unit 40, and acommunication unit 50. - The
processing unit 20 includes a causality graphgeneration processing unit 21, an incidentdetection processing unit 22, a necessary log informationdetermination processing unit 23, a necessary log informationcollection processing unit 24, and a causeanalysis processing unit 25. Each of theseprocessing units 21 to 25 is configured on a work memory (not illustrated) included in theprocessing unit 20 such that theprocessing unit 20 executes, for example, a program held by theprocessing unit 20 or thestorage unit 30, that is, a program implementing an incident event cause identification method. Theprocessing unit 20 includes, for example, an arithmetic device (computer) including a central processing unit (CPU) and the like. - The causality graph
generation processing unit 21 performs a process of generating a causality graph regarding an incident that is information in which a relationship between an incident event and a cause thereof is associated. Although a specific example of the causality graph will be described later, the causality graph is created by a plurality of classifications for each detection node or each cause node that is an event indicating an attack or a failure. The classification here includes, for example, a failure occurrence likelihood related to a command, a failure occurrence likelihood related to device state checking, and the like. - Further, the causality graph may be created by an input from an input terminal by an analyst or a SOC-responsible personnel who monitors the incident in advance or may be automatically created by reading publicly known information summarizing causes of incidents.
- Further, each cause node of the created causality graph and a determination condition thereof are changed, basically as a parameter tuning part, by the SOC-responsible personnel as needed. For example, the SOC-responsible personnel may add or correct the detection node or the cause node when a new threat is found.
- The causality graph generated by the causality graph
generation processing unit 21 is held in a causalitygraph holding unit 31 of thestorage unit 30. - The incident
detection processing unit 22 detects the occurrence of an incident in the target devices (A device 2a,B device 2b, ...,N device 2n). Information of the detected incident is transmitted to the necessary log informationdetermination processing unit 23. - The necessary log information
determination processing unit 23 acquires the causality graph associated with the type of the detected incident and determines a device log necessary for analysis. - The necessary log information
collection processing unit 24 collects the device log necessary for the analysis of the incident from the target devices (Adevice 2a,B device 2b, ...,N device 2n) . - The cause
analysis processing unit 25 executes a cause analysis process by using the causality graph and the device log information. - The
storage unit 30 includes a causalitygraph holding unit 31 and a device loginformation holding unit 32. - The causality
graph holding unit 31 performs a causality graph holding process of holding the causality graph generated by the causality graphgeneration processing unit 21 as a causality table. The causality graph is generated in advance and held in the causalitygraph holding unit 31. An example of the causality table will be described later with reference toFIG. 9 . - The device log
information holding unit 32 performs a device log information holding process of classifying the log information of each target device for each type and holding the log information as a log information table. For example, the device loginformation holding unit 32 includes an AAlog holding unit 33 that holds an AA log of theA device 2a and an ABlog holding unit 34 that holds an AB log of theA device 2a. - The device log
information holding unit 32 includes a BAlog holding unit 35 that holds a BA log of theB device 2a and a BBlog holding unit 36 that holds a BB log of theA device 2a. The device loginformation holding unit 32 sequentially collects and holds the device log information. An example of the log information table will be described later with reference toFIG. 8 . - The input/
output unit 40 performs an output process of the analysis result in the causeanalysis processing unit 25. Examples of the output process performed by the input/output unit 40 include a process of displaying an analysis result on a display. Further, the input/output unit 40 performs an input process of information necessary for analysis or the like. - The
communication unit 50 performs communication with thecause analysis device 1 and the target device (Adevice 2a,B device 2b, ...,N device 2n). Further, thecommunication unit 50 performs a processing of transmitting the analysis result to other devices. -
FIG. 3 is a flowchart illustrating a flow of the processes performed by the units of thecause analysis device 1. - First, the incident
detection processing unit 22 detects the occurrence of an incident in the target device, and transmits information of the detected incident to the necessary log information determination processing unit 23 (step S101). - The necessary log information
determination processing unit 23 that has received the information of the incident acquires the causality graph associated with the type of the detected incident from the causality graph holding unit 31 (step S102). - Then, the necessary log information
determination processing unit 23 determines the device log necessary for the cause analysis from the information of the incident (step S103). After this determination, the necessary log informationcollection processing unit 24 collects necessary device log information from the device log information holding unit 32 (step S104). This collection process is a necessary log information collection process. - Thereafter, the necessary log information
determination processing unit 23 transmits the acquired causality graph and the collected necessary device log information to the cause analysis processing unit 25 (step S105) . - Then, the cause
analysis processing unit 25 that has received these pieces of information performs the cause analysis process by using the received causality graph and device log information (step S106). - Then, the cause
analysis processing unit 25 transmits an analysis process result for the incident cause to the input/output unit 40 (step S107). The input/output unit 40 executes the output process (display or the like) of the analysis process result for the incident cause. A display example of the analysis process result will be described later with reference toFIG. 11 . -
FIG. 4 is a flowchart illustrating details of the cause analysis process in the causeanalysis processing unit 25. - The cause
analysis processing unit 25 first acquires the causality graph of the detected incident type and the device log group that is determined to be necessary for analysis and collected (step S201) . - Then, the cause
analysis processing unit 25 calculates a score of a failure cause likelihood of the device (step S202). Further, the causeanalysis processing unit 25 calculates a score of a cyberattack cause likelihood (step S203). The details of these score calculation processes will be described later with reference toFIG. 5 . - Then, the cause
analysis processing unit 25 compares the failure cause likelihood score obtained in step S202 with the cyberattack cause likelihood score obtained in step S20. In this comparison, the causeanalysis processing unit 25 determines whether or not the failure cause likelihood score is higher than the cyberattack cause likelihood score (step S204). - In a case in which the failure cause likelihood score is higher than the cyberattack cause likelihood score in the determination in step S204 (Yes in step S204), the cause
analysis processing unit 25 determines that it is the failure-caused incident (step S205). On the other hand, in a case in which the failure cause likelihood score is not higher than the cyberattack cause likelihood score in the determination in step S204 (No in step S204), the causeanalysis processing unit 25 determines that the incident is not caused by the failure (step S206). -
FIG. 5 is a flowchart illustrating the details of the calculation of the score of the failure cause likelihood of the device (step S202 inFIG. 4 ) and the calculation of the score of the cyberattack cause likelihood (step S203 inFIG. 4 ). The calculation of the score of the failure cause likelihood of the device and the calculation of the score of the cyberattack cause likelihood are executed through the same processing procedure. - The cause
analysis processing unit 25 first acquires the causality graph of the detected incident type and the device log group that is determined to be necessary for analysis and collected (step S301). - Then, the cause
analysis processing unit 25 selects one piece of device log information from the collected device log group and acquires the log information group in a designation range (step S302). A range (designation range) for acquiring the log information group is designated in advance. Alternatively, the designation range may be designated each time a work is performed. - Further, the cause
analysis processing unit 25 acquires a determination condition of the log information from the acquired causality graph (step S303). Thereafter, the causeanalysis processing unit 25 searches for the presence or absence of a log that satisfies the determination condition from the log information group, and calculates the degree of relevance of the causality graph designation (step S304). - When the degree of relevance calculation of step S304 is performed, the cause
analysis processing unit 25 determines whether there is device log information for which a score has not been calculated (step S305). In a case in which it is determined in step S305 that there is device log information for which a score has not been calculated (Yes in step S305), the causeanalysis processing unit 25 returns to step S302 and performs the process for other device log information. - In a case in which it is determined in step S305 that there is no device log information for which a score has not been calculated (No in step S305), the cause
analysis processing unit 25 acquires a relational condition (AND/OR) between the device log information from the causality graph (step S306). - Then, the cause
analysis processing unit 25 calculates the degree of relevance of the device log information in accordance with the acquired relational condition, and calculates the cause likelihood score (step S307). Here, the cause likelihood score includes the failure cause likelihood score and the cyberattack cause likelihood score. In the method of calculating the score here, for example, as a method of calculating the relational condition between the device log information, in the case of the AND condition, the minimum value of each degree of relevance is taken as the score. Further, in the case of the OR condition, the maximum value of each degree of relevance is taken as a score. -
FIGS. 6 and7 show examples of the causality graphs.FIG. 6 is a causality graph of the failure cause, andFIG. 7 is a causality graph of the cyberattack cause. - In the causality graph of the failure cause illustrated in
FIG. 6 , afailure 411 of a command issuance source, atransmission device failure 412, a commandreception device failure 413, a commandexecution device failure 414, ..., are included as the detection node of one type of the incident. By the OR condition of these events, command issuance-relatedfailure occurrence 431 is obtained as the cause node, andinvalid command issuance 441 is registered as an upper node. - Further, as illustrated in
FIG. 6 , astatusdetermining device failure 421, astatus sensor failure 422, ..., and the like are included as another type of detection node of the incident. By the OR condition of these failure events, status checking-relatedfailure occurrence 432 is obtained as the cause node, and invalid terminal status checking 442 is registered as an upper node. - Further, an incident type "terminal status-inconsistent command issuance detection" 400a is registered in the causality graph by the OR condition of the
invalid command issuance 441 and the invalid terminal status checking 442. - In the causality graph of the cyberattack cause illustrated in
FIG. 7 , function rewriting 451,unauthorized authentication 452,malware contamination 453, ..., and the like are included as the detection node of one type of the incident. By the OR condition of these types of events, an invalidcommand execution attempt 481 is obtained as the cause node. - Further, an invalid command parameter
range scan function 461, a sensor value/control value parameter range scan 462, ..., and the like are included as the detection node of another type of incident. - By the OR condition of these types of events, a functional safety
design circumvention attempt 482 is obtained as the cause node. - Then, functional safety-
unrelated command issuance 491 is obtained as an upper node of the cause node of the invalidcommand execution attempt 481. - Alternatively, functional safety-related
command execution 492 is obtained by the AND condition of the invalidcommand execution attempt 481 and the functional safetydesign circumvention attempt 482. - Further, invalid control value/sensor value network (NW)
intrusion 471, terminal status-holding data tampering 472,sensor function tampering 473, ..., and the like are included as the detection node of still another type of incident. By the OR condition of these types of events, terminalstatus tampering attempt 483 is obtained as the cause node, and terminal status tampering 493 is further obtained as an upper node of the cause node. - Further, an incident type "terminal status-inconsistent command issuance detection" 400b is registered in the causality graph by the OR condition of the functional safety-
unrelated command issuance 491, the functional safety-relatedcommand execution 492, andterminal status tampering 493. -
FIG. 8 illustrates an example of the log information table held by the device loginformation holding unit 32. - The log information table is generated for each of the log
information holding units FIG. 2 , and includes any number of AA log information tables 500a to ZZ log information tables 500z. - As illustrated in
FIG. 8 , one log information table includes a loginformation table ID 501,device information 502,date information 503, loginformation 504, andresponse department information 505. - The log
information table ID 501 is an identification number assigned to each log information table. - The
device information 502 is an address of the target device serving as a collection source of the device log information. - The
date information 503 is a date and time when the device log information is collected. - The
log information 504 is actually collected device log information. - The
response department information 505 is information of a department capable of performing determination on the associated device log information. - As the
response department information 505 capable of performing the determination is associated and held as described above, it is possible to determine the incident in detail in the associated department. For example, when the cause is a failure, information of the department capable of performing determination on the failure is recorded, and thus the failure can be handled. -
FIG. 9 illustrates an example of the causality graph information table 600 held by the causalitygraph holding unit 31. - The causality graph information table 600 includes
incident type information 601, agraph ID 602,device log information 603, alog table ID 604, adetermination condition 605, and a degree ofrelevance calculation coefficient 606. - The
incident type information 601 is an incident type. For example, as illustrated inFIG. 9 , the incident type "terminal status-inconsistent command issuance detection" or the like is stored. - The
graph ID 602 is an identification number assigned to each causality graph. - The
device log information 603 is device log information of a determination source of the causality. For example, it is information such as an A device AB log. - The
log table ID 604 is a log table ID holding the device log information indicated by thedevice log information 603. - The
determination condition 605 indicates a detection parameter necessary for determination. - The degree of
relevance calculation coefficient 606 indicates a coefficient value for calculating the degree of relevance. - The causality graph illustrated in
FIGS. 6 and7 is generated on the basis of the information of the causality graph information table 600. -
FIG. 10 illustrates an example of a causalitygraph setting screen 700 displayed on the display unit constituting the input/output unit 40 of thecause analysis device 1 when the causality graph is generated by the causality graphgeneration processing unit 21. - As illustrated on the left side of the screen, the causality
graph setting screen 700 includes an input field of an incident name, the details of device log settings, and an input field of a determination condition as setting value inputs, and a responsible personnel (analyst) working on thesetting screen 700 can input these details. - Further, as illustrated on the right side of the causality
graph setting screen 700, a field in which the responsible personnel creates a graph is prepared, and the responsible personnel working on thesetting screen 700 can input the details of the detection node, the details of the cause node, and the details of the incident type. Then, the responsible personnel can create the causality graph illustrated inFIGS. 6 and7 by inputting the determination conditions (the AND condition, the OR condition, and the like) of these nodes and a connection line indicating a connection relationship of each node. - On the lower right of the causality
graph setting screen 700, there are a "setting OK" button and a "cancel" button, and when the responsible personnel selects the "setting OK" button, the causality graph created on the causalitygraph setting screen 700 is held in the causalitygraph holding unit 31. - Further, when the responsible personnel selects the "cancel" button, the creation of the causality graph created on the causality
graph setting screen 700 is canceled. -
FIG. 11 illustrates an example in which a causeanalysis result screen 800 of the causeanalysis processing unit 25 is displayed on the display unit constituting the input/output unit 40. - The cause
analysis result screen 800 includes a display field of a cause of a detected incident, a display field of a failure cause score, and a display field of a cyberattack cause score. Each score is a score obtained when the cause analysis process is performed in the causeanalysis processing unit 25, and the cause of the detected incident (the failure cause or the cyberattack cause) is displayed in the display field of the cause of the detected incident on the basis of the determination of step S204 of the flowchart ofFIG. 4 with the values of both scores. - Further, in the cause
analysis result screen 800, the analysis causality graph (the lower left inFIG. 11 ) used for the analysis and a list of analyzed device logs (the lower right inFIG. 11 ) are displayed. Further, inFIG. 11 , the texts in the analysis causality graph are omitted, but the details of the analysis causality graph are actually displayed in the form illustrated inFIGS. 6 and7 . - Download buttons are displayed at portions in which the analysis causality graph and the list of device logs are displayed. The responsible personnel can download the details of the analysis causality graph (for example, the information illustrated in
FIG. 9 ) and download the details of the device logs (for example, the information illustrated inFIG. 8 ), and then cause the details to be displayed on the screen. - Further, a result print button is provided on the cause
analysis result screen 800, and the cause analysis result can be printed by the operation of the responsible personnel. - As described above, according to the incident event cause identification system of the present example, it is possible to extract only information necessary for the alert from among various types of log information that can be used in the device and identify the cause. Accordingly, a time for information scrutiny is reduced, and an information storage capacity is optimized, and thus it is possible to efficiently identify a cause of an incident. Further, it is possible to appropriately identify the cause without being affected by the skill of the responsible personnel (analyst).
- Here, the cause
analysis processing unit 25 calculates the failure cause likelihood score and the attack cause likelihood score by using the device log information collected by the necessary log informationdetermination processing unit 23 and the prepared causality graph, and identifies the cause of the incident event. Accordingly, it is possible to appropriately determine whether the cause of the incident event is the failure cause or the cyberattack cause. - Specifically, the cause
analysis processing unit 25 determines that it is not the failure cause when the attack cause likelihood score is higher than the failure cause likelihood score, and determines that it is the failure cause when the attack cause likelihood score is not higher than the failure cause likelihood score. Accordingly, it is possible to appropriately determine the cause from the score values. - Further, when the failure cause likelihood score and the attack cause likelihood score are calculated, as described with reference to the flowchart of
FIG. 5 , the causeanalysis processing unit 25 acquires the determination condition of the device log information from the causality graph of the detected incident type, searches for the presence or absence of a log satisfying the determination condition from the device log group that is determined to be necessary for analysis and collected, and calculates the degree of relevance of the causality graph designation. Accordingly, it is possible to appropriately calculate each score on the basis of the degree of relevance of the causality graph designation, thereby improving the cause determination accuracy. - Further, as described with reference to
FIG. 8 , the causality graph has the information of the department capable of performing the determination is associated and held, and thus the department that handles the associated incident can make a determination, whereby the incident can be quickly handled. - Further, the causality graph
generation processing unit 21 that generates the causality graph held by the causalitygraph holding unit 31 is provided, and the generated causality graph is held by the causalitygraph holding unit 31, and thus it is possible to easily create or revise the causality graph. - Furthermore, an appropriate causality graph can be created such that the causality graph is created in the causality
graph setting screen 700 illustrated inFIG. 10 by the analyst or the SOC-responsible personnel or is automatically created by reading publicly known information summarizing the causes of the incidents. - Furthermore, the input/
output unit 40 outputs the causality graph and the necessary log -information as an analysis status as illustrated inFIG. 11 , and thus the details of the cause determination reason can be understood. - Note that the embodiment described so far has been described in detail to elucidate the present invention and is not limited to configurations including all the components described above necessarily.
- For example, in the above-described embodiment, the cause
analysis processing unit 25 performs the cause determination, and outputs, as the cause analysis result, the determination result. On the other hand, the causeanalysis processing unit 25 may choose not to perform the cause determination but instead perform the calculation of the failure cause likelihood score and the attack cause likelihood score and display the scores. The responsible personnel (analyst) who has checked this display can estimate the cause from the scores. - Further, in the configuration diagram of the
cause analysis device 1 illustrated inFIG. 2 , only control lines or information lines considered to be necessary for description are illustrated, and not all control lines or information lines on a product are necessarily illustrated. In practice, almost all the configurations may be considered to be connected to each other. - Further, the flows of the processes illustrated in the flowcharts illustrated in
FIGS. 3 to 5 are also an example, and as long as the process results are the same, the process order may be partially changed, or a plurality of processes may be simultaneously executed. - The display examples illustrated in
FIGS. 10 and11 are also examples, and the present invention is not limited to these displays. - Further, the
cause analysis device 1 illustrated inFIG. 2 including theprocessing unit 20 which is a computer on which a program (a program implementing the incident event cause identification method) is installed is also an example, and it may be implemented by thecause analysis device 1 and other configurations. - For example, the whole or part of the
cause analysis device 1 may be implemented by dedicated hardware such as a field programmable gate array (FPGA) or an application specific integrated circuit (ASIC). - Further, some components of the
cause analysis device 1 may be disposed in other processing devices such as a server connected via a network, and an analysis process similar to that of thecause analysis device 1 may be performed by exchanging data among a plurality of processing devices. - Furthermore, the program executing the incident event cause identification method may be prepared in a storage device in the computer, or may be installed in a recording medium such as an external memory, an IC card, an SD card, or an optical disk and transferred.
Claims (8)
- An incident event cause identification system, comprising:a device log information holding unit that holds log information output from a target device;a causality graph holding unit that holds a causality graph in which a relationship between an incident event and a cause thereof is associated in advance;an incident detection processing unit that detects an incident event in the target device;a necessary log information determination processing unit that extracts the causality graph of an associated type for the incident event detected by the incident detection processing unit, and determines device log information necessary for cause identification based on the extracted causality graph;a necessary log information collection processing unit that collects the device log information determined by the necessary log information determination processing unit;a cause analysis processing unit that analyzes a cause of an incident event by using the device log information collected by the necessary log information collection processing unit and the causality graph; andan output unit that outputs the cause identified by the cause analysis processing unit or an analysis status.
- The incident event cause identification system according to claim 1, wherein
the cause analysis processing unit calculates a failure cause likelihood score and an attack cause likelihood score by using the device log information collected by the necessary log information determination processing unit and the causality graph, and identifies the cause of the incident event. - The incident event cause identification system according to claim 2, wherein
the cause analysis processing unit acquires a determination condition for the device log information from a causality graph of a detected incident type when the failure cause likelihood score and the attack cause likelihood score are calculated, searches for the presence or absence of a log satisfying the determination condition from a device log group that is determined to be necessary for analysis and collected, and calculates the degree of relevance of causality graph designation. - The incident event cause identification system according to claim 3, wherein
the cause analysis processing unit determines that the cause is not the failure cause when the attack cause likelihood score is higher than the failure cause likelihood score, and determines that the cause is the failure cause when the attack cause likelihood score is not higher than the failure cause likelihood score. - The incident event cause identification system according to claim 1, wherein
the causality graph associates and holds information of a department capable of performing determination. - The incident event cause identification system according to claim 1, further comprising,
a causality graph generation processing unit that generates the causality graph held by the causality graph holding unit, wherein the generated causality graph is held by the causality graph holding unit. - The incident event cause identification system according to claim 1, wherein
the output unit outputs the causality graph and necessary log information as the analysis status. - An incident event cause identification method, comprising:a device log information holding process of holding log information output from a target device;a causality graph holding process of holding a causality graph in which a relationship between an incident event and a cause thereof is associated in advance;an incident detection process of detecting an incident event in the target device;a necessary log information determination process of extracting the causality graph of an associated type for the incident event detected by the incident detection process, and determining device log information necessary for cause identification based on the extracted causality graph;a necessary log information collection process of collecting the device log information determined by the necessary log information determination process;a cause analysis process of analyzing a cause of an incident event by using the device log information collected by the necessary log information collection process and the causality graph; andan output process of outputting the cause identified by the cause analysis process or an analysis status.
Applications Claiming Priority (1)
| Application Number | Priority Date | Filing Date | Title |
|---|---|---|---|
| JP2023104791A JP2025004904A (en) | 2023-06-27 | 2023-06-27 | INCIDENT CAUSE IDENTIFICATION SYSTEM AND INCIDENT CAUSE IDENTIFICATION METHOD |
Publications (2)
| Publication Number | Publication Date |
|---|---|
| EP4485245A1 true EP4485245A1 (en) | 2025-01-01 |
| EP4485245B1 EP4485245B1 (en) | 2026-04-08 |
Family
ID=90105320
Family Applications (1)
| Application Number | Title | Priority Date | Filing Date |
|---|---|---|---|
| EP24160245.7A Active EP4485245B1 (en) | 2023-06-27 | 2024-02-28 | Incident event cause identification system and incident event cause identification method |
Country Status (4)
| Country | Link |
|---|---|
| US (1) | US20250004872A1 (en) |
| EP (1) | EP4485245B1 (en) |
| JP (1) | JP2025004904A (en) |
| CN (1) | CN119200552A (en) |
Citations (3)
| Publication number | Priority date | Publication date | Assignee | Title |
|---|---|---|---|---|
| US20210044607A1 (en) * | 2019-08-07 | 2021-02-11 | Hitachi Solutions, Ltd. | Monitor, monitoring method, and recording medium |
| JP2022086181A (en) | 2020-11-30 | 2022-06-09 | 株式会社日立製作所 | Condition diagnosis device and condition diagnosis method |
| US20230102786A1 (en) * | 2021-09-24 | 2023-03-30 | Bmc Software, Inc. | Ccontinuous knowledge graph generation using causal event graph feedback |
Family Cites Families (4)
| Publication number | Priority date | Publication date | Assignee | Title |
|---|---|---|---|---|
| US6898737B2 (en) * | 2001-05-24 | 2005-05-24 | Microsoft Corporation | Automatic classification of event data |
| US8122290B2 (en) * | 2009-12-17 | 2012-02-21 | Hewlett-Packard Development Company, L.P. | Error log consolidation |
| JP7056752B2 (en) * | 2018-10-11 | 2022-04-19 | 日本電信電話株式会社 | Analytical instruments, analytical systems, analytical methods and programs |
| US11314577B2 (en) * | 2020-08-03 | 2022-04-26 | Palo Alto Research Center Incorporated | System and method for constructing fault-augmented system model for root cause analysis of faults in manufacturing systems |
-
2023
- 2023-06-27 JP JP2023104791A patent/JP2025004904A/en active Pending
-
2024
- 2024-02-20 US US18/582,074 patent/US20250004872A1/en active Pending
- 2024-02-23 CN CN202410202102.5A patent/CN119200552A/en active Pending
- 2024-02-28 EP EP24160245.7A patent/EP4485245B1/en active Active
Patent Citations (3)
| Publication number | Priority date | Publication date | Assignee | Title |
|---|---|---|---|---|
| US20210044607A1 (en) * | 2019-08-07 | 2021-02-11 | Hitachi Solutions, Ltd. | Monitor, monitoring method, and recording medium |
| JP2022086181A (en) | 2020-11-30 | 2022-06-09 | 株式会社日立製作所 | Condition diagnosis device and condition diagnosis method |
| US20230102786A1 (en) * | 2021-09-24 | 2023-03-30 | Bmc Software, Inc. | Ccontinuous knowledge graph generation using causal event graph feedback |
Non-Patent Citations (2)
| Title |
|---|
| JIN ZHUOCHEN ET AL: "Visual Causality Analysis of Event Sequence Data", IEEE TRANSACTIONS ON VISUALIZATION AND COMPUTER GRAPHICS, IEEE, USA, vol. 27, no. 2, 13 October 2020 (2020-10-13), pages 1343 - 1352, XP011834532, ISSN: 1077-2626, [retrieved on 20210128], DOI: 10.1109/TVCG.2020.3030465 * |
| OLA AHMAD ET AL: "Causal Analysis for Robust Interpretability of Neural Networks", ARXIV.ORG, CORNELL UNIVERSITY LIBRARY, 201 OLIN LIBRARY CORNELL UNIVERSITY ITHACA, NY 14853, 20 June 2023 (2023-06-20), XP091541166 * |
Also Published As
| Publication number | Publication date |
|---|---|
| US20250004872A1 (en) | 2025-01-02 |
| JP2025004904A (en) | 2025-01-16 |
| EP4485245B1 (en) | 2026-04-08 |
| CN119200552A (en) | 2024-12-27 |
Similar Documents
| Publication | Publication Date | Title |
|---|---|---|
| JP7101272B2 (en) | Automatic threat alert triage through data history | |
| US10078317B2 (en) | Method, device and computer program for monitoring an industrial control system | |
| EP3672192B1 (en) | Integrated equipment fault and cyber attack detection arrangement | |
| EP3699708B1 (en) | Production facility monitoring device, production facility monitoring method, and production facility monitoring program | |
| EP2759938A1 (en) | Operations management device, operations management method, and program | |
| US20150346066A1 (en) | Asset Condition Monitoring | |
| JP6858676B2 (en) | Plant security response support system | |
| CN106101130B (en) | A network malicious data detection method, device and system | |
| JP6523582B2 (en) | INFORMATION PROCESSING APPARATUS, INFORMATION PROCESSING METHOD, AND INFORMATION PROCESSING PROGRAM | |
| JP6200833B2 (en) | Diagnostic equipment for plant and control equipment | |
| JP4819014B2 (en) | Log analysis method, log storage device, and program | |
| US20190257719A1 (en) | Abnormal-state detection system and abnormal-state detection method | |
| CN114553596B (en) | Multi-dimensional security condition real-time display method and system suitable for network security | |
| KR101553891B1 (en) | Cyber security monitoring method and system of digital safety system in nuclear power plant | |
| CN112671767A (en) | Security event early warning method and device based on alarm data analysis | |
| KR101281460B1 (en) | Method for anomaly detection using statistical process control | |
| KR20140088712A (en) | System for monitoring access to personal information and method therefor | |
| CN112769615A (en) | Anomaly analysis method and device | |
| CN114584391B (en) | Method, device, equipment and storage medium for generating abnormal flow processing strategy | |
| EP4485245B1 (en) | Incident event cause identification system and incident event cause identification method | |
| CN109145609B (en) | Data processing method and device | |
| KR102111136B1 (en) | Method, device and program for generating respond directions against attack event | |
| US12530455B2 (en) | Method and apparatus for detecting anomaly status based on system screen | |
| CN118838782A (en) | Bank system risk early warning method and device, computer equipment and storage medium | |
| EP3504597A1 (en) | Identification of deviant engineering modifications to programmable logic controllers |
Legal Events
| Date | Code | Title | Description |
|---|---|---|---|
| PUAI | Public reference made under article 153(3) epc to a published international application that has entered the european phase |
Free format text: ORIGINAL CODE: 0009012 |
|
| STAA | Information on the status of an ep patent application or granted ep patent |
Free format text: STATUS: REQUEST FOR EXAMINATION WAS MADE |
|
| 17P | Request for examination filed |
Effective date: 20240314 |
|
| AK | Designated contracting states |
Kind code of ref document: A1 Designated state(s): AL AT BE BG CH CY CZ DE DK EE ES FI FR GB GR HR HU IE IS IT LI LT LU LV MC ME MK MT NL NO PL PT RO RS SE SI SK SM TR |
|
| GRAP | Despatch of communication of intention to grant a patent |
Free format text: ORIGINAL CODE: EPIDOSNIGR1 |
|
| STAA | Information on the status of an ep patent application or granted ep patent |
Free format text: STATUS: GRANT OF PATENT IS INTENDED |
|
| INTG | Intention to grant announced |
Effective date: 20251030 |
|
| GRAS | Grant fee paid |
Free format text: ORIGINAL CODE: EPIDOSNIGR3 |
|
| GRAA | (expected) grant |
Free format text: ORIGINAL CODE: 0009210 |
|
| STAA | Information on the status of an ep patent application or granted ep patent |
Free format text: STATUS: THE PATENT HAS BEEN GRANTED |
|
| AK | Designated contracting states |
Kind code of ref document: B1 Designated state(s): AL AT BE BG CH CY CZ DE DK EE ES FI FR GB GR HR HU IE IS IT LI LT LU LV MC ME MK MT NL NO PL PT RO RS SE SI SK SM TR |
|
| REG | Reference to a national code |
Ref country code: CH Ref legal event code: F10 Free format text: ST27 STATUS EVENT CODE: U-0-0-F10-F00 (AS PROVIDED BY THE NATIONAL OFFICE) Effective date: 20260408 Ref country code: GB Ref legal event code: FG4D |
|
| REG | Reference to a national code |
Ref country code: DE Ref legal event code: R096 Ref document number: 602024003722 Country of ref document: DE |