EP4475128A1 - Method and system for establishing disease prediction model - Google Patents
Method and system for establishing disease prediction model Download PDFInfo
- Publication number
- EP4475128A1 EP4475128A1 EP23197981.6A EP23197981A EP4475128A1 EP 4475128 A1 EP4475128 A1 EP 4475128A1 EP 23197981 A EP23197981 A EP 23197981A EP 4475128 A1 EP4475128 A1 EP 4475128A1
- Authority
- EP
- European Patent Office
- Prior art keywords
- features
- microbiota
- feature
- data
- species
- Prior art date
- Legal status (The legal status is an assumption and is not a legal conclusion. Google has not performed a legal analysis and makes no representation as to the accuracy of the status listed.)
- Pending
Links
Images

Classifications
-
- G—PHYSICS
- G16—INFORMATION AND COMMUNICATION TECHNOLOGY [ICT] SPECIALLY ADAPTED FOR SPECIFIC APPLICATION FIELDS
- G16B—BIOINFORMATICS, i.e. INFORMATION AND COMMUNICATION TECHNOLOGY [ICT] SPECIALLY ADAPTED FOR GENETIC OR PROTEIN-RELATED DATA PROCESSING IN COMPUTATIONAL MOLECULAR BIOLOGY
- G16B40/00—ICT specially adapted for biostatistics; ICT specially adapted for bioinformatics-related machine learning or data mining, e.g. knowledge discovery or pattern finding
-
- G—PHYSICS
- G16—INFORMATION AND COMMUNICATION TECHNOLOGY [ICT] SPECIALLY ADAPTED FOR SPECIFIC APPLICATION FIELDS
- G16H—HEALTHCARE INFORMATICS, i.e. INFORMATION AND COMMUNICATION TECHNOLOGY [ICT] SPECIALLY ADAPTED FOR THE HANDLING OR PROCESSING OF MEDICAL OR HEALTHCARE DATA
- G16H50/00—ICT specially adapted for medical diagnosis, medical simulation or medical data mining; ICT specially adapted for detecting, monitoring or modelling epidemics or pandemics
- G16H50/20—ICT specially adapted for medical diagnosis, medical simulation or medical data mining; ICT specially adapted for detecting, monitoring or modelling epidemics or pandemics for computer-aided diagnosis, e.g. based on medical expert systems
-
- G—PHYSICS
- G16—INFORMATION AND COMMUNICATION TECHNOLOGY [ICT] SPECIALLY ADAPTED FOR SPECIFIC APPLICATION FIELDS
- G16H—HEALTHCARE INFORMATICS, i.e. INFORMATION AND COMMUNICATION TECHNOLOGY [ICT] SPECIALLY ADAPTED FOR THE HANDLING OR PROCESSING OF MEDICAL OR HEALTHCARE DATA
- G16H50/00—ICT specially adapted for medical diagnosis, medical simulation or medical data mining; ICT specially adapted for detecting, monitoring or modelling epidemics or pandemics
- G16H50/70—ICT specially adapted for medical diagnosis, medical simulation or medical data mining; ICT specially adapted for detecting, monitoring or modelling epidemics or pandemics for mining of medical data, e.g. analysing previous cases of other patients
-
- G—PHYSICS
- G16—INFORMATION AND COMMUNICATION TECHNOLOGY [ICT] SPECIALLY ADAPTED FOR SPECIFIC APPLICATION FIELDS
- G16H—HEALTHCARE INFORMATICS, i.e. INFORMATION AND COMMUNICATION TECHNOLOGY [ICT] SPECIALLY ADAPTED FOR THE HANDLING OR PROCESSING OF MEDICAL OR HEALTHCARE DATA
- G16H50/00—ICT specially adapted for medical diagnosis, medical simulation or medical data mining; ICT specially adapted for detecting, monitoring or modelling epidemics or pandemics
- G16H50/80—ICT specially adapted for medical diagnosis, medical simulation or medical data mining; ICT specially adapted for detecting, monitoring or modelling epidemics or pandemics for detecting, monitoring or modelling epidemics or pandemics, e.g. flu
Definitions
- the present disclosure relates to feature engineering technology, in particular to a method and system for establishing a disease prediction model.
- microbiota refers to the collective population of microorganisms such as bacteria, viruses, fungi, and yeasts that reside within the human body. Together, they form a complex ecosystem that enables the proper functioning of the body. Similar to other ecosystems, the disruption of a single species within the microbiota can potentially impact the ecological balance.
- the most intricate microbiota within the human body is the gut microbiota, which has a significant influence on human health.
- the gut microbiota not only affects intestinal functions but also plays a crucial role in metabolism and the regulation of the immune system, thereby influencing overall health and internal equilibrium. Imbalances in the gut microbiota have been associated with various diseases, such as neurodegenerative disorders, cardiovascular diseases, diabetes, autoimmune diseases, cancer, etc.
- This disease prediction model can serve as an early warning system before the onset of diseases and provide further insights into their pathogenic mechanisms.
- An embodiment of the present disclosure provides a method executed by a computer system for establishing a disease prediction model.
- the method includes the steps of extracting feature values for multiple microbiota features from microbiota data of each of a plurality of samples, selecting a portion of the extracted microbiota features as selected features, and training a disease prediction model.
- Each piece of training data used in training the disease prediction model includes (i) disease data for each of the samples and (ii) the feature values of the selected features for the sample.
- the microbiota features include species-level features, microbiota interaction features, and community-level features.
- the species-level features include relative abundance data and presence/absence data of each of a plurality of species.
- the microbiota interaction features include the hierarchical ratio of two taxa on a taxonomic level.
- the community-level features include a Beta diversity matrix.
- the step of selecting a portion of the extracted microbiota features as the selected features includes the steps of inputting the disease data and the microbiota features into multiple feature selection models to obtain multiple feature pools, ranking the microbiota features based on the frequency of being selected into the feature pools by the feature selection models to obtain a feature ranking, and selecting a specified number of the microbiota features as the selected features based on the feature ranking.
- Each of the feature selection models selects one or more of the microbiota features to form the corresponding feature pool.
- An embodiment of the present disclosure provides a system for establishing a disease prediction model.
- the system includes a storage device and a processing device.
- the storage device stores disease data and microbiota data of a plurality of samples.
- the processing device loads a program from the storage device to execute the steps of the aforementioned method.
- the method and system provided by the present disclosure for establishing disease prediction models enhance the richness and representativeness of feature information by constructing microbiota features from multiple aspects. This not only improves the accuracy of disease prediction but also facilitates the interpretation of analysis results. Furthermore, it helps deepen our understanding of the pathogenic mechanisms of diseases, aiding in the development of more effective treatment and prevention methods.
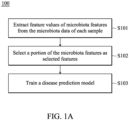
- FIG. 1A is the flow diagram of a method 100 for establishing a disease prediction model, according to an embodiment of the present disclosure.
- the method 100 includes steps S101-S103.
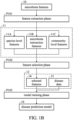
- FIG. 1B corresponds to the embodiment of FIG. 1A and illustrates the schematic diagram of the method 100.
- the method 100 includes a feature extraction phase P101, a feature selection phase P102, and a model training phase P103. Please refer to both FIG. 1A and FIG. 1B for a better understanding of this embodiment.
- Step S101 in FIG. 1A corresponds to the feature extraction phase P101 in FIG. 1B .
- step S101 and the feature extraction phase P101 feature values of microbiota features 11 are extracted from the microbiota data 10 of each sample. Then, the method 100 proceeds to step S102.
- the microbiota features 11 includes three types: species-level features 11A, microbiota interaction features 11B, and community-level features 11C. Each type includes one or more specific microbiota features.
- sample refers to various specimens collected from the human body or animal body, such as blood, urine, saliva, feces, tissues, etc., which can be further analyzed, tested, or diagnosed.
- Each sample has corresponding microbiota data 10 and disease data 15, which describe the microbiota composition of the specimen and the disease type of the subject (i.e., the source of the specimen, whether it is a human or an animal).
- the gut microbiota is one of the most intricate microbiota in the human body and has a significant impact on human health, in the embodiments of the present disclosure, the gut microbiota is typically used as an example for the microbiota data 10, although the present disclosure is not limited thereto.
- the microbiota data 10 can be collected through testing of fecal samples or collected through approaches such as gastrointestinal endoscopy.
- the disease data 15 can be collected using various medical diagnostic methods, such as blood tests, imaging examinations, and so on.
- the collection methods for microbiota data 10 and disease data 15 are not limited by the present disclosure.
- Other practices, such as blood testing, urine testing, or tissue biopsies, can also be used to collect relevant data.
- the types of diseases that can be included in the disease data 15 are not limited by the present disclosure.
- the disease types in the disease data 15 can include various conditions, such as infections, chronic diseases, cancers, etc.
- the disease data 15 can indicate the absence of any disease.
- the disease data 15 can reflect the overall health status of the subject, such as the level of metabolic functioning or the quality of the immune system, although the present disclosure is not limited thereto.
- the microbiota data 10 can be represented by the quantity or abundance of various species in the sample. It is worth to note that the disclosure does not limit the microbiota data 10 to include all species present in the sample. In an embodiment, the inclusion of species in the microbiota data 10 can be determined based on their prevalence in the sample. For example, the microbiota data 10 may consider only species with a prevalence of over 10% in the sample. However, the selection of species in the microbiota data 10 is not limited by the present disclosure.
- the species-level features 11A provide more detailed information about each species, including relative abundance data and presence/absence data for each species.
- Presence/absence data indicates whether a species is present or absent in the sample and is typically represented in binary form. For example, if species C is present in the sample and species D is absent, the presence/absence value of species C would be 1, and the presence/absence value of species D would be 0. Therefore, the presence/absence value of 1 for species C and the presence/absence value of 0 for species D can be used as two feature values in the species-level features 11A.
- the microbiota interaction features 11B include the hierarchical ratio between two taxa on a taxonomic level.
- the hierarchical ratio is an indicator for describing the interaction relationship between two species. Typically, all species are classified based on the taxonomic hierarchy, including phylum, class, order, family, genus, and species. Then, the relative abundance ratios between two species on each level are calculated to describe the compositional structure of microbial communities in the sample.
- Taxon A consists of m species with relative abundances X 1 , X 2 , X 3 ... X m
- Taxon B consists of n species with relative abundances Y 1 , Y 2 , Y 3 ... Y n .
- Table 1 provides an example of microbiota data for Subject 01.
- Table 1 Phylum Class ... Species Relative Abundance Class Sum Phylum Sum Subject 01 Phylum A Class A ... a 0.1 0.2 0.3 ... b 0.1 Class B ... c 0.1 0.1 Phylum B Class C ... d 0.1 0.7 0.7 ... e 0.1 ... f 0.2 ... g 0.3
- Phylum A includes three species: a, b, and c, with a relative abundance of 0.1 for each.
- Species a and b belong to Class A within Phylum A
- species c belongs to Class B within Phylum A.
- Phylum B includes four species: d, e, f, and g, with relative abundances of 0.1, 0.1, 0.2, and 0.3, respectively. All four species belong to Class C within Phylum B.
- the aforementioned "taxonomic level" can refer to any of the following: phylum, class, order, family, or genus.
- the microbiota interaction features (11B) may include hierarchical ratios obtained from one or more taxonomic levels. The calculation of hierarchical ratios will be demonstrated using the examples of "phylum” and "class” as the taxonomic levels.
- the hierarchical ratio of Phylum A relative to Phylum B is calculated as the ratio between the sum of Phylum A's abundances and the sum of Phylum B's abundances in Table 1.
- the hierarchical ratios between Class A, Class B, and Class C are calculated based on the sum of each class's abundances in Table 1.
- the four calculated values: 0.3 0.7 , 0.2 0.1 , 0.1 0.7 , and 0.2 0.7 can be used as four feature values for the microbiota interaction features 11B in the context of hierarchical ratios.
- community-level feature 11C includes a Beta Diversity Matrix.
- the Beta Diversity Matrix is a mathematical tool for comparing the similarity or dissimilarity between different microbial communities. Each element in the matrix represents the degree of difference between two microbial communities, typically measured using distance or similarity metrics.
- the Beta Diversity Matrix can utilize the Jaccard similarity as a measurement metric. Jaccard similarity is based on the presence/absence data described previously and calculates the ratio between the number of shared species and the total number of species present in two microbial communities. The value of Jaccard similarity ranges between 0 and 1. A value closer to 1 indicates a higher number of shared species and lower microbial dissimilarity between the samples. Conversely, a value closer to 0 indicates a lower number of shared species and higher microbial dissimilarity between the samples. In practice, the microbial data 10 of each sample can be used in rotation as a reference benchmark to calculate the microbial dissimilarity with other samples.
- pre-defined microbiota such as the representative microbiota of diabetic patients
- represent the number of species in each community
- represents the total number of species combined in both microbial communities
- Table 2 provides an example of disease categories and the presence/absence values of various species for Subjects 01-05.
- Table 2 Disease Category Subject Species A Species B Species C 0 Subject 01 0 1 1 0 Subject 02 0 1 0 0 Subject 03 1 1 1 1 Subject 04 0 0 0 1 Subject 05 1 0 1
- represent the number of species present in the samples of Subject 01 and Subject 02, respectively.
- represents the number of species shared by Subject 01 and Subject 02. According to Table 2, it can be observed that the sample of Subject 01 has two species (Species B and Species C), hence
- 2. The sample of Subject 02 only has one species (Species B), hence
- 1. The number of species shared by Subject 01 and Subject 02 is one (Species B), hence
- 1.
- the Jaccard similarity values between all pairs of Subjects 01-05 can be calculated. These values form a Beta Diversity Matrix, which serves as the feature values for the community-level features 11C.
- the Beta Diversity Matrix can be measured using Bray-Curtis similarity as the metric.
- Bray-Curtis similarity is based on the relative abundance values and calculates the sum of absolute differences between the relative abundances of each species in two communities divided by the sum of their relative abundances. The resulting value ranges between 0 and 1. A value closer to 1 indicates lower microbial dissimilarity between the samples, while a value closer to 0 indicates greater microbial dissimilarity between the samples.
- step S102 corresponds to the feature selection phase P102 in FIG. 1B .
- step S102 and the feature selection phase P102 a portion of the microbiota features 11 are selected as selected features 14. Then, method 100 proceeds to step S103.
- a feature selection model is used to select the selected features 14.
- Various statistical models or machine learning models can be employed to implement the feature selection model. Examples of statistical models include the least absolute shrinkage and selection operator (Lasso) algorithm, stepwise logistic regression, statistical tests, etc.
- Machine learning models can include decision trees, logistic regression, naive Bayes, random forest, support vector machines (SVM), fully connected neural networks, etc, but the present disclosure is not limited thereto.
- FIG. 2 is the flow diagram of one embodiment of step S102 from FIG. 1A .
- multiple feature selection models are used for feature selection.
- step S102 can further include steps S201-S203.
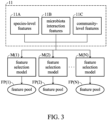
- FIG. 3 corresponds to the embodiment depicted in FIG. 2 and illustrates the schematic diagram of multiple feature selection models M(1)-M(N) and feature pools FP(1)-FP(N). Please refer to both FIG. 2 and FIG. 3 together for a better understanding of this embodiment.
- step S201 disease data 10 and the microbiota features including species-level features 11A, microbiota interaction features 11B, and community-level features 11C are input into N feature selection models, denoted as M(1)-M(N).
- N feature selection models denoted as M(1)-M(N).
- This process generates N feature pools, denoted as FP(1)-FP(N). Then, the process proceeds to step S202.
- each of the feature selection models M(1)-M(N) selects one or more of the microbiota features including species-level features 11A, microbiota interaction features 11B, and community-level features 11C to form the corresponding feature pools.
- feature selection model M(1) outputs feature pool FP(1)
- feature selection model M(2) outputs feature pool FP(2)
- Different feature selection models M(1)-M(N) will select different features, resulting in varying microbiota features within feature pools FP(1)-FP(N).
- the feature selection models M(1)-M(N) can be implemented using various statistical models or machine learning models.
- statistical models include the least absolute shrinkage and selection operator (Lasso) algorithm, stepwise logistic regression, statistical tests, etc.
- Machine learning models can include decision trees, logistic regression, naive Bayes, random forest, support vector machines (SVM), fully connected neural networks, etc, but the present disclosure is not limited thereto.
- each of the feature selection models M(1)-M(N) calculates at least one statistical index for each microbiota feature one by one, and compares the statistical index with the corresponding critical value, so as to decide whether to select the microbiota feature to the corresponding feature pool.
- the critical value is a preset fixed value, which depends on the feature selection model itself.
- Statistical indicators can be, for example, P value, odds ratio, correlation coefficient, fold change, etc.
- the number of microbiota features to be selected into the corresponding feature pools FP(1)-FP(N) can be determined based on the accuracy of each feature selection model M(1)-M(N).
- the scree plot or elbow method can be employed to decide the number of microbiota features selected by the feature selection models.
- the horizontal axis typically represents the number of features used by the model, while the vertical axis represents a performance metric such as accuracy or area under the curve (AUC).
- AUC area under the curve
- step S202 the microbiota features are ranked based on the frequency of being selected into the feature pools FP(1)-FP(N) by the feature selection models M(1)-M(N). Thereby, a feature ranking is obtained. Then, the process proceeds to step S203.
- frequency of being selected into the feature pools FP(1)-FP(N) by the feature selection models M(1)-M(N) can be understood as the count of feature pools in which a specific microbiota feature is included. A higher frequency indicates a higher importance or reference value for that microbiota feature. Therefore, microbiota features that rank higher in the feature ranking have greater importance or reference value.
- a specified number of microbiota features are selected from the microbiota features 11 as the selected features.
- the specified number can be a pre-defined value or determined based on the accuracy of the feature selection models.
- multiple test datasets can be used to obtain multiple accuracies of the feature selection models when selecting different numbers of microbiota features.
- the test datasets are solely used to evaluate the accuracy of the feature selection models. After obtaining the accuracies of the feature selection models for different numbers of microbiota features, one of the feature selection models is selected based on these accuracies. For instance, the feature selection model with the highest accuracy can be selected.
- each feature selection model will obtain 10 accuracies, and with X feature selection models, there will be 10X accuracies. From these 10X accuracies, the highest accuracy can be identified to select the feature selection model with the highest accuracy. Then, based on the selected feature selection model's number and accuracy, the specified number can be determined using the previously mentioned methods such as the scree plot or elbow method.
- species-level features 11A, microbiota interaction features 11B, and community-level features 11C are collectively input into feature selection models M(1)-M(N) to obtain feature pools FP(1)-FP(N), but the present disclosure is not limited thereto.
- species-level features 11A, microbiota interaction features 11B, and community-level features 11C can be individually input into feature selection models M(1)-M(N) to obtain N*3 feature pools.
- the microbiota features within these feature pools will be integrated to generate a feature set.
- steps S202-S203 can be used to select, from the feature set, the features that respectively corresponds to the species-level features 11A, microbiota interaction features 11B, and community-level features 11C as the selected features 14.
- Step S103 in FIG. 1A corresponds to the model training phase P103 in FIG. 1B .
- a disease prediction model 16 is trained.
- the trained disease prediction model 16 can take the selected features of the subjects as input data and generate predictions about diseases.
- the disease prediction model 16 can be a classification model that predicts disease types, or a regression model that predicts metabolic function indices, immune indices, or the probability of specific diseases, although the present disclosure is not limited thereto.
- each training data 12 used for training the disease prediction model 16 includes (1) disease data 15 of each sample and (2) the feature values of the selected features 14 for that sample.
- loss functions such as Mean Square Error (MSE), Mean Absolute Error (MAE), or cross-entropy can be used to compute the loss, which represents the difference between the predicted results of the disease prediction model 16 and the actual disease data 15.
- MSE Mean Square Error
- MAE Mean Absolute Error
- cross-entropy can be used to compute the loss, which represents the difference between the predicted results of the disease prediction model 16 and the actual disease data 15.
- an optimizer can be used to iteratively adjust the parameters of the disease prediction model 16 in order to minimize the loss and optimize the model.
- the optimizer can be implemented using algorithms such as Gradient Descent (GD), Stochastic Gradient Descent (SGD), or Adaptive Moment Estimation (Adam), but the present disclosure is not limited thereto.
- the gradients are computed by taking partial derivatives of the loss function, and then the parameters of the disease prediction model 16 are adjusted based on these gradients to reduce the loss.
- the loss is gradually reduced until it converges to a minimum value.
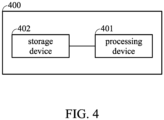
- FIG. 4 is the block diagram of a system 400 for establishing the disease prediction model, according to an embodiment of the present disclosure.
- the system 400 includes a processing device 401 and a storage device 402.
- the system 400 can be a personal computer (such as a desktop or laptop computer) or a server computer running operating systems (such as Windows, Mac OS, Linux, UNIX, etc.)
- the system 400 can also be a mobile device such as a tablet or smartphone, although the present disclosure is not limited thereto.
- the processing device 401 may include one or more hardware components for executing instructions, such as a central processing unit (CPU), a graphics processing unit (GPU), a microprocessor, a controller, a microcontroller, Application Specific Integrated Circuit (ASIC), Field Programmable Gate Array (FPGA), System on a Chip (SoC), etc., although the present disclosure is not limited thereto.
- the processing device 401 loads a program from the storage device 402 to execute steps S101 - S103 of the method 100 .
- the storage device 402 can be any device with non-volatile memory (e.g., read-only memory (ROM), electrically-erasable programmable read-only memory (EEPROM), flash memory, or non-volatile random access memory (NVRAM)), such as hard disk drives (HDD), solid-state drives (SSD), or optical discs, although the present disclosure is not limited thereto.
- the storage device 402 stores a program, as well as the disease data and microbiota data of a plurality of samples.
- the program includes instructions for implementing the method 100. When processing device 401 loads the program from storage device 402, these instructions will be executed to implement the method 100.
- the feature engineering approach provided by the present disclosure allows for the consideration of multi-level and multi-faceted microbiota features in disease prediction. Specifically, by establishing of species-level features 11A, the impact of microbial abundance and presence on diseases is taken into account, and the relationship between key pathogenic bacteria and diseases is highlighted, compared to existing methods. By establishing the microbiota interaction features 11B, the correlation between microbial growth and decline and diseases is taken into account. Additionally, by establishing microbiota features based on different taxonomic levels, it becomes possible to gain further insights into the functional units of microorganisms, even in the absence of knowledge about their functionality. This approach provides a starting point for subsequent analysis and research on pathogenic mechanisms. Furthermore, by establishing the community-level features 11C, the relationship between the disease and the "quality” and “quantity" of microbial communities, as well as relationship between the disease and the ecological balance between communities, are all taken into account.
- the method and system provided by the present disclosure for establishing disease prediction models enhance the richness and representativeness of feature information by constructing microbiota features from multiple aspects. This not only improves the accuracy of disease prediction but also facilitates the interpretation of analysis results. Furthermore, it helps deepen our understanding of the pathogenic mechanisms of diseases, aiding in the development of more effective treatment and prevention methods.
Landscapes
- Engineering & Computer Science (AREA)
- Health & Medical Sciences (AREA)
- Medical Informatics (AREA)
- Public Health (AREA)
- Biomedical Technology (AREA)
- Data Mining & Analysis (AREA)
- Databases & Information Systems (AREA)
- Epidemiology (AREA)
- General Health & Medical Sciences (AREA)
- Pathology (AREA)
- Primary Health Care (AREA)
- Life Sciences & Earth Sciences (AREA)
- Physics & Mathematics (AREA)
- Software Systems (AREA)
- Bioinformatics & Computational Biology (AREA)
- Biophysics (AREA)
- Computer Vision & Pattern Recognition (AREA)
- Evolutionary Computation (AREA)
- Artificial Intelligence (AREA)
- Bioinformatics & Cheminformatics (AREA)
- Bioethics (AREA)
- Biotechnology (AREA)
- Evolutionary Biology (AREA)
- Spectroscopy & Molecular Physics (AREA)
- Theoretical Computer Science (AREA)
- Measuring Or Testing Involving Enzymes Or Micro-Organisms (AREA)
- Investigating Or Analysing Biological Materials (AREA)
Abstract
A method for establishing a disease prediction model is provided. The method includes the steps of extracting feature values for multiple microbiota features from microbiota data of each of a plurality of samples, selecting a portion of the extracted microbiota features as selected features, and training a disease prediction model. Each piece of training data used in training the disease prediction model includes (i) disease data for each of the samples and (ii) the feature values of the selected features for the sample. The microbiota features include species-level features, microbiota interaction features, and community-level features.
Description
- This Application claims priority of
Taiwan Patent Application No. 112121368, filed on June 08, 2023 - The present disclosure relates to feature engineering technology, in particular to a method and system for establishing a disease prediction model.
- The term "microbiota" refers to the collective population of microorganisms such as bacteria, viruses, fungi, and yeasts that reside within the human body. Together, they form a complex ecosystem that enables the proper functioning of the body. Similar to other ecosystems, the disruption of a single species within the microbiota can potentially impact the ecological balance. The most intricate microbiota within the human body is the gut microbiota, which has a significant influence on human health. The gut microbiota not only affects intestinal functions but also plays a crucial role in metabolism and the regulation of the immune system, thereby influencing overall health and internal equilibrium. Imbalances in the gut microbiota have been associated with various diseases, such as neurodegenerative disorders, cardiovascular diseases, diabetes, autoimmune diseases, cancer, etc. For instance, animal and human studies have indicated that "Fusobacterium nucleatum" may be a pathogenic factor in colorectal cancer. Experimental evidence has shown that reducing the occurrence of tumors is possible by eliminating Fusobacterium nucleatum through antibiotic treatments. However, due to the highly intricate nature of the gut microbiota, there is currently a lack of solutions for disease prediction based on the gut microbiota.
- Therefore, there is a need for a method and system to establish a disease prediction model that can effectively utilize microbiota features to predict diseases. This disease prediction model can serve as an early warning system before the onset of diseases and provide further insights into their pathogenic mechanisms.
- An embodiment of the present disclosure provides a method executed by a computer system for establishing a disease prediction model. The method includes the steps of extracting feature values for multiple microbiota features from microbiota data of each of a plurality of samples, selecting a portion of the extracted microbiota features as selected features, and training a disease prediction model. Each piece of training data used in training the disease prediction model includes (i) disease data for each of the samples and (ii) the feature values of the selected features for the sample. The microbiota features include species-level features, microbiota interaction features, and community-level features.
- In an embodiment, the species-level features include relative abundance data and presence/absence data of each of a plurality of species.
- In an embodiment, the microbiota interaction features include the hierarchical ratio of two taxa on a taxonomic level.
- In an embodiment, the community-level features include a Beta diversity matrix.
- In an embodiment, the step of selecting a portion of the extracted microbiota features as the selected features includes the steps of inputting the disease data and the microbiota features into multiple feature selection models to obtain multiple feature pools, ranking the microbiota features based on the frequency of being selected into the feature pools by the feature selection models to obtain a feature ranking, and selecting a specified number of the microbiota features as the selected features based on the feature ranking. Each of the feature selection models selects one or more of the microbiota features to form the corresponding feature pool.
- An embodiment of the present disclosure provides a system for establishing a disease prediction model. The system includes a storage device and a processing device. The storage device stores disease data and microbiota data of a plurality of samples. The processing device loads a program from the storage device to execute the steps of the aforementioned method.
- The method and system provided by the present disclosure for establishing disease prediction models enhance the richness and representativeness of feature information by constructing microbiota features from multiple aspects. This not only improves the accuracy of disease prediction but also facilitates the interpretation of analysis results. Furthermore, it helps deepen our understanding of the pathogenic mechanisms of diseases, aiding in the development of more effective treatment and prevention methods.
- The present disclosure can be more fully understood by reading the subsequent detailed description and examples with references made to the accompanying drawings. Additionally, it should be appreciated that in the flow diagram of the present disclosure, the order of execution for each blocks can be changed, and/or some of the blocks can be changed, eliminated, or combined.
-
FIG. 1A is the flow diagram of a method for establishing a disease prediction model, according to an embodiment of the present disclosure; -
FIG. 1B corresponds to the embodiment ofFIG. 1A , and illustrates the schematic diagram of the method for establishing the disease prediction model; -
FIG. 2 is the flow diagram of an embodiment of the feature selection stage; -
FIG. 3 corresponds to the embodiment inFIG. 2 , and illustrates the schematic diagram of multiple feature selection models and feature pools; and -
FIG. 4 is the system block diagram of a system for establishing the disease prediction model, according to an embodiment of the present disclosure. - The following description provides embodiments of the invention, which are intended to describe the basic spirit of the invention, but is not intended to limit the invention. For the actual inventive content, reference must be made to the scope of the claims.
- In each of the following embodiments, the same reference numbers represent identical or similar elements or components.
- Ordinal terms used in the claims, such as "first," "second," "third," etc., are only for convenience of explanation, and do not imply any precedence relation between one another.
- The descriptions provided for the embodiments of the devices or systems also apply to the embodiments of the methods, and vice versa.
-
FIG. 1A is the flow diagram of amethod 100 for establishing a disease prediction model, according to an embodiment of the present disclosure. As shown inFIG. 1A , themethod 100 includes steps S101-S103.FIG. 1B corresponds to the embodiment ofFIG. 1A and illustrates the schematic diagram of themethod 100. As shown inFIG. 1B , themethod 100 includes a feature extraction phase P101, a feature selection phase P102, and a model training phase P103. Please refer to bothFIG. 1A andFIG. 1B for a better understanding of this embodiment. - Step S101 in
FIG. 1A corresponds to the feature extraction phase P101 inFIG. 1B . In step S101 and the feature extraction phase P101, feature values of microbiota features 11 are extracted from themicrobiota data 10 of each sample. Then, themethod 100 proceeds to step S102. - As shown in
FIG. 1B , the microbiota features 11 includes three types: species-level features 11A, microbiota interaction features 11B, and community-level features 11C. Each type includes one or more specific microbiota features. - Furthermore, in the embodiments of the present disclosure, the term "sample" refers to various specimens collected from the human body or animal body, such as blood, urine, saliva, feces, tissues, etc., which can be further analyzed, tested, or diagnosed. Each sample has corresponding
microbiota data 10 anddisease data 15, which describe the microbiota composition of the specimen and the disease type of the subject (i.e., the source of the specimen, whether it is a human or an animal). Since the gut microbiota is one of the most intricate microbiota in the human body and has a significant impact on human health, in the embodiments of the present disclosure, the gut microbiota is typically used as an example for themicrobiota data 10, although the present disclosure is not limited thereto. - In the example of human gut microbiota, the
microbiota data 10 can be collected through testing of fecal samples or collected through approaches such as gastrointestinal endoscopy. Thedisease data 15 can be collected using various medical diagnostic methods, such as blood tests, imaging examinations, and so on. However, the collection methods formicrobiota data 10 anddisease data 15 are not limited by the present disclosure. Other practices, such as blood testing, urine testing, or tissue biopsies, can also be used to collect relevant data. Additionally, the types of diseases that can be included in thedisease data 15 are not limited by the present disclosure. Depending on the practical application and requirements, the disease types in thedisease data 15 can include various conditions, such as infections, chronic diseases, cancers, etc. In the case of a perfectly healthy subject, thedisease data 15 can indicate the absence of any disease. Alternatively, thedisease data 15 can reflect the overall health status of the subject, such as the level of metabolic functioning or the quality of the immune system, although the present disclosure is not limited thereto. - In an embodiment, the
microbiota data 10 can be represented by the quantity or abundance of various species in the sample. It is worth to note that the disclosure does not limit themicrobiota data 10 to include all species present in the sample. In an embodiment, the inclusion of species in themicrobiota data 10 can be determined based on their prevalence in the sample. For example, themicrobiota data 10 may consider only species with a prevalence of over 10% in the sample. However, the selection of species in themicrobiota data 10 is not limited by the present disclosure. - In an embodiment, the species-level features 11A provide more detailed information about each species, including relative abundance data and presence/absence data for each species.
- Relative abundance data indicates the relative quantity of a species in the sample and is typically represented by the proportion of the species' DNA sequence in the sample. For example, if there are a total of 10 million bacterial cells in the sample, with 1 million of them being species A and 1.5 million being species B, the relative abundance value of species A would be 100/1000 = 0.1, and the relative abundance value of species B would be 150/1000 = 0.15. Therefore, the relative abundance value of 0.1 for species A and the relative abundance value of 0.15 for species B can be used as two feature values in the species-
level features 11A. - Presence/absence data indicates whether a species is present or absent in the sample and is typically represented in binary form. For example, if species C is present in the sample and species D is absent, the presence/absence value of species C would be 1, and the presence/absence value of species D would be 0. Therefore, the presence/absence value of 1 for species C and the presence/absence value of 0 for species D can be used as two feature values in the species-
level features 11A. - In an embodiment, the microbiota interaction features 11B include the hierarchical ratio between two taxa on a taxonomic level.
- The hierarchical ratio is an indicator for describing the interaction relationship between two species. Typically, all species are classified based on the taxonomic hierarchy, including phylum, class, order, family, genus, and species. Then, the relative abundance ratios between two species on each level are calculated to describe the compositional structure of microbial communities in the sample. Suppose there are two taxa, Taxon A and Taxon B, on a specific level (HHierarchy). Taxon A consists of m species with relative abundances X 1, X 2, X 3 ...Xm , while Taxon B consists of n species with relative abundances Y 1, Y 2, Y 3...Yn . The formula for calculating the hierarchical ratio is as follows:

- The following Table 1 provides an example of microbiota data for Subject 01.
Table 1 Phylum Class ... Species Relative Abundance Class Sum Phylum Sum Subject 01 Phylum A Class A ... a 0.1 0.2 0.3 ... b 0.1 Class B ... c 0.1 0.1 Phylum B Class C ... d 0.1 0.7 0.7 ... e 0.1 ... f 0.2 ... g 0.3 - When considering the taxonomic level of "phylum," the hierarchical ratio of Phylum A relative to Phylum B is calculated as the ratio between the sum of Phylum A's abundances and the sum of Phylum B's abundances in Table 1. The specific calculation is as follows:


- In an embodiment, community-
level feature 11C includes a Beta Diversity Matrix. The Beta Diversity Matrix is a mathematical tool for comparing the similarity or dissimilarity between different microbial communities. Each element in the matrix represents the degree of difference between two microbial communities, typically measured using distance or similarity metrics. - In an embodiment, the Beta Diversity Matrix can utilize the Jaccard similarity as a measurement metric. Jaccard similarity is based on the presence/absence data described previously and calculates the ratio between the number of shared species and the total number of species present in two microbial communities. The value of Jaccard similarity ranges between 0 and 1. A value closer to 1 indicates a higher number of shared species and lower microbial dissimilarity between the samples. Conversely, a value closer to 0 indicates a lower number of shared species and higher microbial dissimilarity between the samples. In practice, the
microbial data 10 of each sample can be used in rotation as a reference benchmark to calculate the microbial dissimilarity with other samples. Alternatively, pre-defined microbiota, such as the representative microbiota of diabetic patients, can be used as the reference benchmark. The calculation formula for Jaccard similarity is as follows:
- The following Table 2 provides an example of disease categories and the presence/absence values of various species for Subjects 01-05.
Table 2 Disease Category Subject Species A Species B Species C 0 Subject 01 0 1 1 0 Subject 02 0 1 0 0 Subject 03 1 1 1 1 Subject 04 0 0 0 1 Subject 05 1 0 1 
- Following the calculation described in the previous section, the Jaccard similarity values between all pairs of Subjects 01-05 can be calculated. These values form a Beta Diversity Matrix, which serves as the feature values for the community-
level features 11C. - In another embodiment, the Beta Diversity Matrix can be measured using Bray-Curtis similarity as the metric. Bray-Curtis similarity is based on the relative abundance values and calculates the sum of absolute differences between the relative abundances of each species in two communities divided by the sum of their relative abundances. The resulting value ranges between 0 and 1. A value closer to 1 indicates lower microbial dissimilarity between the samples, while a value closer to 0 indicates greater microbial dissimilarity between the samples. The calculation formula for Bray-Curtis similarity is as follows:

- Please refer back to
FIG. 1A andFIG. 1B . InFIG. 1A , step S102 corresponds to the feature selection phase P102 inFIG. 1B . In step S102 and the feature selection phase P102, a portion of the microbiota features 11 are selected as selected features 14. Then,method 100 proceeds to step S103. - In an embodiment, in step S102 and the feature selection phase P102, a feature selection model is used to select the selected features 14. Various statistical models or machine learning models can be employed to implement the feature selection model. Examples of statistical models include the least absolute shrinkage and selection operator (Lasso) algorithm, stepwise logistic regression, statistical tests, etc. Machine learning models, on the other hand, can include decision trees, logistic regression, naive Bayes, random forest, support vector machines (SVM), fully connected neural networks, etc, but the present disclosure is not limited thereto.
-
FIG. 2 is the flow diagram of one embodiment of step S102 fromFIG. 1A . In this embodiment, multiple feature selection models are used for feature selection. As shown inFIG. 2 , step S102 can further include steps S201-S203.FIG. 3 corresponds to the embodiment depicted inFIG. 2 and illustrates the schematic diagram of multiple feature selection models M(1)-M(N) and feature pools FP(1)-FP(N). Please refer to bothFIG. 2 andFIG. 3 together for a better understanding of this embodiment. - In step S201,
disease data 10 and the microbiota features including species-level features 11A, microbiota interaction features 11B, and community-level features 11C are input into N feature selection models, denoted as M(1)-M(N). This process generates N feature pools, denoted as FP(1)-FP(N). Then, the process proceeds to step S202. - As shown in
FIG. 3 , each of the feature selection models M(1)-M(N) selects one or more of the microbiota features including species-level features 11A, microbiota interaction features 11B, and community-level features 11C to form the corresponding feature pools. InFIG. 3 , feature selection model M(1) outputs feature pool FP(1), feature selection model M(2) outputs feature pool FP(2), and so on. Different feature selection models M(1)-M(N) will select different features, resulting in varying microbiota features within feature pools FP(1)-FP(N). - Furthermore, the feature selection models M(1)-M(N) can be implemented using various statistical models or machine learning models. Examples of statistical models include the least absolute shrinkage and selection operator (Lasso) algorithm, stepwise logistic regression, statistical tests, etc. Machine learning models, on the other hand, can include decision trees, logistic regression, naive Bayes, random forest, support vector machines (SVM), fully connected neural networks, etc, but the present disclosure is not limited thereto.
- In an embodiment, each of the feature selection models M(1)-M(N) calculates at least one statistical index for each microbiota feature one by one, and compares the statistical index with the corresponding critical value, so as to decide whether to select the microbiota feature to the corresponding feature pool. The critical value is a preset fixed value, which depends on the feature selection model itself. Statistical indicators can be, for example, P value, odds ratio, correlation coefficient, fold change, etc.
- In an embodiment, the number of microbiota features to be selected into the corresponding feature pools FP(1)-FP(N) can be determined based on the accuracy of each feature selection model M(1)-M(N). For instance, the scree plot or elbow method can be employed to decide the number of microbiota features selected by the feature selection models. In the feature curve plot generated using the scree plot or elbow method, the horizontal axis typically represents the number of features used by the model, while the vertical axis represents a performance metric such as accuracy or area under the curve (AUC). The optimal number of features is determined by the changes in the performance metric. Conceptually, as the number of features increases, the performance metric tends to improve. However, there comes a point where the rate of improvement in the performance metric diminishes significantly. At this point, the number of features that achieves the best trade-off between performance and feature quantity can be selected.
- Please refer back to
FIG. 2 . In step S202, the microbiota features are ranked based on the frequency of being selected into the feature pools FP(1)-FP(N) by the feature selection models M(1)-M(N). Thereby, a feature ranking is obtained. Then, the process proceeds to step S203. - The term "frequency of being selected into the feature pools FP(1)-FP(N) by the feature selection models M(1)-M(N)" can be understood as the count of feature pools in which a specific microbiota feature is included. A higher frequency indicates a higher importance or reference value for that microbiota feature. Therefore, microbiota features that rank higher in the feature ranking have greater importance or reference value.
- In step S203, based on the feature ranking, a specified number of microbiota features are selected from the microbiota features 11 as the selected features. The specified number can be a pre-defined value or determined based on the accuracy of the feature selection models. Specifically, multiple test datasets can be used to obtain multiple accuracies of the feature selection models when selecting different numbers of microbiota features. The test datasets are solely used to evaluate the accuracy of the feature selection models. After obtaining the accuracies of the feature selection models for different numbers of microbiota features, one of the feature selection models is selected based on these accuracies. For instance, the feature selection model with the highest accuracy can be selected. Suppose 10 different numbers of microbiota features are selected to evaluate the accuracy of the feature selection models. Each feature selection model will obtain 10 accuracies, and with X feature selection models, there will be 10X accuracies. From these 10X accuracies, the highest accuracy can be identified to select the feature selection model with the highest accuracy. Then, based on the selected feature selection model's number and accuracy, the specified number can be determined using the previously mentioned methods such as the scree plot or elbow method.
- Although the embodiment depicted in
FIG. 3 shows that species-level features 11A, microbiota interaction features 11B, and community-level features 11C are collectively input into feature selection models M(1)-M(N) to obtain feature pools FP(1)-FP(N), but the present disclosure is not limited thereto. In another embodiment, species-level features 11A, microbiota interaction features 11B, and community-level features 11C can be individually input into feature selection models M(1)-M(N) to obtain N*3 feature pools. The microbiota features within these feature pools will be integrated to generate a feature set. Then, a similar approach to steps S202-S203 can be used to select, from the feature set, the features that respectively corresponds to the species-level features 11A, microbiota interaction features 11B, and community-level features 11C as the selected features 14. - Please refer to
FIG. 1A andFIG. 1B . Step S103 inFIG. 1A corresponds to the model training phase P103 inFIG. 1B . In step S103 and the model training phase P103, adisease prediction model 16 is trained. The traineddisease prediction model 16 can take the selected features of the subjects as input data and generate predictions about diseases. Depending on the purpose of disease prediction, thedisease prediction model 16 can be a classification model that predicts disease types, or a regression model that predicts metabolic function indices, immune indices, or the probability of specific diseases, although the present disclosure is not limited thereto. - Furthermore, each
training data 12 used for training thedisease prediction model 16 includes (1)disease data 15 of each sample and (2) the feature values of the selected features 14 for that sample. During the model training phase P103, loss functions such as Mean Square Error (MSE), Mean Absolute Error (MAE), or cross-entropy can be used to compute the loss, which represents the difference between the predicted results of thedisease prediction model 16 and theactual disease data 15. Moreover, an optimizer can be used to iteratively adjust the parameters of thedisease prediction model 16 in order to minimize the loss and optimize the model. The optimizer can be implemented using algorithms such as Gradient Descent (GD), Stochastic Gradient Descent (SGD), or Adaptive Moment Estimation (Adam), but the present disclosure is not limited thereto. Taking the example of Gradient Descent optimizer, the gradients are computed by taking partial derivatives of the loss function, and then the parameters of thedisease prediction model 16 are adjusted based on these gradients to reduce the loss. Through iterative feedback and parameter updates in the training process, the loss is gradually reduced until it converges to a minimum value. -
FIG. 4 is the block diagram of asystem 400 for establishing the disease prediction model, according to an embodiment of the present disclosure. As shown inFIG. 4 , thesystem 400 includes aprocessing device 401 and astorage device 402. - The
system 400 can be a personal computer (such as a desktop or laptop computer) or a server computer running operating systems (such as Windows, Mac OS, Linux, UNIX, etc.) Thesystem 400 can also be a mobile device such as a tablet or smartphone, although the present disclosure is not limited thereto. - The
processing device 401 may include one or more hardware components for executing instructions, such as a central processing unit (CPU), a graphics processing unit (GPU), a microprocessor, a controller, a microcontroller, Application Specific Integrated Circuit (ASIC), Field Programmable Gate Array (FPGA), System on a Chip (SoC), etc., although the present disclosure is not limited thereto. In the embodiments of the present disclosure, theprocessing device 401 loads a program from thestorage device 402 to execute steps S101 - S103 of themethod 100 . - The
storage device 402 can be any device with non-volatile memory (e.g., read-only memory (ROM), electrically-erasable programmable read-only memory (EEPROM), flash memory, or non-volatile random access memory (NVRAM)), such as hard disk drives (HDD), solid-state drives (SSD), or optical discs, although the present disclosure is not limited thereto. In the embodiments of the present disclosure, thestorage device 402 stores a program, as well as the disease data and microbiota data of a plurality of samples. The program includes instructions for implementing themethod 100. When processingdevice 401 loads the program fromstorage device 402, these instructions will be executed to implement themethod 100. - The feature engineering approach provided by the present disclosure allows for the consideration of multi-level and multi-faceted microbiota features in disease prediction. Specifically, by establishing of species-
level features 11A, the impact of microbial abundance and presence on diseases is taken into account, and the relationship between key pathogenic bacteria and diseases is highlighted, compared to existing methods. By establishing the microbiota interaction features 11B, the correlation between microbial growth and decline and diseases is taken into account. Additionally, by establishing microbiota features based on different taxonomic levels, it becomes possible to gain further insights into the functional units of microorganisms, even in the absence of knowledge about their functionality. This approach provides a starting point for subsequent analysis and research on pathogenic mechanisms. Furthermore, by establishing the community-level features 11C, the relationship between the disease and the "quality" and "quantity" of microbial communities, as well as relationship between the disease and the ecological balance between communities, are all taken into account. - In summary, the method and system provided by the present disclosure for establishing disease prediction models enhance the richness and representativeness of feature information by constructing microbiota features from multiple aspects. This not only improves the accuracy of disease prediction but also facilitates the interpretation of analysis results. Furthermore, it helps deepen our understanding of the pathogenic mechanisms of diseases, aiding in the development of more effective treatment and prevention methods.
- The above paragraphs are described with multiple aspects. Obviously, the teachings of the specification may be performed in multiple ways. Any specific structure or function disclosed in examples is only a representative situation. According to the teachings of the specification, it should be noted by those skilled in the art that any aspect disclosed may be performed individually, or that more than two aspects could be combined and performed.
- While the invention has been described by way of example and in terms of the preferred embodiments, it should be understood that the invention is not limited to the disclosed embodiments. On the contrary, it is intended to cover various modifications and similar arrangements (as would be apparent to those skilled in the art). Therefore, the scope of the appended claims should be accorded the broadest interpretation so as to encompass all such modifications and similar arrangements.
Claims (10)
- A method for establishing a disease prediction model, executed by a computer system, the method comprising:extracting feature values for multiple microbiota features from microbiota data of each of a plurality of samples;selecting a portion of the extracted microbiota features as selected features; andtraining a disease prediction model, wherein each piece of training data used in training the disease prediction model comprises (i) disease data for each of the samples and (ii) the feature values of the selected features for the sample;wherein the microbiota features comprise species-level features, microbiota interaction features, and community-level features.
- The method as claimed in claim 1, wherein the species-level features comprise relative abundance data and presence/absence data of each of a plurality of species.
- The method as claimed in claim 1, wherein the microbiota interaction features comprise a hierarchical ratio between two taxa on a taxonomic level.
- The method as claimed in claim 1, wherein the community-level features comprise a Beta diversity matrix.
- The method as claimed in claim 1, wherein the step of selecting a portion of the extracted microbiota features as the selected features comprises:inputting the disease data and the microbiota features into multiple feature selection models to obtain multiple feature pools, wherein each of the feature selection models selects one or more of the microbiota features to form the corresponding feature pool;ranking the microbiota features based on frequency of being selected into the feature pools by the feature selection models to obtain a feature ranking; andselecting a specified number of the microbiota features are selected as the selected features based on the feature ranking.
- A system for establishing a disease prediction model, comprising:a storage device, for storing disease data and microbiota data of a plurality of samples; anda processing device, loading a program from the storage device to execute the following steps:extracting feature values for multiple microbiota features from the microbiota data of each of a plurality of samples;selecting a portion of the extracted microbiota features as selected features; andtraining a disease prediction model, wherein each piece of training data used in training the disease prediction model comprises (i) the disease data for each of the samples and (ii) the feature values of the selected features for the sample;wherein the microbiota features comprise species-level features, microbiota interaction features, and community-level features.
- The system as claimed in claim 6, wherein the species-level features comprise relative abundance data and presence/absence data of each of a plurality of species.
- The system as claimed in claim 6, wherein the microbiota interaction features comprise a hierarchical ratio between two taxa on a taxonomic level.
- The system as claimed in claim 6, wherein the community-level features comprise a Beta diversity matrix.
- The system as claimed in claim 6, wherein the processing device further executes:inputting the disease data and the microbiota features into multiple feature selection models to obtain multiple feature pools, wherein each of the feature selection models selects one or more of the microbiota features to form the corresponding feature pool;ranking the microbiota features based on frequency of being selected into the feature pools by the feature selection models to obtain a feature ranking; andselecting a specified number of the microbiota features are selected as the selected features based on the feature ranking.
Applications Claiming Priority (1)
| Application Number | Priority Date | Filing Date | Title |
|---|---|---|---|
| TW112121368A TWI826332B (en) | 2023-06-08 | 2023-06-08 | Method and system for establishing disease prediction model |
Publications (1)
| Publication Number | Publication Date |
|---|---|
| EP4475128A1 true EP4475128A1 (en) | 2024-12-11 |
Family
ID=88204103
Family Applications (1)
| Application Number | Title | Priority Date | Filing Date |
|---|---|---|---|
| EP23197981.6A Pending EP4475128A1 (en) | 2023-06-08 | 2023-09-18 | Method and system for establishing disease prediction model |
Country Status (3)
| Country | Link |
|---|---|
| US (1) | US20240412867A1 (en) |
| EP (1) | EP4475128A1 (en) |
| TW (1) | TWI826332B (en) |
Cited By (3)
| Publication number | Priority date | Publication date | Assignee | Title |
|---|---|---|---|---|
| CN119889701A (en) * | 2025-03-26 | 2025-04-25 | 厦门大学 | Disease prediction method and system based on microbial component layer characteristic self-adaptive fusion |
| CN120580088A (en) * | 2025-08-05 | 2025-09-02 | 农业农村部南京农业机械化研究所 | Joint prediction and evaluation method for disease and growth trends of farmed fish |
| CN121483388A (en) * | 2026-01-07 | 2026-02-06 | 浙江大学 | A system for predicting the peak time of non-esterified fatty acid concentration in the blood of dairy cows after calving |
Citations (4)
| Publication number | Priority date | Publication date | Assignee | Title |
|---|---|---|---|---|
| WO2019036176A1 (en) * | 2017-08-14 | 2019-02-21 | uBiome, Inc. | Disease-associated microbiome characterization process |
| US20210355546A1 (en) * | 2018-11-02 | 2021-11-18 | The Regents Of The University Of California | Methods to Diagnose and Treat Cancer Using Non-Human Nucleic Acids |
| US20220128556A1 (en) * | 2019-04-03 | 2022-04-28 | 4D Pharma Cork Limited | Methods of diagnosing disease |
| WO2022244005A1 (en) * | 2021-05-20 | 2022-11-24 | Tel Hashomer Medical Research Infrastructure And Services Ltd. | Disease classifier and dysbiosis index tools |
Family Cites Families (6)
| Publication number | Priority date | Publication date | Assignee | Title |
|---|---|---|---|---|
| EP3931360B1 (en) * | 2019-02-26 | 2025-08-27 | Tempus AI, Inc. | Systems and methods for using sequencing data for pathogen detection |
| WO2020245823A1 (en) * | 2019-06-03 | 2020-12-10 | Rambam Med-Tech Ltd. | Automatic prediction of blood infections |
| CN110415832A (en) * | 2019-07-31 | 2019-11-05 | 江苏省人民医院 | Infection control management system and method based on artificial intelligence |
| WO2021081424A1 (en) * | 2019-10-25 | 2021-04-29 | University Of Utah Research Foundation | Micro-balance biosensors to detect whole viruses |
| CN112509700A (en) * | 2021-02-05 | 2021-03-16 | 中国医学科学院阜外医院 | Stable coronary heart disease risk prediction method and device |
| CN114283890B (en) * | 2021-12-15 | 2023-04-07 | 南京医科大学 | Disease risk prediction device based on rumen coccus microbiota |
-
2023
- 2023-06-08 TW TW112121368A patent/TWI826332B/en active
- 2023-08-22 US US18/453,435 patent/US20240412867A1/en active Pending
- 2023-09-18 EP EP23197981.6A patent/EP4475128A1/en active Pending
Patent Citations (4)
| Publication number | Priority date | Publication date | Assignee | Title |
|---|---|---|---|---|
| WO2019036176A1 (en) * | 2017-08-14 | 2019-02-21 | uBiome, Inc. | Disease-associated microbiome characterization process |
| US20210355546A1 (en) * | 2018-11-02 | 2021-11-18 | The Regents Of The University Of California | Methods to Diagnose and Treat Cancer Using Non-Human Nucleic Acids |
| US20220128556A1 (en) * | 2019-04-03 | 2022-04-28 | 4D Pharma Cork Limited | Methods of diagnosing disease |
| WO2022244005A1 (en) * | 2021-05-20 | 2022-11-24 | Tel Hashomer Medical Research Infrastructure And Services Ltd. | Disease classifier and dysbiosis index tools |
Cited By (3)
| Publication number | Priority date | Publication date | Assignee | Title |
|---|---|---|---|---|
| CN119889701A (en) * | 2025-03-26 | 2025-04-25 | 厦门大学 | Disease prediction method and system based on microbial component layer characteristic self-adaptive fusion |
| CN120580088A (en) * | 2025-08-05 | 2025-09-02 | 农业农村部南京农业机械化研究所 | Joint prediction and evaluation method for disease and growth trends of farmed fish |
| CN121483388A (en) * | 2026-01-07 | 2026-02-06 | 浙江大学 | A system for predicting the peak time of non-esterified fatty acid concentration in the blood of dairy cows after calving |
Also Published As
| Publication number | Publication date |
|---|---|
| US20240412867A1 (en) | 2024-12-12 |
| TWI826332B (en) | 2023-12-11 |
| TW202449813A (en) | 2024-12-16 |
Similar Documents
| Publication | Publication Date | Title |
|---|---|---|
| Booth et al. | Development of a prognostic model for mortality in COVID-19 infection using machine learning | |
| Faul et al. | Epigenetic-based age acceleration in a representative sample of older Americans: Associations with aging-related morbidity and mortality | |
| Sun et al. | Identification of 12 cancer types through genome deep learning | |
| Saillard et al. | Validation of MSIntuit as an AI-based pre-screening tool for MSI detection from colorectal cancer histology slides | |
| US20240412867A1 (en) | Method and system for establishing disease prediction model | |
| Keuning et al. | Mortality prediction models in the adult critically ill: a scoping review | |
| Lippert et al. | An exhaustive epistatic SNP association analysis on expanded Wellcome Trust data | |
| Stabellini et al. | Social determinants of health and racial disparities in cardiac events in breast cancer | |
| Aminoshariae et al. | Tooth loss is a risk factor for cardiovascular disease mortality: a systematic review with meta-analyses | |
| Zarringhalam et al. | Robust phenotype prediction from gene expression data using differential shrinkage of co-regulated genes | |
| Tang et al. | Machine learning model to predict sepsis in ICU patients with intracerebral hemorrhage | |
| Ricci Lara et al. | Towards unraveling calibration biases in medical image analysis | |
| Han et al. | Predicting unplanned readmission due to cardiovascular disease in hospitalized patients with cancer: a machine learning approach | |
| Qian et al. | A predictive model to explore risk factors for severe COVID-19 | |
| Fuse et al. | Development of machine learning models for predicting unfavorable functional outcomes from preoperative data in patients with chronic subdural hematomas | |
| Ali et al. | Deceased-donor kidney transplant outcome prediction using artificial intelligence to aid decision-making in kidney allocation | |
| Mahdavi et al. | Hybrid feature engineering of medical data via variational autoencoders with triplet loss: a COVID-19 prognosis study | |
| Pilcher et al. | Estimating the number of organ donors in Australian hospitals—implications for monitoring organ donation practices | |
| Loi et al. | The diagnostic utility of host RNA biosignatures in adult patients with sepsis: a systematic review and meta-analysis | |
| Ma et al. | Enhancing early gestational diabetes mellitus prediction with imputation-based machine learning framework: A comparative study on real-world clinical records | |
| Robertson et al. | Selecting patients for Oncotype DX testing using standard clinicopathologic information | |
| Rumpf et al. | A Performance Comparison of Different YOLOv7 Networks for High-Accuracy Cell Classification in Bronchoalveolar Lavage Fluid Utilising the Adam Optimiser and Label Smoothing | |
| Shen et al. | Deciphering the impact of senescence in kidney transplant rejection: An integrative machine learning and multi-omics analysis via bulk and single-cell RNA sequencing | |
| Zhi et al. | Clinically validated graphical approaches identify hepatosplenic multimorbidity in individuals at risk of schistosomiasis | |
| Zhang et al. | Development and validation of a machine learning-based interpretable model for predicting sepsis by complete blood cell parameters |
Legal Events
| Date | Code | Title | Description |
|---|---|---|---|
| PUAI | Public reference made under article 153(3) epc to a published international application that has entered the european phase |
Free format text: ORIGINAL CODE: 0009012 |
|
| STAA | Information on the status of an ep patent application or granted ep patent |
Free format text: STATUS: THE APPLICATION HAS BEEN PUBLISHED |
|
| AK | Designated contracting states |
Kind code of ref document: A1 Designated state(s): AL AT BE BG CH CY CZ DE DK EE ES FI FR GB GR HR HU IE IS IT LI LT LU LV MC ME MK MT NL NO PL PT RO RS SE SI SK SM TR |
|
| STAA | Information on the status of an ep patent application or granted ep patent |
Free format text: STATUS: REQUEST FOR EXAMINATION WAS MADE |
|
| 17P | Request for examination filed |
Effective date: 20250424 |