EP4467929A1 - Calculation unit for a sensor device, sensor device and method related to updating a sensor model - Google Patents
Calculation unit for a sensor device, sensor device and method related to updating a sensor model Download PDFInfo
- Publication number
- EP4467929A1 EP4467929A1 EP23175438.3A EP23175438A EP4467929A1 EP 4467929 A1 EP4467929 A1 EP 4467929A1 EP 23175438 A EP23175438 A EP 23175438A EP 4467929 A1 EP4467929 A1 EP 4467929A1
- Authority
- EP
- European Patent Office
- Prior art keywords
- sensor
- model
- anomaly
- calculation unit
- sensor signals
- Prior art date
- Legal status (The legal status is an assumption and is not a legal conclusion. Google has not performed a legal analysis and makes no representation as to the accuracy of the status listed.)
- Granted
Links
Images







Classifications
-
- G—PHYSICS
- G01—MEASURING; TESTING
- G01D—MEASURING NOT SPECIALLY ADAPTED FOR A SPECIFIC VARIABLE; ARRANGEMENTS FOR MEASURING TWO OR MORE VARIABLES NOT COVERED IN A SINGLE OTHER SUBCLASS; TARIFF METERING APPARATUS; MEASURING OR TESTING NOT OTHERWISE PROVIDED FOR
- G01D3/00—Indicating or recording apparatus with provision for the special purposes referred to in the subgroups
- G01D3/08—Indicating or recording apparatus with provision for the special purposes referred to in the subgroups with provision for safeguarding the apparatus, e.g. against abnormal operation, against breakdown
-
- G—PHYSICS
- G01—MEASURING; TESTING
- G01D—MEASURING NOT SPECIALLY ADAPTED FOR A SPECIFIC VARIABLE; ARRANGEMENTS FOR MEASURING TWO OR MORE VARIABLES NOT COVERED IN A SINGLE OTHER SUBCLASS; TARIFF METERING APPARATUS; MEASURING OR TESTING NOT OTHERWISE PROVIDED FOR
- G01D3/00—Indicating or recording apparatus with provision for the special purposes referred to in the subgroups
- G01D3/02—Indicating or recording apparatus with provision for the special purposes referred to in the subgroups with provision for altering or correcting the law of variation
- G01D3/022—Indicating or recording apparatus with provision for the special purposes referred to in the subgroups with provision for altering or correcting the law of variation having an ideal characteristic, map or correction data stored in a digital memory
Definitions
- Embodiments relate to a control unit for a sensor device. Further embodiments relate to a sensor device that has a calculation unit and a sensor unit for providing sensor signals. Further embodiments relate to a method to determine sensor signals for a presence of an anomaly in the sensor signals derived whether an update of a used sensor model should be performed. More particularly, the disclosure relates to anomaly detection and mitigation for ageing and drifting of sensors, especially low cost sensors.
- Sensors are broadly used in many applications. Amongst them, there are gas sensors, humidity sensors, temperature sensors and others. Those sensors sometimes rely on a sensor model to convert measured signals into sensor signals.
- a calculation unit for a sensor device comprises an interface configured for obtaining sensor signals of the sensor device.
- the calculation unit comprises a processing processor configured for processing at least one sensor signal by use of a sensor model.
- the calculation unit comprises a model processor configured for evaluating sensor signals for a presence of an anomaly in the sensor signals that indicates an ageing of the sensor device.
- the model processor is configured for updating the sensor model based on the presence of the anomaly to at least partially compensate for the anomaly to obtain an updated sensor model.
- the processing processor is configured for using the updated sensor model for future sensor signals.
- a sensor device comprises such a calculation unit and a sensor unit for providing the sensor signals.
- a method comprises obtaining sensor signals of a sensor device.
- the method comprises processing at least one sensor signal by use of a sensor model and evaluating sensor signal for a presence of an anomaly in the sensor signals that indicates an ageing of the sensor device.
- the method comprises updating the sensor model based on the presence of the anomaly to at least partially compensate for the anomaly to obtain an updated sensor model and using the updated sensor model for future sensor signal.
- Fig. 1 shows a schematic block diagram of a sensor device 100 according to an embodiment.
- Sensor device 100 comprises a calculation unit 10 and a sensor unit 20 that is configured for providing sensor signals 12, for example, the sensor unit comprises at least one of a gas sensor, a temperature sensor, a humidity sensor and a pressure sensor such that the sensor signal 12 is related to the measured quantity.
- the sensor signal 12 may be or may comprise an electrical signal, an optical signal and/or any other type of signal.
- the calculation unit 12 may be adapted to operate in the sensor device 100 but may be implemented, produced and/or shipped together with or without the sensor unit 20.
- the calculation unit 10 comprises an interface configured for obtaining the sensor signals 12 of the sensor device 100. For example, this may comprises to receive the sensor signals 12 from the sensor unit 20, e.g., having a connection between the control unit 10 and the sensor unit 20, e.g., a wired, wireless and/or optical connection. However, it is not necessary to directly contact the sensor unit 20 with the control unit 10.
- the sensor unit 10 may also retrieve the sensor signals 12, e.g., from a memory or the like.
- the calculation unit 10 comprises a processing processor 16 configured for processing at least one sensor signal by use of a sensor model 18 1 .
- the sensor signal 12 received from sensor unit 20 may be processed by processing processor 16 to obtain a sensor result 22 that may indicate a result of model 18, being fed with the sensor signal 12.
- the calculation unit 10 further comprises a model processor 24 configured for evaluating sensor signals for a presence of an anomaly in the sensor signals.
- the model processor may evaluate the sensor signals for an anomaly that indicates an ageing of the sensor device 100, e.g., of the sensor unit 20.
- the model processor 24 is configured for updating the sensor model 18, to updated sensor model 18 2 .
- the update may be triggered based on the presence of the anomaly to at least partially compensate for the anomaly and/or the effects obtained thereby.
- the processing processor is configured for using the updated sensor model 18 2 for future sensor signals.
- the model processor 24 may provide the updated the sensor model 18 2 by use of a model signal 26.
- processing processor 16 and the model processor 24 may be implemented within a same circuitry or processing unit which may allow that the processing processor 16 has direct access on the determined updated model 18 2 .
- Updating the sensor model 18, may include various calculations that influence the updated model 18 2 .
- the calculation unit 10 may be configured, in connection with updating the sensor model 18 1 , for obtaining reference sensor signals for a reference sensor device and may determine an updated round of truth for the updated sensor model from the reference sensor signals, e.g., by use of the model processor 24.
- Such reference signals may comprise a structure, information and/or structure being known a priori such that the result the model should deliver may also be known and compared with an actual behavior of the model 18 1 .
- the model processor 24 may be configured for performing a transfer learning using the sensor model and reference sensor signals to obtain the updated sensor model. Such a transfer learning may allow to still benefit from the model 18 1 that has been learnt previously.
- the calculation unit 10 may be comprise an optional evaluation processor 28 configured for evaluating a certainty of the updated sensor model 18 2 .
- this can comprise a comparison against a given requirement such as a maximum allowed uncertainty for the expected accuracy obtained by the updated model 18 2 . If the threshold is exceeded, a further update with other, newly gathered or additional data may be performed to have another updated model that may be evaluated again.
- the evaluation processor 28 may be based on neural networks and optionally on artificial intelligence that may allow to quickly perform the evaluation. Thereby, the update sensing mechanism may be evaluated whether future data may be processed with a sufficient level of certainty, or, in other words, whether the update has been successful or not.
- a method and a device are described that allow to detect anomalies in the measuring devices and subsequently trigger one or more anomaly-specific procedures to maintain the sensing performance overtime.
- the methodology described herein relates to both, the method and the device.
- Embodiments described herein may be applied, amongst others, to chemoresistive gas sensing entities due to the fact that such devices show a considerable amount of ageing and/drift.
- gas sensors such as electrochemical sensors or a PAS (photoacoustic spectrography) sensor
- PAS photoacoustic spectrography
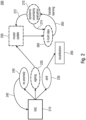
- Fig. 2 shows a schematic flow chart of a method 200 that may be implemented, at least in parts, by a calculation unit described herein.
- sensor signals may be evaluated for a presence of an anomaly in the sensor signals that indicate an ageing 220 of the sensor device.
- the calculation unit may implement, in step 210, a variational autoencoder (VAE) that may be based on a neural network and that may process temporarily dependent sensor signals, e.g., sensor signals 12, in order to predict if the signals show any type of anomalies in the sensor data such as sensor ageing 220 there may also be examined whether the sensor signals are subject to other anomalies such as a baseline drift 230.
- VAE variational autoencoder
- detection 220 of the sensor ageing may lead to a model update 250 as described in connection with the model processor 24, a detection 230 indicating an anomaly related to the drift or baseline drift may lead to a recalibration 260 of the sensor.
- an updated ground of truth i.e., new ground of truth data may be obtained in a step 260.
- an uncertainty evaluation 270 as described in connection with the evaluation processor 280. This may lead to an updated model along a path 272 or, in case of having insufficient certainty of the updated sensor model, e.g., when the described threshold is exceeded, another update may be performed along path 274.
- An absence of an anomaly detected in step 240 may lead to a return to step 210 to provide for another iteration of processing the sensor signals.
- the shown detection method is realized in the form of a neural network-based variational autoencoder, VAE, architecture, which may process the temporarily dependent sensor signal in order to predict, if the signal show any type of anomalies in the sensor data such as sensor ageing or baseline drift. If such anomaly behavior is detected, additional steps of predictive maintenance are started, depending on the anomaly type.
- VAE neural network-based variational autoencoder
- the sensing mechanism itself may be updated by performing a model update 250. If a baseline drift is detected, then the input data of the sensing mechanism or sensing algorithm may be recalibrated with a suitable recalibration approach.
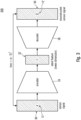
- a complete VAE structure may be used to detect anomalies based on reconstruction error during model interference according to the steps described in connection with Fig. 3 showing an example flow chart of a VAE-Loss approach 300.
- the original data i.e., sensor data 12
- a set of a plurality of instances of collected sensor data or a measurement data is met to a lower-dimensional latent space 32 by use of an encoder 34.
- the encoder 34 may form a part of the model processor 24 and may be configured for encoding the sensor signals to the latent space 32.
- the data may be remapped from the lower-dimensional latent space 32 to the original data space 34, which may called the reconstruction of the original data 12 based on a decoder 38, providing reconstructed sensor signals 12'.
- a reconstruction error that may be based as a difference between the sensor signal 12 and the reconstructed sensor signal 12', e.g., by having a quadratic value of the difference, e.g., ( x , x ⁇ ) 2 may be used as an anomaly score to detect anomalies. Data points with higher reconstruction errors may be considered as anomalies, whereas data points with lower reconstruction errors may be considered as non-anomalies.
- a threshold of the difference may be application specific. The lower the threshold the higher the rate of a model update and the required effort for the sake of a higher accuracy of the sensor.
- the encoder 34 may be comprised by a model processor 24 and may be configured for encoding the sensor signals 12 from a sensor signal space to a latent space, wherein the model processor 24 comprises the decoder 38 configured for decoding the encoded signals to the sensor signal space to obtain restored sensor signals 12'.
- the model processor 24 may be configured for determining a measure, e.g., the described loss as the quadratic distance, for determining a measure associated with a mismatch between the sensor signals and the restored sensor signals.
- the model processor 24 may be configured for determining the presence of the anomaly based on the measure being at least a predefined threshold.
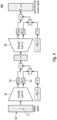
- Fig. 4 which may be referred to as VAE-Latent.
- This approach may leverage the probabilistic encoder structure to generate Gaussian distributions in the latent space for each data point that may be characterized by mean and variance. According to the approach, the anomalies may then be classified based on the respective distance to mean and variance.
- the encoder 34 may be use to map the normal data set 12 from the data space 36 to a lower dimensional latent space parametrized by Gaussian probability distribution having mean 42 and variance 44.
- the mean 42 of the outputs, e.g., cluster centrals, of the encoder 34 using the normal data set 12 may be calculated.
- the distance to the cluster centrals of the normal data to the encoded data samples of the normal and anomalous test data may be calculated. Further, if the threshold distance to the cluster centrals is exceeded, then the data sample is labelled as an anomaly, if not then the data sample is labelled as normal data or at least not labelled as anomaly.
- Such a labelling may be inverted, e.g., data that is not labelled as normal or acceptable data may be understood as anomalous data and data not labelled as anomalies data may be understood as normal data.
- the encoder of Fig. 3 ma provide for output z whilst the encoder in Fig. 4 may provide for output mean 42 and variance 44 of the (Gaussian) data distribution. Therefore, the parameters of the blocks and their architecture might differ after optimization for best performance.
- An autoencoder as described herein may have the goal to encode the data at the input layer (sensor data) into a latent space representation before it is used for reconstructing the original input data at the output layer with as minimal information loss as possible.
- P-dimensional input signals are first maps to a lower-dimensional space z (also called latent space) using an encoder function f(.). These signals are then mapped to P again using a decoder function g(.) indicated by reference sign 36 in Fig. 3 .
- f(.) and g(.) can be any type of neural network such as a recurrent neural network, a feed forward neural network or the like.
- the objective function training and autoencoder is based on the difference between the input and the output, according to some suitable difference measure such as root mean square error, RMSE, mean absolute error, MAE or the like.
- Figs. 3 and 4 illustrate working architectures of such an autoencoder.
- variational autoencoders a probabilistic extension of conventional autoencoder, may be used to detect distribution shifted sensor signal such as ageing and optionally drifting.
- the ideas is to leverage structures and properties of the latent space representation to visually cluster the high-dimensional sensor signals to differentiate between correct and corrupted sensor signals.
- Variational autoencoders, VAE are based on the probabilistic concept of variational Bayesian inference and introduce a probabilistic methodology to the latent space. Thus, rather than the encoder output being deterministic the encoder describes a probability distribution for each latent variable. The decoder is then used to reconstruct a latent vector by sampling from the encoder's defined distributions.
- Figs. 5a and 5b an example approach for detecting anomalous sensor data is presented. A different approach is described in connection with Figs. 6a and 6b . Both approaches may be used to implement embodiments described herein, e.g., in the calculation unit 10.
- the anomaly detection may be conducted by training the VAE by mostly or only using normal data for training.
- the probabilistic encoder q(.) may parameterize a normal distribution within the latent space with learnable mean and variance.
- the probabilistic decoder p (.) may output, e.g., only, the reconstructed mean of the latent variable zlx introducing these stochastic properties may allow for increased robustness and may serve as a regularization term.
- the complete VAE structure may be used to detect anomalies based on reconstruction error during model inference.
- the first approach that may be based on the structure illustrated in Fig. 3 may map the original data to lower-dimensional latent spaces where anomalies and normal data are expected to be separated. Afterwards, the data is remapped from the lower-dimensional latent space to the original data space 36, which may be called the reconstruction of the original data.
- the reconstruction error 46 between the original data 12 and its low-dimensional reconstruction 12' may be used as an anomaly score to detect anomalies. Data points with higher reconstruction errors may be considered as anomalies, whereas starter points with reconstruction errors may be considered as non-anomalies.
- decision 62 determining whether the loss ( x , x ⁇ ), i.e., the error score is below or exceeding an error threshold error index th. If this is not the case, the loss is smaller than the threshold, then the data point is inside the distribution 64, or else it is outside the distribution 66.
- Fig. 5b shows an example pseudo code for implementing at least a part of the functionality described in connection with 5a.
- Fig. 5a and Fig. 5b utilizes both the encoder 34 and the decoder 38 which may consume a lot of storage space (for the data) and may also be computational expensive, such that there may be a goal to reduce said effort, e.g., for tiny machine learning, ML, applications that are ideally embedded into microcontrollers. Therefore, in connection with Figs. 5a and 5b , another approach is described that may operate by only use the encoder to determine normal and anomaly data. The approach may leverage the probabilistic encoder structure to generate Gaussian distributions in the latent space for each data point that are characterized by mean 42 and variance 44.
- the anomalies may then be classified based on the respective distance to the mean outputs of the encoder based on the data set consisting of only normal data, e.g., the sensor data or sensor features.
- Such an approach may require only half the parameters and half the computational costs (at least approximately) as the approach shown in Fig. 5a .
- Figs. 5a and 5b show pseudocode and an illustration of an anomaly detection algorithm using a full variational autoencoder structure.
- the anomaly detection may be conducted by training the VAE only using normal data for training.
- the probabilistic encoder q(.) may parameterize a normal distribution within latent space with learnable mean 42 and variance 44. It may then be possible to monitor the resulting mean and variance and then classify anomalous and normal data based on the distance to the mean output of the encoder which is represented by decision 72 determining whether the mean ⁇ and/or the variance ⁇ are below a respective threshold ⁇ th , ⁇ tn respectively. This may lead to a result whether the sensor data is out of distribution 74 or inside the distribution 76.
- Fig. 6b shows a schematic illustration of pseudocode for implementing at least a part of the method or VAE encoder of Fig. 6a.
- Fig. 6a and Fig. 6b show pseudocode and an illustration for anomaly detection using the encoder structure.
- the model processor 24 of the calculation unit 10 may comprise an encoder 34 configured for encoding the sensor signals 12 to a latent space.
- the model processor 24 may be configured for determining a measure associated with a mismatch, e.g., the distance, between the encoded sensor signals on the hand and a benchmark such as cluster centrals of the normal data, on the other hand.
- the model processor 24 may be configured for determining the presence of the anomaly based on the measure being at least a predefined threshold.
- the encoder 34 may be configured for determining a first cluster central in the latent space of a benchmark data set, e.g., the normal data set, and for determining a second cluster central in the latent space of the sensor signals.
- the encoder 34 may be configured for determining the measure based on a relationship such as a difference and/or a ratio, between the first cluster central and the second cluster central.
- model processor 24 may comprise a neural network to provide at least an encoder of a variational autoencoder structure or is adapted for a principle component analysis.
- the principle component analysis, PCA may be considered as an alternative to the encoder implemented via a neural network although not necessarily operating a neural network.
- a PCA may be understood as a linear transformation into a new coordinate space with a reduced dimensionality.
- a principle forms an alternative to the VAE structures described herein.
- Embodiments further relate to a mitigation of ageing by use of a model update. As explained, a sensor may be subject to different effect such as drift and ageing. Some embodiments relate to mitigate both effect, i.e., the drift and the ageing. Such embodiments may benefit from distinguishing between the different effects and/or causes of the effects.
- Fig. 7a there is shown an implementation for a variational audioencoder architecture according to an embodiment that may be used in a calculation unit described herein to detect a drift and ageing data. This is based on the recognition that a sensor drift affects only certain features such as the time domain features, e.g., as the sensor sensitivity whilst sensor ageing may affect all features, i.e., both the time domain features and the frequency domain features.
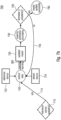
- Fig. 7a shows a possible implementation 280 of the variational autoencoder architecture 210 described in connection with Fig. 2 .
- two different VAE structures or architectures 210 1 and 210 2 may be used, structure 210, examining the time domain features and structure 210 2 examining the frequency domain features.
- time domain features may be extracted directly from the sensor signals, e.g., from raw data such as resistances, after normalization to the baseline and may comprise or consist of sensitivity and derivative/slope of the normalized signals.
- Frequency domain features may be extracted after transformation to the frequency domain, e.g., using an FFT and may comprise or consist of amplitude and phase information, e.g. of the main subcarriers present in the signal response and/or of the Total Harmonic Distortion, THD.
- the model processor 24 may be configured for determining the presence of the anomaly, the ageing, as a presence of a first anomaly 212 and for evaluating the sensor signals for a presence of a second anomaly that is related to a sensor drift.
- the calculation unit 10 may be configured for recalibrating the sensor device using a base line recalibration mechanism. That is, a presence of the time domain based anomaly 212 and an absence of the frequency domain anomaly may lead to an identification of the drift 230.
- the model processor 24 may be configured for performing an evaluation of time domain features, see VAE 210 1 , of the sensor signals to determine the presence of the second anomaly and for performing an evaluation of frequency domain features in VAE 210 2 of the sensor signals for determining the presence of the anomaly related to the ageing.
- the model processor 24 may be configured for associating the presence of the sensor drift with a presence of an anomaly in the time domain features and with an absence of an anomaly in the frequency domain features.
- the model processor 24 may associate the presence of sensor ageing with the presence of an anomaly in the frequency domain features.
- a single distance thereof may be used according to an embodiment. Such a single instance may be fed or input the result of the time domain analysis obtained by VAE 210 1 .
- the four possible outcomes of the binary decision may advantageously be presented, i.e., a yes/no decision whether the time domain analysis results in a detected anomaly and for each of both results a binary decision whether the frequency domain analysis results in a detected anomaly. This may result in states “anomaly detected” 212 or "no anomaly detected” 214 as results for the time domain analysis. And results “anomaly detected” 216, "no anomaly detected” 218 respectively with regard to a result of the frequency domain analysis.
- the structure may determine that ageing is present, see step 220 in Fig. 2 . If no anomaly is detected in the frequency domain (result 218) then depending from result 212 or 214, either a drift may be present (result 230) or no relevant anomaly is detected (result 240).
- the first autoencoder 210 1 may detect anomalies in the drifting features, e.g. the time domain features
- the second autoencoder 210 2 may detect anomalies in the remaining features, e.g., the frequency features. Based on the outcomes of both variational audioencoders 210 1 and 210 2 , it may then be decided whether drift, ageing or no anomalies are present in the data. That is, Fig. 7a shows a variational autoencoder flow for ageing and drift detection.
- Identifying the type of anomaly may be of importance for taking further measures to compensate changes that happened to the sensor on a physical level with the means of corresponding algorithm choices or calculations/amendments to be made.
- the measured signal can be recalibrated (step 260 in Fig. 2 ), e.g., with a base line recalibration mechanism to scale the signal back into the calibrated range of the model.
- the signal may be affected non-linearly and both time domain and frequency domain features may be affected at the same time with individual impact.
- the model may be adjusted to the new physical state of the sensor. Depending on the availability of reference values, the following procedures are possible.
- ground-truth samples from a reference device are available.
- This embodiment may be of particular advantage, especially if a concept drift is observed where the mapping between labels and features has changed.
- the ground-truth samples alongside the data from the aged device can be used to update the model.
- transfer learning can be used to make use of the previously trained model and to account for the possibly low number of update data samples in this process.
- a model can be used which not only outputs a sensor prediction such as a gas prediction in a case of a gas sensor, but also its prediction uncertainty. If the model update process has been successful, the prediction uncertainty should have decreased. If the prediction uncertainty did not decrease, a further update with more reference data might be considered as described in connection with Fig. 2 .
- Fig. 7b there is shown a flowchart of a method 700 in accordance with an embodiment.
- Quantity prediction of uncertainty in a step 740 may correspond to step 270.
- a decision whether the uncertainty is decreased may lead to an end of the process as the model update may be considered to be successful in 260. Else if there is no or insufficient decrease, a path 755 may lead back to data collecting in 720 in which other, additional or same data is collected.
- the threshold for anomaly detection of the variational autoencoder may be updated to accommodate for the current now calibrated/updated state. This way further drift or ageing will again result in an anomaly at the variational autoencoder detected by use of branch 242 in Fig. 2 .
- the update of the VAE can be achieved through a transfer learning procedure on the VAE by using the anomalous data which the model has been updated to account for.
- Embodiments allow to address the issue that traditional sensing mechanisms have the rather common assumption that the sensor signal for the initial parameter setting (training data) and the data in the application case (test data) are sampled from the same distribution, which would mean that the input feature space and the target data domain are equivalent.
- this assumption is often limited in real-life applications, due to the sensors intrinsic structure changing during its operation lifetime.
- Distributional shifts such as sensor drift and sensor ageing introduce a shift in data distribution when the sensor, e.g., gas sensor, is deployed in the environment.
- the adjusted or trained machine learning mechanisms are therefore prone to the effects of distributional shifts.
- the effects of such distributional shifts are visualized in Figs. 8a and 8b .
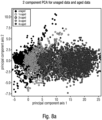
- Fig. 8a illustrates two-dimensional principle components of aged sensor data. It is noticeable that points representing the same ageing state are clustered together. The amount or times of ageing is selected as a non-limiting example only and does not represent a specific time scale. With increasing sensor ageing, the sensor data clusters may shift, to the right, highlighting the change in distribution.
- Fig. 8b illustrates two-dimensional principle components of additive drifted sensor data. Points representing the same drifting state are clustered together. Figs. 8a and 8b empirically show that sensor ageing and sensor drift change the data distribution differently, which means that they cause different effects and therefore may be handled differently.
- the disclosure is originated by the concrete need to stabilize chemoresistive gas sensors which are extremely prone to drift and ageing of their response in both time and frequency domain. Nevertheless, it is noted that the distribution shift issue is common also to other sensing applications which deal with time series data such as pressure sensors, ultrasonic sensors and the like, and where the initial calibration model may become obsolete over time and after the deployment of the sensor in real-world scenarios. Whilst simple machine learning methods have been used in predictive maintenance, for instance in the case of loT (Internet-of-Things) and industrial applications and also electrochemical gas sensors, see [1]. However, the autoencoder-based concepts and/or PCA-based concepts may provide for an advantage over said concepts.
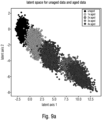
- Fig. 9a there is shown a latent 2D-dimension of encoded normal and aged sensor data for a variational autoencoder.
- Fig. 9b shows different metrics using the two proposed approaches VAE-Loss and VAE-Latent for detecting ageing of sensor data.
- the metric comprise an accuracy, a sensitivity, a specificity, a precision, a false positive rate, FPR, a false negative rate, FNR, and an F1 score. It may be seen that for detecting ageing sensor, the VAE-Latent approach only slightly degrades over the VAE-Loss approach whilst saving approximately half of the computational power.
- VAE-Loss out performs VAE-Latent and Support Vector Machines,SVM.
- VAE-Latent performs slightly worse than VAE-Loss across all metrics. This can be attributed to VAE-Latent using only the model's encoder structure and thus only utilizing half the model parameters.
- VAE-Latent has two threshold errors to be modified (mean threshold and variance threshold), whereas VAE-Loss has only one threshold value, the threshold loss.
- the sensitivity quantifying the probability that a data instance labelled as an anomaly is genuiely an anomaly is similar in VAE-Loss and VAE-Latent which might indicate that both pattern recognition systems are comparable in the latter task.
- the corresponding low FNR for VAE-Loss and VAE-Latent also underlines the similarities.
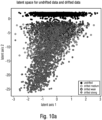
- Fig. 10a shows a latent 2D-dimension of encoded normal and multiplicative drifted sensor data for variational autoencoders.
- Fig. 10b shows anomaly detection metrics for multiplicative drifted sensor data.
- Fig. 11a shows a latent 2D-dimension of encoded normal and additive drifted sensor data for variational autoencoders.
- Fig. 11b there are shown different metrics using the two proposed approaches for detecting additive drift on sensor data.
- the VAE-Latent may sometimes tend to miss-classify normal data as anomaly data. This may be seen due to the lower specificity values with 86.77 % compared to 94.49 % in Fig. 9b and the higher FPR values for VAE-Latent with 13.23 % compared to VAE-Loss with 5.51 %.
- the precision metric shows that VAE-Loss can identify a high number of anomalies among all classified data samples at 90.1 %. However, VAE-Latent performs slightly inferior at 79.81 %. Last but not least, the F1 score and accuracy metric, which assess the overall performance on the classifiers, indicate that VAE-Loss performs the best.
- VAE-Loss and VAE-Latent both seem to perform reasonably well in anomaly detection due to their reasonably high precision and recall scores.
- the goal may be to find or retrieve the anomaly data.
- the proposed VAE-based anomaly detection methodologies outperformed traditional ML-based counterparts.
- the VAE-Latent space allows for high separability between aged and unaged sensor data.
- performing anomaly detection methodologies in the latent space with a reduced VAE structure by only using the encoder may be successful and can be considered for saving computational cost and memory by sacrificing small amounts of performance.
- Loss-based anomaly detection with VAE may perform the best, which might be attributed to the higher number of parameters.
- latent-based anomaly detection with VAE might yield a satisfactory performance for deployment.
- VAE-Latent may be superior for detecting drifting sensor data than aged sensor data.
- conditional distribution (xlz) is parameterized by parameters ⁇ and that their probability density functions are differentiable with respect to ⁇ and z.
- the true parameters ⁇ and the values of latent variable z are unknown.
- x p ⁇ x
- x ) are intractable distributions. These distributions are approximated and learned with neural networks. In order to approximate intractable distribution ( z
- x ) represents the probabilistic encoder.
- the encoder may output a distribution over the possible values of latent vector z from which x could have been generated, given a data point x in the training set.
- z ) describes the probabilistic decoder that, given a sample z from the latent space, reconstructs the input x by sampling from the probabilistic decoder.
- the decoder may output a distribution over the possible corresponding values of x.
- the probabilistic encoder does not output the sampled value of the distribution z but rather the distribution itself.
- the encoder and decoder network can generally be any type of neural network, but a common choice are feed-forward neural networks.
- the parameters ⁇ and ⁇ represent the parameters of the posteriors ( z
- x ⁇ p ⁇ z with following distributions: p ⁇ z N 0,1 p ⁇ x
- z N ⁇ x
- x N ⁇ z
- x [ ⁇ 1 , ⁇ 2 , ..., ⁇ N ] T , ⁇ z
- x [ ⁇ 1 , ⁇ 2 , ..., ⁇ N ] T , ⁇ x
- z [ ⁇ 1 , ⁇ 2 , ..., ⁇ M ] T and ⁇ x
- z ⁇ x
- z is a constant.
- z are parametrized by the neural network.
- the distribution's from above can be changed to any distribution.
- Gaussian distribution is the most common choice and are used in this implementation.
- the first term of the loss function is the logarithm of the probability density of generated output given the latent sample z over the negative expected reconstruction error.
- the expected reconstruction error is a loss term that describes how the output replicates the input.
- the second term of the loss function denotes the Kullbak-Leibler (KL) divergence of the support distribution ( z
- KL divergence can be considered as a constraint under which the data has to be reconstructed and to which extent the model has to update the parameters to accommodate new observations.
- KL divergence in the loss function encourages robustness to small perturbations along the latent dimension by inducing the probabilistic encoder ( z
- a conjugate prior over z such that the KL divergence can be analytically integrated a closed-form solution for Equation can be obtained.
- a possible choice for such conjugate prior that is also used in the scope of this invention disclosure is a standard multivariate normal distribution. Other distributions, such as Gaussian mixture models or Bernoulli distributions can be also considered.
- x (right term of the loss function): E q ⁇ Z
- the VAE architecture is definable along with associated loss function.
- data x (can be a temporal data stream or singular data) may be given as input to the encoder (any type of neural network).
- x is then transformed through a neural network into parameters ⁇ z
- latent value zlx is sampled from distribution N - ( ⁇ z
- This reconstruction represents the mean value ⁇ x
- Fig. 12 shows a schematic flow chart of a method 1200 according to an embodiment.
- a step 1210 comprises obtaining sensor signals of a sensor device.
- a step 1220 comprises processing at least one sensor signal by use of a sensor model.
- a step 1240 comprises evaluating sensor signals for a presence of an anomaly in the sensor signals that indicates an ageing of the sensor device.
- a step 1240 comprises updating the sensor model based on the presence of the anomaly that is partially compensate for the anomaly to obtain an updated sensor model.
- a step 1250 comprises using the updated sensor model for future sensor signals.
- the model processor (24) comprises an encoder (34), e.g., part of VAE, configured for encoding the sensor signals (12) to a latent space (32); wherein the model processor (24) is configured for determining a measure associated with a mismatch, e.g., distance, between the encoded sensor signals (12) on the one hand and a benchmark such as cluster centrals of the normal data on the other hand; wherein the model processor (24) is configured for determining the presence of the anomaly based on the measure being at least a predefined threshold.
- a measure associated with a mismatch e.g., distance
- the encoder (34) is configured for determining a first cluster central in the latent space (32) of a benchmark dataset e.g., a normal dataset and for determining a second cluster central in the latent space (32) of the sensor signals (12); wherein the encoder (34) is configured for determining the measure based on a relationship such as a ratio and/or a difference between the first cluster central and the second cluster central.
- the model processor (24) comprises an encoder (34), e.g., part of VAE, configured for encoding the sensor signals (12) from a sensor signal space to a latent space (32); wherein the model processor (24) comprises a decoder (38) configured for decoding the encoded sensor signals to the sensor signal space to obtain restored sensor signals (12'); wherein the model processor (24) is configured for determining a measure associated with a mismatch between the sensor signals (12) and the restored sensor signals (12'); wherein the model processor (24) is configured for determining the presence of the anomaly based on the measure being at least a predefined threshold.
- an encoder 34
- VAE e.g., part of VAE
- the model processor (24) comprises a neural network to provide at least an encoder (34) of a variational autoencoder structure or is adapted for a principal component analysis.
- the calculation unit (10) is configured for obtaining reference sensor signals from a reference sensor device and to determine an updated ground of truth for the updated sensor model (18 2 ) from the reference sensor signals.
- the model processor (24) is configured for performing a transfer learning (265) using the sensor model (18 1 ) and reference sensor signals from a reference sensor device to obtain the updated sensor model (18 2 ).
- the calculation unit comprises an evaluation processor (28), e.g., using artificial intelligence, Al, configured for evaluating a certainty of the updated sensor model (18 2 ), e.g., comprising a comparison against a given requirements, e.g. a maximum allowed uncertainty for the expected accuracy. For example, if the threshold is exceeded a new update with new/more data may be performed.
- an evaluation processor 28
- Al artificial intelligence
- the model processor (24) is configured for determining the presence of the anomaly as a presence of a first anomaly and for evaluating the sensor signals (12) for a presence of a second anomaly that is related to a sensor drift; wherein the calculation unit is configured for recalibrating (260) the sensor device (100) using a baseline recalibration mechanism.
- the model processor (24) is configured for performing a second evaluation of time domain features of the sensor signals (12) to determine the presence of the second anomaly; and for performing a first evaluation of frequency domain features of the sensor signals (12) for determining the presence of the first anomaly.
- model processor (24) is configured for associating the presence of the sensor drift with a presence of an anomaly in the time domain features and with an absence of an anomaly in the frequency domain features; and to associate the presence of sensor aging with the presence of an anomaly in the frequency domain features.
- a sensor device comprises:
- the sensor unit (20) comprises at least one of a gas sensor, a temperature sensor, a humidity sensor, an ultrasonic sensor and a pressure sensor.
- a fourteenth aspect comprises:
- a computer readable digital storage medium having stored thereon a computer program having a program code for performing, when running on a computer, a method according to aspect 14.
- aspects have been described in the context of an apparatus, it is clear that these aspects also represent a description of the corresponding method, where a block or device corresponds to a method step or a feature of a method step. Analogously, aspects described in the context of a method step also represent a description of a corresponding block or item or feature of a corresponding apparatus.
- embodiments of the invention can be implemented in hardware or in software.
- the implementation can be performed using a digital storage medium, for example a floppy disk, a DVD, a CD, a ROM, a PROM, an EPROM, an EEPROM or a FLASH memory, having electronically readable control signals stored thereon, which cooperate (or are capable of cooperating) with a programmable computer system such that the respective method is performed.
- a digital storage medium for example a floppy disk, a DVD, a CD, a ROM, a PROM, an EPROM, an EEPROM or a FLASH memory, having electronically readable control signals stored thereon, which cooperate (or are capable of cooperating) with a programmable computer system such that the respective method is performed.
- Some embodiments according to the invention comprise a data carrier having electronically readable control signals, which are capable of cooperating with a programmable computer system, such that one of the methods described herein is performed.
- embodiments of the present invention can be implemented as a computer program product with a program code, the program code being operative for performing one of the methods when the computer program product runs on a computer.
- the program code may for example be stored on a machine readable carrier.
- inventions comprise the computer program for performing one of the methods described herein, stored on a machine readable carrier.
- an embodiment of the inventive method is, therefore, a computer program having a program code for performing one of the methods described herein, when the computer program runs on a computer.
- a further embodiment of the inventive methods is, therefore, a data carrier (or a digital storage medium, or a computer-readable medium) comprising, recorded thereon, the computer program for performing one of the methods described herein.
- a further embodiment of the inventive method is, therefore, a data stream or a sequence of signals representing the computer program for performing one of the methods described herein.
- the data stream or the sequence of signals may for example be configured to be transferred via a data communication connection, for example via the Internet.
- a further embodiment comprises a processing means, for example a computer, or a programmable logic device, configured to or adapted to perform one of the methods described herein.
- a processing means for example a computer, or a programmable logic device, configured to or adapted to perform one of the methods described herein.
- a further embodiment comprises a computer having installed thereon the computer program for performing one of the methods described herein.
- a programmable logic device for example a field programmable gate array
- a field programmable gate array may cooperate with a microprocessor in order to perform one of the methods described herein.
- the methods are preferably performed by any hardware apparatus.
Landscapes
- Physics & Mathematics (AREA)
- General Physics & Mathematics (AREA)
- Engineering & Computer Science (AREA)
- Technology Law (AREA)
- Testing Or Calibration Of Command Recording Devices (AREA)
Abstract
Description
- Embodiments relate to a control unit for a sensor device. Further embodiments relate to a sensor device that has a calculation unit and a sensor unit for providing sensor signals. Further embodiments relate to a method to determine sensor signals for a presence of an anomaly in the sensor signals derived whether an update of a used sensor model should be performed. More particularly, the disclosure relates to anomaly detection and mitigation for ageing and drifting of sensors, especially low cost sensors.
- Sensors are broadly used in many applications. Amongst them, there are gas sensors, humidity sensors, temperature sensors and others. Those sensors sometimes rely on a sensor model to convert measured signals into sensor signals.
- Operating sensors overtime is complex due to variations in sensor devices.
- According to an embodiment, a calculation unit for a sensor device is provided. The control unit comprises an interface configured for obtaining sensor signals of the sensor device. The calculation unit comprises a processing processor configured for processing at least one sensor signal by use of a sensor model. The calculation unit comprises a model processor configured for evaluating sensor signals for a presence of an anomaly in the sensor signals that indicates an ageing of the sensor device. The model processor is configured for updating the sensor model based on the presence of the anomaly to at least partially compensate for the anomaly to obtain an updated sensor model. The processing processor is configured for using the updated sensor model for future sensor signals.
- According to an embodiment a sensor device comprises such a calculation unit and a sensor unit for providing the sensor signals.
- According to an embodiment, a method comprises obtaining sensor signals of a sensor device. The method comprises processing at least one sensor signal by use of a sensor model and evaluating sensor signal for a presence of an anomaly in the sensor signals that indicates an ageing of the sensor device. The method comprises updating the sensor model based on the presence of the anomaly to at least partially compensate for the anomaly to obtain an updated sensor model and using the updated sensor model for future sensor signal.
- Further advantageous embodiments in accordance with the disclosure are defined in the dependent claims.
- Further embodiments in accordance with the disclosure are descried herein after whilst making reference to the accompanying drawings, in which,
- Fig. 1
- shows a schematic block diagram of a sensor device according to an embodiment;
- Fig. 2
- a schematic flow chart of a method according to an embodiment that may be implemented, at least in parts, by a calculation unit described herein;
- Fig. 3
- showing an example flow chart of a VAE-Loss approach according to an embodiment;
- Fig. 4
- showing an example flow chart of a VAE-Latent approach according to an embodiment;
- Fig. 5a-b
- show a schematic illustration and pseudocode of an anomaly detection method using a full variational autoencoder structure according to an embodiment;
- Fig. 6a-b
- show a schematic illustration and pseudocode of an anomaly detection method using a reduced variational autoencoder structure according to an embodiment;
- Fig. 7a
- shows a possible implementation of a variational autoencoder architecture described in connection with
Fig. 2 in accordance with an embodiment; - Fig. 7b
- shows a flowchart of a method in accordance with an embodiment;
- Fig. 8a
- shows two-dimensional principle components of aged sensor data for describing an embodiment;
- Fig. 8b
- shows two-dimensional principle components of additive drifted sensor data for describing an embodiment;
- Fig. 9a
- shows a latent 2D-dimension of encoded normal and aged sensor data for a variational autoencoder according to an embodiment;
- Fig. 9b
- shows different metrics using the two proposed approaches VAE-Loss and VAE-Latent for detecting ageing of sensor data according to an embodiment;
- Fig. 10a
- shows a latent 2D-dimension of encoded normal and multiplicative drifted sensor data for variational autoencoders according to an embodiment;
- Fig. 10b
- shows anomaly detection metrics for multiplicative drifted sensor data according to an embodiment;
- Fig. 11a
- shows a latent 2D-dimension of encoded normal and additive drifted sensor data for variational autoencoders according to an embodiment;
- Fig. 11b
- shows different metrics using the two proposed approaches for detecting additive drift on sensor data according to an embodiment; and
- Fig. 12
- shows a schematic flow chart of a method according to an embodiment.
- Equal or equivalent elements or elements with equal or equivalent functionality are denoted in the following description by equal or equivalent reference numerals even if occurring in different figures.
- In the following description, a plurality of details is set forth to provide a more thorough explanation of embodiments of the present invention. However, it will be apparent to those skilled in the art that embodiments of the present invention may be practiced without these specific details. In other instances, well known structures and devices are shown in block diagram form rather than in detail in order to avoid obscuring embodiments of the present invention. In addition, features of the different embodiments described hereinafter may be combined with each other, unless specifically noted otherwise.
-
Fig. 1 shows a schematic block diagram of asensor device 100 according to an embodiment.Sensor device 100 comprises acalculation unit 10 and asensor unit 20 that is configured for providing sensor signals 12, for example, the sensor unit comprises at least one of a gas sensor, a temperature sensor, a humidity sensor and a pressure sensor such that thesensor signal 12 is related to the measured quantity. Thesensor signal 12 may be or may comprise an electrical signal, an optical signal and/or any other type of signal. - The
calculation unit 12 may be adapted to operate in thesensor device 100 but may be implemented, produced and/or shipped together with or without thesensor unit 20. Thecalculation unit 10 comprises an interface configured for obtaining the sensor signals 12 of thesensor device 100. For example, this may comprises to receive the sensor signals 12 from thesensor unit 20, e.g., having a connection between thecontrol unit 10 and thesensor unit 20, e.g., a wired, wireless and/or optical connection. However, it is not necessary to directly contact thesensor unit 20 with thecontrol unit 10. For example, thesensor unit 10 may also retrieve the sensor signals 12, e.g., from a memory or the like. - The
calculation unit 10 comprises aprocessing processor 16 configured for processing at least one sensor signal by use of asensor model 181. For example, thesensor signal 12 received fromsensor unit 20 may be processed by processingprocessor 16 to obtain asensor result 22 that may indicate a result ofmodel 18, being fed with thesensor signal 12. - The
calculation unit 10 further comprises amodel processor 24 configured for evaluating sensor signals for a presence of an anomaly in the sensor signals. The model processor may evaluate the sensor signals for an anomaly that indicates an ageing of thesensor device 100, e.g., of thesensor unit 20. Themodel processor 24 is configured for updating thesensor model 18, to updatedsensor model 182. The update may be triggered based on the presence of the anomaly to at least partially compensate for the anomaly and/or the effects obtained thereby. The processing processor is configured for using the updatedsensor model 182 for future sensor signals. For example, themodel processor 24 may provide the updated thesensor model 182 by use of amodel signal 26. - However, according to embodiments the
processing processor 16 and themodel processor 24 may be implemented within a same circuitry or processing unit which may allow that theprocessing processor 16 has direct access on the determined updatedmodel 182. - Updating the
sensor model 18, may include various calculations that influence the updatedmodel 182. According to some embodiments, thecalculation unit 10 may be configured, in connection with updating thesensor model 181, for obtaining reference sensor signals for a reference sensor device and may determine an updated round of truth for the updated sensor model from the reference sensor signals, e.g., by use of themodel processor 24. Such reference signals may comprise a structure, information and/or structure being known a priori such that the result the model should deliver may also be known and compared with an actual behavior of themodel 181. - According to some embodiments, for updating the sensor model, the
model processor 24 may be configured for performing a transfer learning using the sensor model and reference sensor signals to obtain the updated sensor model. Such a transfer learning may allow to still benefit from themodel 181 that has been learnt previously. - According to some embodiments, the
calculation unit 10 may be comprise anoptional evaluation processor 28 configured for evaluating a certainty of the updatedsensor model 182. For example, this can comprise a comparison against a given requirement such as a maximum allowed uncertainty for the expected accuracy obtained by the updatedmodel 182. If the threshold is exceeded, a further update with other, newly gathered or additional data may be performed to have another updated model that may be evaluated again. - The
evaluation processor 28 may be based on neural networks and optionally on artificial intelligence that may allow to quickly perform the evaluation. Thereby, the update sensing mechanism may be evaluated whether future data may be processed with a sufficient level of certainty, or, in other words, whether the update has been successful or not. - Details about evaluating the sensor signals for the presence of an anomaly that is related to an ageing of the
sensor device 100 is explained in the following. According to embodiment, a method and a device are described that allow to detect anomalies in the measuring devices and subsequently trigger one or more anomaly-specific procedures to maintain the sensing performance overtime. The methodology described herein relates to both, the method and the device. Embodiments described herein may be applied, amongst others, to chemoresistive gas sensing entities due to the fact that such devices show a considerable amount of ageing and/drift. Nevertheless, it can also be applied to other types of gas sensors such as electrochemical sensors or a PAS (photoacoustic spectrography) sensor, and even to other sensing and measuring scenarios outside the environmental sensing field which process time series data and are subject to distribution shifts. Examples thereof are, beside the mentioned gas sensor, a temperature sensor, a humidity sensor and a pressure sensor. -
Fig. 2 shows a schematic flow chart of amethod 200 that may be implemented, at least in parts, by a calculation unit described herein. At astep 210, sensor signals may be evaluated for a presence of an anomaly in the sensor signals that indicate anageing 220 of the sensor device. For example, but not necessarily limited hereto, the calculation unit may implement, instep 210, a variational autoencoder (VAE) that may be based on a neural network and that may process temporarily dependent sensor signals, e.g., sensor signals 12, in order to predict if the signals show any type of anomalies in the sensor data such assensor ageing 220 there may also be examined whether the sensor signals are subject to other anomalies such as abaseline drift 230. There may also be aresult 240 according to which no anomaly is detected or at least no anomaly that exceeds a specific threshold that would require counter measures. Whilstdetection 220 of the sensor ageing may lead to amodel update 250 as described in connection with themodel processor 24, adetection 230 indicating an anomaly related to the drift or baseline drift may lead to arecalibration 260 of the sensor. - Based on the
model update 250, an updated ground of truth, i.e., new ground of truth data may be obtained in astep 260. For forming a transfer learning as described above may lead to anuncertainty evaluation 270 as described in connection with theevaluation processor 280. This may lead to an updated model along apath 272 or, in case of having insufficient certainty of the updated sensor model, e.g., when the described threshold is exceeded, another update may be performed alongpath 274. - An absence of an anomaly detected in
step 240 may lead to a return to step 210 to provide for another iteration of processing the sensor signals. - In other words, the shown detection method is realized in the form of a neural network-based variational autoencoder, VAE, architecture, which may process the temporarily dependent sensor signal in order to predict, if the signal show any type of anomalies in the sensor data such as sensor ageing or baseline drift. If such anomaly behavior is detected, additional steps of predictive maintenance are started, depending on the anomaly type.
- If
sensor ageing 220 is detected, then the sensing mechanism itself may be updated by performing amodel update 250. If a baseline drift is detected, then the input data of the sensing mechanism or sensing algorithm may be recalibrated with a suitable recalibration approach. - In order to perform a model update for an age sensor, a set of different methodological steps may be used
- new (ground-truth)
data 260 may be connected by using a reference device creating accurate labels of the targeted measuring quantity alongside the measurement from the aged device; - the newly gathered data may then be used to perform a
transfer learning procedure 265 by training the old sensing mechanism with the new data on the top of the old model; - an explainable artificial intelligence Al, technique may be used in order to estimate, if the updated sensing mechanism predicts new data with a sufficient level of certainty as described in connection with the
evaluation processor 28 and theevaluation 270. This can be for instance quantified by using epistemic uncertainty evaluation; - This procedure may be repeated until a predefined certainty level threshold is reached.
- For the
ageing 220, different approaches may be used, two of them explained hereinafter. Both approaches allow to detect anomalous sensor data and both approaches are based on the VAE architecture. - In a first approach that may be referred to as VAE-Loss, a complete VAE structure may be used to detect anomalies based on reconstruction error during model interference according to the steps described in connection with
Fig. 3 showing an example flow chart of a VAE-Loss approach 300. - Therein, the original data, i.e.,
sensor data 12, in particular, a set of a plurality of instances of collected sensor data or a measurement data is met to a lower-dimensionallatent space 32 by use of anencoder 34. In the lower-dimensionallatent space 32 anomalies and normal data are expected to be separated which will be explained later. Theencoder 34 may form a part of themodel processor 24 and may be configured for encoding the sensor signals to thelatent space 32. - Afterwards, the data may be remapped from the lower-dimensional
latent space 32 to theoriginal data space 34, which may called the reconstruction of theoriginal data 12 based on adecoder 38, providing reconstructed sensor signals 12'. - A reconstruction error that may be based as a difference between the
sensor signal 12 and the reconstructed sensor signal 12', e.g., by having a quadratic value of the difference, e.g., (x, x̂)2 may be used as an anomaly score to detect anomalies. Data points with higher reconstruction errors may be considered as anomalies, whereas data points with lower reconstruction errors may be considered as non-anomalies. A threshold of the difference may be application specific. The lower the threshold the higher the rate of a model update and the required effort for the sake of a higher accuracy of the sensor. - Following such an approach, the
encoder 34 may be comprised by amodel processor 24 and may be configured for encoding the sensor signals 12 from a sensor signal space to a latent space, wherein themodel processor 24 comprises thedecoder 38 configured for decoding the encoded signals to the sensor signal space to obtain restored sensor signals 12'. Themodel processor 24 may be configured for determining a measure, e.g., the described loss as the quadratic distance, for determining a measure associated with a mismatch between the sensor signals and the restored sensor signals. Themodel processor 24 may be configured for determining the presence of the anomaly based on the measure being at least a predefined threshold. - Another approach is described in connection with
Fig. 4 which may be referred to as VAE-Latent. This approach may leverage the probabilistic encoder structure to generate Gaussian distributions in the latent space for each data point that may be characterized by mean and variance. According to the approach, the anomalies may then be classified based on the respective distance to mean and variance. When referring toFig. 4 showing a schematic flow chart of amethod 400 to implement this VAE-Latent approach, theencoder 34 may be use to map thenormal data set 12 from thedata space 36 to a lower dimensional latent space parametrized by Gaussian probabilitydistribution having mean 42 andvariance 44. - The mean 42 of the outputs, e.g., cluster centrals, of the
encoder 34 using thenormal data set 12 may be calculated. The distance to the cluster centrals of the normal data to the encoded data samples of the normal and anomalous test data may be calculated. Further, if the threshold distance to the cluster centrals is exceeded, then the data sample is labelled as an anomaly, if not then the data sample is labelled as normal data or at least not labelled as anomaly. Such a labelling may be inverted, e.g., data that is not labelled as normal or acceptable data may be understood as anomalous data and data not labelled as anomalies data may be understood as normal data. - The encoder of
Fig. 3 ma provide for output z whilst the encoder inFig. 4 may provide for output mean 42 andvariance 44 of the (Gaussian) data distribution. Therefore, the parameters of the blocks and their architecture might differ after optimization for best performance. - An autoencoder as described herein may have the goal to encode the data at the input layer (sensor data) into a latent space representation before it is used for reconstructing the original input data at the output layer with as minimal information loss as possible. P-dimensional input signals are first maps to a lower-dimensional space z (also called latent space) using an encoder function f(.). These signals are then mapped to P again using a decoder function g(.) indicated by
reference sign 36 inFig. 3 . To best reconstruct the original input f(.) and g(.) can be any type of neural network such as a recurrent neural network, a feed forward neural network or the like. - Thus, the objective function training and autoencoder is based on the difference between the input and the output, according to some suitable difference measure such as root mean square error, RMSE, mean absolute error, MAE or the like.
Figs. 3 and4 illustrate working architectures of such an autoencoder. - In the scope of the disclosure, variational autoencoders, a probabilistic extension of conventional autoencoder, may be used to detect distribution shifted sensor signal such as ageing and optionally drifting. The ideas is to leverage structures and properties of the latent space representation to visually cluster the high-dimensional sensor signals to differentiate between correct and corrupted sensor signals. Variational autoencoders, VAE, are based on the probabilistic concept of variational Bayesian inference and introduce a probabilistic methodology to the latent space. Thus, rather than the encoder output being deterministic the encoder describes a probability distribution for each latent variable. The decoder is then used to reconstruct a latent vector by sampling from the encoder's defined distributions.
- In connection with
Figs. 5a and5b an example approach for detecting anomalous sensor data is presented. A different approach is described in connection withFigs. 6a and6b . Both approaches may be used to implement embodiments described herein, e.g., in thecalculation unit 10. The anomaly detection may be conducted by training the VAE by mostly or only using normal data for training. The probabilistic encoder q(.) may parameterize a normal distribution within the latent space with learnable mean and variance. In contrast, the probabilistic decoder p(.) may output, e.g., only, the reconstructed mean of the latent variable zlx introducing these stochastic properties may allow for increased robustness and may serve as a regularization term. - In the first approach, the complete VAE structure may be used to detect anomalies based on reconstruction error during model inference. The first approach that may be based on the structure illustrated in
Fig. 3 may map the original data to lower-dimensional latent spaces where anomalies and normal data are expected to be separated. Afterwards, the data is remapped from the lower-dimensional latent space to theoriginal data space 36, which may be called the reconstruction of the original data. Thereconstruction error 46 between theoriginal data 12 and its low-dimensional reconstruction 12' may be used as an anomaly score to detect anomalies. Data points with higher reconstruction errors may be considered as anomalies, whereas starter points with reconstruction errors may be considered as non-anomalies. This is indicated bydecision 62 determining whether the loss (x, x̂), i.e., the error score is below or exceeding an error threshold error index th. If this is not the case, the loss is smaller than the threshold, then the data point is inside thedistribution 64, or else it is outside thedistribution 66. -
Fig. 5b shows an example pseudo code for implementing at least a part of the functionality described in connection with 5a. - The approach described in connection with
Fig. 5a andFig. 5b utilizes both theencoder 34 and thedecoder 38 which may consume a lot of storage space (for the data) and may also be computational expensive, such that there may be a goal to reduce said effort, e.g., for tiny machine learning, ML, applications that are ideally embedded into microcontrollers. Therefore, in connection withFigs. 5a and5b , another approach is described that may operate by only use the encoder to determine normal and anomaly data. The approach may leverage the probabilistic encoder structure to generate Gaussian distributions in the latent space for each data point that are characterized by mean 42 andvariance 44. According to the approach, the anomalies may then be classified based on the respective distance to the mean outputs of the encoder based on the data set consisting of only normal data, e.g., the sensor data or sensor features. Such an approach may require only half the parameters and half the computational costs (at least approximately) as the approach shown inFig. 5a . - In other words,
Figs. 5a and5b show pseudocode and an illustration of an anomaly detection algorithm using a full variational autoencoder structure. - A method according to the VAE-Latent proposal is illustrated in
Fig. 6a . The anomaly detection may be conducted by training the VAE only using normal data for training. The probabilistic encoder q(.) may parameterize a normal distribution within latent space with learnable mean 42 andvariance 44. It may then be possible to monitor the resulting mean and variance and then classify anomalous and normal data based on the distance to the mean output of the encoder which is represented bydecision 72 determining whether the mean µ and/or the variance σ are below a respective threshold µth, σtn respectively. This may lead to a result whether the sensor data is out ofdistribution 74 or inside thedistribution 76. -
Fig. 6b shows a schematic illustration of pseudocode for implementing at least a part of the method or VAE encoder ofFig. 6a. Fig. 6a andFig. 6b show pseudocode and an illustration for anomaly detection using the encoder structure. - When referring to
Fig. 6a , themodel processor 24 of thecalculation unit 10 may comprise anencoder 34 configured for encoding the sensor signals 12 to a latent space. Themodel processor 24 may be configured for determining a measure associated with a mismatch, e.g., the distance, between the encoded sensor signals on the hand and a benchmark such as cluster centrals of the normal data, on the other hand. Themodel processor 24 may be configured for determining the presence of the anomaly based on the measure being at least a predefined threshold. For example, theencoder 34 may be configured for determining a first cluster central in the latent space of a benchmark data set, e.g., the normal data set, and for determining a second cluster central in the latent space of the sensor signals. Theencoder 34 may be configured for determining the measure based on a relationship such as a difference and/or a ratio, between the first cluster central and the second cluster central. - Both approaches described herein may rely on a control unit where the
model processor 24 may comprise a neural network to provide at least an encoder of a variational autoencoder structure or is adapted for a principle component analysis. The principle component analysis, PCA, may be considered as an alternative to the encoder implemented via a neural network although not necessarily operating a neural network. A PCA may be understood as a linear transformation into a new coordinate space with a reduced dimensionality. However, such a principle forms an alternative to the VAE structures described herein. Embodiments further relate to a mitigation of ageing by use of a model update. As explained, a sensor may be subject to different effect such as drift and ageing. Some embodiments relate to mitigate both effect, i.e., the drift and the ageing. Such embodiments may benefit from distinguishing between the different effects and/or causes of the effects. - In
Fig. 7a , there is shown an implementation for a variational audioencoder architecture according to an embodiment that may be used in a calculation unit described herein to detect a drift and ageing data. This is based on the recognition that a sensor drift affects only certain features such as the time domain features, e.g., as the sensor sensitivity whilst sensor ageing may affect all features, i.e., both the time domain features and the frequency domain features. -
Fig. 7a shows apossible implementation 280 of thevariational autoencoder architecture 210 described in connection withFig. 2 . According to the embodiment shown inFig. 7a , two different VAE structures orarchitectures structure 210, examining the time domain features andstructure 2102 examining the frequency domain features. - According to embodiments, time domain features may be extracted directly from the sensor signals, e.g., from raw data such as resistances, after normalization to the baseline and may comprise or consist of sensitivity and derivative/slope of the normalized signals. Frequency domain features may be extracted after transformation to the frequency domain, e.g., using an FFT and may comprise or consist of amplitude and phase information, e.g. of the main subcarriers present in the signal response and/or of the Total Harmonic Distortion, THD.
- As may be seen from
Fig. 7a , themodel processor 24 may be configured for determining the presence of the anomaly, the ageing, as a presence of afirst anomaly 212 and for evaluating the sensor signals for a presence of a second anomaly that is related to a sensor drift. Thecalculation unit 10 may be configured for recalibrating the sensor device using a base line recalibration mechanism. That is, a presence of the time domain basedanomaly 212 and an absence of the frequency domain anomaly may lead to an identification of thedrift 230. According to the embodiment, themodel processor 24 may be configured for performing an evaluation of time domain features, seeVAE 2101, of the sensor signals to determine the presence of the second anomaly and for performing an evaluation of frequency domain features inVAE 2102 of the sensor signals for determining the presence of the anomaly related to the ageing. According to some embodiments, themodel processor 24 may be configured for associating the presence of the sensor drift with a presence of an anomaly in the time domain features and with an absence of an anomaly in the frequency domain features. Alternatively or in addition, themodel processor 24 may associate the presence of sensor ageing with the presence of an anomaly in the frequency domain features. - Although showing two
different instances VAE 2101. However, by showing twoinstances - Regardless whether having determined an anomaly in the time domain at
state 212 or no anomaly instate 214 and when detecting an anomaly in the frequency domain to arrive atresult 216, the structure may determine that ageing is present, seestep 220 inFig. 2 . If no anomaly is detected in the frequency domain (result 218) then depending fromresult - That is, the
first autoencoder 2101 may detect anomalies in the drifting features, e.g. the time domain features, thesecond autoencoder 2102 may detect anomalies in the remaining features, e.g., the frequency features. Based on the outcomes of bothvariational audioencoders Fig. 7a shows a variational autoencoder flow for ageing and drift detection. - Identifying the type of anomaly may be of importance for taking further measures to compensate changes that happened to the sensor on a physical level with the means of corresponding algorithm choices or calculations/amendments to be made. In the case of drift, the measured signal can be recalibrated (
step 260 inFig. 2 ), e.g., with a base line recalibration mechanism to scale the signal back into the calibrated range of the model. - In case of ageing, the signal may be affected non-linearly and both time domain and frequency domain features may be affected at the same time with individual impact. To compensate, the model may be adjusted to the new physical state of the sensor. Depending on the availability of reference values, the following procedures are possible.
- According to an embodiment, ground-truth samples from a reference device are available. This embodiment may be of particular advantage, especially if a concept drift is observed where the mapping between labels and features has changed. In this case, the ground-truth samples alongside the data from the aged device can be used to update the model. In this case, transfer learning can be used to make use of the previously trained model and to account for the possibly low number of update data samples in this process. In order to ensure the quality and suitability of the updating process, a model can be used which not only outputs a sensor prediction such as a gas prediction in a case of a gas sensor, but also its prediction uncertainty. If the model update process has been successful, the prediction uncertainty should have decreased. If the prediction uncertainty did not decrease, a further update with more reference data might be considered as described in connection with
Fig. 2 . - In
Fig. 7b there is shown a flowchart of amethod 700 in accordance with an embodiment. Reference is made toFig. 2 that provides a basis for the model update described hereinafter. After having detected a necessity to perform the model update, e.g., as a result of 220, it may be determined 710 whether reference data, e.g., from a reference device or from calculations is available. If so (yes 715) data may be collected in astep 720, e.g., data received 722 from the reference device and/or data received 724 from the sensor device. With regard to data received fromreference device 722, this may allow to obtain theground truth data 260. This may provide for a basis for the transfer learning 265 which may result in astep 730 to have an updated model. Quantity prediction of uncertainty in astep 740 may correspond to step 270. A decision whether the uncertainty is decreased may lead to an end of the process as the model update may be considered to be successful in 260. Else if there is no or insufficient decrease, apath 755 may lead back to data collecting in 720 in which other, additional or same data is collected. - After successful model update/calibration, the threshold for anomaly detection of the variational autoencoder may be updated to accommodate for the current now calibrated/updated state. This way further drift or ageing will again result in an anomaly at the variational autoencoder detected by use of
branch 242 inFig. 2 . The update of the VAE can be achieved through a transfer learning procedure on the VAE by using the anomalous data which the model has been updated to account for. - Embodiments allow to address the issue that traditional sensing mechanisms have the rather common assumption that the sensor signal for the initial parameter setting (training data) and the data in the application case (test data) are sampled from the same distribution, which would mean that the input feature space and the target data domain are equivalent. However, this assumption is often limited in real-life applications, due to the sensors intrinsic structure changing during its operation lifetime. Distributional shifts such as sensor drift and sensor ageing introduce a shift in data distribution when the sensor, e.g., gas sensor, is deployed in the environment. The adjusted or trained machine learning mechanisms are therefore prone to the effects of distributional shifts. The effects of such distributional shifts are visualized in
Figs. 8a and8b . -
Fig. 8a illustrates two-dimensional principle components of aged sensor data. It is noticeable that points representing the same ageing state are clustered together. The amount or times of ageing is selected as a non-limiting example only and does not represent a specific time scale. With increasing sensor ageing, the sensor data clusters may shift, to the right, highlighting the change in distribution. - Furthermore,
Fig. 8b illustrates two-dimensional principle components of additive drifted sensor data. Points representing the same drifting state are clustered together.Figs. 8a and8b empirically show that sensor ageing and sensor drift change the data distribution differently, which means that they cause different effects and therefore may be handled differently. - In order to compensate for these distributional shifts, mechanisms to reliably detect and re-adjust or calibrate the sensing mechanisms are provided by the underlying disclosure. The embodiments provide for a benefit in order to ensure accurate measurement capabilities of the technology. According to this disclosure, there is addressed a mechanism which can achieve a proper compensation strategy tuned towards the concrete type of distribution shift.
- The disclosure is originated by the concrete need to stabilize chemoresistive gas sensors which are extremely prone to drift and ageing of their response in both time and frequency domain. Nevertheless, it is noted that the distribution shift issue is common also to other sensing applications which deal with time series data such as pressure sensors, ultrasonic sensors and the like, and where the initial calibration model may become obsolete over time and after the deployment of the sensor in real-world scenarios. Whilst simple machine learning methods have been used in predictive maintenance, for instance in the case of loT (Internet-of-Things) and industrial applications and also electrochemical gas sensors, see [1]. However, the autoencoder-based concepts and/or PCA-based concepts may provide for an advantage over said concepts.
- For solutions described herein, in the following, there are provided example measurement data. In the figures, there is shown the good separability of measurement data using the encoder of the VAE for increasing ageing states of the sensor data. In
Fig. 9a , there is shown a latent 2D-dimension of encoded normal and aged sensor data for a variational autoencoder. -
Fig. 9b shows different metrics using the two proposed approaches VAE-Loss and VAE-Latent for detecting ageing of sensor data. The metric comprise an accuracy, a sensitivity, a specificity, a precision, a false positive rate, FPR, a false negative rate, FNR, and an F1 score. It may be seen that for detecting ageing sensor, the VAE-Latent approach only slightly degrades over the VAE-Loss approach whilst saving approximately half of the computational power. - Two different approaches of the VAE are tested. On can observe in
Fig. 9a that a small portion of an unaged data cluster is intersected with the one-time aged data cluster with VAE. It may also be debatable that the change of data distribution introduced by the first ageing state could even be neglected in the assessment since the ageing effects are not that strong and those would not be considered as anomaly. - VAE-Loss out performs VAE-Latent and Support Vector Machines,SVM. VAE-Latent performs slightly worse than VAE-Loss across all metrics. This can be attributed to VAE-Latent using only the model's encoder structure and thus only utilizing half the model parameters. Furthermore, VAE-Latent has two threshold errors to be modified (mean threshold and variance threshold), whereas VAE-Loss has only one threshold value, the threshold loss. Nevertheless, the sensitivity quantifying the probability that a data instance labelled as an anomaly is genuiely an anomaly is similar in VAE-Loss and VAE-Latent which might indicate that both pattern recognition systems are comparable in the latter task. Furthermore, the corresponding low FNR for VAE-Loss and VAE-Latent also underlines the similarities.
-
Fig. 10a shows a latent 2D-dimension of encoded normal and multiplicative drifted sensor data for variational autoencoders.Fig. 10b shows anomaly detection metrics for multiplicative drifted sensor data. -
Fig. 11a shows a latent 2D-dimension of encoded normal and additive drifted sensor data for variational autoencoders. InFig. 11b , there are shown different metrics using the two proposed approaches for detecting additive drift on sensor data. - The VAE-Latent may sometimes tend to miss-classify normal data as anomaly data. This may be seen due to the lower specificity values with 86.77 % compared to 94.49 % in
Fig. 9b and the higher FPR values for VAE-Latent with 13.23 % compared to VAE-Loss with 5.51 %. The precision metric shows that VAE-Loss can identify a high number of anomalies among all classified data samples at 90.1 %. However, VAE-Latent performs slightly inferior at 79.81 %. Last but not least, the F1 score and accuracy metric, which assess the overall performance on the classifiers, indicate that VAE-Loss performs the best. As the considered metrics indicate, VAE-Loss and VAE-Latent both seem to perform reasonably well in anomaly detection due to their reasonably high precision and recall scores. The goal may be to find or retrieve the anomaly data. In this context, the proposed VAE-based anomaly detection methodologies outperformed traditional ML-based counterparts. The VAE-Latent space allows for high separability between aged and unaged sensor data. Furthermore, it is shown that performing anomaly detection methodologies in the latent space with a reduced VAE structure by only using the encoder may be successful and can be considered for saving computational cost and memory by sacrificing small amounts of performance. Loss-based anomaly detection with VAE may perform the best, which might be attributed to the higher number of parameters. However, due to the high sensitivity, latent-based anomaly detection with VAE might yield a satisfactory performance for deployment. - For multiplicative drift and additive drift data detection similar results to detecting aged sensor data is observed. However, VAE-Latent may be superior for detecting drifting sensor data than aged sensor data.
- This might be attributed that sensor drift is more straightforward and intuitive than sensor ageing which has multiple underlying effects that have a more complex structure which is more difficult to capture by VAE-Latent architecture with less parameters. In the following, additional information on VAEs are provided.
- The VAE assumes that data set X = {x 1,2 , ..., xN } are N i.i.d. (independent and identically distributed) samples with probability density function p(.). The assumption is to generate unseen samples x ∉ X with respect to the unknown distribution (.).
- Another assumption is that the data is also dependent on the latent value z, which is generated from a prior probability distribution pθ (z). Then, a value x is generated from conditional distribution pθ (|xz).The VAE assumes that conditional distribution (xlz) is parameterized by parameters θ and that their probability density functions are differentiable with respect to θ and z. The true parameters θ and the values of latent variable z are unknown. The original distribution of the data can be described as follows by marginalization and Bayes rule pθ (x)= ∫ pθ (x|z) pθ (z)dz as well as the posterior distribution of the latent variable with respect to x:

- The VAE may be trained using following Loss function:


- The first term of the loss function is the logarithm of the probability density of generated output given the latent sample z over the negative expected reconstruction error. The expected reconstruction error is a loss term that describes how the output replicates the input. The second term of the loss function denotes the Kullbak-Leibler (KL) divergence of the support distribution (z|x) with respect to the prior pθ (x|z). The KL divergence can be considered as a constraint under which the data has to be reconstructed and to which extent the model has to update the parameters to accommodate new observations. KL divergence in the loss function encourages robustness to small perturbations along the latent dimension by inducing the probabilistic encoder (z|x) to match prior pθ (z). By choosing a conjugate prior over z such that the KL divergence can be analytically integrated a closed-form solution for Equation can be obtained. A possible choice for such conjugate prior that is also used in the scope of this invention disclosure is a standard multivariate normal distribution. Other distributions, such as Gaussian mixture models or Bernoulli distributions can be also considered.
- Using the aforementioned prior and posterior, following close form solution for the KL divergence DKL (left term of the loss function) can be obtained:


- Combining the reconstruction loss and the KL divergence results into a loss function that encourages a trade-off between expensiveness and conciseness, pushing the model toward perfectionist tendencies yet also learning a simple latent space representation based on the chosen prior:

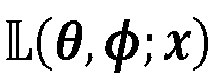
By defining the conjugate prior pθ (z) as a multivariate Gaussian distribution N ~ (0,I) and approximating the posterior q φ(z|x) with multivariate Gaussian distribution N ~ (ηz | x , Σ z | x ), the VAE architecture is definable along with associated loss function. - During a training process of the variational autoencoder, data x (can be a temporal data stream or singular data) may be given as input to the encoder (any type of neural network). x is then transformed through a neural network into parameters ηz | x, Σ z | x that describe support distribution qφ (z|x). Then latent value zlx is sampled from distribution N - (ηz | x, Σ z | x ) and transformed through the decoder (any type of neural network) network into a reconstruction x̂ of the input x. This reconstruction represents the mean value ηx | z of the distribution (x|z).
-
Fig. 12 shows a schematic flow chart of amethod 1200 according to an embodiment. Astep 1210 comprises obtaining sensor signals of a sensor device. Astep 1220 comprises processing at least one sensor signal by use of a sensor model. Astep 1240 comprises evaluating sensor signals for a presence of an anomaly in the sensor signals that indicates an ageing of the sensor device. Astep 1240 comprises updating the sensor model based on the presence of the anomaly that is partially compensate for the anomaly to obtain an updated sensor model. Astep 1250 comprises using the updated sensor model for future sensor signals. - According to a first aspect there is provided a calculation unit (10) for a sensor device (100), the calculation unit comprising:
- an interface (14) configured for obtaining sensor signals (12) of the sensor device (100);
- a processing processor (16) configured for processing at least one sensor signal (12) by use of a sensor model (181);
- a model processor (24) configured for evaluating sensor signals (12) for a presence of an anomaly in the sensor signals (12) that indicates an ageing of the sensor device (100);
- wherein the model processor (24) is configured for updating the sensor model (181) based on the presence of the anomaly to at least partially compensate for the anomaly to obtain an updated sensor model (182); and
- wherein the processing processor (16) is configured for using the updated sensor model (182) for future sensor signals (12).
- According to a second aspect referring to
aspect 1, wherein the model processor (24) comprises an encoder (34), e.g., part of VAE, configured for encoding the sensor signals (12) to a latent space (32); wherein the model processor (24) is configured for determining a measure associated with a mismatch, e.g., distance, between the encoded sensor signals (12) on the one hand and a benchmark such as cluster centrals of the normal data on the other hand; wherein the model processor (24) is configured for determining the presence of the anomaly based on the measure being at least a predefined threshold. - According to a third aspect referring to
aspect 2, the encoder (34) is configured for determining a first cluster central in the latent space (32) of a benchmark dataset e.g., a normal dataset and for determining a second cluster central in the latent space (32) of the sensor signals (12); wherein the encoder (34) is configured for determining the measure based on a relationship such as a ratio and/or a difference between the first cluster central and the second cluster central. - According to a fourth aspect referring to any of the previous aspects the model processor (24) comprises an encoder (34), e.g., part of VAE, configured for encoding the sensor signals (12) from a sensor signal space to a latent space (32); wherein the model processor (24) comprises a decoder (38) configured for decoding the encoded sensor signals to the sensor signal space to obtain restored sensor signals (12');
wherein the model processor (24) is configured for determining a measure associated with a mismatch between the sensor signals (12) and the restored sensor signals (12'); wherein the model processor (24) is configured for determining the presence of the anomaly based on the measure being at least a predefined threshold. - According to a fifth aspect referring to any of the previous aspects the model processor (24) comprises a neural network to provide at least an encoder (34) of a variational autoencoder structure or is adapted for a principal component analysis.
- According to a sixth aspect referring to any of the previous aspects, for updating the sensor model (181), the calculation unit (10) is configured for obtaining reference sensor signals from a reference sensor device and to determine an updated ground of truth for the updated sensor model (182) from the reference sensor signals.
- According to a seventh aspect referring to any of the previous aspects, for updating the sensor model (181), the model processor (24) is configured for performing a transfer learning (265) using the sensor model (181) and reference sensor signals from a reference sensor device to obtain the updated sensor model (182).
- According to an eighth aspect referring to any of the previous aspects the calculation unit comprises an evaluation processor (28), e.g., using artificial intelligence, Al, configured for evaluating a certainty of the updated sensor model (182), e.g., comprising a comparison against a given requirements, e.g. a maximum allowed uncertainty for the expected accuracy. For example, if the threshold is exceeded a new update with new/more data may be performed.
- According to a ninth aspect referring to any of the previous aspects, the model processor (24) is configured for determining the presence of the anomaly as a presence of a first anomaly and for evaluating the sensor signals (12) for a presence of a second anomaly that is related to a sensor drift; wherein the calculation unit is configured for recalibrating (260) the sensor device (100) using a baseline recalibration mechanism.
- According to a tenth aspect referring to
aspect 9, the model processor (24) is configured for performing a second evaluation of time domain features of the sensor signals (12) to determine the presence of the second anomaly; and for performing a first evaluation of frequency domain features of the sensor signals (12) for determining the presence of the first anomaly. - According to an eleventh aspect referring to
aspect 10, wherein the model processor (24) is configured for associating the presence of the sensor drift with a presence of an anomaly in the time domain features and with an absence of an anomaly in the frequency domain features; and to associate the presence of sensor aging with the presence of an anomaly in the frequency domain features. - According to a twelfth aspect referring a sensor device (100) comprises:
- a calculation unit (10) according to any one of the previous aspects; and
- a sensor unit (20) for providing the sensor signals (12).
- According to a thirteenth aspect referring to
aspects 12, the sensor unit (20) comprises at least one of a gas sensor, a temperature sensor, a humidity sensor, an ultrasonic sensor and a pressure sensor. - According to a fourteenth aspect a method comprises:
- obtaining (1210) sensor signals of a sensor device;
- processing (1220) at least one sensor signal by use of a sensor model;
- evaluating (1230) sensor signals for a presence of an anomaly in the sensor signals that indicates an ageing of the sensor device;
- updating (1240) the sensor model based on the presence of the anomaly to at least partially compensate for the anomaly to obtain an updated sensor model; and
- using (1250) the updated sensor model for future sensor signals.
- According to a fifteenth aspect a computer readable digital storage medium is provided having stored thereon a computer program having a program code for performing, when running on a computer, a method according to
aspect 14. - Although some aspects have been described in the context of an apparatus, it is clear that these aspects also represent a description of the corresponding method, where a block or device corresponds to a method step or a feature of a method step. Analogously, aspects described in the context of a method step also represent a description of a corresponding block or item or feature of a corresponding apparatus.
- Depending on certain implementation requirements, embodiments of the invention can be implemented in hardware or in software. The implementation can be performed using a digital storage medium, for example a floppy disk, a DVD, a CD, a ROM, a PROM, an EPROM, an EEPROM or a FLASH memory, having electronically readable control signals stored thereon, which cooperate (or are capable of cooperating) with a programmable computer system such that the respective method is performed.
- Some embodiments according to the invention comprise a data carrier having electronically readable control signals, which are capable of cooperating with a programmable computer system, such that one of the methods described herein is performed.
- Generally, embodiments of the present invention can be implemented as a computer program product with a program code, the program code being operative for performing one of the methods when the computer program product runs on a computer. The program code may for example be stored on a machine readable carrier.
- Other embodiments comprise the computer program for performing one of the methods described herein, stored on a machine readable carrier.
- In other words, an embodiment of the inventive method is, therefore, a computer program having a program code for performing one of the methods described herein, when the computer program runs on a computer.
- A further embodiment of the inventive methods is, therefore, a data carrier (or a digital storage medium, or a computer-readable medium) comprising, recorded thereon, the computer program for performing one of the methods described herein.
- A further embodiment of the inventive method is, therefore, a data stream or a sequence of signals representing the computer program for performing one of the methods described herein. The data stream or the sequence of signals may for example be configured to be transferred via a data communication connection, for example via the Internet.
- A further embodiment comprises a processing means, for example a computer, or a programmable logic device, configured to or adapted to perform one of the methods described herein.
- A further embodiment comprises a computer having installed thereon the computer program for performing one of the methods described herein.
- In some embodiments, a programmable logic device (for example a field programmable gate array) may be used to perform some or all of the functionalities of the methods described herein. In some embodiments, a field programmable gate array may cooperate with a microprocessor in order to perform one of the methods described herein. Generally, the methods are preferably performed by any hardware apparatus.
- The above described embodiments are merely illustrative for the principles of the present invention. It is understood that modifications and variations of the arrangements and the details described herein will be apparent to others skilled in the art. It is the intent, therefore, to be limited only by the scope of the impending patent claims and not by the specific details presented by way of description and explanation of the embodiments herein.
Claims (15)
- A calculation unit (10) for a sensor device (100), the calculation unit comprising:an interface (14) configured for obtaining sensor signals (12) of the sensor device (100);a processing processor (16) configured for processing at least one sensor signal (12) by use of a sensor model (181);a model processor (24) configured for evaluating sensor signals (12) for a presence of an anomaly in the sensor signals (12) that indicates an ageing of the sensor device (100);wherein the model processor (24) is configured for updating the sensor model (181) based on the presence of the anomaly to at least partially compensate for the anomaly to obtain an updated sensor model (182); andwherein the processing processor (16) is configured for using the updated sensor model (182) for future sensor signals (12).
- The calculation unit according to claim 1, wherein the model processor (24) comprises an encoder (34) configured for encoding the sensor signals (12) to a latent space (32); wherein the model processor (24) is configured for determining a measure associated with a mismatch between the encoded sensor signals (12) on the one hand and a benchmark on the other hand; wherein the model processor (24) is configured for determining the presence of the anomaly based on the measure being at least a predefined threshold.
- The calculation unit of claim 2, wherein encoder (34) is configured for determining a first cluster central in the latent space (32) of a benchmark dataset and for determining a second cluster central in the latent space (32) of the sensor signals (12); wherein the encoder (34) is configured for determining the measure based on a relationship between the first cluster central and the second cluster central.
- The calculation unit according to any one of previous claims, wherein the model processor (24) comprises an encoder (34) configured for encoding the sensor signals (12) from a sensor signal space to a latent space (32); wherein the model processor (24) comprises a decoder (38) configured for decoding the encoded sensor signals to the sensor signal space to obtain restored sensor signals (12');
wherein the model processor (24) is configured for determining a measure associated with a mismatch between the sensor signals (12) and the restored sensor signals (12'); wherein the model processor (24) is configured for determining the presence of the anomaly based on the measure being at least a predefined threshold. - The calculation unit according to any one of previous claims, wherein the model processor (24) comprises a neural network to provide at least an encoder (34) of a variational autoencoder structure or is adapted for a principal component analysis.
- The calculation unit according to any one of previous claims, wherein, for updating the sensor model (181), the calculation unit (10) is configured for obtaining reference sensor signals from a reference sensor device and to determine an updated ground of truth for the updated sensor model (182) from the reference sensor signals.
- The calculation unit according to any one of previous claims, wherein, for updating the sensor model (181), the model processor (24) is configured for performing a transfer learning (265) using the sensor model (181) and reference sensor signals from a reference sensor device to obtain the updated sensor model (182).
- The calculation unit according to any one of previous claims, comprising an evaluation processor (28) configured for evaluating a certainty of the updated sensor model (182).
- The calculation unit according to any one of previous claims, wherein the model processor (24) is configured for determining the presence of the anomaly as a presence of a first anomaly and for evaluating the sensor signals (12) for a presence of a second anomaly that is related to a sensor drift; wherein the calculation unit is configured for recalibrating (260) the sensor device (100) using a baseline recalibration mechanism.
- The calculation unit according to claim 9, wherein the model processor (24) is configured for performing a second evaluation of time domain features of the sensor signals (12) to determine the presence of the second anomaly; and for performing a first evaluation of frequency domain features of the sensor signals (12) for determining the presence of the first anomaly.
- The calculation unit according to claim 10, wherein the model processor (24) is configured for associating the presence of the sensor drift with a presence of an anomaly in the time domain features and with an absence of an anomaly in the frequency domain features; and to associate the presence of sensor aging with the presence of an anomaly in the frequency domain features.
- A sensor device (100) comprising:a calculation unit (10) according to any one of the previous claims; anda sensor unit (20) for providing the sensor signals (12).
- The sensor device (100) according to claim 12, wherein the sensor unit (20) comprises at least one of a gas sensor, a temperature sensor, a humidity sensor, an ultrasonic sensor and a pressure sensor.
- A method comprising:obtaining (1210) sensor signals of a sensor device;processing (1220) at least one sensor signal by use of a sensor model;evaluating (1230) sensor signals for a presence of an anomaly in the sensor signals that indicates an ageing of the sensor device;updating (1240) the sensor model based on the presence of the anomaly to at least partially compensate for the anomaly to obtain an updated sensor model; andusing (1250) the updated sensor model for future sensor signals.
- A computer readable digital storage medium having stored thereon a computer program having a program code for performing, when running on a computer, a method according to claim 14.
Priority Applications (1)
| Application Number | Priority Date | Filing Date | Title |
|---|---|---|---|
| EP23175438.3A EP4467929B1 (en) | 2023-05-25 | 2023-05-25 | Calculation unit for a sensor device, sensor device and method related to updating a sensor model |
Applications Claiming Priority (1)
| Application Number | Priority Date | Filing Date | Title |
|---|---|---|---|
| EP23175438.3A EP4467929B1 (en) | 2023-05-25 | 2023-05-25 | Calculation unit for a sensor device, sensor device and method related to updating a sensor model |
Publications (2)
| Publication Number | Publication Date |
|---|---|
| EP4467929A1 true EP4467929A1 (en) | 2024-11-27 |
| EP4467929B1 EP4467929B1 (en) | 2025-12-10 |
Family
ID=86603705
Family Applications (1)
| Application Number | Title | Priority Date | Filing Date |
|---|---|---|---|
| EP23175438.3A Active EP4467929B1 (en) | 2023-05-25 | 2023-05-25 | Calculation unit for a sensor device, sensor device and method related to updating a sensor model |
Country Status (1)
| Country | Link |
|---|---|
| EP (1) | EP4467929B1 (en) |
Citations (4)
| Publication number | Priority date | Publication date | Assignee | Title |
|---|---|---|---|---|
| US4831380A (en) * | 1985-11-20 | 1989-05-16 | Drallim Industries Limited | Transducer interfaces |
| WO2019028269A2 (en) * | 2017-08-02 | 2019-02-07 | Strong Force Iot Portfolio 2016, Llc | Methods and systems for detection in an industrial internet of things data collection environment with large data sets |
| AU2020102819A4 (en) * | 2020-10-16 | 2020-12-10 | Beihang University | Digital-twin-driven method and system for fault diagnosis of subsea production system of offshore oil |
| US20220236244A1 (en) * | 2021-01-22 | 2022-07-28 | Infineon Technologies Ag | Gas sensing device and method for determining a calibrated measurement value for a concentration of a target gas |
-
2023
- 2023-05-25 EP EP23175438.3A patent/EP4467929B1/en active Active
Patent Citations (4)
| Publication number | Priority date | Publication date | Assignee | Title |
|---|---|---|---|---|
| US4831380A (en) * | 1985-11-20 | 1989-05-16 | Drallim Industries Limited | Transducer interfaces |
| WO2019028269A2 (en) * | 2017-08-02 | 2019-02-07 | Strong Force Iot Portfolio 2016, Llc | Methods and systems for detection in an industrial internet of things data collection environment with large data sets |
| AU2020102819A4 (en) * | 2020-10-16 | 2020-12-10 | Beihang University | Digital-twin-driven method and system for fault diagnosis of subsea production system of offshore oil |
| US20220236244A1 (en) * | 2021-01-22 | 2022-07-28 | Infineon Technologies Ag | Gas sensing device and method for determining a calibrated measurement value for a concentration of a target gas |
Non-Patent Citations (1)
| Title |
|---|
| ANDREA POLLASTRO ET AL: "Semi-supervised detection of structural damage using Variational Autoencoder and a One-Class Support Vector Machine", ARXIV.ORG, CORNELL UNIVERSITY LIBRARY, 201 OLIN LIBRARY CORNELL UNIVERSITY ITHACA, NY 14853, 24 March 2023 (2023-03-24), XP091467492 * |
Also Published As
| Publication number | Publication date |
|---|---|
| EP4467929B1 (en) | 2025-12-10 |
Similar Documents
| Publication | Publication Date | Title |
|---|---|---|
| US12619226B2 (en) | Anomaly detection based on normal behavior modeling | |
| CN116991137B (en) | Concept drift-oriented industrial control system abnormality detection method capable of adapting to interpretation | |
| CN116451142A (en) | Water quality sensor fault detection method based on machine learning algorithm | |
| CN112416662A (en) | Anomaly detection method and device for multiple time series data | |
| CN117612277B (en) | Unsupervised vehicle network anomaly detection method and system based on physical invariant subspace | |
| CN116381429B (en) | Method and system for correcting online partial discharge detection result | |
| Magna et al. | Self-Repairing classification algorithms for chemical sensor array | |
| CN117668684A (en) | Anomaly detection method of power grid power data based on big data analysis | |
| US20060074823A1 (en) | Methods and apparatus for detecting temporal process variation and for managing and predicting performance of automatic classifiers | |
| CN115081673A (en) | Oil and gas pipeline abnormity prediction method and device, electronic equipment and medium | |
| Alippi et al. | An HMM-based change detection method for intelligent embedded sensors | |
| US12411824B2 (en) | Method of assessing input-output datasets using local complexity values and associated data structure | |
| EP4467929B1 (en) | Calculation unit for a sensor device, sensor device and method related to updating a sensor model | |
| US20240362461A1 (en) | Anomaly detection using a pre-trained global model | |
| US20240185136A1 (en) | Method of assessing input-output datasets using neighborhood criteria in the input space and the output space | |
| US20060074826A1 (en) | Methods and apparatus for detecting temporal process variation and for managing and predicting performance of automatic classifiers | |
| US20060074827A1 (en) | Methods and apparatus for detecting temporal process variation and for managing and predicting performance of automatic classifiers | |
| CN120448981B (en) | Semi-supervised fatigue test condition monitoring method based on adaptive confidence active learning | |
| Cinar et al. | SHAP-Based Framework for Temporal Detection of Sensor Drift in Gas Sensor Arrays | |
| Shakunt et al. | A novel unsupervised machine learning-inspired framework for detection and estimation of faulty wireless sensor data | |
| Rajendran et al. | Hybrid Deep Learning-Based Fault Detection for IoT Sensors | |
| Allka | Enhancing data quality in IoT monitoring sensor networks | |
| a Mayaki | Deep learning based anomaly and drift detection: application to predictive maintenance in embedded systems | |
| Aiyan et al. | A Comparative Study of Classical Machine Learning Models and CNN-LSTM for Multiclass Time-Series Classification in Hose Pipe Fault Diagnosis | |
| Ebmeier et al. | Fault Detection in Solar Thermal Systems using Probabilistic Reconstructions |
Legal Events
| Date | Code | Title | Description |
|---|---|---|---|
| PUAI | Public reference made under article 153(3) epc to a published international application that has entered the european phase |
Free format text: ORIGINAL CODE: 0009012 |
|
| STAA | Information on the status of an ep patent application or granted ep patent |
Free format text: STATUS: THE APPLICATION HAS BEEN PUBLISHED |
|
| AK | Designated contracting states |
Kind code of ref document: A1 Designated state(s): AL AT BE BG CH CY CZ DE DK EE ES FI FR GB GR HR HU IE IS IT LI LT LU LV MC ME MK MT NL NO PL PT RO RS SE SI SK SM TR |
|
| STAA | Information on the status of an ep patent application or granted ep patent |
Free format text: STATUS: REQUEST FOR EXAMINATION WAS MADE |
|
| 17P | Request for examination filed |
Effective date: 20241218 |
|
| RIC1 | Information provided on ipc code assigned before grant |
Ipc: G01D 3/02 20060101AFI20250428BHEP |
|
| GRAP | Despatch of communication of intention to grant a patent |
Free format text: ORIGINAL CODE: EPIDOSNIGR1 |
|
| STAA | Information on the status of an ep patent application or granted ep patent |
Free format text: STATUS: GRANT OF PATENT IS INTENDED |
|
| INTG | Intention to grant announced |
Effective date: 20250707 |
|
| GRAS | Grant fee paid |
Free format text: ORIGINAL CODE: EPIDOSNIGR3 |
|
| GRAA | (expected) grant |
Free format text: ORIGINAL CODE: 0009210 |
|
| STAA | Information on the status of an ep patent application or granted ep patent |
Free format text: STATUS: THE PATENT HAS BEEN GRANTED |
|
| AK | Designated contracting states |
Kind code of ref document: B1 Designated state(s): AL AT BE BG CH CY CZ DE DK EE ES FI FR GB GR HR HU IE IS IT LI LT LU LV MC ME MK MT NL NO PL PT RO RS SE SI SK SM TR |
|
| REG | Reference to a national code |
Ref country code: CH Ref legal event code: F10 Free format text: ST27 STATUS EVENT CODE: U-0-0-F10-F00 (AS PROVIDED BY THE NATIONAL OFFICE) Effective date: 20251210 Ref country code: GB Ref legal event code: FG4D |
|
| REG | Reference to a national code |
Ref country code: DE Ref legal event code: R096 Ref document number: 602023009452 Country of ref document: DE |
|
| REG | Reference to a national code |
Ref country code: IE Ref legal event code: FG4D |
|
| P01 | Opt-out of the competence of the unified patent court (upc) registered |
Free format text: CASE NUMBER: UPC_APP_0002397_4467929/2026 Effective date: 20260122 |
|
| PG25 | Lapsed in a contracting state [announced via postgrant information from national office to epo] |
Ref country code: ES Free format text: LAPSE BECAUSE OF FAILURE TO SUBMIT A TRANSLATION OF THE DESCRIPTION OR TO PAY THE FEE WITHIN THE PRESCRIBED TIME-LIMIT Effective date: 20251210 |
|
| REG | Reference to a national code |
Ref country code: LT Ref legal event code: MG9D |
|
| PG25 | Lapsed in a contracting state [announced via postgrant information from national office to epo] |
Ref country code: NO Free format text: LAPSE BECAUSE OF FAILURE TO SUBMIT A TRANSLATION OF THE DESCRIPTION OR TO PAY THE FEE WITHIN THE PRESCRIBED TIME-LIMIT Effective date: 20260310 |
|
| PG25 | Lapsed in a contracting state [announced via postgrant information from national office to epo] |
Ref country code: FI Free format text: LAPSE BECAUSE OF FAILURE TO SUBMIT A TRANSLATION OF THE DESCRIPTION OR TO PAY THE FEE WITHIN THE PRESCRIBED TIME-LIMIT Effective date: 20251210 Ref country code: HR Free format text: LAPSE BECAUSE OF FAILURE TO SUBMIT A TRANSLATION OF THE DESCRIPTION OR TO PAY THE FEE WITHIN THE PRESCRIBED TIME-LIMIT Effective date: 20251210 |
|
| REG | Reference to a national code |
Ref country code: NL Ref legal event code: MP Effective date: 20251210 |
|
| PG25 | Lapsed in a contracting state [announced via postgrant information from national office to epo] |
Ref country code: RS Free format text: LAPSE BECAUSE OF FAILURE TO SUBMIT A TRANSLATION OF THE DESCRIPTION OR TO PAY THE FEE WITHIN THE PRESCRIBED TIME-LIMIT Effective date: 20260310 |
|
| PG25 | Lapsed in a contracting state [announced via postgrant information from national office to epo] |
Ref country code: LV Free format text: LAPSE BECAUSE OF FAILURE TO SUBMIT A TRANSLATION OF THE DESCRIPTION OR TO PAY THE FEE WITHIN THE PRESCRIBED TIME-LIMIT Effective date: 20251210 |
|
| PG25 | Lapsed in a contracting state [announced via postgrant information from national office to epo] |
Ref country code: BG Free format text: LAPSE BECAUSE OF FAILURE TO SUBMIT A TRANSLATION OF THE DESCRIPTION OR TO PAY THE FEE WITHIN THE PRESCRIBED TIME-LIMIT Effective date: 20251210 |