EP4459625A2 - Systems and methods for per-cluster intensity correction and base calling - Google Patents
Systems and methods for per-cluster intensity correction and base calling Download PDFInfo
- Publication number
- EP4459625A2 EP4459625A2 EP24188630.8A EP24188630A EP4459625A2 EP 4459625 A2 EP4459625 A2 EP 4459625A2 EP 24188630 A EP24188630 A EP 24188630A EP 4459625 A2 EP4459625 A2 EP 4459625A2
- Authority
- EP
- European Patent Office
- Prior art keywords
- intensity
- current
- sequencing
- channel
- specific
- Prior art date
- Legal status (The legal status is an assumption and is not a legal conclusion. Google has not performed a legal analysis and makes no representation as to the accuracy of the status listed.)
- Pending
Links
Images




Classifications
-
- G—PHYSICS
- G06—COMPUTING OR CALCULATING; COUNTING
- G06F—ELECTRIC DIGITAL DATA PROCESSING
- G06F18/00—Pattern recognition
- G06F18/20—Analysing
- G06F18/21—Design or setup of recognition systems or techniques; Extraction of features in feature space; Blind source separation
- G06F18/213—Feature extraction, e.g. by transforming the feature space; Summarisation; Mappings, e.g. subspace methods
- G06F18/2135—Feature extraction, e.g. by transforming the feature space; Summarisation; Mappings, e.g. subspace methods based on approximation criteria, e.g. principal component analysis
- G06F18/21355—Feature extraction, e.g. by transforming the feature space; Summarisation; Mappings, e.g. subspace methods based on approximation criteria, e.g. principal component analysis nonlinear criteria, e.g. embedding a manifold in a Euclidean space
-
- G—PHYSICS
- G06—COMPUTING OR CALCULATING; COUNTING
- G06F—ELECTRIC DIGITAL DATA PROCESSING
- G06F18/00—Pattern recognition
- G06F18/20—Analysing
- G06F18/24—Classification techniques
- G06F18/241—Classification techniques relating to the classification model, e.g. parametric or non-parametric approaches
- G06F18/2411—Classification techniques relating to the classification model, e.g. parametric or non-parametric approaches based on the proximity to a decision surface, e.g. support vector machines
-
- G—PHYSICS
- G06—COMPUTING OR CALCULATING; COUNTING
- G06T—IMAGE DATA PROCESSING OR GENERATION, IN GENERAL
- G06T7/00—Image analysis
- G06T7/10—Segmentation; Edge detection
- G06T7/187—Segmentation; Edge detection involving region growing; involving region merging; involving connected component labelling
-
- G—PHYSICS
- G06—COMPUTING OR CALCULATING; COUNTING
- G06V—IMAGE OR VIDEO RECOGNITION OR UNDERSTANDING
- G06V10/00—Arrangements for image or video recognition or understanding
- G06V10/40—Extraction of image or video features
- G06V10/50—Extraction of image or video features by performing operations within image blocks; by using histograms, e.g. histogram of oriented gradients [HoG]; by summing image-intensity values; Projection analysis
- G06V10/507—Summing image-intensity values; Histogram projection analysis
-
- G—PHYSICS
- G16—INFORMATION AND COMMUNICATION TECHNOLOGY [ICT] SPECIALLY ADAPTED FOR SPECIFIC APPLICATION FIELDS
- G16B—BIOINFORMATICS, i.e. INFORMATION AND COMMUNICATION TECHNOLOGY [ICT] SPECIALLY ADAPTED FOR GENETIC OR PROTEIN-RELATED DATA PROCESSING IN COMPUTATIONAL MOLECULAR BIOLOGY
- G16B30/00—ICT specially adapted for sequence analysis involving nucleotides or amino acids
-
- G—PHYSICS
- G16—INFORMATION AND COMMUNICATION TECHNOLOGY [ICT] SPECIALLY ADAPTED FOR SPECIFIC APPLICATION FIELDS
- G16B—BIOINFORMATICS, i.e. INFORMATION AND COMMUNICATION TECHNOLOGY [ICT] SPECIALLY ADAPTED FOR GENETIC OR PROTEIN-RELATED DATA PROCESSING IN COMPUTATIONAL MOLECULAR BIOLOGY
- G16B40/00—ICT specially adapted for biostatistics; ICT specially adapted for bioinformatics-related machine learning or data mining, e.g. knowledge discovery or pattern finding
- G16B40/10—Signal processing, e.g. from mass spectrometry [MS] or from PCR
-
- G—PHYSICS
- G16—INFORMATION AND COMMUNICATION TECHNOLOGY [ICT] SPECIALLY ADAPTED FOR SPECIFIC APPLICATION FIELDS
- G16B—BIOINFORMATICS, i.e. INFORMATION AND COMMUNICATION TECHNOLOGY [ICT] SPECIALLY ADAPTED FOR GENETIC OR PROTEIN-RELATED DATA PROCESSING IN COMPUTATIONAL MOLECULAR BIOLOGY
- G16B40/00—ICT specially adapted for biostatistics; ICT specially adapted for bioinformatics-related machine learning or data mining, e.g. knowledge discovery or pattern finding
- G16B40/30—Unsupervised data analysis
-
- G—PHYSICS
- G16—INFORMATION AND COMMUNICATION TECHNOLOGY [ICT] SPECIALLY ADAPTED FOR SPECIFIC APPLICATION FIELDS
- G16B—BIOINFORMATICS, i.e. INFORMATION AND COMMUNICATION TECHNOLOGY [ICT] SPECIALLY ADAPTED FOR GENETIC OR PROTEIN-RELATED DATA PROCESSING IN COMPUTATIONAL MOLECULAR BIOLOGY
- G16B45/00—ICT specially adapted for bioinformatics-related data visualisation, e.g. displaying of maps or networks
Definitions
- the technology disclosed relates to apparatus and corresponding methods for the automated analysis of an image or recognition of a pattern. Included herein are systems that transform an image for the purpose of (a) enhancing its visual quality prior to recognition, (b) locating and registering the image relative to a sensor or stored prototype, or reducing the amount of image data by discarding irrelevant data, and (c) measuring significant characteristics of the image.
- the technology disclosed relates to generating variation correction coefficients to correct inter-cluster intensity profile variation in image data.
- This disclosure relates to analyzing image data to base call clusters during a sequencing run.
- One challenge with the analysis of image data is variation in intensity profiles of clusters in a cluster population being base called. This causes a drop in data throughput and an increase in error rate during the sequencing run.
- inter-cluster intensity profile variation may result from differences in cluster brightness, caused by fragment length distribution in the cluster population. It may result from phase error, which occurs when a molecule in a cluster does not incorporate a nucleotide in some sequencing cycle and lags behind other molecules, or when a molecule incorporates more than one nucleotide in a single sequencing cycle. It may result from fading, i.e., an exponential decay in signal intensity of clusters as a function of sequencing cycle number due to excessive washing and laser exposure as the sequencing run progresses. It may result from underdeveloped cluster colonies, i.e ., small cluster sizes that produce empty or partially filled wells on a patterned flow cell.
- Cluster colonies caused by unexclusive amplification. It may result from under-illumination or uneven-illumination, for example, due to clusters being located on edges of a flow cell. It may result from impurities on a flow cell that obfuscate emitted signal. It may result from polyclonal clusters, i.e ., when multiple clusters are deposited in the same well.
- the multi-dimensional space 100 can be a cartesian space, a polar space, a cylindrical space, or a spherical space.
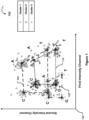
- Figure 1 illustrates one example of the inter-cluster intensity profile variation discovered and corrected by the technology disclosed.
- Figure 1 depicts intensity profiles 112, 122, and 132 of clusters 1, 2, and 3 in a cluster population, respectively.
- Intensity profile of a target cluster comprises intensity values that capture the chemiluminescent signals produced due to nucleotide incorporations in the target cluster at a plurality of sequencing cycles ( e.g ., 150) of the sequencing run.
- the intensity values are extracted from two different color/intensity channel sequencing images generated by a sequencer at each sequencing cycle in the plurality of sequencing cycles.
- the sequencer include Illumina's iSeq, HiSeqX, HiSeq 3000, HiSeq 4000, HiSeq 2500, NovaSeq 6000, NextSeq 550, NextSeq 1000, NextSeq 2000, NextSeqDx, MiSeq, and MiSeqDx.
- the sequencer uses sequencing by synthesis (SBS) for generating the sequencing images.
- SBS relies on growing nascent strands complementary to cluster strands with fluorescently-labeled nucleotides, while tracking the emitted signal of each newly added nucleotide.
- the fluorescently-labeled nucleotides have a 3' removable block that anchors a fluorophore signal of the nucleotide type.
- SBS occurs in repetitive sequencing cycles, each comprising three steps: (a) extension of a nascent strand by adding the fluorescently-labeled nucleotide; (b) excitation of the fluorophore using one or more lasers of an optical system of the sequencer and imaging through different filters of the optical system, yielding the sequencing images; and (c) cleavage of the fluorophore and removal of the 3' block in preparation for the next sequencing cycle. Incorporation and imaging are repeated up to a designated number of sequencing cycles, defining the read length. Using this approach, each sequencing cycle interrogates a new position along the cluster strands.
- the " " symbol represents the intensity values for cluster 1
- the " " symbol represents the intensity values for cluster 2
- the "•” symbol represents the intensity values for cluster 3.
- the identity of the four different nucleotide types/bases A, C, T, and G is encoded as a combination of the intensity values in the two color images, i.e ., the first and second intensity channels.
- a nucleic acid can be sequenced by providing a first nucleotide type (e.g ., base T) that is detected in the first intensity channel (x-axis of the multi-dimensional space 100), a second nucleotide type (e.g.
- base C that is detected in the second intensity channel (y-axis of the multi-dimensional space 100)
- a third nucleotide type e.g ., base A
- a fourth nucleotide type e.g ., base G
- the intensity profile is generated by iteratively fitting four intensity distributions (e.g ., Gaussian distributions) to the intensity values in the first and the second intensity channels.
- the four intensity distributions correspond to the four bases A, C, T, and G.
- the intensity values in the first intensity channel are plotted against the intensity values in the second intensity channel ( e.g. , as a scatterplot), and the intensity values segregate into the four intensity distributions.
- the intensity profiles can take any shape (e.g ., trapezoids, squares, rectangles, rhombus, etc.). Additional details about how the four intensity distributions are fitted to the intensity values for base calling can be found in U.S. Patent Application Publication No. 2018/0274023 A1 , the disclosure of which is incorporated herein by reference in its entirety.
- each intensity channel corresponds to one of a plurality of filter wavelength bands used by the optical system. In another implementation, each intensity channel corresponds to one of a plurality of imaging events at a sequencing cycle. In yet another implementation, each intensity channel corresponds to a combination of illumination with a specific laser and imaging through a specific optical filter of the optical system.
- the inter-cluster intensity profile variation among intensity profiles of a large number (e.g ., thousands, millions, billions, etc.) of clusters in the cluster population causes a drop in base calling throughput and an increase in base calling error rate.
- a variation correction logic that generates variation correction coefficients on a cluster-by-cluster basis.
- the variation correction coefficients comprise an amplification coefficient that accounts for scale variation in the inter-cluster intensity profile variation, and two channel-specific offset coefficients that account for shift variation along the first and the second intensity channels in the inter-cluster intensity profile variation, respectively.
- the shift variation is accounted for by using a common offset coefficient for the different intensity channels (e.g. , the first and the second intensity channels).
- the variation correction coefficients for the target cluster are generated at a current sequencing cycle of the sequencing run based on combining analysis of historic intensity statistics determined for the target cluster at preceding sequencing cycles of the sequencing run with analysis of current intensity statistics determined for the target cluster at the current sequencing cycle.
- the variation correction coefficients are used to correct next intensity readings registered for the target cluster a next sequencing cycle of the sequencing run.
- the corrected next intensity readings are used to base call the target cluster at the next sequencing cycle.
- the result of repeatedly applying respective variation correction coefficients to respective intensity profiles of respective clusters at successive sequencing cycles of the sequencing run is that the intensity profiles become coincidental and anchored to the origin 132 ( e.g., at the bottom lower corner of the trapezoids).
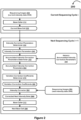
- Figure 2 illustrates an example of a base calling pipeline 200 that implements the variation correction logic.
- the sequencer At the current sequencing cycle i, the sequencer generates sequencing images 202.
- the sequencing images 202 contain current intensity data 202t registered for the target cluster at the current sequencing cycle i, along with containing current intensity data 202 registered for multiple clusters in the cluster population.
- the "t" in the current intensity data 202t refers to the target cluster.
- the current intensity data 202t is provided to a base caller 212.
- the base caller 212 processes the current intensity data 202t and generates a current base call 222 for the target cluster at the current sequencing cycle i.
- Examples of the base caller 212 include Illumina's Real-Time Analysis (RTA) software, Illumina's neural network-based base caller ( e.g. , described in US Patent Publication No. US 2020/0302297 A1 ), and Illumina's equalizer-based base caller (e.g., described in U.S. Provisional Patent Application No. 63/020,449 ).
- RTA Real-Time Analysis
- the intensity profile of the target cluster includes the current intensity data 202t, and current historic intensity data registered for the target cluster at those sequencing cycles of the sequencing run that precede the current sequencing cycle i, i.e., preceding sequencing cycles 1 to i - 1.
- the four intensity distributions correspond to the four bases A, C, T, and G.
- the current base call 222 is made by determining which of the four intensity distributions the current intensity data 202t belongs to. In some implementations, this is accomplished by using an expectation maximization algorithm.
- the expectation maximization algorithm iteratively maximizes the likelihood of observing means (centroids) and distributions (covariances) that best fit the current available intensity data.
- the likelihoods of the current intensity data 202t belonging to each of the four intensity distributions are calculated.
- the greatest likelihood gives the current base call 222.
- "m, n" are the intensity values of the current intensity data 202t in the first and second intensity channels, respectively.
- the expectation maximization algorithm generates four values that represent the likelihoods of the "m, n" intensity values belonging to each of the four intensity distributions. The maximum of the four values identifies the called base.
- a k -means clustering algorithm a k -means-like clustering algorithm, a histogram based method, and the like can be used for base calling.
- an intensity correction parameters determiner 232 determines intensity correction parameters 242 for the target cluster based on the current base call 222.
- the intensity correction parameters 242 include distribution intensity in the first intensity channel, distribution intensity in the second intensity channel, intensity error in the first intensity channel, intensity error in the second intensity channel, distribution centroid-to-origin distance, and distribution intensity-to-intensity error similarity measure.
- An accumulated intensity correction parameter determiner 252 accumulates the intensity correction parameters 242 with historic accumulated intensity correction parameters 254 from preceding sequencing cycle i - 1 to determine accumulated intensity correction parameters 262. Examples of accumulation include summing and averaging.
- a variation correction coefficients determiner 272 determines variation correction coefficients 282 based on the determine accumulated intensity correction parameters 262.
- the sequencer At the next sequencing cycle i + 1, the sequencer generates sequencing images 294.
- the sequencing images 294 contain next intensity data 294t registered for the target cluster at the next sequencing cycle i + 1, along with containing next intensity data 294 registered for multiple clusters in the cluster population.
- the "t" in the next intensity data 294t refers to the target cluster.
- An intensity corrector 292 applies the variation correction coefficients 282 to the next intensity data 294t to generate corrected next intensity data 296t.
- the "t" in the corrected next intensity data 296t refers to the target cluster.
- the intensity profile of the target cluster includes the corrected next intensity data 296t, and next historic intensity data registered for the target cluster at those sequencing cycles of the sequencing run that precede the next sequencing cycle i + 1, i.e ., preceding sequencing cycles 1 to i.
- the corrected next intensity data 296t is provided to the base caller 212.
- the base caller 212 processes the corrected next intensity data 296t and generates a next base call 298 for the target cluster at the next sequencing cycle i + 1.
- the expectation maximization algorithm observes the means (centroids) and the distributions (covariances) based on the corrected next intensity data 296t to best fit the next available intensity data.
- the likelihoods of the corrected next intensity data 296t belonging to each of the four intensity distributions are calculated. The greatest likelihood gives the next base call 298.
- the base calling pipeline 200 is executed on a cluster-by-cluster basis and is executed in parallel for the multiple clusters in the cluster population. Also, the base calling pipeline 200 is executed repeatedly for successive sequencing cycles of the sequencing run ( e.g. , for successive 150 sequencing cycles of read 1 and another successive 150 sequencing cycles of read 2 in a paired-end sequencing run).
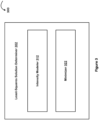
- Figure 3 shows a least-squares solution determiner that implements a least-squares solution 300 disclosed herein.
- the least-squares solution 300 determines closed-form expressions for the accumulated intensity correction parameters 262 and the variation correction coefficients 282.
- the least-squares solution determiner 302 comprises an intensity modeler 312 and a minimizer 322.
- the minimizer 322 calculates two partial derivatives of the error function with respect to the amplification coefficient â and the channel-specific offset coefficients d ⁇ i .
- d ⁇ 1 e ⁇ 1 + 1 ⁇ a ⁇ x ⁇ 1
- d ⁇ 1 is the offset coefficient for the first intensity channel
- d ⁇ 2 e ⁇ 2 + 1 ⁇ a ⁇ x ⁇ 2
- d ⁇ 2 is the offset coefficient for the second intensity channel
- the least-squares solution 300 is executed in advance of the sequencing run to determine the closed-form expressions. Once determined, the closed-form expressions are applied to the intensity values generated during the sequencing run on a cluster-by-cluster and iteratively at each sequencing cycle of the sequencing run.
- the following discussion focuses on how the six intensity correction parameters, namely, the distribution intensity in the first intensity channel, the distribution intensity in the second intensity channel, the intensity error in the first intensity channel, the intensity error in the second intensity channel, the distribution centroid-to-origin distance, and the distribution intensity-to-intensity error similarity measure are determined for the target cluster at the current sequencing cycle.
- the number of the intensity correction parameters would change depending upon the number of intensity channels. For example, in the case of the four-channel implementation, four channel-specific distribution intensities and four channel-specific intensity errors would be calculated for the four intensity channels, respectively.
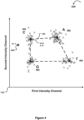
- Figure 4 shows an example 400 of how the channel-specific distribution intensities are measured for the target cluster at the current sequencing cycle i.
- the " " symbol represents the intensity values in the first and the second intensity channels registered for cluster 1 at the current sequencing cycle i and the preceding sequencing cycles 1 to i - 1.
- the four intensity distributions C 402, A 406, G 462, and T 466 are connected to form the constellation 102 for cluster 1.
- the "*" symbol represents the measured intensities "m, n" 422 in the first and the second intensity channels registered for the cluster 1 at the current sequencing cycle i. Since the measured intensities "m, n" 422 are closest to centroid 414 of the intensity distribution C 402, cluster 1 belongs to the intensity distribution C 402, and therefore assigned the base call C at the current sequencing cycle i.
- intensity values "a, b" at the centroid 414 are the distribution intensities for cluster 1 at the current sequencing cycle i. Also, “a” is the channel-specific distribution intensity for the first intensity channel, and “b” is the channel-specific distribution intensity for the second intensity channel.
- Figure 5 shows an example 500 of how the channel-specific intensity errors are calculated for the target cluster at the current sequencing cycle i.
- Figure 6 shows an example 600 of how the distribution centroid-to-origin distances are calculated for the target cluster at the current sequencing cycle i.
- Cluster 1 belongs to the C intensity distribution 402, and the intensity values "a, b" at the centroid 414 are the distribution intensities for cluster 1 at the current sequencing cycle i.
- Figure 7 depicts another example of a base calling pipeline 700 that implements the variation correction logic.
- each of the twenty four sets of the intensity correction parameters includes the six intensity correction parameters, namely, the distribution intensity in the first intensity channel, the distribution intensity in the second intensity channel, the intensity error in the first intensity channel, the intensity error in the second intensity channel, the distribution centroid-to-origin distance, and the distribution intensity-to-intensity error similarity.
- Each of the twenty four sets of the accumulated intensity correction parameters includes the six accumulated intensity correction parameters x 1 , x 2 , e 1 , e 2 , xx , and xe.
- the preceding accumulated intensity correction parameters 702 are metadata (or statistics) about the underlying preceding intensity values and preceding intensity correction parameters from which they are calculated. As a result, compared to the underlying preceding intensity values and the preceding intensity correction parameters, the preceding accumulated intensity correction parameters 702 have a much smaller memory footprint.
- the preceding accumulated intensity correction parameters 702 are cached in memory during the sequencing run and are accumulated with current intensity correction parameters 732 for the target cluster to generate current accumulated intensity correction parameters 742 for the target cluster, as depicted by triangle 734.
- the preceding accumulated intensity correction parameters 702 are stored in a quantized fixed bit width format. For example, one or two bytes can be used to store each preceding accumulated intensity correction parameter in the preceding accumulated intensity correction parameters 702.
- Current measured intensity 712 for the target cluster includes the intensity values registered for the target cluster at the twenty-fifth sequencing cycle. Based on the current measured intensity 712, a current base call 722 is called for the target cluster at the twenty-fifth sequencing cycle ( e.g ., by using the expectation maximization algorithm).
- the current intensity correction parameters 732 are determined for the target cluster.
- the current accumulated intensity correction parameters 742 are calculated for the target cluster based on accumulating the preceding accumulated intensity correction parameters 702 with the current intensity correction parameters 732, as depicted by the triangle 734.
- One example of the accumulation is summing.
- the current accumulated intensity correction parameters 742 are calculated by summing the preceding accumulated intensity correction parameters 702 and the current intensity correction parameters 732 on an intensity correction parameter-basis (as shown above in Intermediate Terms 1 to 6).
- the preceding accumulated intensity correction parameters 702 are stored in a compact representation (e.g., a summed representation or an averaged representation).
- the preceding accumulated intensity correction parameters 702 are stored in their averaged representation and first multiplied by the number of sequencing cycles over which they are accumulated to retrieve the pre-average representation, i.e., 24 is the multiplier in the example discussed herein.
- x ⁇ 1 24 is the first accumulated intensity correction parameter for the twenty-fourth sequencing cycle.
- x 25 C ,1 is the distribution intensity in the first intensity channel for the twenty-fifth sequencing cycle.
- x ⁇ 2 24 is the second accumulated intensity correction parameter for the twenty-fourth sequencing cycle.
- x 25 C ,2 is the distribution intensity in the second intensity channel for the twenty-fifth sequencing cycle.
- e ⁇ 1 24 is the third accumulated intensity correction parameter for the twenty-fourth sequencing cycle.
- e 25 C ,1 is the intensity error in the first intensity channel for the twenty-fifth sequencing cycle.
- e ⁇ 2 24 is the fourth accumulated intensity correction parameter for the twenty-fourth sequencing cycle.
- e 25 C ,2 is the intensity error in the second intensity channel for the twenty-fifth sequencing cycle.
- xx 24 is the fifth accumulated intensity correction parameter for the twenty-fourth sequencing cycle.
- x C , 1 25 2 + x C , 2 25 2 is the distribution centroid-to-origin distance for the twenty-fifth sequencing cycle.
- xe 24 is the sixth accumulated intensity correction parameter for the twenty-fourth sequencing cycle.
- x C , 1 25 e C , 1 25 + x C , 2 25 e C , 2 25 is the distribution intensity-to-intensity error similarity measure for the twenty-fifth sequencing cycle.
- xe 25 is the sixth accumulated intensity correction parameter for the twenty-fifth sequencing cycle and used to correct the measured intensity for the twenty-sixth sequencing cycle.
- xe ⁇ 25 xe ⁇ 24 ⁇ 24 + x C , 1 25 e C , 1 25 + x C , 2 25 e C , 2 25 25 25 25 25
- the current accumulated intensity correction parameters 742 are metadata (or statistics) about the current measured intensity 712 and the current intensity correction parameters 732. As a result, compared to the current measured intensity 712 and the current intensity correction parameters 732, the current accumulated intensity correction parameters 742 have a much smaller memory footprint.
- the current accumulated intensity correction parameters 742 are cached in memory during the sequencing run and are accumulated with next intensity correction parameters 794 for the target cluster to generate next accumulated intensity correction parameters 796 for the target cluster, as depicted by triangle 784.
- the current accumulated intensity correction parameters 742 are stored in a quantized fixed bit width format. For example, one or two bytes can be used to store each preceding accumulated intensity correction parameter in the current accumulated intensity correction parameters 742.
- the current accumulated intensity correction parameters 742 are used to determine a current amplification coefficient 752 for the target cluster. This includes executing the closed-form expression in Equation 23 in dependence upon the current accumulated intensity correction parameters 742.
- the current accumulated intensity correction parameters 742 and the current amplification coefficient 752 are used to determine current channel-specific offset coefficients 762 for the target cluster. This includes executing the closed-form expressions in Equations 17 and 18 in dependence upon the current accumulated intensity correction parameters 742 and the amplification coefficient 752.
- the current amplification coefficient 752 and the current channel-specific offset coefficients 762 are used to correct a next measured intensity 772 measured for the target cluster at the twenty-sixth sequencing cycle.
- the correcting includes channel-wise subtracting the current channel-specific offset coefficients 762 from the next measured intensity 772 to generate next shifted intensity, and dividing the next shifted intensity by the current amplification coefficient 752 to generate next corrected measured intensity 782 for the target cluster.
- a next base call 792 is called for the target cluster at the twenty-sixth sequencing cycle using the next corrected measured intensity 782. This is accomplished by providing the next corrected measured intensity 782 as input to the base caller 212 (e.g., by using the expectation maximization algorithm).
- a controller (not shown) iterates the base calling pipeline 700 for successive sequencing cycles of the sequencing run, as exemplified by operations 794, 796, 798, and 799.
- the current accumulated intensity correction parameters 742 serve as the preceding accumulated intensity correction parameters 702, as depicted by triangle 784.
- the base calling pipeline 700 is executed on a cluster-by-cluster basis and is executed in parallel for the multiple clusters in the cluster population.
- Figure 8 shows one implementation of a weighting function 800 described herein. Since the least-squares solution 300 can take several sequencing cycles to converge, the weighting function 800 is used to attenuate the variation correction coefficients in initial sequencing cycles of the sequencing run, and to amplify the variation correction coefficients in later sequencing cycles of the sequencing run.
- the weighting function 800 works as follows. First, an initial amplification coefficient 802 and initial offset coefficients 822 and 832 are initialized. In one implementation, the initial amplification coefficient 802 is initialized at a first sequencing cycle of the sequencing run with a predetermined value (e.g ., "1") and the initial offset coefficients 822 and 832 are initialized at the first sequencing cycle with a predetermined value ( e.g ., "0").
- a predetermined value e.g ., "1”
- a predetermined value e.g ., "0"
- the weighting function 800 combines ( e.g ., sums) the initial amplification coefficient 802 with the amplification coefficients 806 (determined by the least-squares solution 300), and combines the initial first and second offset coefficients 822 and 832 with the first and second offset coefficients 826 and 836 (determined by the least-squares solution 300), such that the amplification coefficient 806 and the first and second offset coefficients 826 and 836 are attenuated in the initial sequencing cycles and amplified in the later sequencing cycles.
- the expression c ⁇ p c equals to "-1.” Then, between “0" and “-1,” the lsqmax weight 808 selects the maximum of the two values, i.e ., 0. The expression ( 1 ⁇ c ⁇ p c ) equals to "2.” Then, between “1” and “2,” the inimin weight 804 selects the minimum of the two values, i.e ., 1.
- 0 from the lsqmax weight 808 is be multiplied with the amplification coefficient 806 and the first and second offset coefficients 826 and 836, and 1 from the inimin weight 804 is multiplied with the initial amplification coefficient 802 and the initial first and second offset coefficients 822 and 832.
- the results of the two multiplications are summed to generate the weighted amplification coefficient 810 and the weighted first and second offset coefficients 820 and 830.
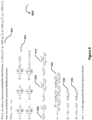
- Figure 9 shows one implementation of directly applying maximum likelihood weights 906, 908, and 910 to the variation correction coefficients.
- the maximum likelihood weights 906, 908, and 910 are generated by applying a maximum likelihood solution 900 to probability distributions 902 of historical values observed for the variation correction coefficients in previous sequencing runs.
- Figure 9 also illustrates accumulated intensity correction parameters 904.
- the maximum likelihood weights 906, 908, and 910 are a function of the current sequencing cycle, as represented by the index "C.”
- the maximum likelihood weights 906, 908, and 910 change on a sequencing cycle-basis in dependence upon the index C.
- the maximum likelihood weights 906, 908, and 910 are also a function of the additive noise, as represented by the character "n.”
- the sigma term " ⁇ " represents the range of variation in the historical values observed for the respective variation correction coefficient, i.e ., variance ( ⁇ 2 ).
- the sigma term for the additive noise can be estimated using the maximum likelihood solution 900 or can be user-specified.
- the sigma terms for the amplification coefficient, the channel-specific offset coefficients, and the additive noise are determined on a sequencing run-basis and kept fixed for all the sequencing cycles of the sequencing run.
- the sigma terms incorporate apriori knowledge about the uncertainty observed in the variation correction coefficients.
- a center/initial/mean value for the probability distribution of the amplification coefficient is set to be "1," and a center/initial/mean value for the probability distributions of the channel-specific offset coefficients is set to be "0.”
- the maximum likelihood weights 906, 908, and 910 are directly incorporated to calculate the weighted amplification coefficient 920 and the weighted channel-specific offset coefficients 930 and 940, respectively.
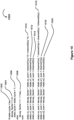
- Figure 10 shows one implementation of applying an exponential decay factor to the variation correction coefficients.
- Exponential decay logic 1000 is based on so-called “tau” and "stats.cycle.”
- the term “stats.cycle” refers to the current sequencing cycle.
- Tau is set to a predetermined value depending on the degree of time variance observed in the intensity correction parameters. If the intensity correction parameters are time-invariant, then tau can be set to infinity. If the intensity correction parameters are rapidly time-variant, then tau can be set to a small value. In one implementation, tau is set to thirty-two.
- each of the accumulated intensity correction parameters is multiplied by the decay factor at each successive sequencing cycle, as shown below:
- the accumulated intensity correction parameters are accumulated using the sum operation.
- the accumulated intensity correction parameters are accumulated using the average operation.
- the divisor "C" in the Intermediate Terms 1.2 to 6.2 is kept fixed after the tau number of sequencing cycles of the sequencing run, i.e., after thirty-second sequencing cycle of the sequencing run.
- the weighted least-squares solution ( Figure 8 ), the maximum likelihood solution ( Figure 9 ), and the exponential decay factor solution ( Figure 10 ) are combined to generate weighted variation correction coefficients at each sequencing cycle of the sequencing run.
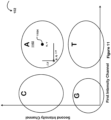
- Figure 11 shows another implementation of determining the channel-specific offset coefficients.
- a first channel-specific offset coefficient (“ ⁇ x") for the first intensity channel and for the target cluster at the current sequencing cycle is calculated as a difference between the measured intensity ("p") in the first intensity channel for the target cluster at the current sequencing cycle and the intensity value ("u") in the first intensity channel at a centroid 1104 of a base-specific intensity distribution A 1102 to which the target cluster belongs at the current sequencing cycle (e.g., as determined by the expectation maximization algorithm).
- a second channel-specific offset coefficient (“ ⁇ y") for the second intensity channel and for the target cluster at the current sequencing cycle is calculated as a difference between the measured intensity ("q") in the second intensity channel for the target cluster at the current sequencing cycle and the intensity value ("v") in the second intensity channel at the centroid 1104 of the base-specific intensity distribution A 1102 to which the target cluster belongs at the current sequencing cycle.
- the first channel-specific offset coefficient (" ⁇ x") and the second channel-specific offset coefficient (“ ⁇ y") are determined at each sequencing cycle of the sequencing run. In some implementations, after a configurable number of sequencing cycles (e.g ., ten or twenty sequencing cycles), the first channel-specific offset coefficient (" ⁇ x") and the second channel-specific offset coefficient (" ⁇ y") are initialized with a predetermined value ( e.g. , "0").
- an average is calculated for the first offset channel-specific coefficient (" ⁇ x") and the second channel-specific offset coefficient (" ⁇ y") after the configurable number of sequencing cycles.
- the average is then used as a substitute for the first offset channel-specific coefficient (" ⁇ x") and the second channel-specific offset coefficient (" ⁇ y") until the next average is calculated for the next set of the configurable number of sequencing cycles.
- the first channel-specific offset coefficient (" ⁇ x") and the second channel-specific offset coefficient (“ ⁇ y") are calculated only when the target cluster belongs to the A, C, and T base-specific intensity distributions, and not when the target cluster belongs to the G (dark) base-specific intensity distribution.
- the first channel-specific offset coefficient (" ⁇ x") and the second channel-specific offset coefficient (" ⁇ y") are initialized for the second read with the values available at the end of the first read, but updated thereafter each set of the configurable number of sequencing cycles.
- Figures 12 , 13 , and 14 compare performance of three approaches, namely, a scaling-only solution, an offsets-only solution (discussed in Figure 11 ), and the least-squares solution 300.
- the three approaches are applied to intensity data generated using Illumina's Real-Time Analysis (RTA) software over twenty datasets from Illumina's sequencer NextSeq 2000.
- RTA Real-Time Analysis
- Figure 15 is a computer system 1500 that can be used to implement the technology disclosed.
- Computer system 1500 includes at least one central processing unit (CPU) 1572 that communicates with a number of peripheral devices via bus subsystem 1555.
- peripheral devices can include a storage subsystem 1510 including, for example, memory devices and a file storage subsystem 1536, user interface input devices 1538, user interface output devices 1576, and a network interface subsystem 1574.
- the input and output devices allow user interaction with computer system 1500.
- Network interface subsystem 1574 provides an interface to outside networks, including an interface to corresponding interface devices in other computer systems.
- the least-squares solution determiner 302 is communicably linked to the storage subsystem 1510 and the user interface input devices 1538.
- User interface input devices 1538 can include a keyboard; pointing devices such as a mouse, trackball, touchpad, or graphics tablet; a scanner; a touch screen incorporated into the display; audio input devices such as voice recognition systems and microphones; and other types of input devices.
- pointing devices such as a mouse, trackball, touchpad, or graphics tablet
- audio input devices such as voice recognition systems and microphones
- use of the term "input device” is intended to include all possible types of devices and ways to input information into computer system 1500.
- User interface output devices 1576 can include a display subsystem, a printer, a fax machine, or non-visual displays such as audio output devices.
- the display subsystem can include an LED display, a cathode ray tube (CRT), a flat-panel device such as a liquid crystal display (LCD), a projection device, or some other mechanism for creating a visible image.
- the display subsystem can also provide a non-visual display such as audio output devices.
- output device is intended to include all possible types of devices and ways to output information from computer system 1500 to the user or to another machine or computer system.
- Storage subsystem 1510 stores programming and data constructs that provide the functionality of some or all of the modules and methods described herein. These software modules are generally executed by processors 1578.
- Processors 1578 can be graphics processing units (GPUs), field-programmable gate arrays (FPGAs), application-specific integrated circuits (ASICs), and/or coarse-grained reconfigurable architectures (CGRAs).
- GPUs graphics processing units
- FPGAs field-programmable gate arrays
- ASICs application-specific integrated circuits
- CGRAs coarse-grained reconfigurable architectures
- Processors 1578 can be hosted by a deep learning cloud platform such as Google Cloud Platform TM , Xilinx TM , and Cirrascale TM .
- processors 1578 include Google's Tensor Processing Unit (TPU) TM , rackmount solutions like GX4 Rackmount Series TM , GX15 Rackmount Series TM , NVIDIA DGX-1 TM , Microsoft' Stratix V FPGA TM , Graphcore's Intelligent Processor Unit (IPU) TM , Qualcomm's Zeroth Platform TM with iOS processors TM , NVIDIA's Volta TM , NVIDIA's DRIVE PX TM , NVIDIA's JETSON TX1/TX2 MODULE TM , Intel's Nirvana TM , Movidius VPU TM , Fujitsu DPI TM , ARM's DynamicIQ TM , IBM TrueNorth TM , Lambda GPU Server with Testa V100s TM , and others.
- TPU Tensor Processing Unit
- rackmount solutions like GX4 Rackmount Series TM , GX15 Rackmount Series TM , NVIDIA
- Memory subsystem 1522 used in the storage subsystem 1510 can include a number of memories including a main random access memory (RAM) 1532 for storage of instructions and data during program execution and a read only memory (ROM) 1534 in which fixed instructions are stored.
- a file storage subsystem 1536 can provide persistent storage for program and data files, and can include a hard disk drive, a floppy disk drive along with associated removable media, a CD-ROM drive, an optical drive, or removable media cartridges.
- the modules implementing the functionality of certain implementations can be stored by file storage subsystem 1536 in the storage subsystem 1510, or in other machines accessible by the processor.
- Bus subsystem 1555 provides a mechanism for letting the various components and subsystems of computer system 1500 communicate with each other as intended. Although bus subsystem 1555 is shown schematically as a single bus, alternative implementations of the bus subsystem can use multiple busses.
- Computer system 1500 itself can be of varying types including a personal computer, a portable computer, a workstation, a computer terminal, a network computer, a television, a mainframe, a server farm, a widely-distributed set of loosely networked computers, or any other data processing system or user device. Due to the ever-changing nature of computers and networks, the description of computer system 1500 depicted in Figure 15 is intended only as a specific example for purposes of illustrating the preferred implementations of the present invention. Many other configurations of computer system 1500 are possible having more or less components than the computer system depicted in Figure 15 .
- Each of the processors or modules discussed herein may include an algorithm (e.g., instructions stored on a tangible and/or non-transitory computer readable storage medium) or sub-algorithms to perform particular processes.
- the variation corrector 232 is illustrated conceptually as a collection of modules, but may be implemented utilizing any combination of dedicated hardware boards, DSPs, processors, etc. Alternatively, the variation corrector 232 may be implemented utilizing an off-the-shelf PC with a single processor or multiple processors, with the functional operations distributed between the processors.
- the modules described below may be implemented utilizing a hybrid configuration in which certain modular functions are performed utilizing dedicated hardware, while the remaining modular functions are performed utilizing an off-the-shelf PC and the like.
- the modules also may be implemented as software modules within a processing unit.
- the computer can include a processor that is part of a detection device, networked with a detection device used to obtain the data that is processed by the computer or separate from the detection device.
- information e.g. , image data
- a local area network (LAN) or wide area network (WAN) may be a corporate computing network, including access to the Internet, to which computers and computing devices comprising the system are connected.
- the LAN conforms to the transmission control protocol/internet protocol (TCP/IP) industry standard.
- TCP/IP transmission control protocol/internet protocol
- the information (e.g., image data) is input to a system disclosed herein via an input device (e.g., disk drive, compact disk player, USB port etc.).
- an input device e.g., disk drive, compact disk player, USB port etc.
- the information is received by loading the information, e.g., from a storage device such as a disk or flash drive.
- a processor that is used to run an algorithm or other process set forth herein may comprise a microprocessor.
- the microprocessor may be any conventional general purpose single- or multi-chip microprocessor such as a Pentium TM processor made by Intel Corporation.
- a particularly useful computer can utilize an Intel Ivybridge dual-12 core processor, LSI raid controller, having 128 GB of RAM, and 2 TB solid state disk drive.
- the processor may comprise any conventional special purpose processor such as a digital signal processor or a graphics processor.
- the processor typically has conventional address lines, conventional data lines, and one or more conventional control lines.
- the implementations disclosed herein may be implemented as a method ( e.g ., Figures 2 and 7 ), apparatus, system or article of manufacture using standard programming or engineering techniques to produce software, firmware, hardware, or any combination thereof.
- article of manufacture refers to code or logic implemented in hardware or computer readable media such as optical storage devices, and volatile or non-volatile memory devices.
- Such hardware may include, but is not limited to, field programmable gate arrays (FPGAs), application-specific integrated circuits (ASICs), complex programmable logic devices (CPLDs), programmable logic arrays (PLAs), microprocessors, or other similar processing devices.
- FPGAs field programmable gate arrays
- ASICs application-specific integrated circuits
- CPLDs complex programmable logic devices
- PDAs programmable logic arrays
- microprocessors or other similar processing devices.
- information or algorithms set forth herein are present in non-transient storage media.
- a computer-implemented method set forth herein can occur in real time while multiple images of an object are being obtained.
- Such real time analysis is particularly useful for nucleic acid sequencing applications wherein an array of nucleic acids is subjected to repeated cycles of fluidic and detection steps.
- Analysis of the sequencing data can often be computationally intensive such that it can be beneficial to perform the methods set forth herein in real time or in the background while other data acquisition or analysis algorithms are in process.
- Example real time analysis methods that can be used with the present methods are those used for the MiSeq and HiSeq sequencing devices commercially available from Illumina, Inc. (San Diego, Calif.) and/or described in US Pat. App. Pub. No. 2012/0020537 A1 , which is incorporated herein by reference.
- sample and its derivatives, is used in its broadest sense and includes any specimen, culture and the like that is suspected of including a target.
- sample comprises DNA, RNA, PNA, LNA, chimeric or hybrid forms of nucleic acids.
- the sample can include any biological, clinical, surgical, agricultural, atmospheric, or aquatic-based specimen containing one or more nucleic acids.
- the term also includes any isolated nucleic acid sample such a genomic DNA, fresh-frozen or formalin-fixed paraffin-embedded nucleic acid specimen. It is also envisioned that the sample can be from a single individual, a collection of nucleic acid samples from genetically related members, nucleic acid samples from genetically unrelated members, nucleic acid samples (matched) from a single individual such as a tumor sample and normal tissue sample, or sample from a single source that contains two distinct forms of genetic material such as maternal and fetal DNA obtained from a maternal subject, or the presence of contaminating bacterial DNA in a sample that contains plant or animal DNA.
- the source of nucleic acid material can include nucleic acids obtained from a newborn, for example as typically used for newborn screening.
- the nucleic acid sample can include high molecular weight material such as genomic DNA (gDNA).
- the sample can include low molecular weight material such as nucleic acid molecules obtained from FFPE or archived DNA samples. In another implementation, low molecular weight material includes enzymatically or mechanically fragmented DNA.
- the sample can include cell-free circulating DNA.
- the sample can include nucleic acid molecules obtained from biopsies, tumors, scrapings, swabs, blood, mucus, urine, plasma, semen, hair, laser capture micro-dissections, surgical resections, and other clinical or laboratory obtained samples.
- the sample can be an epidemiological, agricultural, forensic, or pathogenic sample.
- the sample can include nucleic acid molecules obtained from an animal such as a human or mammalian source.
- the sample can include nucleic acid molecules obtained from a non-mammalian source such as a plant, bacteria, virus, or fungus.
- the source of the nucleic acid molecules may be an archived or extinct sample or species.
- forensic samples can include nucleic acids obtained from a crime scene, nucleic acids obtained from a missing persons DNA database, nucleic acids obtained from a laboratory associated with a forensic investigation or include forensic samples obtained by law enforcement agencies, one or more military services or any such personnel.
- the nucleic acid sample may be a purified sample or a crude DNA containing lysate, for example derived from a buccal swab, paper, fabric, or other substrate that may be impregnated with saliva, blood, or other bodily fluids.
- the nucleic acid sample may comprise low amounts of, or fragmented portions of DNA, such as genomic DNA.
- target sequences can be present in one or more bodily fluids including but not limited to, blood, sputum, plasma, semen, urine, and serum.
- target sequences can be obtained from hair, skin, tissue samples, autopsy, or remains of a victim.
- nucleic acids including one or more target sequences can be obtained from a deceased animal or human.
- target sequences can include nucleic acids obtained from non-human DNA such a microbial, plant or entomological DNA.
- target sequences or amplified target sequences are directed to purposes of human identification.
- the disclosure relates generally to methods for identifying characteristics of a forensic sample.
- the disclosure relates generally to human identification methods using one or more target specific primers disclosed herein or one or more target specific primers designed using the primer design criteria outlined herein.
- a forensic or human identification sample containing at least one target sequence can be amplified using any one or more of the target-specific primers disclosed herein or using the primer criteria outlined herein.
- the technology disclosed generates variation correction coefficients to correct inter-cluster intensity profile variation in image data.
- the technology disclosed can be practiced as a system, method, or article of manufacture.
- One or more features of an implementation can be combined with the base implementation. Implementations that are not mutually exclusive are taught to be combinable.
- One or more features of an implementation can be combined with other implementations. This disclosure periodically reminds the user of these options. Omission from some implementations of recitations that repeat these options should not be taken as limiting the combinations taught in the preceding sections - these recitations are hereby incorporated forward by reference into each of the following implementations.
- implementations of the method described in this section can include a non-transitory computer readable storage medium storing instructions executable by a processor to perform any of the methods described above.
- implementations of the method described in this section can include a system including memory and one or more processors operable to execute instructions, stored in the memory, to perform any of the methods described above.
- the variation correction is performed on non-intensity data, such as on pH changes induced by the release of hydrogen ions during molecule extension.
- the pH changes are detected and converted to a voltage change that is proportional to the number of bases incorporated ( e.g ., in the case of Ion Torrent).
- the non-intensity data is constructed from nanopore sensing that uses biosensors to measure the disruption in current as an analyte passes through a nanopore or near its aperture while determining the identity of the base.
- nanopore sensing that uses biosensors to measure the disruption in current as an analyte passes through a nanopore or near its aperture while determining the identity of the base.
- ONT Oxford Nanopore Technologies
- the Oxford Nanopore Technologies (ONT) sequencing is based on the following concept: pass a single strand of DNA (or RNA) through a membrane via a nanopore and apply a voltage difference across the membrane.
- the nucleotides present in the pore will affect the pore's electrical resistance, so current measurements over time can indicate the sequence of DNA bases passing through the pore.
- This electrical current signal (the 'squiggle' due to its appearance when plotted) is the raw data gathered by an ONT sequencer.
- DAC integer data acquisition
- One or more implementations of the technology disclosed, or elements thereof can be implemented in the form of a computer product including a non-transitory computer readable storage medium with computer usable program code for performing the method steps indicated. Furthermore, one or more implementations of the technology disclosed, or elements thereof can be implemented in the form of an apparatus including a memory and at least one processor that is coupled to the memory and operative to perform exemplary method steps.
- one or more implementations of the technology disclosed or elements thereof can be implemented in the form of means for carrying out one or more of the method steps described herein; the means can include (i) hardware module(s), (ii) software module(s) executing on one or more hardware processors, or (iii) a combination of hardware and software modules; any of (i)-(iii) implement the specific techniques set forth herein, and the software modules are stored in a computer readable storage medium (or multiple such media).
- Offset coefficient(s) and “offset(s)” interchangeably.
- nucleotide(s) and “base(s)” interchangeably.
Landscapes
- Engineering & Computer Science (AREA)
- Physics & Mathematics (AREA)
- Theoretical Computer Science (AREA)
- Life Sciences & Earth Sciences (AREA)
- Data Mining & Analysis (AREA)
- Computer Vision & Pattern Recognition (AREA)
- Health & Medical Sciences (AREA)
- Bioinformatics & Cheminformatics (AREA)
- Evolutionary Biology (AREA)
- Bioinformatics & Computational Biology (AREA)
- Medical Informatics (AREA)
- Evolutionary Computation (AREA)
- Artificial Intelligence (AREA)
- General Physics & Mathematics (AREA)
- Spectroscopy & Molecular Physics (AREA)
- Biotechnology (AREA)
- Biophysics (AREA)
- General Health & Medical Sciences (AREA)
- General Engineering & Computer Science (AREA)
- Databases & Information Systems (AREA)
- Software Systems (AREA)
- Public Health (AREA)
- Epidemiology (AREA)
- Bioethics (AREA)
- Molecular Biology (AREA)
- Signal Processing (AREA)
- Multimedia (AREA)
- Chemical & Material Sciences (AREA)
- Analytical Chemistry (AREA)
- Proteomics, Peptides & Aminoacids (AREA)
- Measuring Or Testing Involving Enzymes Or Micro-Organisms (AREA)
- Apparatus For Radiation Diagnosis (AREA)
- Nuclear Medicine (AREA)
- Complex Calculations (AREA)
- Telephonic Communication Services (AREA)
Abstract
Description
- This application claims the priority to
U.S. Provisional Patent Application No.: 63/106,256, entitled "Systems and Methods for Per-Cluster Intensity Correction and Base Calling," filed October 27, 2020 - The technology disclosed relates to apparatus and corresponding methods for the automated analysis of an image or recognition of a pattern. Included herein are systems that transform an image for the purpose of (a) enhancing its visual quality prior to recognition, (b) locating and registering the image relative to a sensor or stored prototype, or reducing the amount of image data by discarding irrelevant data, and (c) measuring significant characteristics of the image. In particular, the technology disclosed relates to generating variation correction coefficients to correct inter-cluster intensity profile variation in image data.
-
-
U.S. Provisional Patent Application No. 63/020,449, entitled, "EQUALIZATION-BASED IMAGE PROCESSING AND SPATIAL CROSSTALK ATTENUATOR," filed May 5, 2020 -
US Nonprovisional Patent Application No. 15/936,365, entitled "DETECTION APPARATUS HAVING A MICROFLUOROMETER, A FLUIDIC SYSTEM, AND A FLOW CELL LATCH CLAMP MODULE," filed on March 26, 2018 -
US Nonprovisional Patent Application No. 16/567,224, entitled "FLOW CELLS AND METHODS RELATED TO SAME," filed on September 11, 2019 -
US Nonprovisional Patent Application No. 16/439,635, entitled "DEVICE FOR LUMINESCENT IMAGING," filed on June 12, 2019 -
US Nonprovisional Patent Application No. 15/594,413, entitled "INTEGRATED OPTOELECTRONIC READ HEAD AND FLUIDIC CARTRIDGE USEFUL FOR NUCLEIC ACID SEQUENCING," filed on May 12, 2017 -
US Nonprovisional Patent Application No. 16/351,193, entitled "ILLUMINATION FOR FLUORESCENCE IMAGING USING OBJECTIVE LENS," filed on March 12, 2019 -
US Nonprovisional Patent Application No. 12/638,770, entitled "DYNAMIC AUTOFOCUS METHOD AND SYSTEM FOR ASSAY IMAGER," filed on December 15, 2009 -
US Nonprovisional Patent Application No. 13/783,043, entitled "KINETIC EXCLUSION AMPLIFICATION OF NUCLEIC ACID LIBRARIES," filed on March 1, 2013 -
US Nonprovisional Patent Application No. 13/006,206, entitled "DATA PROCESSING SYSTEM AND METHODS," filed on January 13, 2011 ; -
US Nonprovisional Patent Application No. 14/530,299, entitled "IMAGE ANALYSIS USEFUL FOR PATTERNED OBJECTS," filed on October 31, 2014 -
US Nonprovisional Patent Application No. 15/153,953, entitled "METHODS AND SYSTEMS FOR ANALYZING IMAGE DATA," filed on December 3, 2014 -
US Nonprovisional Patent Application No. 14/020,570, entitled "CENTROID MARKERS FOR IMAGE ANALYSIS OF HIGH DENSITY CLUSTERS IN COMPLEX POLYNUCLEOTIDE SEQUENCING," filed on September 6, 2013 ; -
US Nonprovisional Patent Application No. 14/530,299, entitled "IMAGE ANALYSIS USEFUL FOR PATTERNED OBJECTS," filed on October 31, 2014 -
US Nonprovisional Patent Application No. 12/565,341, entitled "METHOD AND SYSTEM FOR DETERMINING THE ACCURACY OF DNA BASE IDENTIFICATIONS," filed on September 23, 2009 -
US Nonprovisional Patent Application No. 12/295,337, entitled "SYSTEMS AND DEVICES FOR SEQUENCE BY SYNTHESIS ANALYSIS," filed on March 30, 2007 -
US Nonprovisional Patent Application No. 12/020,739, entitled "IMAGE DATA EFFICIENT GENETIC SEQUENCING METHOD AND SYSTEM," filed on January 28, 2008 ; -
US Nonprovisional Patent Application No. 13/833,619, entitled "BIOSENSORS FOR BIOLOGICAL OR CHEMICAL ANALYSIS AND SYSTEMS AND METHODS FOR SAME," filed on March 15, 2013 -
US Nonprovisional Patent Application No. 15/175,489, entitled "BIOSENSORS FOR BIOLOGICAL OR CHEMICAL ANALYSIS AND METHODS OF MANUFACTURING THE SAME," filed on June 7, 2016 -
US Nonprovisional Patent Application No. 13/882,088, entitled "MICRODEVICES AND BIOSENSOR CARTRIDGES FOR BIOLOGICAL OR CHEMICAL ANALYSIS AND SYSTEMS AND METHODS FOR THE SAME," filed on April 26, 2013 -
US Nonprovisional Patent Application No. 13/624,200, entitled "METHODS AND COMPOSITIONS FOR NUCLEIC ACID SEQUENCING," filed on September 21, 2012 -
U.S. Provisional Patent Application No. 62/821,602, entitled "TRAINING DATA GENERATION FOR ARTIFICIAL INTELLIGENCE-BASED SEQUENCING," filed 21 March 2019 -
U.S. Provisional Patent Application No. 62/821,618, entitled "ARTIFICIAL INTELLIGENCE-BASED GENERATION OF SEQUENCING METADATA," filed 21 March 2019 -
U.S. Provisional Patent Application No. 62/821,681, entitled "ARTIFICIAL INTELLIGENCE-BASED BASE CALLING," filed 21 March 2019 -
U.S. Provisional Patent Application No. 62/821,724, entitled "ARTIFICIAL INTELLIGENCE-BASED QUALITY SCORING," filed 21 March 2019 -
U.S. Provisional Patent Application No. 62/821,766, entitled "ARTIFICIAL INTELLIGENCE-BASED SEQUENCING," filed 21 March 2019 -
NL Application No. 2023310, entitled "TRAINING DATA GENERATION FOR ARTIFICIAL INTELLIGENCE-BASED SEQUENCING," filed 14 June 2019 -
NL Application No. 2023311, entitled "ARTIFICIAL INTELLIGENCE-BASED GENERATION OF SEQUENCING METADATA," filed 14 June 2019 -
NL Application No. 2023312, entitled "ARTIFICIAL INTELLIGENCE-BASED BASE CALLING," filed 14 June 2019 -
NL Application No. 2023314, entitled "ARTIFICIAL INTELLIGENCE-BASED QUALITY SCORING," filed 14 June 2019 -
NL Application No. 2023316, entitled "ARTIFICIAL INTELLIGENCE-BASED SEQUENCING," filed 14 June 2019 -
U.S. Nonprovisional Patent Application No. 16/825,987, entitled "TRAINING DATA GENERATION FOR ARTIFICIAL INTELLIGENCE-BASED SEQUENCING," filed 20 March 2020 -
U.S. Nonprovisional Patent Application No. 16/825,991 entitled "TRAINING DATA GENERATION FOR ARTIFICIAL INTELLIGENCE-BASED SEQUENCING," filed 20 March 2020 -
U.S. Nonprovisional Patent Application No. 16/826,126, entitled "ARTIFICIAL INTELLIGENCE-BASED BASE CALLING," filed 20 March 2020 -
U.S. Nonprovisional Patent Application No. 16/826,134, entitled "ARTIFICIAL INTELLIGENCE-BASED QUALITY SCORING," filed 20 March 2020 -
U.S. Nonprovisional Patent Application No. 16/826,168, entitled "ARTIFICIAL INTELLIGENCE-BASED SEQUENCING," filed 21 March 2020 -
U.S. Provisional Patent Application No. 62/849,091, entitled, "SYSTEMS AND DEVICES FOR CHARACTERIZATION AND PERFORMANCE ANALYSIS OF PIXEL-BASED SEQUENCING," filed May 16, 2019 -
U.S. Provisional Patent Application No. 62/849,132, entitled, "BASE CALLING USING CONVOLUTIONS," filed May 16, 2019 -
U.S. Provisional Patent Application No. 62/849,133, entitled, "BASE CALLING USING COMPACT CONVOLUTIONS," filed May 16, 2019 -
U.S. Provisional Patent Application No. 62/979,384, entitled, "ARTIFICIAL INTELLIGENCE-BASED BASE CALLING OF INDEX SEQUENCES," filed February 20, 2020 -
U.S. Provisional Patent Application No. 62/979,414, entitled, "ARTIFICIAL INTELLIGENCE-BASED MANY-TO-MANY BASE CALLING," filed February 20, 2020 -
U.S. Provisional Patent Application No. 62/979,385, entitled, "KNOWLEDGE DISTILLATION-BASED COMPRESSION OF ARTIFICIAL INTELLIGENCE-BASED BASE CALLER," filed February 20, 2020 -
U.S. Provisional Patent Application No. 62/979,412, entitled, "MULTI-CYCLE CLUSTER BASED REAL TIME ANALYSIS SYSTEM," filed February 20, 2020 -
U.S. Provisional Patent Application No. 62/979,411, entitled, "DATA COMPRESSION FOR ARTIFICIAL INTELLIGENCE-BASED BASE CALLING," filed February 20, 2020 -
U.S. Provisional Patent Application No. 62/979,399, entitled, "SQUEEZING LAYER FOR ARTIFICIAL INTELLIGENCE-BASED BASE CALLING," filed February 20, 2020 - The subject matter discussed in this section should not be assumed to be prior art merely as a result of its mention in this section. Similarly, a problem mentioned in this section or associated with the subject matter provided as background should not be assumed to have been previously recognized in the prior art. The subject matter in this section merely represents different approaches, which in and of themselves can also correspond to implementations of the claimed technology.
- This disclosure relates to analyzing image data to base call clusters during a sequencing run. One challenge with the analysis of image data is variation in intensity profiles of clusters in a cluster population being base called. This causes a drop in data throughput and an increase in error rate during the sequencing run.
- There are many potential reasons for the inter-cluster intensity profile variation. It may result from differences in cluster brightness, caused by fragment length distribution in the cluster population. It may result from phase error, which occurs when a molecule in a cluster does not incorporate a nucleotide in some sequencing cycle and lags behind other molecules, or when a molecule incorporates more than one nucleotide in a single sequencing cycle. It may result from fading, i.e., an exponential decay in signal intensity of clusters as a function of sequencing cycle number due to excessive washing and laser exposure as the sequencing run progresses. It may result from underdeveloped cluster colonies, i.e., small cluster sizes that produce empty or partially filled wells on a patterned flow cell. It may result from overlapping cluster colonies caused by unexclusive amplification. It may result from under-illumination or uneven-illumination, for example, due to clusters being located on edges of a flow cell. It may result from impurities on a flow cell that obfuscate emitted signal. It may result from polyclonal clusters, i.e., when multiple clusters are deposited in the same well.
- An opportunity arises to correct the inter-cluster intensity profile variation. Improved base calling throughput and reduced base calling error rate during the sequencing run may result.
- The patent or application file contains at least one drawing executed in color. Copies of this patent or patent application publication with color drawing(s) will be provided by the Office upon request and payment of the necessary fee. The color drawings also may be available in PAIR via the Supplemental Content tab.
- In the drawings, like reference characters generally refer to like parts throughout the different views. Also, the drawings are not necessarily to scale, with an emphasis instead generally being placed upon illustrating the principles of the technology disclosed. In the following description, various implementations of the technology disclosed are described with reference to the following drawings, in which.
-
Figure 1 illustrates one example of the inter-cluster intensity profile variation discovered and corrected by the technology disclosed. -
Figure 2 illustrates an example of a base calling pipeline that implements the variation correction logic disclosed herein. -
Figure 3 shows a least-squares solution determiner that implements a least-squares solution disclosed herein. -
Figure 4 shows an example of how the channel-specific distribution intensities are measured for a target cluster at a current sequencing cycle. -
Figure 5 shows an example of how the channel-specific intensity errors are calculated for the target cluster at the current sequencing cycle. -
Figure 6 shows an example of how the distribution centroid-to-origin distances are calculated for the target cluster at the current sequencing cycle. -
Figure 7 depicts another example of a base calling pipeline that implements the variation correction logic. -
Figure 8 shows one implementation of a weighting function described herein. -
Figure 9 shows one implementation of directly applying maximum likelihood weights to the variation correction coefficients. -
Figure 10 shows one implementation of applying an exponential decay factor to the variation correction coefficients. -
Figure 11 shows another implementation of determining channel-specific offset coefficients. -
Figures 12 ,13 , and14 compare performance of three approaches, namely, a scaling-only solution, an offsets-only solution (discussed inFigure 11 ), and the least-squares solution (discussed inFigure 3 ). -
Figure 15 is a computer system that can be used to implement the technology disclosed. - The following discussion is presented to enable any person skilled in the art to make and use the technology disclosed and is provided in the context of a particular application and its requirements. Various modifications to the disclosed implementations will be readily apparent to those skilled in the art, and the general principles defined herein may be applied to other implementations and applications without departing from the spirit and scope of the technology disclosed. Thus, the technology disclosed is not intended to be limited to the implementations shown but is to be accorded the widest scope consistent with the principles and features disclosed herein.
- Development of the technology disclosed began with the analysis of intensity profiles of clusters in a cluster population being base called during a sequencing run. Analysis revealed that the intensity profiles of the clusters in the cluster population take similar form (e.g., trapezoids), but differ in scale and shifts from an
origin 132 of amulti-dimensional space 100. We refer to this as "inter-cluster intensity profile variation." Themulti-dimensional space 100 can be a cartesian space, a polar space, a cylindrical space, or a spherical space. -
Figure 1 illustrates one example of the inter-cluster intensity profile variation discovered and corrected by the technology disclosed.Figure 1 depicts intensity profiles 112, 122, and 132 ofclusters - In the implementation illustrated in
Figure 1 , the intensity values are extracted from two different color/intensity channel sequencing images generated by a sequencer at each sequencing cycle in the plurality of sequencing cycles. Examples of the sequencer include Illumina's iSeq, HiSeqX, HiSeq 3000, HiSeq 4000, HiSeq 2500, NovaSeq 6000, NextSeq 550,NextSeq 1000, NextSeq 2000, NextSeqDx, MiSeq, and MiSeqDx. - In one implementation, the sequencer uses sequencing by synthesis (SBS) for generating the sequencing images. SBS relies on growing nascent strands complementary to cluster strands with fluorescently-labeled nucleotides, while tracking the emitted signal of each newly added nucleotide. The fluorescently-labeled nucleotides have a 3' removable block that anchors a fluorophore signal of the nucleotide type. SBS occurs in repetitive sequencing cycles, each comprising three steps: (a) extension of a nascent strand by adding the fluorescently-labeled nucleotide; (b) excitation of the fluorophore using one or more lasers of an optical system of the sequencer and imaging through different filters of the optical system, yielding the sequencing images; and (c) cleavage of the fluorophore and removal of the 3' block in preparation for the next sequencing cycle. Incorporation and imaging are repeated up to a designated number of sequencing cycles, defining the read length. Using this approach, each sequencing cycle interrogates a new position along the cluster strands.
- In
Figure 1 , the "" symbol represents the intensity values for
cluster 1, the "" symbol represents the intensity values for
cluster 2, and the "•" symbol represents the intensity values for cluster 3. The identity of the four different nucleotide types/bases A, C, T, and G is encoded as a combination of the intensity values in the two color images, i.e., the first and second intensity channels. For example, a nucleic acid can be sequenced by providing a first nucleotide type (e.g., base T) that is detected in the first intensity channel (x-axis of the multi-dimensional space 100), a second nucleotide type (e.g., base C) that is detected in the second intensity channel (y-axis of the multi-dimensional space 100), a third nucleotide type (e.g., base A) that is detected in both the first and the second intensity channels, and a fourth nucleotide type (e.g., base G) that lacks a label that is not, or minimally, detected in either intensity channels. - In some implementations, the intensity profile is generated by iteratively fitting four intensity distributions (e.g., Gaussian distributions) to the intensity values in the first and the second intensity channels. The four intensity distributions correspond to the four bases A, C, T, and G. In the intensity profile, the intensity values in the first intensity channel are plotted against the intensity values in the second intensity channel (e.g., as a scatterplot), and the intensity values segregate into the four intensity distributions.
- The intensity profiles can take any shape (e.g., trapezoids, squares, rectangles, rhombus, etc.). Additional details about how the four intensity distributions are fitted to the intensity values for base calling can be found in
U.S. Patent Application Publication No. 2018/0274023 A1 , the disclosure of which is incorporated herein by reference in its entirety. - In one implementation, each intensity channel corresponds to one of a plurality of filter wavelength bands used by the optical system. In another implementation, each intensity channel corresponds to one of a plurality of imaging events at a sequencing cycle. In yet another implementation, each intensity channel corresponds to a combination of illumination with a specific laser and imaging through a specific optical filter of the optical system.
- It would be apparent to one skilled in the art that the technology disclosed can be analogously applied to sequencing images generated using one-channel implementation, four-channel implementation, and so on. For example, in the case of four-channel implementation, four channel-specific offset coefficients are determined to correct shift variations in four intensity channels, respectively.
- The inter-cluster intensity profile variation among intensity profiles of a large number (e.g., thousands, millions, billions, etc.) of clusters in the cluster population causes a drop in base calling throughput and an increase in base calling error rate. To correct the inter-cluster intensity profile variation, we disclose a variation correction logic that generates variation correction coefficients on a cluster-by-cluster basis.
- In the two-channel implementation, the variation correction coefficients comprise an amplification coefficient that accounts for scale variation in the inter-cluster intensity profile variation, and two channel-specific offset coefficients that account for shift variation along the first and the second intensity channels in the inter-cluster intensity profile variation, respectively. In another implementation, the shift variation is accounted for by using a common offset coefficient for the different intensity channels (e.g., the first and the second intensity channels).
- The variation correction coefficients for the target cluster are generated at a current sequencing cycle of the sequencing run based on combining analysis of historic intensity statistics determined for the target cluster at preceding sequencing cycles of the sequencing run with analysis of current intensity statistics determined for the target cluster at the current sequencing cycle. The variation correction coefficients are used to correct next intensity readings registered for the target cluster a next sequencing cycle of the sequencing run. The corrected next intensity readings are used to base call the target cluster at the next sequencing cycle. The result of repeatedly applying respective variation correction coefficients to respective intensity profiles of respective clusters at successive sequencing cycles of the sequencing run is that the intensity profiles become coincidental and anchored to the origin 132 (e.g., at the bottom lower corner of the trapezoids).
-
Figure 2 illustrates an example of abase calling pipeline 200 that implements the variation correction logic. - At the current sequencing cycle i, the sequencer generates sequencing
images 202. Thesequencing images 202 containcurrent intensity data 202t registered for the target cluster at the current sequencing cycle i, along with containingcurrent intensity data 202 registered for multiple clusters in the cluster population. The "t" in thecurrent intensity data 202t refers to the target cluster. - The
current intensity data 202t is provided to abase caller 212. Thebase caller 212 processes thecurrent intensity data 202t and generates acurrent base call 222 for the target cluster at the current sequencing cycle i. Examples of thebase caller 212 include Illumina's Real-Time Analysis (RTA) software, Illumina's neural network-based base caller (e.g., described in US Patent Publication No.US 2020/0302297 A1 ), and Illumina's equalizer-based base caller (e.g., described inU.S. Provisional Patent Application No. 63/020,449 - At the current sequencing cycle i, the intensity profile of the target cluster includes the
current intensity data 202t, and current historic intensity data registered for the target cluster at those sequencing cycles of the sequencing run that precede the current sequencing cycle i, i.e., precedingsequencing cycles 1 to i - 1. We collectively refer to thecurrent intensity data 202t and the current historic intensity data as current available intensity data. - In the intensity profile, the four intensity distributions correspond to the four bases A, C, T, and G. In one implementation, the
current base call 222 is made by determining which of the four intensity distributions thecurrent intensity data 202t belongs to. In some implementations, this is accomplished by using an expectation maximization algorithm. The expectation maximization algorithm iteratively maximizes the likelihood of observing means (centroids) and distributions (covariances) that best fit the current available intensity data. - Once the four intensity distributions are determined at the current sequencing cycle i by using the expectation maximization algorithm, the likelihoods of the
current intensity data 202t belonging to each of the four intensity distributions are calculated. The greatest likelihood gives thecurrent base call 222. As an example, consider that "m, n" are the intensity values of thecurrent intensity data 202t in the first and second intensity channels, respectively. The expectation maximization algorithm generates four values that represent the likelihoods of the "m, n" intensity values belonging to each of the four intensity distributions. The maximum of the four values identifies the called base. - In other implementations, a k-means clustering algorithm, a k-means-like clustering algorithm, a histogram based method, and the like can be used for base calling.
- At the next sequencing cycle i + 1, an intensity correction parameters determiner 232 determines
intensity correction parameters 242 for the target cluster based on thecurrent base call 222. In the two-channel implementation, theintensity correction parameters 242 include distribution intensity in the first intensity channel, distribution intensity in the second intensity channel, intensity error in the first intensity channel, intensity error in the second intensity channel, distribution centroid-to-origin distance, and distribution intensity-to-intensity error similarity measure. - We define each of the
intensity correction parameters 242 as follows: - 1) A distribution intensity in the first intensity channel is the intensity value in the first intensity channel at a centroid of a base-specific intensity distribution to which the target cluster belongs at the current sequencing cycle i. Note that the base-specific intensity distribution is the basis for calling the
current base call 222. - 2) A distribution intensity in the second intensity channel is the intensity value in the second intensity channel at the centroid of the base-specific intensity distribution.
- 3) An intensity error in the first intensity channel is the difference between the measured intensity value of the
current intensity data 202t in the first intensity channel and the distribution intensity in the first intensity channel. - 4) An intensity error in the second intensity channel is the difference between the measured intensity value of the
current intensity data 202t in the second intensity channel and the distribution intensity in the second intensity channel. - 5) A distribution centroid-to-origin distance is the Euclidean distance between the centroid of the base-specific intensity distribution and the
origin 132 of themulti-dimensional space 100 in which the base-specific intensity distribution was fitted (e.g., by using the expectation maximization algorithm). In other implementations, distance metrics such as the Mahalanobis distance and the minimum covariance determinant (MCD) distances, and their associated centroid estimators can be used. - 6) A distribution intensity-to-intensity error similarity measure is the summation of channel-wise dot products between the distribution intensities and the intensity errors in the first and second intensity channels.
- An accumulated intensity
correction parameter determiner 252 accumulates theintensity correction parameters 242 with historic accumulatedintensity correction parameters 254 from preceding sequencing cycle i - 1 to determine accumulatedintensity correction parameters 262. Examples of accumulation include summing and averaging. - A variation correction coefficients determiner 272 determines
variation correction coefficients 282 based on the determine accumulatedintensity correction parameters 262. - At the next sequencing cycle i + 1, the sequencer generates sequencing
images 294. Thesequencing images 294 containnext intensity data 294t registered for the target cluster at the next sequencing cycle i + 1, along with containingnext intensity data 294 registered for multiple clusters in the cluster population. The "t" in thenext intensity data 294t refers to the target cluster. - An
intensity corrector 292 applies thevariation correction coefficients 282 to thenext intensity data 294t to generate correctednext intensity data 296t. The "t" in the correctednext intensity data 296t refers to the target cluster. - At the next sequencing cycle i + 1, the intensity profile of the target cluster includes the corrected
next intensity data 296t, and next historic intensity data registered for the target cluster at those sequencing cycles of the sequencing run that precede the next sequencing cycle i + 1, i.e., precedingsequencing cycles 1 to i. We collectively refer to the correctednext intensity data 296t and the next historic intensity data as next available intensity data. - The corrected
next intensity data 296t is provided to thebase caller 212. Thebase caller 212 processes the correctednext intensity data 296t and generates a next base call 298 for the target cluster at the next sequencing cycle i + 1. To generate thenext base call 298, the expectation maximization algorithm observes the means (centroids) and the distributions (covariances) based on the correctednext intensity data 296t to best fit the next available intensity data. - Once the four intensity distributions are determined at the next sequencing cycle i + 1 by using the expectation maximization algorithm, the likelihoods of the corrected
next intensity data 296t belonging to each of the four intensity distributions are calculated. The greatest likelihood gives thenext base call 298. - Note that the
base calling pipeline 200 is executed on a cluster-by-cluster basis and is executed in parallel for the multiple clusters in the cluster population. Also, thebase calling pipeline 200 is executed repeatedly for successive sequencing cycles of the sequencing run (e.g., for successive 150 sequencing cycles ofread 1 and another successive 150 sequencing cycles ofread 2 in a paired-end sequencing run). -
Figure 3 shows a least-squares solution determiner that implements a least-squares solution 300 disclosed herein. The least-squares solution 300 determines closed-form expressions for the accumulatedintensity correction parameters 262 and thevariation correction coefficients 282. The least-squares solution determiner 302 comprises anintensity modeler 312 and aminimizer 322. - The
intensity modeler 312 models the relationship between the measured intensity for the target cluster and thevariation correction coefficients 282 according to the following expression:
- a is the amplification coefficient for the target cluster
- di is the channel-specific offset coefficient for intensity channel i
- xC,i is the distribution intensity in the intensity channel i for the target cluster at the current sequencing cycle C
- yC,i is the measured intensity in the intensity channel i for the target cluster at the current sequencing cycle C
- nC,i is the additive noise in the intensity channel i for the target cluster at the current sequencing cycle C
- The
minimizer 322 uses the least-squares solution 300 to minimize the following expression:
- error f is the error function
- â is the amplification coefficient for the target cluster
- d̂i is the channel-specific offset coefficient for the intensity channel i
- C is the current sequencing cycle
- Using the chain rule, the
minimizer 322 calculates two partial derivatives of the error function with respect to the amplification coefficient â and the channel-specific offset coefficients d̂i . The partial derivatives setEquation 2 to zero to minimize the error function:

- Channel-specific intensity error ec,i is defined as follows:

- The first partial derivative determines a closed-form expression for the amplification coefficient â as follows:

- Closed-form expressions
x 1,x 2,e 1,e 2,xx , andxe for the accumulatedintensity correction parameters 262 recharacterize Equation 9 as follows:



- We define each of the accumulated
intensity correction parameters 262 as follows: - 1) The first accumulated intensity correction parameter
x 1 is the sum of distribution intensities in the first intensity channel measured for the target cluster at each of the precedingsequencing cycles 1 to i - 1, and the current sequencing cycle i. - 2) The second accumulated intensity correction parameter
x 2 is the sum of distribution intensities in the second intensity channel measured for the target cluster at each of the precedingsequencing cycles 1 to i - 1, and the current sequencing cycle i. - 3) The third accumulated intensity correction parameter
e 1 is the sum of intensity errors in the first intensity channel calculated for the target cluster at each of the precedingsequencing cycles 1 to i - 1, and the current sequencing cycle i. - 4) The fourth accumulated intensity correction parameter
e 2 is the sum of intensity errors in the second intensity channel calculated for the target cluster at each of the precedingsequencing cycles 1 to i - 1, and the current sequencing cycle i. - 5) The fifth accumulated intensity correction parameter
xx is the sum of distribution centroid-to-origin distances calculated for the target cluster at each of the precedingsequencing cycles 1 to i - 1, and the current sequencing cycle i. - 6) The sixth accumulated intensity correction parameter
xe is the sum of distribution intensity-to-intensity error similarity measures calculated for the target cluster at each of the precedingsequencing cycles 1 to i - 1, and the current sequencing cycle i. - The second partial derivative determines a closed-form expression for the offset coefficients d̂i as follows:

- Then, for each intensity channel:


- For the first intensity channel, i.e., i = 1:

d̂ 1 is the offset coefficient for the first intensity channel - For the second intensity channel, i.e., i = 2:

d̂ 2 is the offset coefficient for the second intensity channel - Substituting Equations 17 and 18 in Equation 11:


- In another implementation, to reduce the memory requirements per cluster, the common offset coefficient for the different intensity channels (e.g., the first and the second intensity channels) is determined as follows by introducing the constraint d̂ 1 = d̂ 2:


- It would be apparent to one skilled in the art that the least-
squares solution 300 is executed in advance of the sequencing run to determine the closed-form expressions. Once determined, the closed-form expressions are applied to the intensity values generated during the sequencing run on a cluster-by-cluster and iteratively at each sequencing cycle of the sequencing run. - The following discussion focuses on how the six intensity correction parameters, namely, the distribution intensity in the first intensity channel, the distribution intensity in the second intensity channel, the intensity error in the first intensity channel, the intensity error in the second intensity channel, the distribution centroid-to-origin distance, and the distribution intensity-to-intensity error similarity measure are determined for the target cluster at the current sequencing cycle.
- It would be apparent to one skilled in the art that the number of the intensity correction parameters would change depending upon the number of intensity channels. For example, in the case of the four-channel implementation, four channel-specific distribution intensities and four channel-specific intensity errors would be calculated for the four intensity channels, respectively.
-
Figure 4 shows an example 400 of how the channel-specific distribution intensities are measured for the target cluster at the current sequencing cycle i. InFigure 4 , the "" symbol represents the intensity values in the first and the second intensity channels registered for
cluster 1 at the current sequencing cycle i and the precedingsequencing cycles 1 to i - 1. - In
Figure 4 , the fourintensity distributions C 402, A 406, G 462, andT 466 are connected to form theconstellation 102 forcluster 1. InFigure 4 , the "*" symbol represents the measured intensities "m, n" 422 in the first and the second intensity channels registered for thecluster 1 at the current sequencing cycle i. Since the measured intensities "m, n" 422 are closest to centroid 414 of theintensity distribution C 402,cluster 1 belongs to theintensity distribution C 402, and therefore assigned the base call C at the current sequencing cycle i. - Furthermore, since
cluster 1 belongs to theC intensity distribution 402, intensity values "a, b" at thecentroid 414 are the distribution intensities forcluster 1 at the current sequencing cycle i. Also, "a" is the channel-specific distribution intensity for the first intensity channel, and "b" is the channel-specific distribution intensity for the second intensity channel. -
Figure 5 shows an example 500 of how the channel-specific intensity errors are calculated for the target cluster at the current sequencing cycle i. The intensity error (er 1) 532 in the first intensity channel is calculated forcluster 1 at the current sequencing cycle i as a difference between the channel-specific measured intensity in the first intensity channel (m) and the channel-specific distribution intensity in the first intensity channel (a):
- The intensity error (
er 2) 502 in the second intensity channel is calculated forcluster 1 at the current sequencing cycle i as a difference between the channel-specific measured intensity in the second intensity channel (n) and the channel-specific distribution intensity in the second intensity channel (b):
-
Figure 6 shows an example 600 of how the distribution centroid-to-origin distances are calculated for the target cluster at the current sequencing cycle i.Cluster 1 belongs to theC intensity distribution 402, and the intensity values "a, b" at thecentroid 414 are the distribution intensities forcluster 1 at the current sequencing cycle i. - The distribution centroid-to-origin distance is calculated for
cluster 1 at the current sequencing cycle i as the Euclidean distance (d) 652 between thecentroid 414 and theorigin 132 "x, y":
- The distribution intensity-to-intensity error similarity measure is calculated for
cluster 1 at the current sequencing cycle i as a summation of channel-wise dot products between the channel-specific distribution intensities and the channel-specific intensity errors:
- is the dot product operator
-
Figure 7 depicts another example of a base calling pipeline 700 that implements the variation correction logic. Consider that the current sequencing cycle i is the twenty-fifth sequencing cycle of the sequencing run, i.e., i = 25. The preceding sequencing cycle i - 1 is the twenty-fourth sequencing cycle of the sequencing run, i.e., i - 1 = 24. The next sequencing cycle i + 1 is the twenty-sixth sequencing cycle of the sequencing run, i.e., i + 1 = 26. The subsequent sequencing cycle i + 2 is the twenty-seventh sequencing cycle of the sequencing run, i.e., i + 2 = 27. - At each of the first to the twenty-fourth sequencing cycles, respective sets of accumulated intensity correction parameters are determined from respective sets of intensity correction parameters. Preceding accumulated intensity correction parameters 702 for the target cluster are intensity correction parameter-wise accumulations of the twenty four sets of the intensity correction parameters. In the two-channel implementation, each of the twenty four sets of the intensity correction parameters includes the six intensity correction parameters, namely, the distribution intensity in the first intensity channel, the distribution intensity in the second intensity channel, the intensity error in the first intensity channel, the intensity error in the second intensity channel, the distribution centroid-to-origin distance, and the distribution intensity-to-intensity error similarity. Each of the twenty four sets of the accumulated intensity correction parameters includes the six accumulated intensity correction parameters
x 1,x 2,e 1,e 2,xx , and xe. - The preceding accumulated intensity correction parameters 702 are metadata (or statistics) about the underlying preceding intensity values and preceding intensity correction parameters from which they are calculated. As a result, compared to the underlying preceding intensity values and the preceding intensity correction parameters, the preceding accumulated intensity correction parameters 702 have a much smaller memory footprint. The preceding accumulated intensity correction parameters 702 are cached in memory during the sequencing run and are accumulated with current intensity correction parameters 732 for the target cluster to generate current accumulated intensity correction parameters 742 for the target cluster, as depicted by
triangle 734. - In one implementation, the preceding accumulated intensity correction parameters 702 are stored in a quantized fixed bit width format. For example, one or two bytes can be used to store each preceding accumulated intensity correction parameter in the preceding accumulated intensity correction parameters 702.
- Current measured intensity 712 for the target cluster includes the intensity values registered for the target cluster at the twenty-fifth sequencing cycle. Based on the current measured intensity 712, a current base call 722 is called for the target cluster at the twenty-fifth sequencing cycle (e.g., by using the expectation maximization algorithm).
- Based on the current base call 722, the current intensity correction parameters 732 are determined for the target cluster. The current accumulated intensity correction parameters 742 are calculated for the target cluster based on accumulating the preceding accumulated intensity correction parameters 702 with the current intensity correction parameters 732, as depicted by the
triangle 734. One example of the accumulation is summing. In the summing implementation, the current accumulated intensity correction parameters 742 are calculated by summing the preceding accumulated intensity correction parameters 702 and the current intensity correction parameters 732 on an intensity correction parameter-basis (as shown above inIntermediate Terms 1 to 6). - Another example of the accumulation is averaging:


- Based on the Intermediate Terms 1.2 to 6.2, we define each of the accumulated intensity correction parameters as follows:
- 1) The first accumulated intensity correction parameter
x 1 is the average of the distribution intensities in the first intensity channel measured for the target cluster at each of the precedingsequencing cycles 1 to i - 1, and the current sequencing cycle i. - 2) The second accumulated intensity correction parameter
x 2 is the average of the distribution intensities in the second intensity channel measured for the target cluster at each of the precedingsequencing cycles 1 to i - 1, and the current sequencing cycle i. - 3) The third accumulated intensity correction parameter
e 1 is the average of the intensity errors in the first intensity channel calculated for the target cluster at each of the precedingsequencing cycles 1 to i - 1, and the current sequencing cycle i. - 4) The fourth accumulated intensity correction parameter
e 2 is the average of the intensity errors in the second intensity channel calculated for the target cluster at each of the precedingsequencing cycles 1 to i - 1, and the current sequencing cycle i. - 5) The fifth accumulated intensity correction parameter
xx is the average of the distribution centroid-to-origin distances calculated for the target cluster at each of the precedingsequencing cycles 1 to i - 1, and the current sequencing cycle i. - 6) The sixth accumulated intensity correction parameter xe is the average of the distribution intensity-to-intensity error similarity measures calculated for the target cluster at each of the preceding
sequencing cycles 1 to i - 1, and the current sequencing cycle i. - In one implementation, the preceding accumulated intensity correction parameters 702 are stored in a compact representation (e.g., a summed representation or an averaged representation). In the averaging implementation, the preceding accumulated intensity correction parameters 702 are stored in their averaged representation and first multiplied by the number of sequencing cycles over which they are accumulated to retrieve the pre-average representation, i.e., 24 is the multiplier in the example discussed herein.
- Then, the result of the multiplication, i.e., the pre-average representation is summed with the current intensity correction parameters 732 on the intensity correction parameter-basis. Then, the result of the sum is divided by the index C for the current sequencing cycle i (C = 25) to determine the current accumulated intensity correction parameters 742.
- Consider that


- Consider that


- Consider that


- Consider that


- Consider that
xx 24 is the fifth accumulated intensity correction parameter for the twenty-fourth sequencing cycle. Consider that
xx 25 is the fifth accumulated intensity correction parameter for the twenty-fifth sequencing cycle and used to correct the measured intensity for the twenty-sixth sequencing cycle. Then,
- Consider that
xe 24 is the sixth accumulated intensity correction parameter for the twenty-fourth sequencing cycle. Consider that
xe 25 is the sixth accumulated intensity correction parameter for the twenty-fifth sequencing cycle and used to correct the measured intensity for the twenty-sixth sequencing cycle. Then,
- The current accumulated intensity correction parameters 742 are metadata (or statistics) about the current measured intensity 712 and the current intensity correction parameters 732. As a result, compared to the current measured intensity 712 and the current intensity correction parameters 732, the current accumulated intensity correction parameters 742 have a much smaller memory footprint. The current accumulated intensity correction parameters 742 are cached in memory during the sequencing run and are accumulated with next intensity correction parameters 794 for the target cluster to generate next accumulated intensity correction parameters 796 for the target cluster, as depicted by
triangle 784. - In one implementation, the current accumulated intensity correction parameters 742 are stored in a quantized fixed bit width format. For example, one or two bytes can be used to store each preceding accumulated intensity correction parameter in the current accumulated intensity correction parameters 742.
- The current accumulated intensity correction parameters 742 are used to determine a current amplification coefficient 752 for the target cluster. This includes executing the closed-form expression in Equation 23 in dependence upon the current accumulated intensity correction parameters 742.
- The current accumulated intensity correction parameters 742 and the current amplification coefficient 752 are used to determine current channel-specific offset coefficients 762 for the target cluster. This includes executing the closed-form expressions in Equations 17 and 18 in dependence upon the current accumulated intensity correction parameters 742 and the amplification coefficient 752.
- The current amplification coefficient 752 and the current channel-specific offset coefficients 762 are used to correct a next measured intensity 772 measured for the target cluster at the twenty-sixth sequencing cycle. In one implementation, the correcting includes channel-wise subtracting the current channel-specific offset coefficients 762 from the next measured intensity 772 to generate next shifted intensity, and dividing the next shifted intensity by the current amplification coefficient 752 to generate next corrected measured intensity 782 for the target cluster.
- Then, a next base call 792 is called for the target cluster at the twenty-sixth sequencing cycle using the next corrected measured intensity 782. This is accomplished by providing the next corrected measured intensity 782 as input to the base caller 212 (e.g., by using the expectation maximization algorithm).
- A controller (not shown) iterates the base calling pipeline 700 for successive sequencing cycles of the sequencing run, as exemplified by operations 794, 796, 798, and 799. For example, for the twenty-seventh sequencing cycle, the current accumulated intensity correction parameters 742 serve as the preceding accumulated intensity correction parameters 702, as depicted by
triangle 784. Note that the base calling pipeline 700 is executed on a cluster-by-cluster basis and is executed in parallel for the multiple clusters in the cluster population. -
Figure 8 shows one implementation of aweighting function 800 described herein. Since the least-squares solution 300 can take several sequencing cycles to converge, theweighting function 800 is used to attenuate the variation correction coefficients in initial sequencing cycles of the sequencing run, and to amplify the variation correction coefficients in later sequencing cycles of the sequencing run. - The
weighting function 800 works as follows. First, aninitial amplification coefficient 802 and initial offsetcoefficients initial amplification coefficient 802 is initialized at a first sequencing cycle of the sequencing run with a predetermined value (e.g., "1") and the initial offsetcoefficients weighting function 800 combines (e.g., sums) theinitial amplification coefficient 802 with the amplification coefficients 806 (determined by the least-squares solution 300), and combines the initial first and second offsetcoefficients coefficients 826 and 836 (determined by the least-squares solution 300), such that theamplification coefficient 806 and the first and second offsetcoefficients - In one implementation, the
weighting function 800 applies (e.g., multiplies) an initial minimum weight (inimin weight) 804 to theinitial amplification coefficient 802 and the initial first and second offsetcoefficients amplification coefficient 806 and the first and second offsetcoefficients 

- c is an index of the current sequencing cycle
- p is a number between 2 to 7
- For the first sequencing cycle, i.e., c = 1, and for p = 2, the expression

lsqmax weight 808 selects the maximum of the two values, i.e., 0. The expression (
inimin weight 804 selects the minimum of the two values, i.e., 1. - Continuing ahead, 0 from the
lsqmax weight 808 is be multiplied with theamplification coefficient 806 and the first and second offsetcoefficients inimin weight 804 is multiplied with theinitial amplification coefficient 802 and the initial first and second offsetcoefficients weighted amplification coefficient 810 and the weighted first and second offsetcoefficients - As the sequencing run progresses and the value of the index "c" increments, and the values of the
lsqmax weight 808 and theinimin weight 804 also change and applied analogously, such that theamplification coefficient 806 and the first and second offsetcoefficients 826 and 836 (learned from the least-squares solution 300) are progressively amplified at each successive sequencing cycle. - The
weighting function 800 generates theweighted amplification coefficient 810 and the weighted first and second offsetcoefficients 


W is the weight -
Figure 9 shows one implementation of directly applyingmaximum likelihood weights maximum likelihood weights maximum likelihood solution 900 toprobability distributions 902 of historical values observed for the variation correction coefficients in previous sequencing runs.Figure 9 also illustrates accumulatedintensity correction parameters 904. - The
maximum likelihood weights maximum likelihood weights maximum likelihood weights maximum likelihood solution 900 or can be user-specified. The sigma terms for the amplification coefficient, the channel-specific offset coefficients, and the additive noise are determined on a sequencing run-basis and kept fixed for all the sequencing cycles of the sequencing run. The sigma terms incorporate apriori knowledge about the uncertainty observed in the variation correction coefficients. - Some example values of the sigma terms are:
- 'ml_chanest_sigma_a', 0.15
- 'ml_chanest_sigma d1', 0.1
- 'ml_chanest_sigma_d2', 0.02
- 'ml_chanest_sigma_n', 0.14
- In one implementation, a center/initial/mean value for the probability distribution of the amplification coefficient is set to be "1," and a center/initial/mean value for the probability distributions of the channel-specific offset coefficients is set to be "0."
- Smaller values of the sigma terms for the amplification coefficient and the channel-specific offset coefficients in the
maximum likelihood weights maximum likelihood weights weighted amplification coefficient 920 that is weighted in favor of thecenter value 1, and weighted channel-specific offsetcoefficients - Conversely, larger values of the sigma terms for the amplification coefficient and the channel-specific offset coefficients in the
maximum likelihood weights maximum likelihood weights weighted amplification coefficient 920 that is weighted in favor of the output of the least-squares solution 300 (e.g., Equation 23), and the weighted channel-specific offsetcoefficients - The
maximum likelihood weights weighted amplification coefficient 920 and the weighted channel-specific offsetcoefficients -
Figure 10 shows one implementation of applying an exponential decay factor to the variation correction coefficients.Exponential decay logic 1000 is based on so-called "tau" and "stats.cycle." The term "stats.cycle" refers to the current sequencing cycle. - Tau is set to a predetermined value depending on the degree of time variance observed in the intensity correction parameters. If the intensity correction parameters are time-invariant, then tau can be set to infinity. If the intensity correction parameters are rapidly time-variant, then tau can be set to a small value. In one implementation, tau is set to thirty-two.
- Consider that tau is thirty-two. Then, according to
statements statement 1008. The exponential decay character comes from the fact that, instatements
For sequencing cycle 32, decay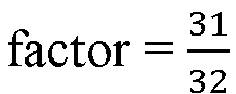




- In
Figure 10 , the accumulated intensity correction parameters are accumulated using the sum operation. In the averaging implementation of the exponential decay factor, the accumulated intensity correction parameters are accumulated using the average operation. In the averaging implementation of the exponential decay factor, the divisor "C" in the Intermediate Terms 1.2 to 6.2 is kept fixed after the tau number of sequencing cycles of the sequencing run, i.e., after thirty-second sequencing cycle of the sequencing run. - In some implementations, the weighted least-squares solution (
Figure 8 ), the maximum likelihood solution (Figure 9 ), and the exponential decay factor solution (Figure 10 ) are combined to generate weighted variation correction coefficients at each sequencing cycle of the sequencing run. -
Figure 11 shows another implementation of determining the channel-specific offset coefficients. In the two-channel implementation, a first channel-specific offset coefficient ("Δx") for the first intensity channel and for the target cluster at the current sequencing cycle is calculated as a difference between the measured intensity ("p") in the first intensity channel for the target cluster at the current sequencing cycle and the intensity value ("u") in the first intensity channel at acentroid 1104 of a base-specific intensity distribution A 1102 to which the target cluster belongs at the current sequencing cycle (e.g., as determined by the expectation maximization algorithm). - In the two-channel implementation, a second channel-specific offset coefficient ("Δy") for the second intensity channel and for the target cluster at the current sequencing cycle is calculated as a difference between the measured intensity ("q") in the second intensity channel for the target cluster at the current sequencing cycle and the intensity value ("v") in the second intensity channel at the
centroid 1104 of the base-specific intensity distribution A 1102 to which the target cluster belongs at the current sequencing cycle. - In one implementation, the first channel-specific offset coefficient ("Δx") and the second channel-specific offset coefficient ("Δy") are determined at each sequencing cycle of the sequencing run. In some implementations, after a configurable number of sequencing cycles (e.g., ten or twenty sequencing cycles), the first channel-specific offset coefficient ("Δx") and the second channel-specific offset coefficient ("Δy") are initialized with a predetermined value (e.g., "0").
- In a rolling-average implementation, an average is calculated for the first offset channel-specific coefficient ("Δx") and the second channel-specific offset coefficient ("Δy") after the configurable number of sequencing cycles. The average is then used as a substitute for the first offset channel-specific coefficient ("Δx") and the second channel-specific offset coefficient ("Δy") until the next average is calculated for the next set of the configurable number of sequencing cycles.
- In some implementations, the first channel-specific offset coefficient ("Δx") and the second channel-specific offset coefficient ("Δy") are calculated only when the target cluster belongs to the A, C, and T base-specific intensity distributions, and not when the target cluster belongs to the G (dark) base-specific intensity distribution. In implementations when the sequencing run involves pair-ended reads, the first channel-specific offset coefficient ("Δx") and the second channel-specific offset coefficient ("Δy") are initialized for the second read with the values available at the end of the first read, but updated thereafter each set of the configurable number of sequencing cycles.
-
Figures 12 ,13 , and14 compare performance of three approaches, namely, a scaling-only solution, an offsets-only solution (discussed inFigure 11 ), and the least-squares solution 300. The three approaches are applied to intensity data generated using Illumina's Real-Time Analysis (RTA) software over twenty datasets from Illumina's sequencer NextSeq 2000. - In
Figure 12 , the performance of the scaling-only solution (blue), the offsets-only solution (orange), and the least-squares solution (grey) are comparatively plotted for the percentage of clusters passing the RTA's two-channel chastity filter. The comparison is done over the twenty datasets (shown as the x-axis). While all three approaches achieve >65% of clusters passing the two-channel chastity filter, 16 out of 20 cases (80%) score higher than 75% passing rate and 8/20 (or 20%) score >80% passing rate. Note that the least-squares solution 300 performs the best. - In
Figure 13 , the performance of the scaling-only solution (blue), the offsets-only solution (orange), and the least-squares solution (grey) are comparatively plotted for the error rates in low-diversity samples. The comparison is done over twenty low-diversity datasets spiked with a known phage genome (PhiX) (shown as the x-axis). Seventeen out of twenty (17/20 or 68%) achieve <35% error rate, while majority enjoy lower than 25% error rates. Note that the least-squares solution 300 performs the best. - In
Figure 14 , the performance of the scaling-only solution (blue), the offsets-only solution (orange), and the least-squares solution (grey) are comparatively plotted for the percentage of sequencing data have quality scores above Q30 (i.e. base call error < 10-30/10 or 0.1%). The comparison is done over the same twenty datasets (shown as the x-axis). While all three approaches enjoy high Q30 quality score (e.g. >80%), 16 out of 20 cases (80%) score higher than 75% passing rate and 8/20 (or 20%) score >80% passing rate. Note that the least-squares solution 300 outperforms the others by >2% points. -
Figure 15 is acomputer system 1500 that can be used to implement the technology disclosed.Computer system 1500 includes at least one central processing unit (CPU) 1572 that communicates with a number of peripheral devices via bus subsystem 1555. These peripheral devices can include astorage subsystem 1510 including, for example, memory devices and afile storage subsystem 1536, user interface input devices 1538, user interface output devices 1576, and anetwork interface subsystem 1574. The input and output devices allow user interaction withcomputer system 1500.Network interface subsystem 1574 provides an interface to outside networks, including an interface to corresponding interface devices in other computer systems. - In one implementation, the least-
squares solution determiner 302 is communicably linked to thestorage subsystem 1510 and the user interface input devices 1538. - User interface input devices 1538 can include a keyboard; pointing devices such as a mouse, trackball, touchpad, or graphics tablet; a scanner; a touch screen incorporated into the display; audio input devices such as voice recognition systems and microphones; and other types of input devices. In general, use of the term "input device" is intended to include all possible types of devices and ways to input information into
computer system 1500. - User interface output devices 1576 can include a display subsystem, a printer, a fax machine, or non-visual displays such as audio output devices. The display subsystem can include an LED display, a cathode ray tube (CRT), a flat-panel device such as a liquid crystal display (LCD), a projection device, or some other mechanism for creating a visible image. The display subsystem can also provide a non-visual display such as audio output devices. In general, use of the term "output device" is intended to include all possible types of devices and ways to output information from
computer system 1500 to the user or to another machine or computer system. -
Storage subsystem 1510 stores programming and data constructs that provide the functionality of some or all of the modules and methods described herein. These software modules are generally executed byprocessors 1578. -
Processors 1578 can be graphics processing units (GPUs), field-programmable gate arrays (FPGAs), application-specific integrated circuits (ASICs), and/or coarse-grained reconfigurable architectures (CGRAs).Processors 1578 can be hosted by a deep learning cloud platform such as Google Cloud Platform™, Xilinx™, and Cirrascale™. Examples ofprocessors 1578 include Google's Tensor Processing Unit (TPU)™, rackmount solutions like GX4 Rackmount Series™, GX15 Rackmount Series™, NVIDIA DGX-1™, Microsoft' Stratix V FPGA™, Graphcore's Intelligent Processor Unit (IPU)™, Qualcomm's Zeroth Platform™ with Snapdragon processors™, NVIDIA's Volta™, NVIDIA's DRIVE PX™, NVIDIA's JETSON TX1/TX2 MODULE™, Intel's Nirvana™, Movidius VPU™, Fujitsu DPI™, ARM's DynamicIQ™, IBM TrueNorth™, Lambda GPU Server with Testa V100s™, and others. -
Memory subsystem 1522 used in thestorage subsystem 1510 can include a number of memories including a main random access memory (RAM) 1532 for storage of instructions and data during program execution and a read only memory (ROM) 1534 in which fixed instructions are stored. Afile storage subsystem 1536 can provide persistent storage for program and data files, and can include a hard disk drive, a floppy disk drive along with associated removable media, a CD-ROM drive, an optical drive, or removable media cartridges. The modules implementing the functionality of certain implementations can be stored byfile storage subsystem 1536 in thestorage subsystem 1510, or in other machines accessible by the processor. - Bus subsystem 1555 provides a mechanism for letting the various components and subsystems of
computer system 1500 communicate with each other as intended. Although bus subsystem 1555 is shown schematically as a single bus, alternative implementations of the bus subsystem can use multiple busses. -
Computer system 1500 itself can be of varying types including a personal computer, a portable computer, a workstation, a computer terminal, a network computer, a television, a mainframe, a server farm, a widely-distributed set of loosely networked computers, or any other data processing system or user device. Due to the ever-changing nature of computers and networks, the description ofcomputer system 1500 depicted inFigure 15 is intended only as a specific example for purposes of illustrating the preferred implementations of the present invention. Many other configurations ofcomputer system 1500 are possible having more or less components than the computer system depicted inFigure 15 . - Each of the processors or modules discussed herein may include an algorithm (e.g., instructions stored on a tangible and/or non-transitory computer readable storage medium) or sub-algorithms to perform particular processes. The
variation corrector 232 is illustrated conceptually as a collection of modules, but may be implemented utilizing any combination of dedicated hardware boards, DSPs, processors, etc. Alternatively, thevariation corrector 232 may be implemented utilizing an off-the-shelf PC with a single processor or multiple processors, with the functional operations distributed between the processors. As a further option, the modules described below may be implemented utilizing a hybrid configuration in which certain modular functions are performed utilizing dedicated hardware, while the remaining modular functions are performed utilizing an off-the-shelf PC and the like. The modules also may be implemented as software modules within a processing unit. - Various processes and steps of the methods set forth herein (e.g.,
Figure 9 ) can be carried out using a computer. The computer can include a processor that is part of a detection device, networked with a detection device used to obtain the data that is processed by the computer or separate from the detection device. In some implementations, information (e.g., image data) may be transmitted between components of a system disclosed herein directly or via a computer network. A local area network (LAN) or wide area network (WAN) may be a corporate computing network, including access to the Internet, to which computers and computing devices comprising the system are connected. In one implementation, the LAN conforms to the transmission control protocol/internet protocol (TCP/IP) industry standard. In some instances, the information (e.g., image data) is input to a system disclosed herein via an input device (e.g., disk drive, compact disk player, USB port etc.). In some instances, the information is received by loading the information, e.g., from a storage device such as a disk or flash drive. - A processor that is used to run an algorithm or other process set forth herein may comprise a microprocessor. The microprocessor may be any conventional general purpose single- or multi-chip microprocessor such as a Pentium™ processor made by Intel Corporation. A particularly useful computer can utilize an Intel Ivybridge dual-12 core processor, LSI raid controller, having 128 GB of RAM, and 2 TB solid state disk drive. In addition, the processor may comprise any conventional special purpose processor such as a digital signal processor or a graphics processor. The processor typically has conventional address lines, conventional data lines, and one or more conventional control lines.
- The implementations disclosed herein may be implemented as a method (e.g.,
Figures 2 and7 ), apparatus, system or article of manufacture using standard programming or engineering techniques to produce software, firmware, hardware, or any combination thereof. The term "article of manufacture" as used herein refers to code or logic implemented in hardware or computer readable media such as optical storage devices, and volatile or non-volatile memory devices. Such hardware may include, but is not limited to, field programmable gate arrays (FPGAs), application-specific integrated circuits (ASICs), complex programmable logic devices (CPLDs), programmable logic arrays (PLAs), microprocessors, or other similar processing devices. In particular implementations, information or algorithms set forth herein are present in non-transient storage media. - In particular implementations, a computer-implemented method set forth herein (e.g., (discussed in
Figure 11 )) can occur in real time while multiple images of an object are being obtained. Such real time analysis is particularly useful for nucleic acid sequencing applications wherein an array of nucleic acids is subjected to repeated cycles of fluidic and detection steps. Analysis of the sequencing data can often be computationally intensive such that it can be beneficial to perform the methods set forth herein in real time or in the background while other data acquisition or analysis algorithms are in process. Example real time analysis methods that can be used with the present methods are those used for the MiSeq and HiSeq sequencing devices commercially available from Illumina, Inc. (San Diego, Calif.) and/or described inUS Pat. App. Pub. No. 2012/0020537 A1 , which is incorporated herein by reference. - In this application, the terms "cluster", "well", "sample", "analyte," and "fluorescent sample" are interchangeable because a well contains a corresponding cluster/sample/analyte/fluorescent sample. As defined herein, "sample" and its derivatives, is used in its broadest sense and includes any specimen, culture and the like that is suspected of including a target. In some implementations, the sample comprises DNA, RNA, PNA, LNA, chimeric or hybrid forms of nucleic acids. The sample can include any biological, clinical, surgical, agricultural, atmospheric, or aquatic-based specimen containing one or more nucleic acids. The term also includes any isolated nucleic acid sample such a genomic DNA, fresh-frozen or formalin-fixed paraffin-embedded nucleic acid specimen. It is also envisioned that the sample can be from a single individual, a collection of nucleic acid samples from genetically related members, nucleic acid samples from genetically unrelated members, nucleic acid samples (matched) from a single individual such as a tumor sample and normal tissue sample, or sample from a single source that contains two distinct forms of genetic material such as maternal and fetal DNA obtained from a maternal subject, or the presence of contaminating bacterial DNA in a sample that contains plant or animal DNA. In some implementations, the source of nucleic acid material can include nucleic acids obtained from a newborn, for example as typically used for newborn screening.
- The nucleic acid sample can include high molecular weight material such as genomic DNA (gDNA). The sample can include low molecular weight material such as nucleic acid molecules obtained from FFPE or archived DNA samples. In another implementation, low molecular weight material includes enzymatically or mechanically fragmented DNA. The sample can include cell-free circulating DNA. In some implementations, the sample can include nucleic acid molecules obtained from biopsies, tumors, scrapings, swabs, blood, mucus, urine, plasma, semen, hair, laser capture micro-dissections, surgical resections, and other clinical or laboratory obtained samples. In some implementations, the sample can be an epidemiological, agricultural, forensic, or pathogenic sample. In some implementations, the sample can include nucleic acid molecules obtained from an animal such as a human or mammalian source. In another implementation, the sample can include nucleic acid molecules obtained from a non-mammalian source such as a plant, bacteria, virus, or fungus. In some implementations, the source of the nucleic acid molecules may be an archived or extinct sample or species.
- Further, the methods and compositions disclosed herein may be useful to amplify a nucleic acid sample having low-quality nucleic acid molecules, such as degraded and/or fragmented genomic DNA from a forensic sample. In one implementation, forensic samples can include nucleic acids obtained from a crime scene, nucleic acids obtained from a missing persons DNA database, nucleic acids obtained from a laboratory associated with a forensic investigation or include forensic samples obtained by law enforcement agencies, one or more military services or any such personnel. The nucleic acid sample may be a purified sample or a crude DNA containing lysate, for example derived from a buccal swab, paper, fabric, or other substrate that may be impregnated with saliva, blood, or other bodily fluids. As such, in some implementations, the nucleic acid sample may comprise low amounts of, or fragmented portions of DNA, such as genomic DNA. In some implementations, target sequences can be present in one or more bodily fluids including but not limited to, blood, sputum, plasma, semen, urine, and serum. In some implementations, target sequences can be obtained from hair, skin, tissue samples, autopsy, or remains of a victim. In some implementations, nucleic acids including one or more target sequences can be obtained from a deceased animal or human. In some implementations, target sequences can include nucleic acids obtained from non-human DNA such a microbial, plant or entomological DNA. In some implementations, target sequences or amplified target sequences are directed to purposes of human identification. In some implementations, the disclosure relates generally to methods for identifying characteristics of a forensic sample. In some implementations, the disclosure relates generally to human identification methods using one or more target specific primers disclosed herein or one or more target specific primers designed using the primer design criteria outlined herein. In one implementation, a forensic or human identification sample containing at least one target sequence can be amplified using any one or more of the target-specific primers disclosed herein or using the primer criteria outlined herein.
- The technology disclosed generates variation correction coefficients to correct inter-cluster intensity profile variation in image data. The technology disclosed can be practiced as a system, method, or article of manufacture. One or more features of an implementation can be combined with the base implementation. Implementations that are not mutually exclusive are taught to be combinable. One or more features of an implementation can be combined with other implementations. This disclosure periodically reminds the user of these options. Omission from some implementations of recitations that repeat these options should not be taken as limiting the combinations taught in the preceding sections - these recitations are hereby incorporated forward by reference into each of the following implementations.
- Other implementations of the method described in this section can include a non-transitory computer readable storage medium storing instructions executable by a processor to perform any of the methods described above. Yet another implementation of the method described in this section can include a system including memory and one or more processors operable to execute instructions, stored in the memory, to perform any of the methods described above.
- In another implementation, the variation correction is performed on non-intensity data, such as on pH changes induced by the release of hydrogen ions during molecule extension. The pH changes are detected and converted to a voltage change that is proportional to the number of bases incorporated (e.g., in the case of Ion Torrent).
- In yet another implementation, the non-intensity data is constructed from nanopore sensing that uses biosensors to measure the disruption in current as an analyte passes through a nanopore or near its aperture while determining the identity of the base. For example, the Oxford Nanopore Technologies (ONT) sequencing is based on the following concept: pass a single strand of DNA (or RNA) through a membrane via a nanopore and apply a voltage difference across the membrane. The nucleotides present in the pore will affect the pore's electrical resistance, so current measurements over time can indicate the sequence of DNA bases passing through the pore. This electrical current signal (the 'squiggle' due to its appearance when plotted) is the raw data gathered by an ONT sequencer. These measurements are stored as 16-bit integer data acquisition (DAC) values, taken at 4kHz frequency (for example). With a DNA strand velocity of ~450 base pairs per second, this gives approximately nine raw observations per base on average. This signal is then processed to identify breaks in the open pore signal corresponding to individual reads. These stretches of raw signal are base called - the process of converting DAC values into a sequence of DNA bases. In some implementations, the non-intensity data comprises normalized or scaled DAC values.
- One or more implementations of the technology disclosed, or elements thereof can be implemented in the form of a computer product including a non-transitory computer readable storage medium with computer usable program code for performing the method steps indicated. Furthermore, one or more implementations of the technology disclosed, or elements thereof can be implemented in the form of an apparatus including a memory and at least one processor that is coupled to the memory and operative to perform exemplary method steps. Yet further, in another aspect, one or more implementations of the technology disclosed or elements thereof can be implemented in the form of means for carrying out one or more of the method steps described herein; the means can include (i) hardware module(s), (ii) software module(s) executing on one or more hardware processors, or (iii) a combination of hardware and software modules; any of (i)-(iii) implement the specific techniques set forth herein, and the software modules are stored in a computer readable storage medium (or multiple such media).
- This application uses the terms "accumulated intensity correction parameter(s)" and "intermediate term(s)" interchangeably.
- This application uses the terms "pure intensity/intensities" and "distribution intensity/intensities" interchangeably.
- This application uses the terms "intensity profile(s)" and "constellation(s)" interchangeably.
- This application uses the terms "variation correction coefficient(s)" and "intensity correction coefficient(s)" interchangeably.
- This application uses the terms "amplification coefficient" and "scaling factor" interchangeably.
- This application uses the terms "offset coefficient(s)" and "offset(s)" interchangeably.
- This application uses the terms "target cluster" and "particular cluster" interchangeably.
- This application uses the terms "next," "subsequent," and "successive" interchangeably.
- This application uses the terms "nucleotide(s)" and "base(s)" interchangeably.
- This application uses the terms "accumulated intensity correction parameter determiner" and "accumulator" interchangeably.
- This application uses the terms "accumulated intensity correction parameter determiner" and "accumulator" interchangeably.
-
- 1. A computer-implemented method of base calling a target cluster, the method including:
for the target cluster,- reading current channel-specific intensities registered for a current sequencing cycle of a sequencing run from a base-specific intensity distribution to which the target cluster is base called at the current sequencing cycle,
- reading current channel-specific distribution intensities from a centroid of the base-specific intensity distribution,
- determining a set of current intensity correction parameters for the current sequencing cycle based on the current channel-specific intensities and the current channel-specific distribution intensities,
- determining a set of current accumulated intensity correction parameters for the current sequencing cycle by accumulating the set of current intensity correction parameters and a set of preceding accumulated intensity correction parameters for a preceding sequencing cycle of the sequencing run,
- determining a current amplification coefficient and current channel-specific offset coefficients for the current sequencing cycle based on the set of current accumulated intensity correction parameters, and
- using the current amplification coefficient and the current channel-specific offset coefficients to correct next channel-specific intensities registered for a next sequencing cycle of the sequencing run and generate corrected next channel-specific intensities for the next sequencing cycle; and
- base calling the target cluster at the next sequencing cycle based on the corrected next channel-specific intensities.
- 2. The computer-implemented method of
clause 1, wherein the set of current intensity correction parameters includes the current channel-specific distribution intensities, current channel-specific intensity errors, current distribution centroid-to-origin distance, and current distribution intensity-to-intensity error similarity measure. - 3. The computer-implemented method of
clause 2, wherein the current channel-specific intensity errors are channel-wise differences between the current channel-specific intensities and the current channel-specific distribution intensities. - 4. The computer-implemented method of
clause 2, wherein the current distribution centroid-to-origin distance is Euclidean distance between the centroid and an origin of a multi-dimensional space that contains the base-specific intensity distribution. - 5. The computer-implemented method of clause 4, wherein the multi-dimensional space is at least one of a cartesian space, a polar space, a cylindrical space, and a spherical space.
- 6. The computer-implemented method of
clause 2, wherein the current distribution intensity-to-intensity error similarity measure is a summation of channel-wise dot products between the current channel-specific distribution intensities and the current channel-specific intensity errors. - 7. The computer-implemented method of
clause 1, wherein the set of current accumulated intensity correction parameters are intensity correction parameter-wise sums of current intensity correction parameters in the set of current intensity correction parameters and preceding accumulated intensity correction parameters in the set of preceding accumulated intensity correction parameters. - 8. The computer-implemented method of clause 7, wherein the set of current accumulated intensity correction parameters are intensity correction parameter-wise averages of the current intensity correction parameters and the preceding accumulated intensity correction parameters.
- 9. The computer-implemented method of
clause 1, wherein the set of preceding accumulated intensity correction parameters and the set of current accumulated intensity correction parameters are stored in a quantized fixed bit width format. - 10. The computer-implemented method of
clause 1, wherein the current channel-specific offset coefficients are configured to be same. - 11. The computer-implemented method of clause 10, wherein current accumulated intensity correction parameters in the set of current accumulated intensity correction parameters include a first common current accumulated intensity correction parameter for the current channel-specific distribution intensities, and a second common current accumulated intensity correction parameter for the current channel-specific intensity errors.
- 12. The computer-implemented method of
clause 1, wherein the current channel-specific offset coefficients are channel-wise subtracted from the next channel-specific intensities to generate next channel-specific shifted intensities, and the next channel-specific shifted intensities are divided by the current amplification coefficient to generate the corrected next channel-specific intensities. - 13. The computer-implemented method of
clause 1, further including using a weighting function to combine an initial amplification coefficient with the current amplification coefficient, and initial channel-specific offset coefficients with the current channel-specific offset coefficients to generate a weighted current amplification coefficient and weighted current channel-specific offset coefficients for the current sequencing cycle. - 14. The computer-implemented method of clause 13, wherein the weighting function applies a minimum weight (wmin) to initial amplification coefficient and the initial channel-specific offset coefficients, and a maximum weight (wmax) to the current amplification coefficient and the current channel-specific offset coefficients, wherein wmin = (1 - wmax).
- 15. The computer-implemented method of clause 14, wherein the maximum weight (wmax) is defined as (c-p)/c, where c is an index for the current sequencing cycle and p is a number between 2 to 7.
- 16. The computer-implemented method of clause 15, further including using the weighted current amplification coefficient and the weighted current channel-specific offset coefficients to correct the next channel-specific intensities and generate the corrected next channel-specific intensities.
- 17. The computer-implemented method of
clause 1, further including:- using a maximum likelihood solution to generate, for the current sequencing cycle, respective current maximum likelihood weights for the current amplification coefficient and the current channel-specific offset coefficients;
- respectively applying the current maximum likelihood weights to the current amplification coefficient and the current channel-specific offset coefficients to generate a maximum likelihood weighted current amplification coefficient and maximum likelihood weighted current channel-specific offset coefficients for the current sequencing cycle; and
- using the maximum likelihood weighted current amplification coefficient and the maximum likelihood weighted current channel-specific offset coefficients to correct the next channel-specific intensities and generate the corrected next channel-specific intensities.
- 18. The computer-implemented method of
clause 1, further including:- applying a decay factor to the current intensity correction parameters to generate decayed current intensity correction parameters for the current sequencing cycle; and
- determining the current accumulated intensity correction parameters by intensity correction parameter-wise accumulating the decayed current intensity correction parameters and the preceding accumulated intensity correction parameters.
- 19. The computer-implemented method of clause 18, wherein the decay factor is kept fixed for a certain number of sequencing cycles of the sequencing run, and exponentially decayed thereafter based on a decay logic.
- 20. The computer-implemented method of clause 19, wherein the decay logic is 1 - 1/tau, where tau is a predefined number.
- 21. The computer-implemented method of
clause 1, further including iterating the reading, the reading, the determining, the determining, the determining, the using, and the base calling for the target cluster at successive sequencing cycles of the sequencing run. - 22. The computer-implemented method of
clause 1, further including executing the reading, the reading, the determining, the determining, the determining, the using, and the base calling in parallel for multiple clusters. - 23. The computer-implemented method of
clause 1, wherein closed-form expressions for the set of current intensity correction parameters, the set of current accumulated intensity correction parameters, the current amplification coefficient, and the current channel-specific offset coefficients are determined using a least-squares solution. - 24. The computer-implemented method of
clause 1, wherein the current channel-specific intensities respectively correspond to intensity channels. - 25. The computer-implemented method of
clause 1, wherein the current channel-specific offset coefficients are the channel-wise differences between the current channel-specific intensities and the current channel-specific distribution intensities. - 26. A non-transitory computer readable storage medium impressed with computer program instructions to base call a target cluster, the instructions, when executed on a processor, implement a method comprising:
- for the target cluster,
- reading current channel-specific intensities registered for a current sequencing cycle of a sequencing run from a base-specific intensity distribution to which the target cluster is base called at the current sequencing cycle,
- reading current channel-specific distribution intensities from a centroid of the base-specific intensity distribution,
- determining a set of current intensity correction parameters for the current sequencing cycle based on the current channel-specific intensities and the current channel-specific distribution intensities,
- determining a set of current accumulated intensity correction parameters for the current sequencing cycle by accumulating the set of current intensity correction parameters and a set of preceding accumulated intensity correction parameters for a preceding sequencing cycle of the sequencing run,
- determining a current amplification coefficient and current channel-specific offset coefficients for the current sequencing cycle based on the set of current accumulated intensity correction parameters, and
- using the current amplification coefficient and the current channel-specific offset coefficients to correct next channel-specific intensities registered for a next sequencing cycle of the sequencing run and generate corrected next channel-specific intensities for the next sequencing cycle; and
- base calling the target cluster at the next sequencing cycle based on the corrected next channel-specific intensities.
- for the target cluster,
- 27. The non-transitory computer readable storage medium of clause 26, implementing each clause that ultimately depends on
clause 1. - 28. A system including one or more processors coupled to memory, the memory loaded with computer instructions to base call a target cluster, the instructions, when executed on the processors, implement actions comprising:
- for the target cluster,
- reading current channel-specific intensities registered for a current sequencing cycle of a sequencing run from a base-specific intensity distribution to which the target cluster is base called at the current sequencing cycle,
- reading current channel-specific distribution intensities from a centroid of the base-specific intensity distribution,
- determining a set of current intensity correction parameters for the current sequencing cycle based on the current channel-specific intensities and the current channel-specific distribution intensities,
- determining a set of current accumulated intensity correction parameters for the current sequencing cycle by accumulating the set of current intensity correction parameters and a set of preceding accumulated intensity correction parameters for a preceding sequencing cycle of the sequencing run,
- determining a current amplification coefficient and current channel-specific offset coefficients for the current sequencing cycle based on the set of current accumulated intensity correction parameters, and
- using the current amplification coefficient and the current channel-specific offset coefficients to correct next channel-specific intensities registered for a next sequencing cycle of the sequencing run and generate corrected next channel-specific intensities for the next sequencing cycle; and
- base calling the target cluster at the next sequencing cycle based on the corrected next channel-specific intensities.
- for the target cluster,
- 29. The system of clause 28, implementing each clause that ultimately depends on
clause 1. - 30. A computer-implemented method of base calling a target cluster, the method including:
- for the target cluster,
- accessing current intensity data and historic intensity data,
- wherein the current intensity data is for a current sequencing cycle of a sequencing run, and
- wherein the historic intensity data is for one or more preceding sequencing cycles of the sequencing run,
- determining a scale correction coefficient and channel-specific shift correction coefficients based on the current intensity data and the historic intensity data,
- using the scale correction coefficient and the channel-specific shift correction coefficients to correct next intensity data and generate corrected next intensity data,
wherein the next intensity data is for a next sequencing cycle of the sequencing run; and
- accessing current intensity data and historic intensity data,
- base calling the target cluster at the next sequencing cycle based on the corrected next intensity data.
- for the target cluster,
- 31. The computer-implemented method of clause 30, implementing each clause that ultimately depends on
clause 1. - 32. A non-transitory computer readable storage medium impressed with computer program instructions to base call a target cluster, the instructions, when executed on a processor, implement a method comprising:
- for the target cluster,
- accessing current intensity data and historic intensity data,
- wherein the current intensity data is for a current sequencing cycle of a sequencing run, and
- wherein the historic intensity data is for one or more preceding sequencing cycles of the sequencing run,
- determining a scale correction coefficient and channel-specific shift correction coefficients based on the current intensity data and the historic intensity data,
- using the scale correction coefficient and the channel-specific shift correction coefficients to correct next intensity data and generate corrected next intensity data,
wherein the next intensity data is for a next sequencing cycle of the sequencing run; and
- accessing current intensity data and historic intensity data,
- base calling the target cluster at the next sequencing cycle based on the corrected next intensity data.
- for the target cluster,
- 33. The non-transitory computer readable storage medium of clause 32, implementing each clause that ultimately depends on
clause 1. - 34. A system including one or more processors coupled to memory, the memory loaded with computer instructions to base call a target cluster, the instructions, when executed on the processors, implement actions comprising:
- for the target cluster,
- accessing current intensity data and historic intensity data,
- wherein the current intensity data is for a current sequencing cycle of a sequencing run, and
- wherein the historic intensity data is for one or more preceding sequencing cycles of the sequencing run,
- determining a scale correction coefficient and channel-specific shift correction coefficients based on the current intensity data and the historic intensity data,
- using the scale correction coefficient and the channel-specific shift correction coefficients to correct next intensity data and generate corrected next intensity data,
wherein the next intensity data is for a next sequencing cycle of the sequencing run; and
- accessing current intensity data and historic intensity data,
- base calling the target cluster at the next sequencing cycle based on the corrected next intensity data.
- for the target cluster,
- 35. The system of clause 34, implementing each clause that ultimately depends on
clause 1. - 36. A computer-implemented method of base calling a target cluster, the method including:
- for the target cluster,
- accessing current intensity data and historic intensity data,
- wherein the current intensity data is for a current sequencing cycle of a sequencing run, and
- wherein the historic intensity data is for one or more preceding sequencing cycles of the sequencing run,
- using the current intensity data and the historic intensity data to correct next intensity data and generate corrected next intensity data,
wherein the next intensity data is for a next sequencing cycle of the sequencing run; and
- accessing current intensity data and historic intensity data,
- base calling the target cluster at the next sequencing cycle based on the corrected next intensity data.
- for the target cluster,
- 37. The computer-implemented method of clause 36, implementing each clause that ultimately depends on
clause 1. - 38. A non-transitory computer readable storage medium impressed with computer program instructions to base call a target cluster, the instructions, when executed on a processor, implement a method comprising:
- for the target cluster,
- accessing current intensity data and historic intensity data,
- wherein the current intensity data is for a current sequencing cycle of a sequencing run, and
- wherein the historic intensity data is for one or more preceding sequencing cycles of the sequencing run,
- using the current intensity data and the historic intensity data to correct next intensity data and generate corrected next intensity data,
wherein the next intensity data is for a next sequencing cycle of the sequencing run; and
- accessing current intensity data and historic intensity data,
- base calling the target cluster at the next sequencing cycle based on the corrected next intensity data.
- for the target cluster,
- 39. The non-transitory computer readable storage medium of clause 38, implementing each clause that ultimately depends on
clause 1. - 40. A system including one or more processors coupled to memory, the memory loaded with computer instructions to base call a target cluster, the instructions, when executed on the processors, implement actions comprising:
- for the target cluster,
- accessing current intensity data and historic intensity data,
- wherein the current intensity data is for a current sequencing cycle of a sequencing run, and
- wherein the historic intensity data is for one or more preceding sequencing cycles of the sequencing run,
- using the current intensity data and the historic intensity data to correct next intensity data and generate corrected next intensity data,
wherein the next intensity data is for a next sequencing cycle of the sequencing run; and
- accessing current intensity data and historic intensity data,
- base calling the target cluster at the next sequencing cycle based on the corrected next intensity data.
- for the target cluster,
- 41. The system of clause 40, implementing each clause that ultimately depends on
clause 1. - While the present invention is disclosed by reference to the preferred embodiments and examples detailed above, it is to be understood that these examples are intended in an illustrative rather than in a limiting sense. It is contemplated that modifications and combinations will readily occur to those skilled in the art, which modifications and combinations will be within the spirit of the invention and the scope of the following claims.
Claims (15)
- A computer-implemented method comprising:accessing, for a target cluster, current channel-specific intensities registered for a current sequencing cycle of a sequencing run and current channel-specific distribution intensities from a base-specific intensity distribution;determining a set of current accumulated intensity correction parameters for the current sequencing cycle based on the current channel-specific intensities and the current channel-specific distribution intensities;determining current channel-specific offset coefficients for the current sequencing cycle based on the set of current accumulated intensity correction parameters;correcting next channel-specific intensities registered for a next sequencing cycle of the sequencing run based on the current channel-specific offset coefficients; anddetermining a base call for the target cluster at the next sequencing cycle based on the corrected next channel-specific intensities.
- The computer-implemented method of claim 1, comprising: accessing the current channel-specific distribution intensities from a base-specific intensity distribution to which the target cluster is base called at the current sequencing cycle; and, optionally, accessing the current channel-specific distribution intensities from a centroid of the base-specific intensity distribution to which the target cluster is base called at the current sequencing cycle.
- The computer-implemented method of claim 1 or 2, wherein accessing the current channel-specific distribution intensities comprises accessing the current channel-specific distribution intensities relative to different centroids for different bases across sequencing cycles.
- The computer-implemented method of any of claims 1-3, further comprising:determining a current amplification coefficient for the current sequencing cycle based on the set of current accumulated intensity correction parameters, optionally wherein the current amplification coefficient scales a cluster specific intensity; andcorrecting the next channel-specific intensities registered for the next sequencing cycle based further on the current amplification coefficient.
- The computer-implemented method of any of claims 1-4, wherein correcting the next channel-specific intensities comprises correcting the next channel-specific intensities for inter-cluster intensity variation among intensity values from different clusters for respective bases.
- The computer-implemented method of any of claims 1-5, wherein determining the set of current accumulated intensity correction parameters for the current sequencing cycle based on the current channel-specific intensities and the current channel-specific distribution intensities comprises:determining a set of current intensity correction parameters for the current sequencing cycle based on the current channel-specific intensities and the current channel-specific distribution intensities; anddetermining the set of current accumulated intensity correction parameters for the current sequencing cycle by accumulating the set of current intensity correction parameters.
- The computer-implemented method of claim 6, comprising determining the set of current accumulated intensity correction parameters for the current sequencing cycle by accumulating the set of current intensity correction parameters and a set of preceding accumulated intensity correction parameters for a preceding sequencing cycle of the sequencing run.
- The computer-implemented method of claim 6 or 7, wherein the set of current accumulated intensity correction parameters comprises intensity correction parameter-wise averages of the set of current intensity correction parameters and preceding accumulated intensity correction parameters.
- The computer-implemented method of claim 8, further comprising:applying a decay factor to the set of current intensity correction parameters to generate decayed current intensity correction parameters for the current sequencing cycle; anddetermining the set of current accumulated intensity correction parameters by intensity correction parameter-wise accumulating the decayed current intensity correction parameters and the preceding accumulated intensity correction parameters.
- The computer-implemented method of claim 9, wherein the decay factor is kept fixed for a certain number of sequencing cycles of the sequencing run and exponentially decayed thereafter at each successive sequencing cycle using a decay logic.
- The computer-implemented method of any of claims 1-10, wherein determining the set of current accumulated intensity correction parameters for the current sequencing cycle comprises:determining a first accumulated intensity correction parameter by accumulating distribution intensities measured for the target cluster at the current sequencing cycle and each of one or more preceding sequencing cycles, each distribution intensity including an intensity value of a centroid of a base-specific intensity distribution to which the target cluster belongs; anddetermining a second accumulated intensity correction parameter by accumulating intensity errors measured for the target cluster at the current sequencing cycle and each of the one or more preceding sequencing cycles, each intensity error including a difference between a measured intensity of the target cluster and a corresponding distribution intensity.
- The computer-implemented method of any of claims 1-11, wherein the current channel-specific intensities respectively correspond to intensity channels.
- The computer-implemented method of any of claims 1-12, wherein the current channel-specific offset coefficients offset cluster-specific intensity and/or comprise channel-wise differences between the current channel-specific intensities and the current channel-specific distribution intensities.
- A system including one or more processors coupled to memory, the memory loaded with computer instructions that, when executed on the one or more processors, cause the system to perform a method according to any one of claims 1-13.
- A non-transitory computer readable storage medium impressed with computer program instructions that, when executed on one or more processors, cause the one or more processors to perform a method according to any one of claims 1-13.
Applications Claiming Priority (3)
| Application Number | Priority Date | Filing Date | Title |
|---|---|---|---|
| US202063106256P | 2020-10-27 | 2020-10-27 | |
| EP21820355.2A EP4238098B1 (en) | 2020-10-27 | 2021-10-26 | Systems and methods for per-cluster intensity correction and base calling |
| PCT/US2021/056711 WO2022093865A1 (en) | 2020-10-27 | 2021-10-26 | Systems and methods for per-cluster intensity correction and base calling |
Related Parent Applications (2)
| Application Number | Title | Priority Date | Filing Date |
|---|---|---|---|
| EP21820355.2A Division EP4238098B1 (en) | 2020-10-27 | 2021-10-26 | Systems and methods for per-cluster intensity correction and base calling |
| EP21820355.2A Division-Into EP4238098B1 (en) | 2020-10-27 | 2021-10-26 | Systems and methods for per-cluster intensity correction and base calling |
Publications (2)
| Publication Number | Publication Date |
|---|---|
| EP4459625A2 true EP4459625A2 (en) | 2024-11-06 |
| EP4459625A3 EP4459625A3 (en) | 2025-01-22 |
Family
ID=78822676
Family Applications (2)
| Application Number | Title | Priority Date | Filing Date |
|---|---|---|---|
| EP21820355.2A Active EP4238098B1 (en) | 2020-10-27 | 2021-10-26 | Systems and methods for per-cluster intensity correction and base calling |
| EP24188630.8A Pending EP4459625A3 (en) | 2020-10-27 | 2021-10-26 | Systems and methods for per-cluster intensity correction and base calling |
Family Applications Before (1)
| Application Number | Title | Priority Date | Filing Date |
|---|---|---|---|
| EP21820355.2A Active EP4238098B1 (en) | 2020-10-27 | 2021-10-26 | Systems and methods for per-cluster intensity correction and base calling |
Country Status (10)
| Country | Link |
|---|---|
| US (5) | US11361194B2 (en) |
| EP (2) | EP4238098B1 (en) |
| JP (1) | JP2023547298A (en) |
| KR (1) | KR20230098097A (en) |
| CN (1) | CN115803817A (en) |
| AU (1) | AU2021369495B2 (en) |
| CA (1) | CA3183529A1 (en) |
| IL (1) | IL298884A (en) |
| MX (1) | MX2022016354A (en) |
| WO (1) | WO2022093865A1 (en) |
Families Citing this family (6)
| Publication number | Priority date | Publication date | Assignee | Title |
|---|---|---|---|---|
| US11361194B2 (en) * | 2020-10-27 | 2022-06-14 | Illumina, Inc. | Systems and methods for per-cluster intensity correction and base calling |
| US20240177807A1 (en) | 2022-09-16 | 2024-05-30 | Illumina, Inc. | Cluster segmentation and conditional base calling |
| EP4621066A4 (en) * | 2022-12-12 | 2026-01-21 | Mgi Tech Co Ltd | METHOD FOR SYNCHRONIC SEQUALIZATION OF NUCLEAN ACIDS WITH MULTIPLE TEMPLATES AND USE OF THEM |
| KR102949918B1 (en) | 2023-11-21 | 2026-04-07 | 전남대학교산학협력단 | Apparatus and method for automatically analyzing base sequences in real time to correct errors in dna storage devices |
| US20250210137A1 (en) * | 2023-12-20 | 2025-06-26 | Illumina, Inc. | Directly determining signal-to-noise-ratio metrics for accelerated convergence in determining nucleotide-base calls and base-call quality |
| WO2025190902A1 (en) | 2024-03-13 | 2025-09-18 | Illumina, Inc. | Improving base calling quality scores |
Citations (9)
| Publication number | Priority date | Publication date | Assignee | Title |
|---|---|---|---|---|
| US2073908A (en) | 1930-12-29 | 1937-03-16 | Floyd L Kallam | Method of and apparatus for controlling rectification |
| US20120020537A1 (en) | 2010-01-13 | 2012-01-26 | Francisco Garcia | Data processing system and methods |
| US20180274023A1 (en) | 2013-12-03 | 2018-09-27 | Illumina, Inc. | Methods and systems for analyzing image data |
| US20200302297A1 (en) | 2019-03-21 | 2020-09-24 | Illumina, Inc. | Artificial Intelligence-Based Base Calling |
| NL2023314B1 (en) | 2019-03-21 | 2020-09-28 | Illumina Inc | Artificial intelligence-based quality scoring |
| NL2023311B1 (en) | 2019-03-21 | 2020-09-28 | Illumina Inc | Artificial intelligence-based generation of sequencing metadata |
| NL2023312B1 (en) | 2019-03-21 | 2020-09-28 | Illumina Inc | Artificial intelligence-based base calling |
| NL2023316B1 (en) | 2019-03-21 | 2020-09-28 | Illumina Inc | Artificial intelligence-based sequencing |
| NL2023310B1 (en) | 2019-03-21 | 2020-09-28 | Illumina Inc | Training data generation for artificial intelligence-based sequencing |
Family Cites Families (42)
| Publication number | Priority date | Publication date | Assignee | Title |
|---|---|---|---|---|
| CA2370976C (en) | 1999-04-20 | 2009-10-20 | Illumina, Inc. | Detection of nucleic acid reactions on bead arrays |
| US6865301B1 (en) | 2000-02-28 | 2005-03-08 | Adobe Systems Incorporated | Reducing aliasing artifacts when shaping a digital image |
| CA2309002A1 (en) | 2000-05-23 | 2001-11-23 | Jonathan Martin Shekter | Digital film grain reduction |
| US6778692B1 (en) | 2000-08-11 | 2004-08-17 | General Electric Company | Image processing method and apparatus including image improving circuit |
| US6598013B1 (en) | 2001-07-31 | 2003-07-22 | University Of Maine | Method for reducing cross-talk within DNA data |
| US7664326B2 (en) | 2004-07-09 | 2010-02-16 | Aloka Co., Ltd | Method and apparatus of image processing to detect and enhance edges |
| WO2006015251A2 (en) | 2004-07-29 | 2006-02-09 | The Research Foundation Of State University Of New York | System and method for cross-talk cancellation in a multilane fluorescence detector |
| US9445025B2 (en) | 2006-01-27 | 2016-09-13 | Affymetrix, Inc. | System, method, and product for imaging probe arrays with small feature sizes |
| US8182993B2 (en) | 2007-06-06 | 2012-05-22 | Pacific Biosciences Of California, Inc. | Methods and processes for calling bases in sequence by incorporation methods |
| US8703422B2 (en) | 2007-06-06 | 2014-04-22 | Pacific Biosciences Of California, Inc. | Methods and processes for calling bases in sequence by incorporation methods |
| WO2009142856A1 (en) * | 2008-04-18 | 2009-11-26 | Trustees Of Boston University | Direction sensitive neutron detector |
| US8407012B2 (en) | 2008-07-03 | 2013-03-26 | Cold Spring Harbor Laboratory | Methods and systems of DNA sequencing |
| US20100034444A1 (en) | 2008-08-07 | 2010-02-11 | Helicos Biosciences Corporation | Image analysis |
| US20120015825A1 (en) | 2010-07-06 | 2012-01-19 | Pacific Biosciences Of California, Inc. | Analytical systems and methods with software mask |
| US20130316918A1 (en) * | 2010-11-22 | 2013-11-28 | Life Technologies Corporation | Model-based residual correction of intensities |
| US20130110407A1 (en) | 2011-09-16 | 2013-05-02 | Complete Genomics, Inc. | Determining variants in genome of a heterogeneous sample |
| WO2013056241A2 (en) | 2011-10-14 | 2013-04-18 | Pacific Biosciences Of California, Inc. | Real-time redox sequencing |
| CA2854832C (en) | 2011-11-07 | 2023-05-23 | Ingenuity Systems, Inc. | Methods and systems for identification of causal genomic variants |
| EP3366348B1 (en) | 2012-01-16 | 2023-08-23 | Greatbatch Ltd. | Emi filtered co-connected hermetic feedthrough, feedthrough capacitor and leadwire assembly for an active implantable medical device |
| US8906320B1 (en) | 2012-04-16 | 2014-12-09 | Illumina, Inc. | Biosensors for biological or chemical analysis and systems and methods for same |
| US20150337388A1 (en) | 2012-12-17 | 2015-11-26 | Virginia Tech Intellectual Properties, Inc. | Methods and compositions for identifying global microsatellite instability and for characterizing informative microsatellite loci |
| RU2664695C2 (en) | 2013-01-31 | 2018-08-21 | Кодексис, Инк. | Methods, systems, and software for identifying bio-molecules using models of multiplicative form |
| EP3575414B1 (en) | 2013-05-06 | 2023-09-06 | Pacific Biosciences of California, Inc. | Real-time electronic sequencing |
| MX363806B (en) | 2013-07-01 | 2019-04-03 | Illumina Inc | Catalyst-free surface functionalization and polymer grafting. |
| US10068053B2 (en) | 2013-12-16 | 2018-09-04 | Complete Genomics, Inc. | Basecaller for DNA sequencing using machine learning |
| EP3143537B1 (en) | 2014-05-12 | 2023-03-01 | Roche Diagnostics GmbH | Rare variant calls in ultra-deep sequencing |
| WO2016061396A1 (en) | 2014-10-16 | 2016-04-21 | Counsyl, Inc. | Variant caller |
| CN114805710B (en) | 2014-10-31 | 2023-11-17 | 伊鲁米纳剑桥有限公司 | Polymer and DNA copolymer coating |
| EP3387617B1 (en) | 2015-12-10 | 2020-05-27 | Qiagen GmbH | Method for determining the overall brightness of at least one object in a digital image |
| US10038862B2 (en) | 2016-05-02 | 2018-07-31 | Qualcomm Incorporated | Methods and apparatus for automated noise and texture optimization of digital image sensors |
| US10467749B2 (en) | 2016-10-10 | 2019-11-05 | Genemind Biosciences Company Limited | Method and system for processing an image comprising spots in nucleic acid sequencing |
| MX2019008055A (en) * | 2017-01-06 | 2019-11-05 | Illumina Inc | Phasing correction. |
| NL2018852B1 (en) | 2017-05-05 | 2018-11-14 | Illumina Inc | Optical distortion correction for imaged samples |
| US11288576B2 (en) * | 2018-01-05 | 2022-03-29 | Illumina, Inc. | Predicting quality of sequencing results using deep neural networks |
| US11210554B2 (en) * | 2019-03-21 | 2021-12-28 | Illumina, Inc. | Artificial intelligence-based generation of sequencing metadata |
| US12062417B2 (en) | 2019-05-01 | 2024-08-13 | New York University | System, method and computer accessible-medium for multiplexing base calling and/or alignment |
| US11593649B2 (en) | 2019-05-16 | 2023-02-28 | Illumina, Inc. | Base calling using convolutions |
| US11423306B2 (en) | 2019-05-16 | 2022-08-23 | Illumina, Inc. | Systems and devices for characterization and performance analysis of pixel-based sequencing |
| WO2021081128A1 (en) | 2019-10-21 | 2021-04-29 | Illumina, Inc. | Systems and methods for structured illumination microscopy |
| US11188778B1 (en) | 2020-05-05 | 2021-11-30 | Illumina, Inc. | Equalization-based image processing and spatial crosstalk attenuator |
| US11361194B2 (en) * | 2020-10-27 | 2022-06-14 | Illumina, Inc. | Systems and methods for per-cluster intensity correction and base calling |
| WO2023034931A1 (en) * | 2021-09-02 | 2023-03-09 | University Of Washington | Multiplex, temporally resolved molecular signal recorder and related methods |
-
2021
- 2021-10-25 US US17/510,285 patent/US11361194B2/en active Active
- 2021-10-26 MX MX2022016354A patent/MX2022016354A/en unknown
- 2021-10-26 CN CN202180043728.0A patent/CN115803817A/en active Pending
- 2021-10-26 AU AU2021369495A patent/AU2021369495B2/en active Active
- 2021-10-26 KR KR1020227045559A patent/KR20230098097A/en active Pending
- 2021-10-26 EP EP21820355.2A patent/EP4238098B1/en active Active
- 2021-10-26 EP EP24188630.8A patent/EP4459625A3/en active Pending
- 2021-10-26 CA CA3183529A patent/CA3183529A1/en active Pending
- 2021-10-26 WO PCT/US2021/056711 patent/WO2022093865A1/en not_active Ceased
- 2021-10-26 JP JP2022580968A patent/JP2023547298A/en active Pending
- 2021-10-26 IL IL298884A patent/IL298884A/en unknown
-
2022
- 2022-05-24 US US17/752,789 patent/US11593595B2/en active Active
-
2023
- 2023-01-13 US US18/154,603 patent/US11853396B2/en active Active
- 2023-11-03 US US18/501,904 patent/US12216741B2/en active Active
-
2024
- 2024-12-27 US US19/003,449 patent/US20250265313A1/en active Pending
Patent Citations (9)
| Publication number | Priority date | Publication date | Assignee | Title |
|---|---|---|---|---|
| US2073908A (en) | 1930-12-29 | 1937-03-16 | Floyd L Kallam | Method of and apparatus for controlling rectification |
| US20120020537A1 (en) | 2010-01-13 | 2012-01-26 | Francisco Garcia | Data processing system and methods |
| US20180274023A1 (en) | 2013-12-03 | 2018-09-27 | Illumina, Inc. | Methods and systems for analyzing image data |
| US20200302297A1 (en) | 2019-03-21 | 2020-09-24 | Illumina, Inc. | Artificial Intelligence-Based Base Calling |
| NL2023314B1 (en) | 2019-03-21 | 2020-09-28 | Illumina Inc | Artificial intelligence-based quality scoring |
| NL2023311B1 (en) | 2019-03-21 | 2020-09-28 | Illumina Inc | Artificial intelligence-based generation of sequencing metadata |
| NL2023312B1 (en) | 2019-03-21 | 2020-09-28 | Illumina Inc | Artificial intelligence-based base calling |
| NL2023316B1 (en) | 2019-03-21 | 2020-09-28 | Illumina Inc | Artificial intelligence-based sequencing |
| NL2023310B1 (en) | 2019-03-21 | 2020-09-28 | Illumina Inc | Training data generation for artificial intelligence-based sequencing |
Also Published As
| Publication number | Publication date |
|---|---|
| EP4459625A3 (en) | 2025-01-22 |
| US20240220584A1 (en) | 2024-07-04 |
| EP4238098A1 (en) | 2023-09-06 |
| EP4238098C0 (en) | 2024-08-21 |
| US20230259588A1 (en) | 2023-08-17 |
| EP4238098B1 (en) | 2024-08-21 |
| AU2021369495B2 (en) | 2026-04-02 |
| AU2021369495A1 (en) | 2023-02-02 |
| CA3183529A1 (en) | 2022-05-05 |
| US20220300772A1 (en) | 2022-09-22 |
| US20220129711A1 (en) | 2022-04-28 |
| CN115803817A (en) | 2023-03-14 |
| US12216741B2 (en) | 2025-02-04 |
| US20250265313A1 (en) | 2025-08-21 |
| IL298884A (en) | 2023-02-01 |
| MX2022016354A (en) | 2023-01-24 |
| JP2023547298A (en) | 2023-11-10 |
| US11361194B2 (en) | 2022-06-14 |
| KR20230098097A (en) | 2023-07-03 |
| WO2022093865A1 (en) | 2022-05-05 |
| US11853396B2 (en) | 2023-12-26 |
| US11593595B2 (en) | 2023-02-28 |
Similar Documents
| Publication | Publication Date | Title |
|---|---|---|
| EP4238098B1 (en) | Systems and methods for per-cluster intensity correction and base calling | |
| JP7712297B2 (en) | Equalizer-Based Intensity Correction for Base Calling | |
| JP2025526537A (en) | Dependence of base calling on flow cell tilt | |
| KR20240022490A (en) | Signal-to-noise ratio metrics for determining nucleotide base calling and base calling quality | |
| HK40114649A (en) | Systems and methods for per-cluster intensity correction and base calling | |
| HK40090027A (en) | Systems and methods for per-cluster intensity correction and base calling | |
| HK40090027B (en) | Systems and methods for per-cluster intensity correction and base calling | |
| US20240177807A1 (en) | Cluster segmentation and conditional base calling | |
| US20240266003A1 (en) | Determining and removing inter-cluster light interference | |
| US20250210137A1 (en) | Directly determining signal-to-noise-ratio metrics for accelerated convergence in determining nucleotide-base calls and base-call quality | |
| WO2026050541A1 (en) | Methods and systems for allele-specific copy number calling | |
| WO2025240924A1 (en) | Blind equalization systems for base calling applications |
Legal Events
| Date | Code | Title | Description |
|---|---|---|---|
| PUAI | Public reference made under article 153(3) epc to a published international application that has entered the european phase |
Free format text: ORIGINAL CODE: 0009012 |
|
| STAA | Information on the status of an ep patent application or granted ep patent |
Free format text: STATUS: THE APPLICATION HAS BEEN PUBLISHED |
|
| AC | Divisional application: reference to earlier application |
Ref document number: 4238098 Country of ref document: EP Kind code of ref document: P |
|
| AK | Designated contracting states |
Kind code of ref document: A2 Designated state(s): AL AT BE BG CH CY CZ DE DK EE ES FI FR GB GR HR HU IE IS IT LI LT LU LV MC MK MT NL NO PL PT RO RS SE SI SK SM TR |
|
| REG | Reference to a national code |
Ref country code: DE Ref legal event code: R079 Free format text: PREVIOUS MAIN CLASS: G16B0040300000 Ipc: G16B0040100000 |
|
| PUAL | Search report despatched |
Free format text: ORIGINAL CODE: 0009013 |
|
| AK | Designated contracting states |
Kind code of ref document: A3 Designated state(s): AL AT BE BG CH CY CZ DE DK EE ES FI FR GB GR HR HU IE IS IT LI LT LU LV MC MK MT NL NO PL PT RO RS SE SI SK SM TR |
|
| RIC1 | Information provided on ipc code assigned before grant |
Ipc: G16B 40/30 20190101ALI20241216BHEP Ipc: G16B 40/10 20190101AFI20241216BHEP |
|
| REG | Reference to a national code |
Ref country code: HK Ref legal event code: DE Ref document number: 40114649 Country of ref document: HK |
|
| STAA | Information on the status of an ep patent application or granted ep patent |
Free format text: STATUS: REQUEST FOR EXAMINATION WAS MADE |
|
| 17P | Request for examination filed |
Effective date: 20250722 |