EP4459403A1 - Information processing device, analysis method, control system, and analysis program - Google Patents
Information processing device, analysis method, control system, and analysis program Download PDFInfo
- Publication number
- EP4459403A1 EP4459403A1 EP22915938.9A EP22915938A EP4459403A1 EP 4459403 A1 EP4459403 A1 EP 4459403A1 EP 22915938 A EP22915938 A EP 22915938A EP 4459403 A1 EP4459403 A1 EP 4459403A1
- Authority
- EP
- European Patent Office
- Prior art keywords
- analysis
- time
- reconfiguration
- data
- information processing
- Prior art date
- Legal status (The legal status is an assumption and is not a legal conclusion. Google has not performed a legal analysis and makes no representation as to the accuracy of the status listed.)
- Pending
Links
Images



Classifications
-
- G—PHYSICS
- G05—CONTROLLING; REGULATING
- G05B—CONTROL OR REGULATING SYSTEMS IN GENERAL; FUNCTIONAL ELEMENTS OF SUCH SYSTEMS; MONITORING OR TESTING ARRANGEMENTS FOR SUCH SYSTEMS OR ELEMENTS
- G05B23/00—Testing or monitoring of control systems or parts thereof
- G05B23/02—Electric testing or monitoring
-
- F—MECHANICAL ENGINEERING; LIGHTING; HEATING; WEAPONS; BLASTING
- F23—COMBUSTION APPARATUS; COMBUSTION PROCESSES
- F23G—CREMATION FURNACES; CONSUMING WASTE PRODUCTS BY COMBUSTION
- F23G5/00—Incineration of waste; Incinerator constructions; Details, accessories or control therefor
- F23G5/50—Control or safety arrangements
-
- F—MECHANICAL ENGINEERING; LIGHTING; HEATING; WEAPONS; BLASTING
- F23—COMBUSTION APPARATUS; COMBUSTION PROCESSES
- F23N—REGULATING OR CONTROLLING COMBUSTION
- F23N5/00—Systems for controlling combustion
- F23N5/20—Systems for controlling combustion with a time program acting through electrical means, e.g. using time-delay relays
- F23N5/203—Systems for controlling combustion with a time program acting through electrical means, e.g. using time-delay relays using electronic means
-
- G—PHYSICS
- G05—CONTROLLING; REGULATING
- G05B—CONTROL OR REGULATING SYSTEMS IN GENERAL; FUNCTIONAL ELEMENTS OF SUCH SYSTEMS; MONITORING OR TESTING ARRANGEMENTS FOR SUCH SYSTEMS OR ELEMENTS
- G05B13/00—Adaptive control systems, i.e. systems automatically adjusting themselves to have a performance which is optimum according to some preassigned criterion
- G05B13/02—Adaptive control systems, i.e. systems automatically adjusting themselves to have a performance which is optimum according to some preassigned criterion electric
- G05B13/04—Adaptive control systems, i.e. systems automatically adjusting themselves to have a performance which is optimum according to some preassigned criterion electric involving the use of models or simulators
-
- G—PHYSICS
- G05—CONTROLLING; REGULATING
- G05B—CONTROL OR REGULATING SYSTEMS IN GENERAL; FUNCTIONAL ELEMENTS OF SUCH SYSTEMS; MONITORING OR TESTING ARRANGEMENTS FOR SUCH SYSTEMS OR ELEMENTS
- G05B17/00—Systems involving the use of models or simulators of said systems
- G05B17/02—Systems involving the use of models or simulators of said systems electric
-
- F—MECHANICAL ENGINEERING; LIGHTING; HEATING; WEAPONS; BLASTING
- F23—COMBUSTION APPARATUS; COMBUSTION PROCESSES
- F23N—REGULATING OR CONTROLLING COMBUSTION
- F23N2223/00—Signal processing; Details thereof
- F23N2223/08—Microprocessor; Microcomputer
-
- F—MECHANICAL ENGINEERING; LIGHTING; HEATING; WEAPONS; BLASTING
- F23—COMBUSTION APPARATUS; COMBUSTION PROCESSES
- F23N—REGULATING OR CONTROLLING COMBUSTION
- F23N2229/00—Flame sensors
- F23N2229/20—Camera viewing
Definitions
- the present invention relates to an information processing device and the like each of which models, with use of observation data in a plant, a phenomenon which is to be analyzed (analysis target phenomenon).
- Patent Literature 1 discloses a technique relating to a waste treatment plant including a stoker-type incinerator.
- Patent Literature 1 indicated below discloses a technique for deriving, on the basis of imaging data captured by a stereo camera and a position where the stereo camera is disposed, a burn-off point, which is a boundary between a combustion zone and incineration ash.
- Patent Literature 1 Japanese Patent Application Publication, Tokukai, No. 2018-155411
- Patent Literature 1 It takes time between conduction of control for adjusting the position of the burn-off point and reflection of the control to the position of the burn-off point. Thus, it is desired to predict a future position of the burn-off point.
- the technique of Patent Literature 1 can merely derive a current position of the burn-off point, and cannot predict a near-future position of the burn-off point.
- spatio-temporal analysis As a technique for analyzing time-series observation data, spatio-temporal analysis has been known. Use of the spatio-temporal analysis makes it possible to generate, from time-series data obtained as a result of observation of a target phenomenon, a dynamic model indicative of a change of the phenomenon in a temporal direction and a spatial direction.
- time-series data observed in a plant generally includes many noise components.
- noise components reduces precision of the dynamic model, and excessively increase an operation amount and operation time required to generate the dynamic model.
- the resulting moving image may include not only the burn-off point but also various things such as flickering flame and/or moving smoke. These things may cause reduction in the precision of the dynamic model and increase in the operation amount.
- An aspect of the present invention is to provide an information processing device and the like each capable of generating, with a relatively small operation amount, a dynamic model in which a change of an analysis target phenomenon in a temporal direction and a spatial direction is accurately reflected.
- an information processing device in accordance with an aspect of the present invention includes: a reconfiguration section that generates reconfiguration data by reconfiguring time-series data from part of frequency components of the time-series data obtained as a result of observation of a phenomenon in a plant which phenomenon is to be analyzed; and an analysis section that carries out spatio-temporal analysis on the reconfiguration data to generate a dynamic model indicative of a change of the phenomenon in a temporal direction and a spatial direction.
- an analysis method in accordance with an aspect of the present invention is an analysis method that is executed by one or more information processing devices, the analysis method including: a reconfiguration step of generating reconfiguration data by reconfiguring time-series data from part of frequency components of the time-series data obtained as a result of observation of a phenomenon in a plant which phenomenon is to be analyzed; and an analysis step of carrying out spatio-temporal analysis on the reconfiguration data to generate a dynamic model indicative of a change of the phenomenon in a temporal direction and a spatial direction.
- Fig. 2 is a view illustrating an example of a configuration of the control system 7.
- the control system 7 is a system for controlling various pieces of equipment provided in an incinerator in a waste incineration plant.
- This incinerator is configured such that a waste fed from a hopper (indicated by (a) in Fig. 2 ) is incinerated in a furnace (indicated by (c) in Fig. 2 ) while being transferred by a fire grate (indicated by (b) in Fig. 2 ).
- This incinerator is further configured such that an operator who is in a control room (indicated by (d) in Fig. 2 ) can control various pieces of equipment such as the fire grate.
- the waste only needs to be the one that can be incinerated.
- the waste may be a general waste such as a domestic waste or an industrial waste.
- the control system 7 includes an information processing device 1, a control device 2, and an imaging device 3.
- the information processing device 1 and the control device 2 are provided in the control room.
- the imaging device 3 is provided at a position where the imaging device 3 can capture an image of an inside of the furnace (specifically, such a position can be a downstream position in a transfer direction of the waste). Note that the information processing device 1 and the control device 2 may be provided outside the control room.
- the information processing device 1 generates reconfiguration data by reconfiguring time-series data from part of frequency components of the time-series data obtained as a result of observation of an analysis target phenomenon in a plant (details thereof will be described later). Then, the information processing device 1 carries out spatio-temporal analysis on the reconfiguration data thus generated, so as to generate a dynamic model indicative of a change of the phenomenon in a temporal direction and a spatial direction. The information processing device 1 carries out inference about the phenomenon with use of this dynamic model.
- the analysis target phenomenon is combustion of a waste in an incinerator in a waste incineration plant.
- the time-series data is time-series frame images which are extracted from a moving image which is captured by the imaging device 3 and which is indicative of a combustion state of the waste in the incinerator.
- the dynamic model is a model indicative of a change of the combustion state of the waste in the incinerator, the change being observed in a temporal direction and a spatial direction.
- the control device 2 controls the equipment of the plant on the basis of a result of the inference carried out by the information processing device 1.
- the equipment which is to be controlled may be any equipment that gives influence on the combustion state of the waste in the incinerator.
- the control device 2 may be the one that carries out (i) control for adjusting a speed of the fire grate by controlling equipment causing the fire grate to operate and/or (ii) control for adjusting, by controlling a combustion air feeder, an amount of combustion air to be fed.
- the speed of the fire grate can be rephrased as a transfer speed of the waste.
- the control system 7 includes the information processing device 1 and the control device 2.
- the information processing device 1 generates reconfiguration data by reconfiguring time-series data from part of frequency components of the time-series data obtained as a result of observation of the analysis target phenomenon.
- the information processing device 1 carries out spatio-temporal analysis on the reconfiguration data thus generated, so as to generate a dynamic model.
- the information processing device 1 carries out inference about the phenomenon with use of the dynamic model thus generated.
- the control device 2 controls the equipment of the plant on the basis of a result of the inference carried out by the information processing device 1.
- the above configuration can give, with a small operation amount, a high-accuracy inference result by a dynamic model in which a change of the part of the frequency components in a temporal direction and a spatial direction is accurately reflected (details thereof will be described later). Further, the above configuration can automatically carry out appropriate control on the basis of the result. For example, in a case where the information processing device 1 infers that the burn-off point will be shifted toward a downstream side beyond an appropriate range, the control device 2 may carry out control for reducing the speed of the fire grate. This makes it possible to remain the burn-off point within the appropriate range.
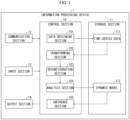
- Fig. 1 is a block diagram illustrating an example of a configuration of a main part of the information processing device 1.
- the information processing device 1 includes a control section 10 which comprehensively controls sections of the information processing device 1 and a storage section 11 in which various data to be used by the information processing device 1 is stored.
- the information processing device 1 further includes a communication section 12 via which the information processing device 1 communicates with another device, an input section 13 which accepts input of various data for the information processing device 1, and an output section 14 via which the information processing device 1 outputs various data.
- control section 10 includes a data obtaining section 101, a transforming section 102, a reconfiguration section 103, an analysis section 104, and an inference section 105.
- the storage section 11 has time-series data 111 and a dynamic model 112 stored therein.
- the data obtaining section 101 obtains time-series data obtained as a result of observation of the analysis target phenomenon in the plant.
- the time-series data thus obtained is stored in the storage section 11 as the time-series data 111.
- the data obtaining section 101 obtains a moving image which is captured by the imaging device 3 shown in Fig. 2 and which is indicative of a combustion state of the waste in the incinerator.
- the data obtaining section 101 obtains the time-series data 111 by extracting, from the moving image, frame images at a given sampling cycle. Note that the data obtaining section 101 may resize the frame images and deal with them as the time-series data 111.
- the transforming section 102 transforms the time-series data 111 into frequency-domain data (which can also be called a "frequency component").
- the transforming section 102 may transform the time-series data 111 into the frequency-domain data by subjecting the time-series data 111 to discrete Fourier transform (DFT) or fast Fourier transform (FFT).
- DFT discrete Fourier transform
- FFT fast Fourier transform
- the reconfiguration section 103 generates reconfiguration data by reconfiguring time-series data 111 from part of frequency components of the time-series data 111. Specifically, in subjecting the frequency-domain data generated by the transforming section 102 to inverse transformation so as to turn the frequency-domain data into time-domain data again, the reconfiguration section 103 generates reconfiguration data by using only part of the frequency-domain data rather than by using all of the frequency-domain data. This process can be regarded as a process of removing an unnecessary frequency component or a process of extracting a necessary frequency component.
- the analysis section 104 carries out spatio-temporal analysis on the reconfiguration data generated by the reconfiguration section 103, so as to generate a dynamic model indicative of a change of the analysis target phenomenon in a temporal direction and a spatial direction.
- the dynamic model thus generated is stored in the storage section 11 as the dynamic model 112.
- the dynamic model 112 is a model indicative of a change of the combustion state of the waste in the incinerator, the change being observed in a temporal direction and a spatial direction.
- the inference section 105 carries out inference about the analysis target phenomenon in the plant with use of the dynamic model 112.
- the inference section 105 generates, with use of the dynamic model 112, a prediction image indicative of a future combustion state of the waste in the incinerator.
- the information processing device 1 includes the reconfiguration section 103 and the analysis section 104.
- the reconfiguration section 103 generates the reconfiguration data by reconfiguring time-series data 111 from part of frequency components of the time-series data 111 obtained as a result of observation of the analysis target phenomenon in the plant.
- the analysis section 104 carries out spatio-temporal analysis on the reconfiguration data to generate the dynamic model 112 indicative of a change of the phenomenon in a temporal direction and a spatial direction.
- the above configuration does not carry out spatio-temporal analysis on analysis-target time-series data as it is, but carries out spatio-temporal analysis on reconfiguration data which is obtained by reconfiguring time-series data from part of frequency components thereof.
- the above configuration can generate, with a smaller operation amount, a dynamic model in which a change of the analysis target phenomenon in a temporal direction and a spatial direction is accurately reflected.
- the information processing device 1 includes the inference section 105 that carries out inference about the analysis target phenomenon with use of the dynamic model 112. Consequently, it is possible to obtain a high-accuracy inference result provided by the dynamic model 112 in which a change of the part of the frequency components in a temporal direction and a spatial direction is accurately reflected.
- the inference section 105 may generate a prediction image indicative of a future combustion state of the waste. Further, the inference section 105 may analyze the generated prediction image so as to classify the future combustion state of the waste.
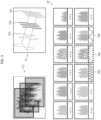
- Fig. 3 is a view illustrating an overview of the analysis method in accordance with the present embodiment.
- the analysis method in accordance with the present embodiment carries out spatio-temporal analysis by dynamic mode decomposition (DMD).
- Fig. 3 illustrates the time-series data 111, a graph group 31 indicative of frequency components, and an image group 32 indicative of dynamic modes derived through DMD.
- the time-series data 111 is frame images extracted from a moving image obtained by imaging an inside of the incinerator.
- the graph group 31 indicative of the frequency components can be obtained by transforming the time-series data 111 into a frequency domain.
- Graphs 31a to 31c included in the graph group 31 indicate respective different frequency components.
- a frequency component indicated by the graph 31a is located closer to a low frequency side than any other ones
- a frequency component indicated by the graph 31c is located closer to a high frequency side than any other ones.
- a change such as flickering flame appears as a high-frequency component
- a change of the combustion position appears as a low-frequency component.
- a frequency component located closer to a low frequency side which frequency component indicates a change over a relatively long period, for example, 10 minutes or longer, is important.
- Images included in the image group 32 indicate, as images of the inside of the incinerator, the dynamic modes derived through DMD.
- Fig. 3 shows graphs indicating waveforms of the dynamic modes such that the waveforms are associated with the respective images.
- DMD analyzes the analysis target phenomenon by decomposing the time-series data 111 into a plurality of dynamic modes. This analysis method will be described below.
- time-series changes of data are indicated by a linear operator A, as shown in Mathematical Expression (1) indicated below. That is, a state x k+1 at a time point k+1 is represented by a product of (i) a state x k at a time point k, which is immediately before the time point k+1, and (ii) the linear operator A.
- the time-series data 111 is frame images extracted from a moving image as in the case shown in Fig.
- x k shown below denotes a vector indicative of pixel values (e.g., RGB values) of the frame images
- K shown below denotes the number of the frame images
- P shown below denotes resolutions of the respective frame images.
- a snapshot is a vector indicative of a state at a certain time.
- F denotes the Frobenius norm.
- DMD derives an eigenvalue and an eigenvector of A by carrying out eigendecomposition of the operator A (details thereof will be omitted).
- the eigenvector of A is the dynamic mode.
- multiple dynamic modes are calculated from the time-series data 111.
- the graph group 31 shown in Fig. 3 indicates frequency components of the time-series data 111.
- the graphs 31a to 31c indicate frequency components respectively corresponding to the dynamic modes of the images 32a to 32c included in the image group 32.
- the analysis method in accordance with the present embodiment generates reconfiguration data by reconfiguring time-series data 111 from part of frequency components of the time-series data 111.
- reconfiguration data is generated with use of a frequency component corresponding to, among the graphs included in the graph group 31, the graph 31b corresponding to the image 32B. This makes it possible to calculate, among the dynamic modes indicated by the image group 32, only the dynamic mode indicated by the image 32b quickly and with a small operation amount.
- the transforming section 102 first transforms the time-series data 111 into frequency-domain data.
- a measurement target at each time step includes an element P
- "x k " in Mathematical Expression (1) is as indicated below.
- sampling is carried out with a sampling frequency f s , so as to yield one-dimensional time-series data indicated below.
- each frequency component y j is represented by a weighted sum of all the elements included in x, that is, Mathematical Expression (4) below.
- the transforming section 102 may transform the time-series data 111 into frequency-domain data according to Mathematical Expression (4) indicated above, for example. This transform is similar to general discrete Fourier transform.
- the reconfiguration section 103 carries out, according to, e.g., Mathematical Expression (5) indicated below, inverse transformation of the frequency-domain data obtained as a result of the above transformation, so as to turn the frequency-domain data into the image again.
- This provides reconfiguration data corresponding to part of the frequency components of the time-series data 111.
- the reconfiguration data is identical to the original time-series data 111 in the number of pixels and the size; however, the reconfiguration data does not include information about part of the frequency components.
- the reconfiguration data is lower-rank approximate data of the original time-series data 111.
- Mathematical Expression (5) indicated above is a general mathematical expression of inverse Fourier transform to which ⁇ is added.
- ⁇ denotes an indicator function for determining whether to incorporate certain y j into the reconfiguration data.
- ⁇ denotes information indicative of domain knowledge relating to a task.
- ⁇ denotes a frequency relating to a task
- ⁇ ⁇ 1 , ⁇ 2 , ... , ⁇ D ⁇ .
- the task in the present embodiment is generating a dynamic model indicative of a change of an analysis target phenomenon in a plant, the change being observed in a temporal direction and a spatial direction over a relatively long period (for example, 10 minutes or longer).
- ⁇ ⁇ 1 , if s j ⁇ ⁇ 0 , otherwise ,
- Only one piece of task-related frequency information ⁇ may be set. Alternatively, a plurality of pieces of task-related frequency information ⁇ may be set. For example, in the example shown in Fig. 3 , when ⁇ indicative of the frequency component indicated in the graph 31b is set, the dynamic mode corresponding to the image 32b is calculated. When ⁇ s (three ⁇ s in total) respectively corresponding to the frequency components indicated in the graphs 31a to 31c are set, the dynamic modes corresponding to the images 32a to 32c are calculated.
- a value of the task-related frequency information ⁇ may be determined in advance according to an analysis target phenomenon.
- the value of ⁇ may be set on the basis of an operation period of equipment which is operating in the plant.
- the fire grate In the incinerator of the waste incineration plant, the fire grate is operating periodically.
- the operation period of the fire grate may be used as a reference.
- a frequency component higher than the operation period may not be used, and a frequency component lower than the operation period may be used.
- the reconfiguration section 103 may generate reconfiguration data from a frequency component(s) selected on the basis of an operation period of equipment that is operating in the plant. With this, it is possible to generate reconfiguration data from a suitable frequency component(s) selected in consideration of operation of the equipment in the plant.
- the process of determining the task-related frequency information ⁇ on the basis of the operation period of the equipment that is operating in the plant may be carried out by a user of the information processing device 1 or by the information processing device 1.
- the information processing device 1 accepts input of the operation period of the equipment, and automatically sets a value of ⁇ according to the operation period thus input.
- the reconfiguration section 103 may update ⁇ to a value corresponding to the changed operation period.
- the analysis section 104 calculates an eigenvalue and an eigenvector of the operator A through DMD using the above reconfiguration data.
- Mathematical Expression (3) indicated above can be rewritten into the one as indicated below.
- a ⁇ X ⁇ 2 X ⁇ 1 ⁇
- the dynamic model 112 generated by the analysis section 104 can be represented by Mathematical Expression (6) indicated below using an eigenvalue ⁇ t and an eigenvector (dynamic mode) ⁇ calculated through DMD. Note that b denotes an amplitude of the corresponding dynamic mode. Since the eigenvalue, eigenvector, and amplitude indicated in Mathematical Expression (6) are calculated with use of the task-related frequency information ⁇ , ⁇ is added to each of the characters corresponding thereto.
- x t ⁇ ⁇ ⁇ ⁇ t b ⁇
- the inference section 105 can predict a state x t at an arbitrary time t by using the dynamic model 112.
- the above configuration is advantageous in that the above configuration requires less time and effort for collection of data for training and labeling of data for training. Further, the above configuration is also advantageous in that the above configuration is applicable to modeling of a phenomenon for which it is difficult to collect a large amount of training data.
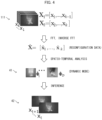
- Fig. 4 is a view illustrating an example in which a dynamic model 112 is generated from the time-series data 111 extracted from the moving image obtained by imaging the inside of the incinerator and a prediction image is generated on the basis of the generated dynamic model 112.
- time-series data 111 constituted by k frame images x 1 to x k is used as input data.
- the transforming section 102 transforms each of x 1 to x k included in the time-series data 111 into frequency-domain data through Fourier transform (e.g., FFT).
- the reconfiguration section 103 reconfigures, through inverse Fourier transform (e.g., inverse FFT), time-series data 111 from part of frequency components included in the frequency-domain data.
- the above frequency components are frequency components extracted on the basis of the task-related frequency information ⁇ .
- Fourier transform may be carried out according to Mathematical Expression (4) indicated above, and inverse Fourier transform may be carried out according to Mathematical Expression (5) indicated above.
- the analysis section 104 carries out spatio-temporal analysis on the reconfiguration data through DMD, so as to derive a dynamic mode ⁇ and an eigenvalue ⁇ .
- Fig. 4 shows an image 41 including imaged dynamic modes.
- the dynamic model 112 indicated by Mathematical Expression (6) is generated.
- the inference section 105 uses the dynamic model 112 to generate a prediction image 42 indicating states of the inside of the incinerator at the time t and the time t+ 1.
- the prediction image 42 indicates a state at a point of time later than those of the pieces of time-series data 111 x 1 to x k having been used to calculate the eigenvalue and the dynamic modes, that is, a future state of the incinerator. As long as the trend of the state change of the incinerator is maintained, prediction with use of the calculated eigenvalue and dynamic modes is effective. When a change occurs in the trend of the state change, an eigenvalue and dynamic modes may be calculated again with use of time-series data 111 obtained after occurrence of the change.
- use of the dynamic model 112 makes it possible to generate a prediction image at a point of time when the time-series data 111 is observed. Further, by comparing (i) a sequence generated with use of the prediction image, that is, the dynamic model 112 with (ii) a sequence of the time-series data 111 at the corresponding point of time, that is, the original sequence, it is possible to evaluate prediction precision.
- the inventors of the present application conducted an experiment and confirmed that the above configuration can generate a prediction image with adequate precision sufficient for practical use.
- the prediction image is discrete data. However, by generating time-series prediction images, it is possible to predict, on the basis of these prediction images, a speed at which the state change takes place. Further, according to DMD, information (temporal dynamics) indicative of the periodicity of changes of each dynamic mode is calculated. It can be said that this periodicity indicates a speed of the changes.
- Fig. 5 is a flowchart illustrating an example of the process executed by the information processing device 1.
- the data obtaining section 101 obtains a moving image indicative of a combustion state of a waste in an incinerator, the moving image being captured by the imaging device 3. Then, in S12, the data obtaining section 101 obtains time-series data by extracting frame images from the moving image obtained in S11, and stores it as time-series data 111 in the storage section 11.
- the transforming section 102 transforms the time-series data 111 stored in S12 into frequency-domain data. This transform may be carried out with use of Mathematical Expression (4) indicated above, for example.
- the reconfiguration section 103 In S14 (reconfiguration step), the reconfiguration section 103 generates reconfiguration data by reconfiguring time-series data 111 from part of frequency components constituting the frequency-domain data obtained as a result of the conversion carried out in S13.
- This reconfiguration may be carried out with use of Mathematical Expression (5) indicated above, for example.
- This reconfiguration uses task-related frequency information ⁇ indicative of the frequency component(s) to be used.
- the analysis section 104 carries out spatio-temporal analysis on the reconfiguration data generated in S14, so as to generate a dynamic model 112.
- the analysis section 104 may generate a dynamic model 112 expressed by Mathematical Expression (6) by calculating an eigenvalue and an eigenvector of the operator A in Mathematical Expression (3)' indicated above.
- the inference section 105 carries out inference about the analysis target phenomenon in the plant with use of the dynamic model 112 generated in S15.
- the inference section 105 may use the dynamic model 112 expressed by Mathematical Expression (6) to predict a state xt at an arbitrary time t.
- the control device 2 may control the equipment in the plant on the basis of a result of the inference carried out in S16. A kind of equipment to be subjected to control and a kind of the control to be carried out in association with a certain inference result may be determined in advance.
- the analysis method in accordance with the present embodiment includes the reconfiguration step (S14) and the analysis step (S15).
- the reconfiguration step (S14) generates reconfiguration data by reconfiguring time-series data 111 from part of frequency components of the time-series data 111 obtained as a result of observation of the analysis target phenomenon in the plant.
- the analysis step (S15) carries out spatio-temporal analysis on the reconfiguration data to generate the dynamic model 112 indicative of a change of the analysis target phenomenon in a temporal direction and a spatial direction. Consequently, it is possible to generate, with a relatively small operation amount, the dynamic model 112 in which the change of the analysis target phenomenon in a temporal direction and a spatial direction is accurately reflected.
- the reconfiguration section 103 may generate reconfiguration data from the time-series data 111 thus added. Then, the analysis section 104 updates the dynamic model 112 with use of the reconfiguration data thus generated.
- the inference section 105 may carry out inference about the analysis target phenomenon with use of the updated dynamic model 112. This makes it possible to output a result of the inference in real time or at an early timing which is almost real-time.
- the analysis section 104 may generate and update the dynamic model 112 with use of a technique called streaming DMD, for example.
- the streaming DMD is a technique for updating the dynamic model 112 every time a new snapshot becomes available. Details of the process are described in, for example, " Dynamic Mode Decomposition for Large and Streaming Datasets" (Maziar S. Hemati et al.), Physics of Fluids, vol. 26, no. 11, p. 111701, 2014 .
- FIG. 6 is a flowchart illustrating another example of the process executed by the information processing device 1. Note that the same processes as those in Fig. 6 are given the same reference signs. Explanations of such processes are omitted.
- the analysis section 104 carries out spatio-temporal analysis on the reconfiguration data generated in S14, so as to generate a dynamic model 112. For example, the analysis section 104 generates the dynamic model 112 through the above-described streaming DMD. In a case where there exists an already-generated dynamic model 112, the analysis section 104 updates the already-generated dynamic model 112 with use of reconfiguration data generated in S14 carried out last time.
- the data obtaining section 101 determines whether to end the analyzing process. If it is determined that the analyzing process is to be ended at this point (YES in S17A), the analyzing process is ended. Meanwhile, if it is determined that the analyzing process is not to be ended (NO in S17A), the process returns to S11. Consequently, during capturing of a moving image, it is possible to output the latest inference result in real time or at an early timing which is almost real-time. Note that there is no particular limitation on the end condition in S17A. For example, the end condition may be ending of capturing of the moving image.
- a process of adding a flocculant to sludge, stirring the resultant mixture, and separating a solid from the sludge is carried out.
- this process by analyzing an image of a stirred state of the sludge by the analysis method described in the above embodiment, it is possible to generate a dynamic model indicative of a change of the state of the sludge in a temporal direction and a spatial direction.
- Use of such a dynamic model makes it possible to predict a future state of the sludge and to appropriately control, on the basis of the prediction result, a timing to add the flocculant and an amount of the flocculant to be added.
- the task-related frequency information ⁇ may be set at a value corresponding to an operation period of a stirring device that stirrers the sludge, for example.
- any entity can execute each of the processes described in the above-described embodiment, and is not limited to the one in the above examples.
- the processes in S13 to S15 may be executed by another device (for example, a cloud server) separated from the information processing device 1.
- the information processing device 1 may transmit time-series data to said another device and obtain a dynamic model generated by said another device.
- the analysis method in accordance with the present embodiment may be executed by a single information processing device 1 or a plurality of information processing devices.
- the information processing device 1 and the control device 2 are separated from each other.
- a single device in which the information processing device 1 and the control device 2 are integrated together may provide a similar function to that of the control system 7.
- the description of the above embodiment has dealt with the example in which the frame images extracted from the moving image are used as the time-series data.
- the time-series data used in the present invention is not limited to this example, as long as the time-series data is the one obtained as a result of observation of the analysis target phenomenon in the plant.
- the time-series data may be measurement values supplied from various sensors disposed in various places in the plant.
- generated is a dynamic model indicative of a change of an analysis target phenomenon in a temporal direction and a spatial direction, the change corresponding to the spatial positions of the various sensors and the measurement values of the various sensors.
- the functions of the information processing device 1 may be realized by an analysis program for causing a computer to function as the information processing device 1, the analysis program causing the computer to function as each of the control blocks (particularly, the sections included in the control section 10) of the information processing device 1.
- the information processing device 1 includes, as hardware for executing the analysis program, a computer including at least one control device (e.g., a processor) and at least one storage device (e.g., a memory).
- the control device and the storage device execute the analysis program, so that the functions described in the above embodiment are implemented.
- the analysis program may be stored in one or more non-transitory storage media each of which can be read by the computer.
- This storage medium may or may not be provided in the information processing device 1.
- the analysis program can be supplied to the device via any transmission medium such as a wired transmission medium or a wireless transmission medium.
- control blocks can be realized by a logical circuit.
- a logical circuit For example, an integrated circuit on which a logical circuit functioning as the control blocks is formed may also be encompassed in the present invention.
- the functions of the control blocks can be realized by a quantum computer, for example.
- the present invention is not limited to the embodiments, but can be altered by a skilled person in the art within the scope of the claims.
- the present invention also encompasses, in its technical scope, any embodiment derived by combining technical means disclosed in differing embodiments.
Landscapes
- Engineering & Computer Science (AREA)
- Physics & Mathematics (AREA)
- Automation & Control Theory (AREA)
- General Physics & Mathematics (AREA)
- General Engineering & Computer Science (AREA)
- Mechanical Engineering (AREA)
- Health & Medical Sciences (AREA)
- Artificial Intelligence (AREA)
- Computer Vision & Pattern Recognition (AREA)
- Evolutionary Computation (AREA)
- Medical Informatics (AREA)
- Software Systems (AREA)
- Chemical & Material Sciences (AREA)
- Combustion & Propulsion (AREA)
- Testing And Monitoring For Control Systems (AREA)
- Incineration Of Waste (AREA)
Abstract
Description
- The present invention relates to an information processing device and the like each of which models, with use of observation data in a plant, a phenomenon which is to be analyzed (analysis target phenomenon).
- In plant operation, it is one of the most important matters to accurately acknowledge a state of the plant and carry out appropriate control according to the state. Thus, heretofore, development of a technique for accurately acknowledging the state of the plant has been promoted. For example,
Patent Literature 1 discloses a technique relating to a waste treatment plant including a stoker-type incinerator. Specifically,Patent Literature 1 indicated below discloses a technique for deriving, on the basis of imaging data captured by a stereo camera and a position where the stereo camera is disposed, a burn-off point, which is a boundary between a combustion zone and incineration ash. - [Patent Literature 1]
Japanese Patent Application Publication, Tokukai, No. 2018-155411 - It takes time between conduction of control for adjusting the position of the burn-off point and reflection of the control to the position of the burn-off point. Thus, it is desired to predict a future position of the burn-off point. The technique of
Patent Literature 1, however, can merely derive a current position of the burn-off point, and cannot predict a near-future position of the burn-off point. - Here, as a technique for analyzing time-series observation data, spatio-temporal analysis has been known. Use of the spatio-temporal analysis makes it possible to generate, from time-series data obtained as a result of observation of a target phenomenon, a dynamic model indicative of a change of the phenomenon in a temporal direction and a spatial direction.
- However, time-series data observed in a plant generally includes many noise components. Such noise components reduces precision of the dynamic model, and excessively increase an operation amount and operation time required to generate the dynamic model. For example, in a case where a moving image of a state of an inside of an incinerator is captured in a manner as disclosed in
Patent Literature 1, the resulting moving image may include not only the burn-off point but also various things such as flickering flame and/or moving smoke. These things may cause reduction in the precision of the dynamic model and increase in the operation amount. - An aspect of the present invention is to provide an information processing device and the like each capable of generating, with a relatively small operation amount, a dynamic model in which a change of an analysis target phenomenon in a temporal direction and a spatial direction is accurately reflected.
- In order to attain the above object, an information processing device in accordance with an aspect of the present invention includes: a reconfiguration section that generates reconfiguration data by reconfiguring time-series data from part of frequency components of the time-series data obtained as a result of observation of a phenomenon in a plant which phenomenon is to be analyzed; and an analysis section that carries out spatio-temporal analysis on the reconfiguration data to generate a dynamic model indicative of a change of the phenomenon in a temporal direction and a spatial direction.
- In order to attain the above object, an analysis method in accordance with an aspect of the present invention is an analysis method that is executed by one or more information processing devices, the analysis method including: a reconfiguration step of generating reconfiguration data by reconfiguring time-series data from part of frequency components of the time-series data obtained as a result of observation of a phenomenon in a plant which phenomenon is to be analyzed; and an analysis step of carrying out spatio-temporal analysis on the reconfiguration data to generate a dynamic model indicative of a change of the phenomenon in a temporal direction and a spatial direction.
- In accordance with an aspect of the present invention, it is possible to generate, with a relatively small operation amount, a dynamic model in which a change of an analysis target phenomenon in a temporal direction and a spatial direction is accurately reflected.
-
-
Fig. 1 is a view illustrating an example of a configuration of a main part of an information processing device in accordance with an embodiment of the present invention. -
Fig. 2 is a view illustrating an example of a configuration of a control system including the information processing device. -
Fig. 3 is a view illustrating an overview of an analysis method in accordance with an embodiment of the present invention. -
Fig. 4 is a view illustrating an example in which a dynamic model is generated from time-series data extracted from a moving image obtained by imaging an inside of an incinerator and a prediction image is generated on the basis of the generated dynamic model. -
Fig. 5 is a flowchart illustrating an example of a process executed by the information processing device. -
Fig. 6 is a flowchart illustrating another example of a process executed by the information processing device. - The following description will discuss, with reference to
Fig. 2 , a configuration of acontrol system 7 in accordance with an embodiment of the present invention.Fig. 2 is a view illustrating an example of a configuration of thecontrol system 7. Thecontrol system 7 is a system for controlling various pieces of equipment provided in an incinerator in a waste incineration plant. This incinerator is configured such that a waste fed from a hopper (indicated by (a) inFig. 2 ) is incinerated in a furnace (indicated by (c) inFig. 2 ) while being transferred by a fire grate (indicated by (b) inFig. 2 ). This incinerator is further configured such that an operator who is in a control room (indicated by (d) inFig. 2 ) can control various pieces of equipment such as the fire grate. Note that the waste only needs to be the one that can be incinerated. For example, the waste may be a general waste such as a domestic waste or an industrial waste. - As shown in
Fig. 2 , thecontrol system 7 includes aninformation processing device 1, acontrol device 2, and an imaging device 3. In the example shown inFig. 2 , among these elements, theinformation processing device 1 and thecontrol device 2 are provided in the control room. Further, the imaging device 3 is provided at a position where the imaging device 3 can capture an image of an inside of the furnace (specifically, such a position can be a downstream position in a transfer direction of the waste). Note that theinformation processing device 1 and thecontrol device 2 may be provided outside the control room. - The
information processing device 1 generates reconfiguration data by reconfiguring time-series data from part of frequency components of the time-series data obtained as a result of observation of an analysis target phenomenon in a plant (details thereof will be described later). Then, theinformation processing device 1 carries out spatio-temporal analysis on the reconfiguration data thus generated, so as to generate a dynamic model indicative of a change of the phenomenon in a temporal direction and a spatial direction. Theinformation processing device 1 carries out inference about the phenomenon with use of this dynamic model. - In the example described in the present embodiment, the analysis target phenomenon is combustion of a waste in an incinerator in a waste incineration plant. Further, in the example described in the present embodiment, the time-series data is time-series frame images which are extracted from a moving image which is captured by the imaging device 3 and which is indicative of a combustion state of the waste in the incinerator. Thus, the dynamic model is a model indicative of a change of the combustion state of the waste in the incinerator, the change being observed in a temporal direction and a spatial direction.
- The
control device 2 controls the equipment of the plant on the basis of a result of the inference carried out by theinformation processing device 1. The equipment which is to be controlled may be any equipment that gives influence on the combustion state of the waste in the incinerator. For example, thecontrol device 2 may be the one that carries out (i) control for adjusting a speed of the fire grate by controlling equipment causing the fire grate to operate and/or (ii) control for adjusting, by controlling a combustion air feeder, an amount of combustion air to be fed. The speed of the fire grate can be rephrased as a transfer speed of the waste. - As discussed above, the
control system 7 includes theinformation processing device 1 and thecontrol device 2. Theinformation processing device 1 generates reconfiguration data by reconfiguring time-series data from part of frequency components of the time-series data obtained as a result of observation of the analysis target phenomenon. Theinformation processing device 1 carries out spatio-temporal analysis on the reconfiguration data thus generated, so as to generate a dynamic model. Theinformation processing device 1 carries out inference about the phenomenon with use of the dynamic model thus generated. Thecontrol device 2 controls the equipment of the plant on the basis of a result of the inference carried out by theinformation processing device 1. - As compared to a configuration that carries out spatio-temporal analysis on analysis-target time-series data as it is, the above configuration can give, with a small operation amount, a high-accuracy inference result by a dynamic model in which a change of the part of the frequency components in a temporal direction and a spatial direction is accurately reflected (details thereof will be described later). Further, the above configuration can automatically carry out appropriate control on the basis of the result. For example, in a case where the
information processing device 1 infers that the burn-off point will be shifted toward a downstream side beyond an appropriate range, thecontrol device 2 may carry out control for reducing the speed of the fire grate. This makes it possible to remain the burn-off point within the appropriate range. - The following will describe a configuration of the
information processing device 1 with reference toFig. 1. Fig. 1 is a block diagram illustrating an example of a configuration of a main part of theinformation processing device 1. As shown inFig. 1 , theinformation processing device 1 includes acontrol section 10 which comprehensively controls sections of theinformation processing device 1 and astorage section 11 in which various data to be used by theinformation processing device 1 is stored. Theinformation processing device 1 further includes acommunication section 12 via which theinformation processing device 1 communicates with another device, aninput section 13 which accepts input of various data for theinformation processing device 1, and anoutput section 14 via which theinformation processing device 1 outputs various data. - Further, the
control section 10 includes adata obtaining section 101, a transformingsection 102, areconfiguration section 103, ananalysis section 104, and aninference section 105. Thestorage section 11 has time-series data 111 and adynamic model 112 stored therein. - The
data obtaining section 101 obtains time-series data obtained as a result of observation of the analysis target phenomenon in the plant. The time-series data thus obtained is stored in thestorage section 11 as the time-series data 111. Specifically, thedata obtaining section 101 obtains a moving image which is captured by the imaging device 3 shown inFig. 2 and which is indicative of a combustion state of the waste in the incinerator. Thedata obtaining section 101 obtains the time-series data 111 by extracting, from the moving image, frame images at a given sampling cycle. Note that thedata obtaining section 101 may resize the frame images and deal with them as the time-series data 111. - The transforming
section 102 transforms the time-series data 111 into frequency-domain data (which can also be called a "frequency component"). For example, the transformingsection 102 may transform the time-series data 111 into the frequency-domain data by subjecting the time-series data 111 to discrete Fourier transform (DFT) or fast Fourier transform (FFT). - The
reconfiguration section 103 generates reconfiguration data by reconfiguring time-series data 111 from part of frequency components of the time-series data 111. Specifically, in subjecting the frequency-domain data generated by the transformingsection 102 to inverse transformation so as to turn the frequency-domain data into time-domain data again, thereconfiguration section 103 generates reconfiguration data by using only part of the frequency-domain data rather than by using all of the frequency-domain data. This process can be regarded as a process of removing an unnecessary frequency component or a process of extracting a necessary frequency component. - The
analysis section 104 carries out spatio-temporal analysis on the reconfiguration data generated by thereconfiguration section 103, so as to generate a dynamic model indicative of a change of the analysis target phenomenon in a temporal direction and a spatial direction. The dynamic model thus generated is stored in thestorage section 11 as thedynamic model 112. As discussed above, in the example described in the present embodiment, thedynamic model 112 is a model indicative of a change of the combustion state of the waste in the incinerator, the change being observed in a temporal direction and a spatial direction. - The
inference section 105 carries out inference about the analysis target phenomenon in the plant with use of thedynamic model 112. In the example described in the present embodiment, theinference section 105 generates, with use of thedynamic model 112, a prediction image indicative of a future combustion state of the waste in the incinerator. - As discussed above, the
information processing device 1 includes thereconfiguration section 103 and theanalysis section 104. Thereconfiguration section 103 generates the reconfiguration data by reconfiguring time-series data 111 from part of frequency components of the time-series data 111 obtained as a result of observation of the analysis target phenomenon in the plant. Theanalysis section 104 carries out spatio-temporal analysis on the reconfiguration data to generate thedynamic model 112 indicative of a change of the phenomenon in a temporal direction and a spatial direction. - The above configuration does not carry out spatio-temporal analysis on analysis-target time-series data as it is, but carries out spatio-temporal analysis on reconfiguration data which is obtained by reconfiguring time-series data from part of frequency components thereof. Thus, as compared to the configuration that carries out spatio-temporal analysis on the analysis-target time-series data as it is, the above configuration can generate, with a smaller operation amount, a dynamic model in which a change of the analysis target phenomenon in a temporal direction and a spatial direction is accurately reflected.
- Further, the
information processing device 1 includes theinference section 105 that carries out inference about the analysis target phenomenon with use of thedynamic model 112. Consequently, it is possible to obtain a high-accuracy inference result provided by thedynamic model 112 in which a change of the part of the frequency components in a temporal direction and a spatial direction is accurately reflected. Note that there is no particular limitation on the content of the inference. For example, theinference section 105 may generate a prediction image indicative of a future combustion state of the waste. Further, theinference section 105 may analyze the generated prediction image so as to classify the future combustion state of the waste. - The following will describe an overview of an analysis method in accordance with the present embodiment with reference to
Fig. 3. Fig. 3 is a view illustrating an overview of the analysis method in accordance with the present embodiment. The analysis method in accordance with the present embodiment carries out spatio-temporal analysis by dynamic mode decomposition (DMD).Fig. 3 illustrates the time-series data 111, agraph group 31 indicative of frequency components, and animage group 32 indicative of dynamic modes derived through DMD. The time-series data 111 is frame images extracted from a moving image obtained by imaging an inside of the incinerator. Further, thegraph group 31 indicative of the frequency components can be obtained by transforming the time-series data 111 into a frequency domain. -
Graphs 31a to 31c included in thegraph group 31 indicate respective different frequency components. Of the frequency components indicated by the three graphs, a frequency component indicated by thegraph 31a is located closer to a low frequency side than any other ones, and a frequency component indicated by thegraph 31c is located closer to a high frequency side than any other ones. In the moving image obtained by imaging the inside of the incinerator, a change such as flickering flame appears as a high-frequency component and a change of the combustion position appears as a low-frequency component. In monitoring of the waste incineration plant, a frequency component located closer to a low frequency side, which frequency component indicates a change over a relatively long period, for example, 10 minutes or longer, is important. - Images included in the
image group 32 indicate, as images of the inside of the incinerator, the dynamic modes derived through DMD.Fig. 3 shows graphs indicating waveforms of the dynamic modes such that the waveforms are associated with the respective images. In this manner, DMD analyzes the analysis target phenomenon by decomposing the time-series data 111 into a plurality of dynamic modes. This analysis method will be described below. - According to DMD, time-series changes of data are indicated by a linear operator A, as shown in Mathematical Expression (1) indicated below. That is, a state xk+1 at a time point k+1 is represented by a product of (i) a state xk at a time point k, which is immediately before the time point k+1, and (ii) the linear operator A. For example, in a case where the time-
series data 111 is frame images extracted from a moving image as in the case shown inFig. 3 , "xk" shown below denotes a vector indicative of pixel values (e.g., RGB values) of the frame images, "K" shown below denotes the number of the frame images, and "P" shown below denotes resolutions of the respective frame images.

- Then, as shown in Mathematical Expression (2) indicated below, DMD derives an operator A that minimizes an error between snapshot matrices "X1 = [x1, ... , xk-1]" and "X2 = [x2, ... , xk]", which are shifted from each other by one in time-series order. Note that a snapshot is a vector indicative of a state at a certain time. Further, "F" denotes the Frobenius norm.

- "A" indicated above can be calculated by the least-squares method, as shown in Mathematical Expression (3) indicated below. Note that, in Mathematical Expression (3), the symbol located at the upper right of X1 represents a Moore-Penrose pseudo-inverse matrix.

- DMD derives an eigenvalue and an eigenvector of A by carrying out eigendecomposition of the operator A (details thereof will be omitted). The eigenvector of A is the dynamic mode. As indicated by the
image group 32 shown inFig. 3 , multiple dynamic modes are calculated from the time-series data 111. - Here, as discussed above, the
graph group 31 shown inFig. 3 indicates frequency components of the time-series data 111. Of the graphs included in thegraph group 31, thegraphs 31a to 31c indicate frequency components respectively corresponding to the dynamic modes of theimages 32a to 32c included in theimage group 32. Thus, there is a correspondence relation between (i) the frequency components obtained by subjecting the time-series data 111 to fast Fourier transform or discrete Fourier transform and (ii) the dynamic modes calculated by DMD. - As the number N of dynamic modes to be calculated increases, the operation amount of DMD increases. Thus, the analysis method in accordance with the present embodiment generates reconfiguration data by reconfiguring time-
series data 111 from part of frequency components of the time-series data 111. For example, in order to work out, among the dynamic modes indicated by theimage group 32, a dynamic mode indicated by theimage 32b, reconfiguration data is generated with use of a frequency component corresponding to, among the graphs included in thegraph group 31, thegraph 31b corresponding to the image 32B. This makes it possible to calculate, among the dynamic modes indicated by theimage group 32, only the dynamic mode indicated by theimage 32b quickly and with a small operation amount. - Specifically, according to the analysis method in accordance with the present embodiment, the transforming
section 102 first transforms the time-series data 111 into frequency-domain data. Here, in a case where a measurement target at each time step includes an element P, "xk" in Mathematical Expression (1) is as indicated below.
- On the basis of xk above, sampling is carried out with a sampling frequency fs, so as to yield one-dimensional time-series data indicated below.

- Assuming that the sampling frequency is s = [0, 1, 2, ... , (K-1)]/fs, the one-dimensional time-series data is transformed into frequency-domain data where J = K. Then, the following result is obtained.

- Further, each frequency component y j is represented by a weighted sum of all the elements included in x, that is, Mathematical Expression (4) below.

- The transforming
section 102 may transform the time-series data 111 into frequency-domain data according to Mathematical Expression (4) indicated above, for example. This transform is similar to general discrete Fourier transform. - Subsequently, the
reconfiguration section 103 carries out, according to, e.g., Mathematical Expression (5) indicated below, inverse transformation of the frequency-domain data obtained as a result of the above transformation, so as to turn the frequency-domain data into the image again. This provides reconfiguration data corresponding to part of the frequency components of the time-series data 111. The reconfiguration data is identical to the original time-series data 111 in the number of pixels and the size; however, the reconfiguration data does not include information about part of the frequency components. Thus, it can be said that the reconfiguration data is lower-rank approximate data of the original time-series data 111.
- Mathematical Expression (5) indicated above is a general mathematical expression of inverse Fourier transform to which ζ is added. As indicated below, ζ denotes an indicator function for determining whether to incorporate certain yj into the reconfiguration data. Further, τ denotes information indicative of domain knowledge relating to a task. Specifically, τ denotes a frequency relating to a task, and τ = {τ1, τ2, ... ,τD}. The task in the present embodiment is generating a dynamic model indicative of a change of an analysis target phenomenon in a plant, the change being observed in a temporal direction and a spatial direction over a relatively long period (for example, 10 minutes or longer).

- Only one piece of task-related frequency information τ may be set. Alternatively, a plurality of pieces of task-related frequency information τ may be set. For example, in the example shown in
Fig. 3 , when τ indicative of the frequency component indicated in thegraph 31b is set, the dynamic mode corresponding to theimage 32b is calculated. When τs (three τs in total) respectively corresponding to the frequency components indicated in thegraphs 31a to 31c are set, the dynamic modes corresponding to theimages 32a to 32c are calculated. - A value of the task-related frequency information τ may be determined in advance according to an analysis target phenomenon. For example, the value of τ may be set on the basis of an operation period of equipment which is operating in the plant. In the incinerator of the waste incineration plant, the fire grate is operating periodically. Thus, the operation period of the fire grate may be used as a reference. Then, a frequency component higher than the operation period may not be used, and a frequency component lower than the operation period may be used. The inventors of the present invention succeeded in precise estimation of a state of the inside of the incinerator in an experiment where τ = 300-1 Hz.
- In the above-described manner, the
reconfiguration section 103 may generate reconfiguration data from a frequency component(s) selected on the basis of an operation period of equipment that is operating in the plant. With this, it is possible to generate reconfiguration data from a suitable frequency component(s) selected in consideration of operation of the equipment in the plant. - Note that the process of determining the task-related frequency information τ on the basis of the operation period of the equipment that is operating in the plant may be carried out by a user of the
information processing device 1 or by theinformation processing device 1. In the latter case, theinformation processing device 1 accepts input of the operation period of the equipment, and automatically sets a value of τ according to the operation period thus input. Further, in a case where the operation period of the equipment that is operating in the plant is changed, thereconfiguration section 103 may update τ to a value corresponding to the changed operation period. - The reconfiguration data generated by the above process is expressed as below.

- Then, the
analysis section 104 calculates an eigenvalue and an eigenvector of the operator A through DMD using the above reconfiguration data. In this case, Mathematical Expression (3) indicated above can be rewritten into the one as indicated below.
- The
dynamic model 112 generated by theanalysis section 104 can be represented by Mathematical Expression (6) indicated below using an eigenvalue Λt and an eigenvector (dynamic mode) Φ calculated through DMD. Note that b denotes an amplitude of the corresponding dynamic mode. Since the eigenvalue, eigenvector, and amplitude indicated in Mathematical Expression (6) are calculated with use of the task-related frequency information τ, τ is added to each of the characters corresponding thereto.
- After the
dynamic model 112 indicated by Mathematical Expression (6) indicated above is generated in the above-described manner, theinference section 105 can predict a state xt at an arbitrary time t by using thedynamic model 112. - As discussed above, learning in DMD is completed when the eigenvalue and the eigenvector of the operator A are calculated. Thus, as compared to a machine learning technology that requires a large amount of training data such as a neural network, the above configuration is advantageous in that the above configuration requires less time and effort for collection of data for training and labeling of data for training. Further, the above configuration is also advantageous in that the above configuration is applicable to modeling of a phenomenon for which it is difficult to collect a large amount of training data.
- The following will describe, with reference to
Fig. 4 , an example where the above-described process is applied to the time-series data 111 extracted from the moving image obtained by imaging the inside of the incinerator.Fig. 4 is a view illustrating an example in which adynamic model 112 is generated from the time-series data 111 extracted from the moving image obtained by imaging the inside of the incinerator and a prediction image is generated on the basis of the generateddynamic model 112. - In the example shown in
Fig. 4 , time-series data 111 constituted by k frame images x1 to xk is used as input data. The transformingsection 102 transforms each of x1 to xk included in the time-series data 111 into frequency-domain data through Fourier transform (e.g., FFT). Then, thereconfiguration section 103 reconfigures, through inverse Fourier transform (e.g., inverse FFT), time-series data 111 from part of frequency components included in the frequency-domain data. The above frequency components are frequency components extracted on the basis of the task-related frequency information τ. Fourier transform may be carried out according to Mathematical Expression (4) indicated above, and inverse Fourier transform may be carried out according to Mathematical Expression (5) indicated above. - Subsequently, the
analysis section 104 carries out spatio-temporal analysis on the reconfiguration data through DMD, so as to derive a dynamic mode Φ and an eigenvalue Λ. Assuming that τ used for the calculation is τ = {τ1, τ2, ... , τD}, resulting dynamic modes are D dynamic modes Φ = {Φ1, Φ2, ... , ΦD}.Fig. 4 shows animage 41 including imaged dynamic modes. - As a result of calculating the eigenvalue A and the dynamic modes Φ in the above-described manner, the
dynamic model 112 indicated by Mathematical Expression (6) is generated. In the example shown inFig. 4 , theinference section 105 uses thedynamic model 112 to generate a prediction image 42 indicating states of the inside of the incinerator at the time t and thetime t+ 1. - The prediction image 42 indicates a state at a point of time later than those of the pieces of time-series data 111 x1 to xk having been used to calculate the eigenvalue and the dynamic modes, that is, a future state of the incinerator. As long as the trend of the state change of the incinerator is maintained, prediction with use of the calculated eigenvalue and dynamic modes is effective. When a change occurs in the trend of the state change, an eigenvalue and dynamic modes may be calculated again with use of time-
series data 111 obtained after occurrence of the change. - Note that use of the
dynamic model 112 makes it possible to generate a prediction image at a point of time when the time-series data 111 is observed. Further, by comparing (i) a sequence generated with use of the prediction image, that is, thedynamic model 112 with (ii) a sequence of the time-series data 111 at the corresponding point of time, that is, the original sequence, it is possible to evaluate prediction precision. The inventors of the present application conducted an experiment and confirmed that the above configuration can generate a prediction image with adequate precision sufficient for practical use. - The prediction image is discrete data. However, by generating time-series prediction images, it is possible to predict, on the basis of these prediction images, a speed at which the state change takes place. Further, according to DMD, information (temporal dynamics) indicative of the periodicity of changes of each dynamic mode is calculated. It can be said that this periodicity indicates a speed of the changes.
- The following will describe, with reference to
Fig. 5 , a flow of the process (analysis method) executed by theinformation processing device 1.Fig. 5 is a flowchart illustrating an example of the process executed by theinformation processing device 1. - In S11, the
data obtaining section 101 obtains a moving image indicative of a combustion state of a waste in an incinerator, the moving image being captured by the imaging device 3. Then, in S12, thedata obtaining section 101 obtains time-series data by extracting frame images from the moving image obtained in S11, and stores it as time-series data 111 in thestorage section 11. - In S13, the transforming
section 102 transforms the time-series data 111 stored in S12 into frequency-domain data. This transform may be carried out with use of Mathematical Expression (4) indicated above, for example. - In S14 (reconfiguration step), the
reconfiguration section 103 generates reconfiguration data by reconfiguring time-series data 111 from part of frequency components constituting the frequency-domain data obtained as a result of the conversion carried out in S13. This reconfiguration may be carried out with use of Mathematical Expression (5) indicated above, for example. This reconfiguration uses task-related frequency information τ indicative of the frequency component(s) to be used. - In S15 (analysis step), the
analysis section 104 carries out spatio-temporal analysis on the reconfiguration data generated in S14, so as to generate adynamic model 112. For example, theanalysis section 104 may generate adynamic model 112 expressed by Mathematical Expression (6) by calculating an eigenvalue and an eigenvector of the operator A in Mathematical Expression (3)' indicated above. - In S16, the
inference section 105 carries out inference about the analysis target phenomenon in the plant with use of thedynamic model 112 generated in S15. For example, theinference section 105 may use thedynamic model 112 expressed by Mathematical Expression (6) to predict a state xt at an arbitrary time t. Then, the process shown inFig. 5 is ended. Note that, after S16, thecontrol device 2 may control the equipment in the plant on the basis of a result of the inference carried out in S16. A kind of equipment to be subjected to control and a kind of the control to be carried out in association with a certain inference result may be determined in advance. - As discussed above, the analysis method in accordance with the present embodiment includes the reconfiguration step (S14) and the analysis step (S15). The reconfiguration step (S14) generates reconfiguration data by reconfiguring time-
series data 111 from part of frequency components of the time-series data 111 obtained as a result of observation of the analysis target phenomenon in the plant. The analysis step (S15) carries out spatio-temporal analysis on the reconfiguration data to generate thedynamic model 112 indicative of a change of the analysis target phenomenon in a temporal direction and a spatial direction. Consequently, it is possible to generate, with a relatively small operation amount, thedynamic model 112 in which the change of the analysis target phenomenon in a temporal direction and a spatial direction is accurately reflected. - Every time time-
series data 111 is added, thereconfiguration section 103 may generate reconfiguration data from the time-series data 111 thus added. Then, theanalysis section 104 updates thedynamic model 112 with use of the reconfiguration data thus generated. Theinference section 105 may carry out inference about the analysis target phenomenon with use of the updateddynamic model 112. This makes it possible to output a result of the inference in real time or at an early timing which is almost real-time. - In this case, the
analysis section 104 may generate and update thedynamic model 112 with use of a technique called streaming DMD, for example. The streaming DMD is a technique for updating thedynamic model 112 every time a new snapshot becomes available. Details of the process are described in, for example, "Dynamic Mode Decomposition for Large and Streaming Datasets" (Maziar S. Hemati et al.), Physics of Fluids, vol. 26, no. 11, p. 111701, 2014. - The following will describe, with reference to
Fig. 6 , a flow of the process (analysis method) executed by theinformation processing device 1 in order to carry out the above-described process.Fig. 6 is a flowchart illustrating another example of the process executed by theinformation processing device 1. Note that the same processes as those inFig. 6 are given the same reference signs. Explanations of such processes are omitted. - In S15A, the
analysis section 104 carries out spatio-temporal analysis on the reconfiguration data generated in S14, so as to generate adynamic model 112. For example, theanalysis section 104 generates thedynamic model 112 through the above-described streaming DMD. In a case where there exists an already-generateddynamic model 112, theanalysis section 104 updates the already-generateddynamic model 112 with use of reconfiguration data generated in S14 carried out last time. - In S17A, the
data obtaining section 101 determines whether to end the analyzing process. If it is determined that the analyzing process is to be ended at this point (YES in S17A), the analyzing process is ended. Meanwhile, if it is determined that the analyzing process is not to be ended (NO in S17A), the process returns to S11. Consequently, during capturing of a moving image, it is possible to output the latest inference result in real time or at an early timing which is almost real-time. Note that there is no particular limitation on the end condition in S17A. For example, the end condition may be ending of capturing of the moving image. - The description of the above-described embodiment has mainly dealt with the example in which the
dynamic model 112 indicative of the combustion state of the waste inside the incinerator of the waste incineration plant is generated. As another application example of the present invention, it is also possible to generate a dynamic model indicative of another phenomenon in the waste incineration plant. Alternatively, it is also possible to generate a dynamic model indicative of a phenomenon in a plant other than the waste incineration plant. - For example, in a plant for carrying out a sludge treatment, a process of adding a flocculant to sludge, stirring the resultant mixture, and separating a solid from the sludge is carried out. In this process, by analyzing an image of a stirred state of the sludge by the analysis method described in the above embodiment, it is possible to generate a dynamic model indicative of a change of the state of the sludge in a temporal direction and a spatial direction. Use of such a dynamic model makes it possible to predict a future state of the sludge and to appropriately control, on the basis of the prediction result, a timing to add the flocculant and an amount of the flocculant to be added. In this case, the task-related frequency information τ may be set at a value corresponding to an operation period of a stirring device that stirrers the sludge, for example.
- Any entity can execute each of the processes described in the above-described embodiment, and is not limited to the one in the above examples. For example, of the processes shown in
Fig. 5 , the processes in S13 to S15 may be executed by another device (for example, a cloud server) separated from theinformation processing device 1. In this case, theinformation processing device 1 may transmit time-series data to said another device and obtain a dynamic model generated by said another device. As discussed above, the analysis method in accordance with the present embodiment may be executed by a singleinformation processing device 1 or a plurality of information processing devices. - In the
control system 7 shown inFig. 2 , theinformation processing device 1 and thecontrol device 2 are separated from each other. Alternatively, a single device in which theinformation processing device 1 and thecontrol device 2 are integrated together may provide a similar function to that of thecontrol system 7. - The description of the above embodiment has dealt with DMD and streaming DMD as examples of the technique for spatio-temporal analysis. However, the technique for spatio-temporal analysis applicable to the present invention is not limited to these examples.
- The description of the above embodiment has dealt with the example in which the frame images extracted from the moving image are used as the time-series data. However, the time-series data used in the present invention is not limited to this example, as long as the time-series data is the one obtained as a result of observation of the analysis target phenomenon in the plant. For example, the time-series data may be measurement values supplied from various sensors disposed in various places in the plant. In this case, generated is a dynamic model indicative of a change of an analysis target phenomenon in a temporal direction and a spatial direction, the change corresponding to the spatial positions of the various sensors and the measurement values of the various sensors.
- The functions of the
information processing device 1 may be realized by an analysis program for causing a computer to function as theinformation processing device 1, the analysis program causing the computer to function as each of the control blocks (particularly, the sections included in the control section 10) of theinformation processing device 1. - In this case, the
information processing device 1 includes, as hardware for executing the analysis program, a computer including at least one control device (e.g., a processor) and at least one storage device (e.g., a memory). The control device and the storage device execute the analysis program, so that the functions described in the above embodiment are implemented. - The analysis program may be stored in one or more non-transitory storage media each of which can be read by the computer. This storage medium may or may not be provided in the
information processing device 1. In the latter case, the analysis program can be supplied to the device via any transmission medium such as a wired transmission medium or a wireless transmission medium. - A part of or all of the functions of the control blocks can be realized by a logical circuit. For example, an integrated circuit on which a logical circuit functioning as the control blocks is formed may also be encompassed in the present invention. Further, the functions of the control blocks can be realized by a quantum computer, for example.
- The present invention is not limited to the embodiments, but can be altered by a skilled person in the art within the scope of the claims. The present invention also encompasses, in its technical scope, any embodiment derived by combining technical means disclosed in differing embodiments.
-
- 1: information processing device
- 103: reconfiguration section
- 104: analysis section
- 105: inference section
- 111: time-series data
- 112: dynamic model
- 2: control device
- 7: control system
Claims (7)
- An information processing device comprising:a reconfiguration section that generates reconfiguration data by reconfiguring time-series data from part of frequency components of the time-series data obtained as a result of observation of a phenomenon in a plant which phenomenon is to be analyzed; andan analysis section that carries out spatio-temporal analysis on the reconfiguration data to generate a dynamic model indicative of a change of the phenomenon in a temporal direction and a spatial direction.
- The information processing device according to claim 1, further comprising:
an inference section that carries out inference about the phenomenon with use of the dynamic model. - The information processing device according to claim 2, wherein:every time the time-series data is added, the reconfiguration section generates the reconfiguration data from the time-series data;the analysis section updates the dynamic model with use of the reconfiguration data thus generated; andthe inference section carries out inference about the phenomenon with use of the dynamic model having been updated.
- The information processing device according to any one of claims 1 to 3, wherein:
the reconfiguration section generates the reconfiguration data from a frequency component selected on a basis of an operation period of equipment that is operating in the plant. - An analysis method that is executed by one or more information processing devices, the analysis method comprising:a reconfiguration step of generating reconfiguration data by reconfiguring time-series data from part of frequency components of the time-series data obtained as a result of observation of a phenomenon in a plant which phenomenon is to be analyzed; andan analysis step of carrying out spatio-temporal analysis on the reconfiguration data to generate a dynamic model indicative of a change of the phenomenon in a temporal direction and a spatial direction.
- A control system comprising:an information processing device recited in claim 2; anda control device that controls equipment in the plant on a basis of a result of the inference.
- An analysis program for causing a computer to function as an information processing device recited in claim 1, the analysis program causing the computer to function as the reconfiguration section and the analysis section.
Applications Claiming Priority (2)
| Application Number | Priority Date | Filing Date | Title |
|---|---|---|---|
| JP2021215166A JP7829853B2 (en) | 2021-12-28 | 2021-12-28 | Information processing device, analysis method, control system, and analysis program |
| PCT/JP2022/047561 WO2023127715A1 (en) | 2021-12-28 | 2022-12-23 | Information processing device, analysis method, control system, and analysis program |
Publications (2)
| Publication Number | Publication Date |
|---|---|
| EP4459403A1 true EP4459403A1 (en) | 2024-11-06 |
| EP4459403A4 EP4459403A4 (en) | 2025-12-24 |
Family
ID=86999146
Family Applications (1)
| Application Number | Title | Priority Date | Filing Date |
|---|---|---|---|
| EP22915938.9A Pending EP4459403A4 (en) | 2021-12-28 | 2022-12-23 | INFORMATION PROCESSING DEVICE, ANALYSIS METHOD, CONTROL SYSTEM AND ANALYSIS PROGRAM |
Country Status (4)
| Country | Link |
|---|---|
| EP (1) | EP4459403A4 (en) |
| JP (1) | JP7829853B2 (en) |
| CN (1) | CN118475891A (en) |
| WO (1) | WO2023127715A1 (en) |
Families Citing this family (1)
| Publication number | Priority date | Publication date | Assignee | Title |
|---|---|---|---|---|
| WO2025115335A1 (en) * | 2023-11-27 | 2025-06-05 | 東京エレクトロン株式会社 | Computer program, information processing method, and information processing device |
Family Cites Families (12)
| Publication number | Priority date | Publication date | Assignee | Title |
|---|---|---|---|---|
| US6862562B1 (en) * | 1999-10-05 | 2005-03-01 | Aspen Technology, Inc. | Computer method and apparatus for determining state of physical properties in a chemical process |
| JP2008065393A (en) | 2006-09-04 | 2008-03-21 | Research Organization Of Information & Systems | Group discrimination device and group discrimination method |
| US20130179128A1 (en) * | 2012-01-05 | 2013-07-11 | General Electric Company | System And Method For Selecting A Representative Sensor Set Of A Power Plant |
| US10417353B2 (en) * | 2013-06-14 | 2019-09-17 | Wallace LARIMORE | Method and system of dynamic model identification for monitoring and control of dynamic machines with variable structure or variable operation conditions |
| JP6542735B2 (en) * | 2016-09-28 | 2019-07-10 | ファナック株式会社 | Management system, spindle failure detection method and computer program |
| JP2018155411A (en) | 2017-03-15 | 2018-10-04 | 三菱重工業株式会社 | Stoker type incinerator |
| JP7308476B2 (en) * | 2019-02-28 | 2023-07-14 | 国立大学法人 奈良先端科学技術大学院大学 | Information processing device, information processing method, and information processing program |
| JP2021076564A (en) | 2019-11-13 | 2021-05-20 | 瀏陽 宋 | Current signal, sequential circulation type statistic information filter, and method and system for diagnosing rotary machine by deep learning |
| CN112015082B (en) * | 2020-05-13 | 2022-04-08 | 东南大学 | A control method of machine-furnace coordination system based on fuzzy gain scheduling predictive control |
| CN112213640B (en) * | 2020-11-17 | 2024-01-26 | 润电能源科学技术有限公司 | A motor fault diagnosis method and related equipment |
| CN112633098B (en) | 2020-12-14 | 2023-05-30 | 华中科技大学 | Method, system and storage medium for fault diagnosis of rotating machinery |
| CN112949491B (en) | 2021-03-02 | 2024-02-09 | 丽水市特种设备检测院 | Hydraulic pump fault analysis method and system based on DMD and t-SNE |
-
2021
- 2021-12-28 JP JP2021215166A patent/JP7829853B2/en active Active
-
2022
- 2022-12-23 EP EP22915938.9A patent/EP4459403A4/en active Pending
- 2022-12-23 CN CN202280086297.0A patent/CN118475891A/en active Pending
- 2022-12-23 WO PCT/JP2022/047561 patent/WO2023127715A1/en not_active Ceased
Also Published As
| Publication number | Publication date |
|---|---|
| JP2023098423A (en) | 2023-07-10 |
| WO2023127715A1 (en) | 2023-07-06 |
| CN118475891A (en) | 2024-08-09 |
| EP4459403A4 (en) | 2025-12-24 |
| JP7829853B2 (en) | 2026-03-16 |
Similar Documents
| Publication | Publication Date | Title |
|---|---|---|
| DE102016012463B4 (en) | A machine learning device and method for learning the expected life of a power device, and life prediction device and motor driving device comprising the machine learning device | |
| US10828775B2 (en) | Method and system for automatic robot control policy generation via CAD-based deep inverse reinforcement learning | |
| US6484133B1 (en) | Sensor response rate accelerator | |
| EP3881245B1 (en) | Hardware accelerator extension to transfer learning - extending/finishing training to the edge | |
| EP3704550B1 (en) | Generation of a control system for a target system | |
| EP3796115B1 (en) | Anomaly detection for robotic arms using vibration data | |
| Ross | Sequential change detection in the presence of unknown parameters | |
| US20220366244A1 (en) | Modeling Human Behavior in Work Environment Using Neural Networks | |
| CN113641525A (en) | Variable anomaly repair method, apparatus, medium and computer program product | |
| Sun et al. | BLDC motor speed control system fault diagnosis based on LRGF neural network and adaptive lifting scheme | |
| Jmal et al. | Adaptive stabilization for a class of fractional-order systems with nonlinear uncertainty | |
| WO2026076963A1 (en) | Tinyml-based motor state monitoring method and apparatus | |
| US20150332152A1 (en) | Systems And Methods For Generating Models For Physical Systems Using Sentences In A Formal Grammar | |
| Hussain et al. | Discovering a data interpreted petri net model of industrial control systems for anomaly detection | |
| WO2023127715A1 (en) | Information processing device, analysis method, control system, and analysis program | |
| Nagarajapandian et al. | Optimal iterative learning PI controller for SISO and MIMO processes with machine learning validation for performance prediction | |
| EP4235507A1 (en) | Automatically quantifying an uncertainty of a prediction provided by a trained regression model | |
| Atia et al. | Synthesis of multi-observers for discrete-time nonlinear systems with delayed output | |
| Hu et al. | Two-stage generalized projection identification algorithms for stochastic systems | |
| Adamiat et al. | Message passing-based Bayesian control of a cart-pole system | |
| Matsuki et al. | Reward-based learning of a memory-required task based on the internal dynamics of a chaotic neural network | |
| TW201935161A (en) | Display data generation apparatus, display data generation method and program | |
| US20250044785A1 (en) | Information processing system | |
| CN114450645A (en) | Intelligent process anomaly detection and trend pre-estimation system | |
| CN115527055A (en) | Data processing method, data processing device, storage medium and electronic equipment |
Legal Events
| Date | Code | Title | Description |
|---|---|---|---|
| STAA | Information on the status of an ep patent application or granted ep patent |
Free format text: STATUS: THE INTERNATIONAL PUBLICATION HAS BEEN MADE |
|
| PUAI | Public reference made under article 153(3) epc to a published international application that has entered the european phase |
Free format text: ORIGINAL CODE: 0009012 |
|
| STAA | Information on the status of an ep patent application or granted ep patent |
Free format text: STATUS: REQUEST FOR EXAMINATION WAS MADE |
|
| 17P | Request for examination filed |
Effective date: 20240624 |
|
| AK | Designated contracting states |
Kind code of ref document: A1 Designated state(s): AL AT BE BG CH CY CZ DE DK EE ES FI FR GB GR HR HU IE IS IT LI LT LU LV MC ME MK MT NL NO PL PT RO RS SE SI SK SM TR |
|
| DAV | Request for validation of the european patent (deleted) | ||
| DAX | Request for extension of the european patent (deleted) | ||
| REG | Reference to a national code |
Ref country code: DE Ref legal event code: R079 Free format text: PREVIOUS MAIN CLASS: G05B0023020000 Ipc: G05B0013040000 |
|
| A4 | Supplementary search report drawn up and despatched |
Effective date: 20251126 |
|
| RIC1 | Information provided on ipc code assigned before grant |
Ipc: G05B 13/04 20060101AFI20251120BHEP Ipc: G05B 17/02 20060101ALI20251120BHEP Ipc: F23N 5/20 20060101ALI20251120BHEP Ipc: F23G 5/50 20060101ALI20251120BHEP Ipc: G05B 23/02 20060101ALI20251120BHEP |