EP4455629A1 - Guided leak source location finder in water distribution network - Google Patents
Guided leak source location finder in water distribution network Download PDFInfo
- Publication number
- EP4455629A1 EP4455629A1 EP23169598.2A EP23169598A EP4455629A1 EP 4455629 A1 EP4455629 A1 EP 4455629A1 EP 23169598 A EP23169598 A EP 23169598A EP 4455629 A1 EP4455629 A1 EP 4455629A1
- Authority
- EP
- European Patent Office
- Prior art keywords
- node
- flow
- nominal
- reservoir
- sub
- Prior art date
- Legal status (The legal status is an assumption and is not a legal conclusion. Google has not performed a legal analysis and makes no representation as to the accuracy of the status listed.)
- Withdrawn
Links
Images


Classifications
-
- G—PHYSICS
- G01—MEASURING; TESTING
- G01M—TESTING STATIC OR DYNAMIC BALANCE OF MACHINES OR STRUCTURES; TESTING OF STRUCTURES OR APPARATUS, NOT OTHERWISE PROVIDED FOR
- G01M3/00—Investigating fluid-tightness of structures
- G01M3/02—Investigating fluid-tightness of structures by using fluid or vacuum
- G01M3/26—Investigating fluid-tightness of structures by using fluid or vacuum by measuring rate of loss or gain of fluid, e.g. by pressure-responsive devices, by flow detectors
- G01M3/28—Investigating fluid-tightness of structures by using fluid or vacuum by measuring rate of loss or gain of fluid, e.g. by pressure-responsive devices, by flow detectors for pipes, cables or tubes; for pipe joints or seals; for valves ; for welds
- G01M3/2807—Investigating fluid-tightness of structures by using fluid or vacuum by measuring rate of loss or gain of fluid, e.g. by pressure-responsive devices, by flow detectors for pipes, cables or tubes; for pipe joints or seals; for valves ; for welds for pipes
-
- E—FIXED CONSTRUCTIONS
- E03—WATER SUPPLY; SEWERAGE
- E03B—INSTALLATIONS OR METHODS FOR OBTAINING, COLLECTING, OR DISTRIBUTING WATER
- E03B7/00—Water main or service pipe systems
- E03B7/003—Arrangement for testing of watertightness of water supply conduits
-
- G—PHYSICS
- G01—MEASURING; TESTING
- G01M—TESTING STATIC OR DYNAMIC BALANCE OF MACHINES OR STRUCTURES; TESTING OF STRUCTURES OR APPARATUS, NOT OTHERWISE PROVIDED FOR
- G01M3/00—Investigating fluid-tightness of structures
- G01M3/02—Investigating fluid-tightness of structures by using fluid or vacuum
- G01M3/26—Investigating fluid-tightness of structures by using fluid or vacuum by measuring rate of loss or gain of fluid, e.g. by pressure-responsive devices, by flow detectors
- G01M3/28—Investigating fluid-tightness of structures by using fluid or vacuum by measuring rate of loss or gain of fluid, e.g. by pressure-responsive devices, by flow detectors for pipes, cables or tubes; for pipe joints or seals; for valves ; for welds
- G01M3/2853—Investigating fluid-tightness of structures by using fluid or vacuum by measuring rate of loss or gain of fluid, e.g. by pressure-responsive devices, by flow detectors for pipes, cables or tubes; for pipe joints or seals; for valves ; for welds for pipe joints or seals
-
- F—MECHANICAL ENGINEERING; LIGHTING; HEATING; WEAPONS; BLASTING
- F17—STORING OR DISTRIBUTING GASES OR LIQUIDS
- F17D—PIPE-LINE SYSTEMS; PIPE-LINES
- F17D5/00—Protection or supervision of installations
- F17D5/02—Preventing, monitoring, or locating loss
- F17D5/06—Preventing, monitoring, or locating loss using electric or acoustic means
Definitions
- the invention relates to the field of water distribution network, particularly to a method for locating a leak in a water distribution network.
- the invention further relates to a program element, to a computer-readable storage medium and to a use.
- a water distribution network may in many cases a complex building. And, stopping water loss through a leak, anywhere in the water distribution network, may be highly desirable. Thus, identifying the position of leaks in water distribution networks may be a basis for a quick and cost-effective intervention aimed at stopping water losses. However, this may be a difficult task since water pipes are in many cases under the ground level and visual inspection may be difficult or not possible at all. Moreover, water networks usually have a limited number of sensors installed, thus data-based techniques often fail to precisely locate the leak position in the network. However, in at least some cases, there may be a chance to collect additional data, e.g. via manual sampling performed by field personnel, to provide additional information on the network status that could be used for locating the leak. Manual sampling is expensive and time consuming, but it is often necessary to compensate the lack of measurements. A method that contributes to minimize a number of manual samplings and to reduce the time between a leak event is reported and its location is identified may be helpful.
- One aspect relates to a computer-implemented method for locating a leak in a water distribution network.
- the method comprises the steps of:
- the water distribution network usually comprises sources, like a reservoir, sinks (e.g. consumers or customers) that are often called demand points, and intermediate components, such as so-called junctions.
- a junction may have several branches.
- the reservoir, the demand points and/or the junctions are connected by means of pipes.
- the water distribution network may comprise further components, for instance one or more tanks and/or pumps.
- the water distribution network may be represented by a directed graph.
- the one or more reservoirs may be represented as reservoir-nodes, the one or more junction may be represented as junction-nodes, and the demand points may be represented as demand-point-nodes, and the pipes may be represented as pipe-edges in said directed graph.
- the components may have properties, which may be represented as attributes of the nodes or edges of the graph.
- the reservoir may have a nominal reservoir flow and a nominal reservoir pressure, which can be measured at its output. (Note, that in this application the term “flow” may be used for "flow rate”.)
- a reservoir is considered as unlimited source of water, where its pressure - often called “head” - is considered as always being equal to a known constant value. Thus, the reservoir pressure is for most cases equal to the nominal reservoir pressure.
- the reservoir flow may be called “nominal reservoir flow” for regular or “fault-free” operation. A leak in the water distribution network may lead to a different (i.e. higher) reservoir flow.
- the reservoir may have means to monitor the reservoir flow.
- the demand points have a nominal demand flow, which can be measured at its input.
- Some of the demand points may have metering devices - e.g. "smart meters" -, but in at least some water distribution networks, there may be no means for measuring the nominal demand flow continuously, and their demand flow may only be available in form of demand forecast and/or historical time-patterns.
- the pipes may have a friction loss, e.g. per meter or for a defined section, e.g. between two nodes.
- the water distribution network may be partitioned into a plurality of district metered areas, DMAs. At least some of the DMAs may have metering devices configured for measuring its DMA-flow on the DMA's at least one inlet point and/or on the DMA's at least one outlet point. Metering devices may also be available at an outlet of pumping stations.
- a calibrated hydraulic model of the water distribution network can be constructed.
- the calibrated hydraulic model may be used to simulate the water distribution network's behaviour under nominal conditions.
- a computed nominal junction flow for each junction-node of the water distribution network may be computed.
- a nominal flow for each node of the water network under nominal conditions may be available, i.e. the calibrated hydraulic model may have "virtual sensors" for all nodes and pipes where no metering or instrumentation is installed.
- the flow may be verified by real measurements and/or possibly corrected.
- a measured reservoir flow is measured on a regular basis or even continuously, an increase of the measured reservoir flow - which may be caused by a leak somewhere in the water distribution network - may be noticed quite fast. If, for at least one of the reservoir-nodes, the measured reservoir flow is greater than the nominal reservoir flow plus a first predefined flow, a leak-locating subroutine may be started.
- Said subroutine may comprise taking, in downstream direction, a junction-node with two or more branches. The leak could be in any one of these branches. So, a next junction-node, in downstream direction, is selected, which is connected to the junction-node. At this selected next junction-node in downstream direction, a measured next junction flow is obtained.
- the leak-locating subroutine may be continued in this branch.
- the leak-locating subroutine - of taking, selecting, and measuring - may be continued in this branch.
- the second predefined flow may, e.g., be the same as the first predefined flow, or may be slightly smaller. If the measured next junction flow is (essentially) equal to the computed nominal next junction flow, the leak is not in that branch, so that another branch should be selected for measuring.
- the measured next junction flow may be (essentially) equal to the computed nominal next junction flow, so that an inference is possible that the leak is probably in an area of the node before.
- the method comes to a final node, i.e. a demand-point-node, so that an inference is possible that the leak is probably in an area of this final node.
- the leak is located based on the measured next junction flow.
- this method may contribute essentially to locating a leak in a water distribution network, thus accelerating the leak locating process. Further advantageously, this computer-aided method can be used for guiding service personnel through the water distribution network, thus reducing the number of measurements required for finding the leak. This method may be particularly advantageous for water distribution network, which have only few metering devices installed.
- the selecting of the next junction-node is done in a breadth-first manner and/or based on a sensitivity analysis.
- the selecting and measuring may only be done, until a branch with higher flow has been found.
- This may be combined with a sensitivity analysis - e.g. the one described below - to identify which nodes will bring more relevant information towards the determination of the leak location. This approach advantageously may further reduce the number of measurements required for finding the leak.
- the measuring of the selected next junction-node is done by a temporary measuring device.
- the temporary measuring device may, e.g., be brought by service personnel.
- the service personnel may be instructed by this method, particularly by the computed "selecting" step.
- the finding process may further be accelerated.
- the nodes of the graph further comprise at least one tank-node, which represents a tank, for which, under nominal conditions, a nominal tank flow and a nominal tank pressure for the tank-node is provided, and the constructing of the calibrated hydraulic model of the water network is further based on the nominal tank flow and the nominal tank pressure for the tank-node.
- the edges of the graph further comprise at least one pump-edge, which represents a pump, and the constructing of the calibrated hydraulic model of the water network is further based on the nominal pump flow for the pump-edge.
- the pump may have an own metering device, so that the calibration of the model can be improved and/or less measurements may be required for locating the leak.
- the nominal demand flow for the at least one demand-point-node is obtained by a demand forecast, by a historical time-pattern, and/or by a metering device at an input of the demand-point-node.
- the water distribution network is partitioned into a plurality of district metered areas, DMAs, wherein a DMA-flow is measured on the DMA's at least one inlet point and/or on the DMA's at least one outlet point.
- the partitioning of water distribution network into DMAs where the input and/or output flow is measured may further accelerate the leak finding process, since a preliminary computer-aided procedure may be performed, e.g. in parallel, for all DMAs.
- Said procedure may comprise a computation of the flow balance for each DMA, meaning that the difference between the input flow and the output flow of a DMA may be compared to the sum of the nominal demand of all DMA's demand-point-nodes, plus the flow provided by reservoirs and/or tanks that may be part of said DMA, minus the flow consumed by other sink-nodes that may be part of the DMA. If said quantities are similar enough, meaning that their numerical difference is smaller than a predefined value, the DMA may be marked as fault-free, otherwise a leak may be present in the considered DMA and the described leak-finding procedure may be performed "inside" the DMA.
- This preliminary routine advantageously may narrow the network area where the leak may be, and may further reduce the time required for finding and/or isolating the leak.
- the calibrated hydraulic model of the water distribution network is further based on flow balance of the at least one junction-node and/or on friction losses in the at least one pipe-edge, and on the nominal reservoir flow and the nominal reservoir pressure for each reservoir-node.
- a discrete time model may be used, where the considered time horizon is divided into T equidistant intervals, indexed by t ⁇ ⁇ 1, ..., T ⁇ .
- the water distribution network may then be described by a quasi-stationary, discrete-time hydraulic model, describe by the following equations adopted to model the various network elements.
- Tank-nodes N t are modelled via a discrete-time flow and mass balance equation: where A n represents the cross-section area of the tank, and E in ( n ) and E out ( n ) are respectively the set of incoming and outgoing links for node n .
- the demand d nt is positive if the water flow is leaving the network at node n , and it is fixed to zero for nodes having no demands.
- Friction losses in pipe-edges E pi may generically be described using a formula expressing the head loss as a function of the flow and of the pipe resistance coefficient where B is the generic flow exponent.
- B is the generic flow exponent.
- Different headloss expressions are available, and Hazen-Williams and Darcy-Weissbach formulas are among the most widely adopted both in industry and literature [5], [7].
- Hazen-Williams formula (4) becomes: where L e and d e are respectively the pipe length and diameter, and C e is the Hazen-Williams pipe roughness coefficient.
- the pump's head increase ⁇ h pt for fixed-speed pumps is obtained by the head-flow characteristic diagrams of the pump, given the flow defined by the network current operating point.
- the pump characteristic curves are defined by a number of operating points provided by the pump constructor of measured by dedicated "experiments”.
- G ( N, E ) representing the water network pumps are modelled as links, we obtain the following equation:
- the reservoir-node, the junction-node, and/or the demand-point-node are attributed with an address.
- the address may be a regular address - i.e. "house in a town" -, a GPS coordinate, or other kind of addresses. This may advantageously accelerate the finding of the next junction-node.
- An aspect relates to a computer program product comprising instructions, which, when is executed by a computer and/or a controller, cause the computer and/or controller to carry out the method according any one of the preceding claims.
- An aspect relates to a computer-readable storage medium where a computer program or a computer program product as described above is stored on.
- An aspect relates to a use of the calibrated hydraulic model as described above and/or below for performing a sensitivity analysis of the water distribution network.
- the sensitivity analysis may be beneficial to the selection of which node to examine while branching, since picking the node with higher sensitivity - i.e. with a higher potential information content - could potentially speed up the procedure by providing a "supportive selection method" that may help deciding and/or prioritizing in which order the network branches are examined and the manual sampling is performed.
- the sensitivity analysis may further contribute to install further metering devices in a targeted way, e.g. at selected "next junction-nodes" of high sensitivity.
- Fig. 1 shows schematically a calibrated hydraulic model 11 of a simplified very small exemplary water distribution network 10 according to an embodiment.
- the model 11 comprises a reservoir-node N, on top of Fig. 1 , for instance a water basin able to provide all the necessary water flow at a given pressure.
- the reservoir has a nominal reservoir flow f, and a nominal reservoir pressure p r for the reservoir-node N r .
- the circles N j1 - N j4 represent junctions, i.e. nodes of the graph defined in the previous Section.
- the double-circles N d1 - N d4 represent demand-points, i.e. consumers of the water.
- the edges between the circles N ji and the double-circles N di are pipe-edges E pi , which represent pipes.
- the pipes satisfy given water demands of the demand points or consumers N j1 - N j4 , here a nominal demand flow f d1 - f d4 of 1 litre per second (l/s) each.
- the circles N j1 - N j4 are connected by pipes with nominal flows between 4 l/s and 1 l/s.
- effects of pressure, elevation and pressure losses in pipes are neglected, and it is assumed that the water flow in the network is driven by the external demands and leakages, so that the reservoir can provide infinite flow if needed, and that the flow is perfectly balanced in all junctions, i.e. the sum of inlet flow equals that of outlet flow.
- Fig. 2 shows schematically the calibrated hydraulic model 11 of Fig. 1 with a leak L from node N j4 .
- the flow rate of this leak L may be 0.5 l/s. It is assumed that a calibrated hydraulic model of the water network of Fig. 1 is available, which can be used to simulate the network behaviour under nominal conditions and obtain "virtual sensors" for all nodes and pipes where no instrumentation is installed.
- Fig. 3 shows schematically the calibrated hydraulic model 11 of Fig. 2 .
- all junctions N j1 - N j4 are provided with metering devices or sensors, represented here as crossed circles ⁇ .
- the leak location finding procedure is straightforward, since by performing a flow balance in every node under nominal demand conditions, the leakage position will correspond to the node where the nominal flowrate results unbalanced.
- demand forecast with related uncertainty bounds instead of a nominal demand, and the described approach is then extended by considering a node as "leaky” if the flow imbalance is greater than a threshold defined as a function of the demand forecast uncertainty region and of the network structure.
- the threshold may be the nominal flow plus a second predefined flow f2 pd .
- q f i is the leak flow for node i
- C i and p i represent respectively the emitter coefficient (function of node and pipes physical properties) and the node pressure
- E in ( i ) and E out ( i ) are the sets of all inlet and outlet pipes connected to i , respectively, and d i is the node demand, i.e. the water flow leaving the node.
- the headloss (pressure loss) ⁇ h e for generic pipe e has the form:
- each real node of the considered water network area is considered as a virtual sensor, if no real measurements are available for that node.
- a sensitivity and covariance analysis is performed, to identify which nodes will bring more relevant information towards the determination of the leak location.
- different leak scenarios are simulated using the network hydraulics model, i.e. one scenario for every real and virtual node in the considered area, where that node is considered to have a leak with flow described by q f i , see above.
- a sensitivity matrix S is computed, where the sensitivity of the pressure difference of every real node in the area to all potential leaks is obtained as:
- s is the number of real network nodes in the area
- p is the number of real and virtual nodes in the area where a potential leak is simulated.
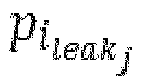
- p i leak j is the simulated pressure at node i for the scenario of a leak at node j
- p i no-leak is the measured or simulated pressure at node i for the scenario with no leak in the network
- s ij is the element at row i and column j of S .
- a node is chosen for manual sampling, e.g. evaluating with a weighted function which node has the highest sensitivity to the greatest number of potential leaks, and a low correlation with the residuals, meaning that it is a node that could bring a significant additional information since it has high sensitivity to leaks and low correlation with already available measurements.
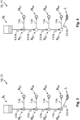
- FIG. 5 (a) - 5 (f) show schematically a calibrated hydraulic model 11 of a further small exemplary water distribution network 10 according to an embodiment.
- All figures Fig. 5 (a) - 5 (f) show the water distribution network 10 with a reservoir-node N r , a pump-edge E pu , a plurality of junction-nodes N j , and a leak L.
- demand-point-nodes N d which may be connected to the junction-nodes N j , are not depicted.
- the model 11 has several branches, for example at node N j1 , with one branch toward nodes N j2 and another branch toward N j3 .
- a leak-locating subroutine may be started.
- the increased flow may be noticed by sensing a measured reservoir flow fm ri that is greater than the nominal reservoir flow f ri plus a first predefined flow f1 pd .
- the leak-locating subroutine may be started by taking, in downstream direction, the junction-node N j1 with two or more branches. Then, in downstream direction, a next junction-node N j2 , which is connected to the junction-node N jk , is selected, as shown in Fig. 5 (b) .
- next junction flow fm j2 (reference sign not shown) is measured.
- the measured next junction flow fm j2 turned out to be the same as the computed next junction flow f j2 of the calibrated hydraulic model 11.
- this branch (of N j2 and following nodes) can be sorted out, i.e. the leak L must be part of the other branch, marked in grey in Fig. 5 (b) .
- the leak-locating subroutine is continued.
- node N j4 is selected. This is a smart selection, because the other two branches are joined at node N j5 .
- measuring node N j4 may give a clearer indication than measuring any of the other branches. Since the branch of N j4 can be sorted out, the next node to be selected and measured is N j5 . N j5 has an increased flow and, thus, this branch is taken; see Fig. 5 (d) . Based on the model 11, e.g. on its sensitivity analysis, the node N j6 is selected and measured; see Fig. 5 (e) . This node N j6 shows no increased flow. Hence, the leak L is probably in the area of the node before; see Fig. 5 (f) . So, the leak L is located based on the measured next junction flow fm j6 .
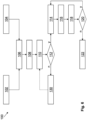
- Fig. 6 shows a flow diagram 100 according to an embodiment, sketching a computer-implemented method for locating a leak L in a water distribution network 10 (see the figures before).
- a directed graph that represents the water distribution network 10 is provided.
- the nodes of the graph comprise at least one reservoir-node N r , at least one junction-node N j , and at least one demand-point-node N d , which represent a reservoir, a junction, and a demand point of the water distribution network 10, respectively.
- the edges of the graph comprise at least one pipe-edge E pi , which represents a pipe.
- a nominal reservoir flow f, and a nominal reservoir pressure p r for each reservoir-node N r , and a nominal demand flow f d for each demand point node N d of the water distribution network 10 is provided.
- a calibrated hydraulic model 11 of the water distribution network 10 is constructed, based on the directed graph, the nominal reservoir flow f r , the nominal reservoir pressure p r , and the nominal demand flow f d for each related node of the water distribution network 10.
- a computed nominal junction flow fm ji for each junction-node N ji of the water distribution network 10 is computed.
- a measured reservoir flow fm is measured. The measurement may be performed on a regular basis or even continuously.
- a decision is taken if, for the at least one reservoir-node N ri , the measured reservoir flow fm ri is greater than the nominal reservoir flow f ri plus a first predefined flow f1 pd . If not, no specific action may be taken (step 130), and the measured reservoir flow fm, may be measured again. If yes, a step 114 is performed, i.e. in downstream direction, a junction-node N jk with two or more branches is taken.
- a next junction-node N jk+1 in downstream direction is selected, the junction-node N jk+1 being which is connected to the junction-node N jk .
- a measured next junction flow fm jk+1 of the selected next junction-node N jk+1 in downstream direction is measured.
- the steps of taking 114, selecting 116, and measuring 118 are continued, while the measured next junction flow fm jk+1 in the selected branch is greater than the computed next junction flow f jk+1 plus a second predefined flow f2 pd .
- the leak L is located based on the measured next junction flow fm jk+1 .
Landscapes
- Physics & Mathematics (AREA)
- General Physics & Mathematics (AREA)
- Health & Medical Sciences (AREA)
- Life Sciences & Earth Sciences (AREA)
- Engineering & Computer Science (AREA)
- Hydrology & Water Resources (AREA)
- Public Health (AREA)
- Water Supply & Treatment (AREA)
- Examining Or Testing Airtightness (AREA)
Abstract
The invention relates to the field of water distribution network, particularly to a method for locating a leak in a water distribution network. The method comprises the steps of: Providing a directed graph that represents the water distribution network (10), the nodes of the graph comprising at least one reservoir-node (N<sub>r</sub>), at least one junction-node (N<sub>j</sub>), and at least one demand-point-node (N<sub>d</sub>).Providing, under nominal conditions, a nominal reservoir flow (f<sub>r</sub>) and a nominal reservoir pressure (p<sub>r</sub>), and a nominal demand flow (f<sub>d</sub>).Constructing a calibrated hydraulic model (11).Computing, for the calibrated hydraulic model (11), a computed nominal junction flow (fm<sub>ji</sub>) for each junction-node (N<sub>ji</sub>) of the water distribution network (10).Measuring, a measured reservoir flow (fm<sub>r</sub>); and, if, for at least one of the reservoir-nodes (N<sub>ri</sub>), the measured reservoir flow (fm<sub>ri</sub>) is greater than the nominal reservoir flow (f<sub>ri</sub>) plus a first predefined flow (f1<sub>pd</sub>):measuring a measured next junction flow (fm<sub>jk+1</sub>) of a selected next junction-node (N<sub>jk+1</sub>) in downstream direction, while the measured next junction flow (fm<sub>jk+1</sub>) in the selected branch is greater than the computed next junction flow (f<sub>jk+1</sub>) plus a second predefined flow (f2<sub>pd</sub>).
Description
- The invention relates to the field of water distribution network, particularly to a method for locating a leak in a water distribution network. The invention further relates to a program element, to a computer-readable storage medium and to a use.
- A water distribution network may in many cases a complex building. And, stopping water loss through a leak, anywhere in the water distribution network, may be highly desirable. Thus, identifying the position of leaks in water distribution networks may be a basis for a quick and cost-effective intervention aimed at stopping water losses. However, this may be a difficult task since water pipes are in many cases under the ground level and visual inspection may be difficult or not possible at all. Moreover, water networks usually have a limited number of sensors installed, thus data-based techniques often fail to precisely locate the leak position in the network. However, in at least some cases, there may be a chance to collect additional data, e.g. via manual sampling performed by field personnel, to provide additional information on the network status that could be used for locating the leak. Manual sampling is expensive and time consuming, but it is often necessary to compensate the lack of measurements. A method that contributes to minimize a number of manual samplings and to reduce the time between a leak event is reported and its location is identified may be helpful.
- It is an objective of the invention to provide a method that contributes to locating a leak in a water distribution network. This objective is achieved by the subject-matter of the independent claims. Further embodiments are evident from the dependent claims and the following description.
- One aspect relates to a computer-implemented method for locating a leak in a water distribution network. The method comprises the steps of:
- providing a directed graph that represents the water distribution network, the nodes of the graph comprising at least one reservoir-node, at least one junction-node, and at least one demand-point-node, which represent a reservoir, a junction, and a demand point of the water distribution network, respectively, the edges of the graph comprising at least one pipe-edge, which represents a pipe;
- providing, under nominal conditions, a nominal reservoir flow and a nominal reservoir pressure for each reservoir-node, and a nominal demand flow for each demand point node of the water distribution network;
- constructing a calibrated hydraulic model of the water distribution network, based on the nominal reservoir flow, the nominal reservoir pressure, and the nominal demand flow for each related node of the water distribution network;
- computing, for the calibrated hydraulic model of the water network, a computed nominal junction flow for each junction-node of the water distribution network;
- measuring, for each reservoir-node, a measured reservoir flow;
- if, for at least one of the reservoir-nodes, the measured reservoir flow is greater than the nominal reservoir flow plus a first predefined flow:
- taking, in downstream direction, a junction-node with two or more branches;
- selecting, in downstream direction, a next junction-node, which is connected to the junction-node;
- measuring a measured next junction flow of the selected next junction-node in downstream direction;
- continuing the steps of taking, selecting, and measuring, while the measured next junction flow in the selected branch is greater than the computed nominal reservoir flow plus a second predefined flow,
- so that the leak is located based on the measured next junction flow.
- The water distribution network usually comprises sources, like a reservoir, sinks (e.g. consumers or customers) that are often called demand points, and intermediate components, such as so-called junctions. A junction may have several branches. The reservoir, the demand points and/or the junctions are connected by means of pipes. Additionally, the water distribution network may comprise further components, for instance one or more tanks and/or pumps.
- The water distribution network may be represented by a directed graph. The one or more reservoirs may be represented as reservoir-nodes, the one or more junction may be represented as junction-nodes, and the demand points may be represented as demand-point-nodes, and the pipes may be represented as pipe-edges in said directed graph.
- The components may have properties, which may be represented as attributes of the nodes or edges of the graph. The reservoir may have a nominal reservoir flow and a nominal reservoir pressure, which can be measured at its output. (Note, that in this application the term "flow" may be used for "flow rate".) A reservoir is considered as unlimited source of water, where its pressure - often called "head" - is considered as always being equal to a known constant value. Thus, the reservoir pressure is for most cases equal to the nominal reservoir pressure. The reservoir flow may be called "nominal reservoir flow" for regular or "fault-free" operation. A leak in the water distribution network may lead to a different (i.e. higher) reservoir flow. The reservoir may have means to monitor the reservoir flow. The demand points have a nominal demand flow, which can be measured at its input. Some of the demand points may have metering devices - e.g. "smart meters" -, but in at least some water distribution networks, there may be no means for measuring the nominal demand flow continuously, and their demand flow may only be available in form of demand forecast and/or historical time-patterns. The pipes may have a friction loss, e.g. per meter or for a defined section, e.g. between two nodes.
- In at least some cases, the water distribution network may be partitioned into a plurality of district metered areas, DMAs. At least some of the DMAs may have metering devices configured for measuring its DMA-flow on the DMA's at least one inlet point and/or on the DMA's at least one outlet point. Metering devices may also be available at an outlet of pumping stations.
- Based on the directed graph, the nominal reservoir flow, the nominal reservoir pressure, and the nominal demand flow for each related node of the water distribution network, a calibrated hydraulic model of the water distribution network can be constructed. The calibrated hydraulic model may be used to simulate the water distribution network's behaviour under nominal conditions. For the calibrated hydraulic model of the water network, a computed nominal junction flow for each junction-node of the water distribution network may be computed. As a result, a nominal flow for each node of the water network under nominal conditions may be available, i.e. the calibrated hydraulic model may have "virtual sensors" for all nodes and pipes where no metering or instrumentation is installed. For at least some nodes of the water distribution network, the flow may be verified by real measurements and/or possibly corrected.
- Since for each reservoir-node, a measured reservoir flow is measured on a regular basis or even continuously, an increase of the measured reservoir flow - which may be caused by a leak somewhere in the water distribution network - may be noticed quite fast. If, for at least one of the reservoir-nodes, the measured reservoir flow is greater than the nominal reservoir flow plus a first predefined flow, a leak-locating subroutine may be started.
- Said subroutine may comprise taking, in downstream direction, a junction-node with two or more branches. The leak could be in any one of these branches. So, a next junction-node, in downstream direction, is selected, which is connected to the junction-node. At this selected next junction-node in downstream direction, a measured next junction flow is obtained.
- If this measured next junction flow is increased, compared to the computed nominal junction flow of this next junction (the computed flow taken from the calibrated hydraulic model) the leak-locating subroutine may be continued in this branch. In other words, if the measured next junction flow is greater than the computed nominal next junction flow plus a second predefined flow, the leak-locating subroutine - of taking, selecting, and measuring - may be continued in this branch. The second predefined flow may, e.g., be the same as the first predefined flow, or may be slightly smaller. If the measured next junction flow is (essentially) equal to the computed nominal next junction flow, the leak is not in that branch, so that another branch should be selected for measuring. After one or more iterations of this leak-locating subroutine, the measured next junction flow may be (essentially) equal to the computed nominal next junction flow, so that an inference is possible that the leak is probably in an area of the node before. Or, the method comes to a final node, i.e. a demand-point-node, so that an inference is possible that the leak is probably in an area of this final node. In both cases, the leak is located based on the measured next junction flow.
- Hence, this method may contribute essentially to locating a leak in a water distribution network, thus accelerating the leak locating process. Further advantageously, this computer-aided method can be used for guiding service personnel through the water distribution network, thus reducing the number of measurements required for finding the leak. This method may be particularly advantageous for water distribution network, which have only few metering devices installed.
- In various embodiments, the selecting of the next junction-node is done in a breadth-first manner and/or based on a sensitivity analysis. The selecting and measuring may only be done, until a branch with higher flow has been found. This may be combined with a sensitivity analysis - e.g. the one described below - to identify which nodes will bring more relevant information towards the determination of the leak location. This approach advantageously may further reduce the number of measurements required for finding the leak.
- In various embodiments, the measuring of the selected next junction-node is done by a temporary measuring device. The temporary measuring device may, e.g., be brought by service personnel. The service personnel may be instructed by this method, particularly by the computed "selecting" step. In cases when at least one of the junction-nodes may have an own metering device, the finding process may further be accelerated.
- In some embodiments, the nodes of the graph further comprise at least one tank-node, which represents a tank, for which, under nominal conditions, a nominal tank flow and a nominal tank pressure for the tank-node is provided, and the constructing of the calibrated hydraulic model of the water network is further based on the nominal tank flow and the nominal tank pressure for the tank-node.
- In some embodiments, the edges of the graph further comprise at least one pump-edge, which represents a pump, and the constructing of the calibrated hydraulic model of the water network is further based on the nominal pump flow for the pump-edge. The pump may have an own metering device, so that the calibration of the model can be improved and/or less measurements may be required for locating the leak.
- In various embodiments, the nominal demand flow for the at least one demand-point-node is obtained by a demand forecast, by a historical time-pattern, and/or by a metering device at an input of the demand-point-node.
- In some embodiments, the water distribution network is partitioned into a plurality of district metered areas, DMAs, wherein a DMA-flow is measured on the DMA's at least one inlet point and/or on the DMA's at least one outlet point. The partitioning of water distribution network into DMAs where the input and/or output flow is measured may further accelerate the leak finding process, since a preliminary computer-aided procedure may be performed, e.g. in parallel, for all DMAs. Said procedure may comprise a computation of the flow balance for each DMA, meaning that the difference between the input flow and the output flow of a DMA may be compared to the sum of the nominal demand of all DMA's demand-point-nodes, plus the flow provided by reservoirs and/or tanks that may be part of said DMA, minus the flow consumed by other sink-nodes that may be part of the DMA. If said quantities are similar enough, meaning that their numerical difference is smaller than a predefined value, the DMA may be marked as fault-free, otherwise a leak may be present in the considered DMA and the described leak-finding procedure may be performed "inside" the DMA. This preliminary routine advantageously may narrow the network area where the leak may be, and may further reduce the time required for finding and/or isolating the leak.
- In various embodiments, the calibrated hydraulic model of the water distribution network is further based on flow balance of the at least one junction-node and/or on friction losses in the at least one pipe-edge, and on the nominal reservoir flow and the nominal reservoir pressure for each reservoir-node.
- For the calibrated hydraulic model, a discrete time model may be used, where the considered time horizon is divided into T equidistant intervals, indexed by t ∈ {1, ...,T}. Without loss of generality, an optimization horizon of one day may be considered, divided into 24 periods of one hour each, which gives a discretization interval Δt = 1 hour. This may correspond to a discretization with which demand forecast and electricity prices are provided.
- For each link c = (i,j), c ∈ E, its flow variable may be denoted with qet , which is positive if the flow is directed from i to j, and negative otherwise, with i,j ∈ N representing network nodes, e.g. reservoir-nodes Nr, junction-nodes Nj, and demand-point-nodes Nd. The flow is always non-negative for pumps Epu and for certain pipes Epi, which allowing only unidirectional flow via check valves. For water distribution network problems a pressure may be measured as a sum of geodetic height and elevation difference

- The water distribution network may then be described by a quasi-stationary, discrete-time hydraulic model, describe by the following equations adopted to model the various network elements.
- Reservoir-nodes Nr are considered as unlimited sources of water, where the head is always equal to a known constant value
II n with n ∈ Nr , resulting in:
- Tank-nodes Nt are modelled via a discrete-time flow and mass balance equation:

- The flow balance in node n ∈ Nj , having a given demand profile dnt , is described by:

- Here, we assume that the demand dnt is positive if the water flow is leaving the network at node n, and it is fixed to zero for nodes having no demands.
- Friction losses in pipe-edges Epi may generically be described using a formula expressing the head loss as a function of the flow and of the pipe resistance coefficient


- The pump's head increase Δhpt for fixed-speed pumps is obtained by the head-flow characteristic diagrams of the pump, given the flow defined by the network current operating point. Here, we assume that the pump characteristic curves are defined by a number of operating points provided by the pump constructor of measured by dedicated "experiments". We then fit a continuous function of the form:


- In some embodiments, the reservoir-node, the junction-node, and/or the demand-point-node, are attributed with an address. The address may be a regular address - i.e. "house in a town" -, a GPS coordinate, or other kind of addresses. This may advantageously accelerate the finding of the next junction-node.
- An aspect relates to a computer program product comprising instructions, which, when is executed by a computer and/or a controller, cause the computer and/or controller to carry out the method according any one of the preceding claims.
- An aspect relates to a computer-readable storage medium where a computer program or a computer program product as described above is stored on.
- An aspect relates to a use of the calibrated hydraulic model as described above and/or below for performing a sensitivity analysis of the water distribution network. The sensitivity analysis may be beneficial to the selection of which node to examine while branching, since picking the node with higher sensitivity - i.e. with a higher potential information content - could potentially speed up the procedure by providing a "supportive selection method" that may help deciding and/or prioritizing in which order the network branches are examined and the manual sampling is performed. The sensitivity analysis may further contribute to install further metering devices in a targeted way, e.g. at selected "next junction-nodes" of high sensitivity.
- For further clarification, the invention is described by means of embodiments shown in the figures. These embodiments are to be considered as examples only, but not as limiting.
- The drawings depict:
- Figs. 1 - 4
- schematically a very small exemplary water distribution network according to an embodiment;
- Fig. 5(a) - 5(f)
- schematically a small exemplary water distribution network according to an embodiment;
- Fig. 6
- a flow diagram according to an embodiment.
-
Fig. 1 shows schematically a calibrated hydraulic model 11 of a simplified very small exemplary water distribution network 10 according to an embodiment. The model 11 comprises a reservoir-node N, on top ofFig. 1 , for instance a water basin able to provide all the necessary water flow at a given pressure. The reservoir has a nominal reservoir flow f, and a nominal reservoir pressure pr for the reservoir-node Nr. The circles Nj1 - Nj4 represent junctions, i.e. nodes of the graph defined in the previous Section. The double-circles Nd1 - Nd4 represent demand-points, i.e. consumers of the water. The edges between the circles Nji and the double-circles Ndi are pipe-edges Epi, which represent pipes. The pipes satisfy given water demands of the demand points or consumers Nj1 - Nj4, here a nominal demand flow fd1 - fd4 of 1 litre per second (l/s) each. The circles Nj1 - Nj4 are connected by pipes with nominal flows between 4 l/s and 1 l/s. Here, for simplicity effects of pressure, elevation and pressure losses in pipes are neglected, and it is assumed that the water flow in the network is driven by the external demands and leakages, so that the reservoir can provide infinite flow if needed, and that the flow is perfectly balanced in all junctions, i.e. the sum of inlet flow equals that of outlet flow. -
Fig. 2 shows schematically the calibrated hydraulic model 11 ofFig. 1 with a leak L from node Nj4. The flow rate of this leak L may be 0.5 l/s. It is assumed that a calibrated hydraulic model of the water network ofFig. 1 is available, which can be used to simulate the network behaviour under nominal conditions and obtain "virtual sensors" for all nodes and pipes where no instrumentation is installed. -
Fig. 3 shows schematically the calibrated hydraulic model 11 ofFig. 2 . In this water distribution network 10, all junctions Nj1 - Nj4 are provided with metering devices or sensors, represented here as crossed circles ⊗. In the network ofFig. 3 , the leak location finding procedure is straightforward, since by performing a flow balance in every node under nominal demand conditions, the leakage position will correspond to the node where the nominal flowrate results unbalanced. In general, it is common to use demand forecast with related uncertainty bounds instead of a nominal demand, and the described approach is then extended by considering a node as "leaky" if the flow imbalance is greater than a threshold defined as a function of the demand forecast uncertainty region and of the network structure. The threshold may be the nominal flow plus a second predefined flow f2pd. - However, in real water distribution networks, the number of nodes where sensors and real-time measurements are available may only be a small fraction of the total number of nodes, as shown in
Fig. 4 , and an easy leak location finding procedure as described forFig. 3 cannot be applied. Then, additional manually collected measurements are necessary to carry out the leak location finding procedure as described above and/or below. This advantageously allows to minimize the number of required manual sampling and associated time and costs, even if only a few continuously measuring devices are available. In this approach, a leaky node is assumed to behave like an emitter node, according to:
- Where qf
i is the leak flow for node i, and Ci and pi represent respectively the emitter coefficient (function of node and pipes physical properties) and the node pressure, γ is an exponent that depends on the chosen headloss model, i.e. γ = 0.5 for Hazen-Williams. The flow balance for generic node i is then modelled as:
- Where qe represents the flow of an inlet or outlet pipe connected to node i, E in(i) and E out(i) are the sets of all inlet and outlet pipes connected to i, respectively, and di is the node demand, i.e. the water flow leaving the node. The headloss (pressure loss) Δhe for generic pipe e has the form:

- Where the parameters ae and B depend on the chosen headloss model. Then, considering nodes i,j and the pipe e connecting them, the following head balance holds:

- Then, each real node of the considered water network area is considered as a virtual sensor, if no real measurements are available for that node. This means it could be a candidate node for manual sampling. In order to choose which nodes to prioritize during the manual sampling operations, a sensitivity and covariance analysis is performed, to identify which nodes will bring more relevant information towards the determination of the leak location. To do so, different leak scenarios are simulated using the network hydraulics model, i.e. one scenario for every real and virtual node in the considered area, where that node is considered to have a leak with flow described by qf
i , see above. A sensitivity matrix S is computed, where the sensitivity of the pressure difference of every real node in the area to all potential leaks is obtained as:
- Where s is the number of real network nodes in the area, and p is the number of real and virtual nodes in the area where a potential leak is simulated. Here,
no-leak is the measured or simulated pressure at node i for the scenario with no leak in the network, and sij is the element at row i and column j of S. Then, in case one or more nodes in the area has a sensor collecting pressure measurements, a residual vector is computed as:
- Then, considering the values in the sensitivity matrix S, and by computing a covariance function of choice between S and the residual vector r, a node is chosen for manual sampling, e.g. evaluating with a weighted function which node has the highest sensitivity to the greatest number of potential leaks, and a low correlation with the residuals, meaning that it is a node that could bring a significant additional information since it has high sensitivity to leaks and low correlation with already available measurements. Once a new manually sampled measurement is connected, the described procedure is repeated on the remaining nodes, and the node with manually sampled measurement is then considered as a node with a sensor providing pressure measurements.
- Now, going back to
Fig. 4 , which was introduced under rather simplified assumptions (i.e. we neglected the effects of pressure, elevation and pressure losses in pipes), let us assume that the only node with real-time measurement is node Nj1, and that the proposed algorithm indicated node Nj3 as the node providing the highest information content. Then, we can see that by computing the flow balance using the available data from nodes Nj1 and Nj3, it would become clear that the flow is balanced in Nj1 and Nj3 and between them, thus indicating that the flow must be balanced in node Nj2 and imbalanced in node Nj4, which would be an indicator of the suspected leak L location.Fig. 5 (a) - 5 (f) show schematically a calibrated hydraulic model 11 of a further small exemplary water distribution network 10 according to an embodiment. For better visibility, only a few reference signs - i.e. only the most relevant ones - are shown on the figures. All figuresFig. 5 (a) - 5 (f) show the water distribution network 10 with a reservoir-node Nr, a pump-edge Epu, a plurality of junction-nodes Nj, and a leak L. For better visibility, demand-point-nodes Nd, which may be connected to the junction-nodes Nj, are not depicted. The model 11 has several branches, for example at node Nj1, with one branch toward nodes Nj2 and another branch toward Nj3. - Once an increased flow at reservoir-node Nr is noticed, a leak-locating subroutine may be started. The increased flow may be noticed by sensing a measured reservoir flow fmri that is greater than the nominal reservoir flow fri plus a first predefined flow f1pd. The leak-locating subroutine may be started by taking, in downstream direction, the junction-node Nj1 with two or more branches. Then, in downstream direction, a next junction-node Nj2, which is connected to the junction-node Njk, is selected, as shown in
Fig. 5 (b) . At the selected next junction-node Nj2 in downstream direction, a measured next junction flow fmj2 (reference sign not shown) is measured. The measured next junction flow fmj2 turned out to be the same as the computed next junction flow fj2 of the calibrated hydraulic model 11. As a consequence, this branch (of Nj2 and following nodes) can be sorted out, i.e. the leak L must be part of the other branch, marked in grey inFig. 5 (b) . In the next steps, the leak-locating subroutine is continued. As shown inFig. 5 (c) , node Nj4 is selected. This is a smart selection, because the other two branches are joined at node Nj5. Thus, measuring node Nj4 may give a clearer indication than measuring any of the other branches. Since the branch of Nj4 can be sorted out, the next node to be selected and measured is Nj5. Nj5 has an increased flow and, thus, this branch is taken; seeFig. 5 (d) . Based on the model 11, e.g. on its sensitivity analysis, the node Nj6 is selected and measured; seeFig. 5 (e) . This node Nj6 shows no increased flow. Hence, the leak L is probably in the area of the node before; seeFig. 5 (f) . So, the leak L is located based on the measured next junction flow fmj6. -
Fig. 6 shows a flow diagram 100 according to an embodiment, sketching a computer-implemented method for locating a leak L in a water distribution network 10 (see the figures before). In astep 102, a directed graph that represents the water distribution network 10 is provided. The nodes of the graph comprise at least one reservoir-node Nr, at least one junction-node Nj, and at least one demand-point-node Nd, which represent a reservoir, a junction, and a demand point of the water distribution network 10, respectively. The edges of the graph comprise at least one pipe-edge Epi, which represents a pipe. In astep 104, under nominal conditions, a nominal reservoir flow f, and a nominal reservoir pressure pr for each reservoir-node Nr, and a nominal demand flow fd for each demand point node Nd of the water distribution network 10 is provided. In astep 106, a calibrated hydraulic model 11 of the water distribution network 10 is constructed, based on the directed graph, the nominal reservoir flow fr, the nominal reservoir pressure pr, and the nominal demand flow fd for each related node of the water distribution network 10. In astep 108, for the calibrated hydraulic model 11 of the water network, a computed nominal junction flow fmji for each junction-node Nji of the water distribution network 10 is computed. - In a
step 110, for each reservoir-node Nri, a measured reservoir flow fm, is measured. The measurement may be performed on a regular basis or even continuously. In astep 112, a decision is taken if, for the at least one reservoir-node Nri, the measured reservoir flow fmri is greater than the nominal reservoir flow fri plus a first predefined flow f1pd. If not, no specific action may be taken (step 130), and the measured reservoir flow fm, may be measured again. If yes, astep 114 is performed, i.e. in downstream direction, a junction-node Njk with two or more branches is taken. In astep 116, a next junction-node Njk+1 in downstream direction is selected, the junction-node Njk+1 being which is connected to the junction-node Njk. In astep 118, a measured next junction flow fmjk+1 of the selected next junction-node Njk+1 in downstream direction is measured. In astep 120, the steps of taking 114, selecting 116, and measuring 118 are continued, while the measured next junction flow fmjk+1 in the selected branch is greater than the computed next junction flow fjk+1 plus a second predefined flow f2pd. In astep 122, the leak L is located based on the measured next junction flow fmjk+1. -
- 10
- water distribution network
- 11
- calibrated hydraulic model
- 100
- flow diagram
- 102-122
- steps
- Epi
- pipe-edge
- Epu
- pump-edge
- f1pd
- first predefined flow
- f2pd
- second predefined flow
- fd
- demand flow
-
fmjk+ 1 - next junction flow
- fmr
- measured reservoir flow
- fr
- nominal reservoir flow
- L
- leak
- Nd
- demand-point-node
- Nj
- junction-node
-
Njk+ 1 - next junction-node
- N,
- reservoir-node
- pr
- nominal reservoir pressure
Claims (12)
- A computer-implemented method for locating a leak (L) in a water distribution network (10), the method comprising the steps of:providing a directed graph that represents the water distribution network (10),the nodes of the graph comprising at least one reservoir-node (Nr),at least one junction-node (Nj), and at least one demand-point-node (Nd), which represent a reservoir, a junction, and a demand point of the water distribution network (10), respectively,the edges of the graph comprising at least one pipe-edge (Epi), which represents a pipe;providing, under nominal conditions,a nominal reservoir flow (fr) and a nominal reservoir pressure (pr) for each reservoir-node (Nr), anda nominal demand flow (fd) for each demand point node (Nd) of the water distribution network (10);constructing a calibrated hydraulic model (11) of the water distribution network (10), based on the directed graph, the nominal reservoir flow (fr), the nominal reservoir pressure (pr), and the nominal demand flow (fd) for each related node of the water distribution network (10);computing, for the calibrated hydraulic model (11) of the water network,a computed nominal junction flow (fmji) for each junction-node (Nji) of the water distribution network (10);measuring, for each reservoir-node (Nri), a measured reservoir flow (fmr);if, for at least one of the reservoir-nodes (Nri), the measured reservoir flow (fmri) is greater than the nominal reservoir flow (fri) plus a first predefined flow (f1pd):taking, in downstream direction, a junction-node (Njk) with two or more branches;selecting, in downstream direction, a next junction-node (Njk+1), which is connected to the junction-node (Njk);measuring a measured next junction flow (fmjk+1) of the selected next junction-node (Njk+1) in downstream direction; andcontinuing the steps of taking, selecting, and measuring, while the measured next junction flow (fmjk+1) in the selected branch is greater than the computed next junction flow (fjk+1) plus a second predefined flow (f2pd),so that the leak (L) is located based on the measured next junction flow (fmjk+1).
- The method of claim 1,
wherein the selecting of the next junction-node (Njk+1) is done in a breadth-first manner and/or based on a sensitivity analysis. - The method of claim 1 or 2,
wherein the measuring of the selected next junction-node (Njk+1) is done by a temporary measuring device. - The method of any one of the preceding claims,wherein the nodes of the graph further comprise at least one tank-node (Nt), which represents a tank, for which, under nominal conditions, a nominal tank flow (fr) and a nominal tank pressure (pr) for the tank-node (Nt) is provided, andthe constructing of the calibrated hydraulic model (11) of the water network is further based on the nominal tank flow (fr) and the nominal tank pressure (pr) for the tank-node (Nt).
- The method of any one of the preceding claims,wherein the edges of the graph further comprise at least one pump-edge (Epu), which represents a pump, andthe constructing of the calibrated hydraulic model (11) of the water network is further based on the nominal pump flow (fpu) for the pump-edge (Epu).
- The method of any one of the preceding claims,
wherein the nominal demand flow (fd) for the at least one demand-point-node (Nd) is obtained by a demand forecast, by a historical time-pattern, and/or by a metering device at an input of the demand-point-node (Nd). - The method of any one of the preceding claims,
wherein the water distribution network (10) is partitioned into a plurality of district metered areas, DMAs, wherein a DMA-flow is measured on the DMA's at least one inlet point and/or on the DMA's at least one outlet point. - The method of any one of the preceding claims,
wherein the calibrated hydraulic model (11) of the water distribution network (10) is further based on flow balance of the at least one junction-node (Nj) and/or on friction losses in the at least one pipe-edge (Epi), and on the nominal reservoir flow (fr) and the nominal reservoir pressure (pr) for each reservoir-node (Nr). - The method of any one of the preceding claims,
wherein the reservoir-node (Nr), the junction-node (Nj), and/or the demand-point-node (Nd), are attributed with an address. - A computer program product comprising instructions, which, when is executed by a computer and/or a controller, cause the computer and/or controller to carry out the method according any one of the preceding claims.
- A computer-readable storage medium on which the computer program according to claim 10 is stored.
- Use of the calibrated hydraulic model (11) of any one of claims 1 - 9 for performing a sensitivity analysis of the water distribution network (10).
Priority Applications (2)
| Application Number | Priority Date | Filing Date | Title |
|---|---|---|---|
| EP23169598.2A EP4455629A1 (en) | 2023-04-24 | 2023-04-24 | Guided leak source location finder in water distribution network |
| PCT/EP2024/059725 WO2024223302A1 (en) | 2023-04-24 | 2024-04-10 | Guided leak source location finder in water distribution network |
Applications Claiming Priority (1)
| Application Number | Priority Date | Filing Date | Title |
|---|---|---|---|
| EP23169598.2A EP4455629A1 (en) | 2023-04-24 | 2023-04-24 | Guided leak source location finder in water distribution network |
Publications (1)
| Publication Number | Publication Date |
|---|---|
| EP4455629A1 true EP4455629A1 (en) | 2024-10-30 |
Family
ID=86185348
Family Applications (1)
| Application Number | Title | Priority Date | Filing Date |
|---|---|---|---|
| EP23169598.2A Withdrawn EP4455629A1 (en) | 2023-04-24 | 2023-04-24 | Guided leak source location finder in water distribution network |
Country Status (2)
| Country | Link |
|---|---|
| EP (1) | EP4455629A1 (en) |
| WO (1) | WO2024223302A1 (en) |
Cited By (1)
| Publication number | Priority date | Publication date | Assignee | Title |
|---|---|---|---|---|
| CN119244951A (en) * | 2024-12-04 | 2025-01-03 | 昆明理工大学 | A method for diagnosing leakage of slurry conveying pipeline |
-
2023
- 2023-04-24 EP EP23169598.2A patent/EP4455629A1/en not_active Withdrawn
-
2024
- 2024-04-10 WO PCT/EP2024/059725 patent/WO2024223302A1/en not_active Ceased
Non-Patent Citations (4)
| Title |
|---|
| GERTLER J ET AL: "Leak detection and isolation in water distribution networks using principal component analysis and structured residuals", CONTROL AND FAULT-TOLERANT SYSTEMS (SYSTOL), 2010 CONFERENCE ON, IEEE, PISCATAWAY, NJ, USA, 6 October 2010 (2010-10-06), pages 191 - 196, XP031840796, ISBN: 978-1-4244-8153-8 * |
| PEREZ RAMON ET AL: "Leak Localization in Water Networks: A Model-Based Methodology Using Pressure Sensors Applied to a Real Network in Barcelona [Applications of Control]", IEEE CONTROL SYSTEMS, IEEE, USA, vol. 34, no. 4, 14 July 2014 (2014-07-14), pages 24 - 36, XP011553976, ISSN: 1066-033X, [retrieved on 20140711], DOI: 10.1109/MCS.2014.2320336 * |
| RAJESWARAN ARAVIND ET AL: "A graph partitioning algorithm for leak detection in water distribution networks", COMPUTERS & CHEMICAL ENGINEERING, vol. 108, 30 August 2017 (2017-08-30), pages 11 - 23, XP085282583, ISSN: 0098-1354, DOI: 10.1016/J.COMPCHEMENG.2017.08.007 * |
| SOPHOCLEOUS SOPHOCLES ET AL: "A Graph-based Analytical Technique for the Improvement of Water Network Model Calibration", PROCEDIA ENGINEERING, ELSEVIER BV, NL, vol. 154, 24 August 2016 (2016-08-24), pages 27 - 35, XP029697843, ISSN: 1877-7058, DOI: 10.1016/J.PROENG.2016.07.415 * |
Cited By (1)
| Publication number | Priority date | Publication date | Assignee | Title |
|---|---|---|---|---|
| CN119244951A (en) * | 2024-12-04 | 2025-01-03 | 昆明理工大学 | A method for diagnosing leakage of slurry conveying pipeline |
Also Published As
| Publication number | Publication date |
|---|---|
| WO2024223302A1 (en) | 2024-10-31 |
Similar Documents
| Publication | Publication Date | Title |
|---|---|---|
| EP3899522B1 (en) | An improved method for evaluating pipe condition | |
| Daniel et al. | A sequential pressure-based algorithm for data-driven leakage identification and model-based localization in water distribution networks | |
| US9441988B2 (en) | System and method for identifying likely geographical locations of anomalies in a water utility network | |
| Doshmanziari et al. | Gas pipeline leakage detection based on sensor fusion under model-based fault detection framework | |
| CN110197049B (en) | Non-metal pipeline leakage positioning method based on transient inverse problem | |
| CN106195646B (en) | Leak is distributed estimating device, deduction system and presumption method | |
| CN111853553B (en) | Method and system for detecting fault of fluid pipeline | |
| CN103292966A (en) | Leak detection device | |
| CN120368231B (en) | A method, device and system for detecting and locating leakage in multiple pipes of a water supply network | |
| WO2014115399A1 (en) | Water leak estimating device, system, and method | |
| EP4455629A1 (en) | Guided leak source location finder in water distribution network | |
| CN112097125A (en) | A method for detecting and locating a pipe burst in a water supply network based on self-adaptive checking | |
| EP3605050B1 (en) | Pipe diagnosis device, asset management device and pipe diagnosis method. | |
| US20200340882A1 (en) | Pipeline diagnosing device, asset management device, pipeline diagnosing method, and recording medium | |
| JP2020042692A (en) | Plant diagnostic data generating system and method | |
| KR20130108911A (en) | Method for setting a site of sensor in looped water distribution pipe network | |
| Okeya et al. | Locating pipe bursts in a district metered area via online hydraulic modelling | |
| Zhang et al. | Parameter determination and performance evaluation of time-series-based leakage detection method | |
| KR102493362B1 (en) | Real-time accident detection system for waterworks using AI and method thereof | |
| Wang et al. | Hydraulic simulation of water supply network leakage based on EPANET | |
| KR20030067305A (en) | Method of risk assessment for buried gas pipelines | |
| Suryana et al. | Detection of Leak Position in Household LPG Distribution Pipes Using Gas Pressure Sensors and Continuity Equation | |
| YILMAZ et al. | Using the Infrastructure Leakage Index (ILI) indicator for effective and sustainable leakage management: importance, advantages and challenges. | |
| Xie et al. | A multi-point leakage prediction statistical method using Bayesian inference in water distribution networks | |
| Tatara et al. | Approximate and analytic flow models for leak detection and identification |
Legal Events
| Date | Code | Title | Description |
|---|---|---|---|
| PUAI | Public reference made under article 153(3) epc to a published international application that has entered the european phase |
Free format text: ORIGINAL CODE: 0009012 |
|
| STAA | Information on the status of an ep patent application or granted ep patent |
Free format text: STATUS: THE APPLICATION HAS BEEN PUBLISHED |
|
| AK | Designated contracting states |
Kind code of ref document: A1 Designated state(s): AL AT BE BG CH CY CZ DE DK EE ES FI FR GB GR HR HU IE IS IT LI LT LU LV MC ME MK MT NL NO PL PT RO RS SE SI SK SM TR |
|
| STAA | Information on the status of an ep patent application or granted ep patent |
Free format text: STATUS: THE APPLICATION IS DEEMED TO BE WITHDRAWN |
|
| 18D | Application deemed to be withdrawn |
Effective date: 20250501 |