EP4450950A2 - Method and system for detecting a pressure distribution in a footprint area of a tire - Google Patents
Method and system for detecting a pressure distribution in a footprint area of a tire Download PDFInfo
- Publication number
- EP4450950A2 EP4450950A2 EP24198501.9A EP24198501A EP4450950A2 EP 4450950 A2 EP4450950 A2 EP 4450950A2 EP 24198501 A EP24198501 A EP 24198501A EP 4450950 A2 EP4450950 A2 EP 4450950A2
- Authority
- EP
- European Patent Office
- Prior art keywords
- resting surface
- sheet
- tire
- plate
- elastomeric
- Prior art date
- Legal status (The legal status is an assumption and is not a legal conclusion. Google has not performed a legal analysis and makes no representation as to the accuracy of the status listed.)
- Pending
Links
Images



Classifications
-
- G—PHYSICS
- G01—MEASURING; TESTING
- G01M—TESTING STATIC OR DYNAMIC BALANCE OF MACHINES OR STRUCTURES; TESTING OF STRUCTURES OR APPARATUS, NOT OTHERWISE PROVIDED FOR
- G01M17/00—Testing of vehicles
- G01M17/007—Wheeled or endless-tracked vehicles
- G01M17/02—Tyres
- G01M17/027—Tyres using light, e.g. infrared, ultraviolet or holographic techniques
Definitions
- the present invention concerns a method and a system for detecting pressure distribution in the footprint area of a tire.
- the method comprises laterally illuminating a transparent plate in such a manner that the light rays propagate inside the plate, forming, with the line perpendicular to an upper surface, an angle greater than the critical angle of the plate material, pushing against the tread of an inflated tire against the surface, and acquiring an image of the resting surface with a camera placed under the plate.
- a thin sheet is interposed between the tread and the plate.
- the Applicant has observed that the characteristics of the interposed sheet play an essential role in the quality of the results of the pressure distribution detection method and that this sheet is not selected in an optimal manner in the prior art.
- the Applicant has posed the issue of developing a method for detecting pressure distribution in the footprint area of a tire that is capable of providing accurate results with a high degree of sensitivity.
- maximum allowable pressure is understood as the maximum pressure at which it is permitted to inflate the tire (value stamped on the tire according to the reference standards (e.g. ETRTO, NHTSA, etc.).
- load index is understood as the maximum load value that the tire can bear (value stamped on the tire according to the reference standards (e.g. ETRTO, NHTSA, etc.).
- characteristic curve associated with an assembly formed by a sheet, a plate, a beam of light rays and a camera is understood as a curve that interrelates the pressure values exerted on the sheet and the corresponding grey-level values in the image acquired by the camera, once the operating conditions of the camera have been set (sensor sensitivity, exposure time etc.).
- An exemplary measurement test for determining the characteristic curve is described below. It is noted that the above-mentioned assembly, with the above-mentioned operating conditions used to determine the characteristic curve, is the same assembly used to perform the pressure distribution detection test.
- the invention concerns a method for detecting a pressure distribution in a footprint area of a tire.
- a tire mounted on a wheel rim and inflated.
- a plate of transparent material having a resting surface, and a camera suitable for acquiring images of said resting surface.
- a tread of said tire be pushed against said resting surface with a force, for the purpose of generating said footprint area on said resting surface, and that an image of said footprint area be acquired, said image having a full-scale grey level.
- said image be processed for the purpose of detecting said pressure distribution in said footprint area.
- a sheet be interposed between said tread and said resting surface during the acquisition of said image.
- the invention concerns a system for detecting a pressure distribution in a footprint area of a tire.
- the system comprises a plate of transparent material having a resting surface, a camera suitable for acquiring a digital image of said resting surface and a light source configured to input a beam of light rays into the plate, said light rays propagating into the plate at an angle, with respect to a line perpendicular to said resting surface, said angle being greater than an internal critical angle associated with said resting surface.
- the system comprises a sheet placed in contact with said supporting surface.
- said sheet be selected in such a manner that it satisfies the following condition:
- said sheet be selected in such a manner that it satisfies the following further condition: 2) said characteristic curve has a first derivative that is greater than or equal to 2 levels of grey per bar at the least in a pressure range comprised between 10% and 70% of said maximum pressure.
- said sheet be selected in such a manner that it satisfies the following further condition: 3) in a test run, at a temperature ranging between 20° and 30°, comprising the following eight operations:
- the above-mentioned characteristics make the pressure distribution detection method particularly accurate and sensitive.
- the characteristic curve assumes a grey-level value that is less than or equal to 90% of said full-scale grey level, makes it possible to measure all pressure values in the range of interest, thus avoiding that a substantial number of pixels assume a saturation or near-saturation grey level. In this situation, it would in fact become difficult to distinguish between different pressure values that would give rise to the same saturation grey level or to very close grey levels.
- the fact that the first derivative of the characteristic curve is greater than or equal to 2 levels of grey per bar at least in a pressure range comprised between 10% and 70% of the maximum pressure ensures sufficient differentiation of the brightness response of pixels corresponding to slightly different pressure levels, and thus sufficient sensitivity.
- the above-mentioned requirement in relation to the above-mentioned test run ensures that the interposed sheet does not adhere to the plate, or that the adherence thereof is sufficiently slight.
- the sheet leaves spurious regions of brightness originating from the previous measurements, which bring about changes in excess of the measured pressure values.
- the test run mentioned above was developed by the Applicant to verify that these spurious regions of brightness do not exceed a threshold of acceptability.
- this requirement ensures that the interposed sheet does not unacceptably generate memory effects, owing to which, due to excessive relaxation times of the material after removal of the cause of the deformation, the material retains at least part of the deformations to which it was subjected in the previous tests, yielding measured pressure values that are higher than the real values.
- the present invention encompasses in the above-mentioned measurement method, the use of any sheet that meets the requirements described hereinabove relative to the characteristic curve and the test run, regardless of the fact that this characteristic curve is actually determined and/or the test run is actually carried out for the purpose of selecting the sheet.
- the present invention can offer one or more of the following preferred characteristics.
- said characteristic curve assumes a grey-level value that is less than or equal to 80% of said full-scale grey level, more preferably less than or equal to 70% of said full-scale grey level. In this manner, even higher dynamics are ensured in the range of interest.
- said characteristic curve has a first derivative that is greater than or equal to 3 levels of grey per bar, more preferably greater than or equal to 5 levels of grey per bar, at least in a pressure range comprised between 10% and 70% of said maximum pressure, more preferably between 10% and 90% of said maximum pressure. Sensitivity in the desired measurement range is thus optimized.
- said characteristic curve has a first derivative that is less than or equal to 50 levels of grey per bar, more preferably less than 30 levels of grey per bar, at least in a pressure range comprised between 10% and 70% of said maximum pressure, more preferably between 10% and 80% of said maximum pressure. Sensitivity in sufficiently broad measurement range is thus optimized.
- Said sheet is preferably made of elastomeric thermoplastic polyurethane.
- thermoplastic polyurethane is understood as elastomeric polyurethane polyethers and elastomeric polyurethane polyesters.
- polyurethanes are understood as the products of the polymerization of at least one polyalcohol (polyol) having two or more hydroxyl groups per molecule with at least one isocyanate having two or more isocyanate groups per molecule (polyisocyanate).
- polyol polyalcohol
- isocyanate having two or more isocyanate groups per molecule
- polyisocyanate Depending on the type of polyol, the polyurethanes are further divided into two main groups: polyethers and polyesters.
- the isocyanates used in the preparation of the present elastomeric polyurethanes can be of the aliphatic type, preferably selected from among diisocyanates such as hexamethylene diisocyanate, isophorone diisocyanate, or dicyclohexyl-4,4' diisocyanate, or of the aromatic type, preferably selected from among diisocyanates such as naphthalene diisocyanate, para-phenylene diisocyanate, toluene diisocyanate (TDI) and methylene diphenyl diisocyanate (MDI), more preferably methylene diphenyl diisocyanate.
- diisocyanates such as hexamethylene diisocyanate, isophorone diisocyanate, or dicyclohexyl-4,4' diisocyanate
- aromatic type preferably selected from among diisocyanates such as naphthalene diisocyanate, para-phenylene diiso
- Preferred elastomeric thermoplastic polyurethanes are those obtained by polymerization of aromatic isocyanates, more preferably by polymerization of aromatic diisocyanates selected from among naphthalene diisocyanate, para-phenylene diisocyanate, toluene diisocyanate (TDI) and methylene diphenyl diisocyanate (MDI).
- Short-chain diols such as 1,4-butanediol for example can be used as rigid phase "chain extenders”.
- Preferred polyether polyurethanes are those obtained by polymerization of isocyanates, preferably of aromatic isocyanates, with polyols derived mainly from the polymerization of tetrahydrofuran (polyTHF), from the polymerization of propylene oxide or the polymerization of ethylene oxide, or by mixtures of propylene oxide and ethylene oxide.
- polyTHF tetrahydrofuran
- Preferred polyester polyurethanes are those obtained by polymerization of isocyanates, preferably of aromatic isocyanates, with polyols derived preferably from the polymerization of aliphatic dicarboxylic acids, including for example adipic acid, with glycols, preferably ethylene glycol, or from the polymerization of caprolactone.
- Elastomeric polyurethanes that are suitable as the principal, preferably sole, components of the elastomeric film according to the present invention are selected from the group of elastomeric thermoplastic polyurethanes (TPU) marketed under the trade names of Argoflex ® (Argotec), Argothane ® (Argotec), Epurex Platilon ® line, preferably Platilon ® U (Covestro), Desmopan ® (Covestro), Texin ® (Covestro), Pearlthane TM (Lubrizol), Estane ® (Lubrizol), Pellethane ® (Lubrizol), Elastollan ® (BASF), and Adilithe ® (Merylithe).
- TPU elastomeric thermoplastic polyurethanes
- thermoplastic polyurethanes marketed under the trade names of Argoflex ® 19205 (polyether), Argothane ® 19103 (polyether), Epurex Platilon ® line, more preferably Platilon ® U like Epurex U073 (polyether), Epurex 4201AU (polyether) and Epurex 4100D (polyester), and Platilon ® U 4180 DK are particularly preferred.
- said sheet is of a thickness of less than or equal to 150 microns, more preferably less than or equal to 100 microns, and/or more than or equal to 10 microns.
- the Applicant has found that the above-mentioned materials and/or the above-mentioned thicknesses give the sheet optimal characteristics in terms of the quality of the results of the measurement method, consistently with the fact of meeting the above-mentioned selection requirements.
- the invention concerns a method for detecting a pressure distribution in a footprint area of a tire, comprising:
- the invention concerns a system for detecting a pressure distribution in a footprint area of a tire, the system comprising a plate of transparent material having a resting surface, a camera suitable for acquiring a digital image of said resting surface, a light source configured to input a beam of light rays into the plate, said light rays propagating into the plate at an angle, with respect to a line perpendicular to said resting surface, said angle being greater than an internal critical angle associated with said resting surface, and a sheet placed in contact with said resting surface, said sheet being made of elastomeric thermoplastic polyurethane, as described hereinabove.
- the system 1 comprises a plate 2 of transparent material having a resting surface 3.
- Suitable transparent materials can consist of glass, plexiglass or PMMA.
- the system 1 comprises a camera 4 typically arranged under the plate and oriented so as to acquire digital images of the resting surface 3.
- Suitable light sources 5 e.g. LEDs
- Suitable light sources 5 are arranged laterally with respect to the plate so as to enable inputting of a beam of light rays 6 into the plate, said light rays 6 propagating inside the plate owing to the phenomenon of total internal reflection. Based on this phenomenon, the rays forming an angle 7, with respect to the line perpendicular to the resting surface, said angle being greater than the internal critical angle associated with the resting surface, are reflected totally. For example, in the case of a glass plate in air, this internal critical angle is equal to about 41°.
- the corresponding pressure can be associated with a given grey level in the image acquired by the camera (grey levels corresponding to the brightness detected).
- a sheet 9 is interposed in contact between the resting surface 3 and the tread 11 of the tire 10.
- the characteristic curve of the sheet 9 associated with the test system used to acquire the image and essentially made up of the plate, the sheet, the lighting system (under the operating conditions utilized to acquire the image) and the camera (under the operating conditions utilized to acquire the image) should be known.
- These operating conditions are determined beforehand through the acquisition of a plurality of images obtained by varying the most influential parameters (including for example sensor sensitivity, exposure time, power of the light source, etc.) and selecting one of the conditions that has generated images of acceptable quality. These conditions are maintained during the pressure distribution detection process.
- a calibration device 20 of the type shown in Figure 2 can be used for the purpose of determining the characteristic curve.
- This device which is substantially shaped in the form of a cup made of a metal such as steel, has a cavity 21 within which the pressure can be changed, for example by letting air in or out through a conduit 22 in communication with the cavity.
- a suitable gasket 23 e.g. an O-ring
- the device 20 is rested on the sheet 9 of the system 1, without the tire 10, with the gasket 23 adhering to the sheet 9, and the pressure in the cavity 21 is regulated.
- the device 20 is of a diameter that is adequate (for example 5 cm) for the device 20 to exert substantially homogeneous pressure on a sufficiently large area of the sheet 9.
- the device 20 is of a weight that is suitable (for example 200 g) for developing adequate pressure inside the cavity 21, e.g. 10 bar.
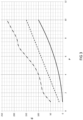
- Figure 3 shows some examples of characteristics curves that meet the requirements of the present invention, in which the predetermined maximum pressure to be detected is equal to 10 bar.
- the vertical axis in Figure 3 represents the pressure expressed in bars and the horizontal axis represents the corresponding grey-level value (wherein the full scale is equal to 256).
- the characteristic curves have a grey-level value that is less than or equal to 230 levels of grey (that is, 90% of the full-scale grey level).
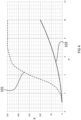
- Figure 4 compares an example of a characteristic curve (line 102) that meets the requirements of the present invention and an example of a comparative curve (line 101) that tends to saturate too quickly, the predetermined maximum pressure to be detected being equal to 10 bar.
- line 102 has a grey level equal to about 100 (below 90% of the full scale), whereas line 101 has a grey level equal to about 250 (above 90% of the full scale).
- Figure 5 compares the above-mentioned example of a characteristic curve (line 102) and a comparative curve (line 501) that has a derivative that is too low (less than 2 levels of grey per bar), determining excessive lowering of the corresponding grey-level values.
- the tire 10 to be tested is mounted on a wheel rim and inflated at a pressure of at least 0.5 bar, typically between 1 and 3 bar.
- the tread 11 on the sheet 9 After having rested the tread 11 on the sheet 9, the tread is pushed against the resting surface with a certain force 15, for example applied on the axis of the wheel rim and directed perpendicularly to the plate (in Figure 1 , the force 15 is directed vertically downwards).
- a certain force 15 for example applied on the axis of the wheel rim and directed perpendicularly to the plate (in Figure 1 , the force 15 is directed vertically downwards).
- a footprint is generated on the resting surface, said footprint having a pressure distribution on the footprint area.
- a digital image of the footprint area is acquired, in which a grey level is associated with each pixel, the image being characterized by a full-scale grey level, for example equal to level 256 for the maximum brightness.
- the image is then processed (as known and described for example in the articles cited hereinabove and included here for reference) for the purpose of detecting the pressure distribution in the footprint area, using the characteristic curve associated with the test system used.
- the sheet 9 used is for example a sheet of polyurethane marketed by Covestro ® with the name Platilon ® U 4180 DK Night Black and having a thickness of 25 ⁇ m.
- the difference, in absolute value, between the first and the second area as defined above is equal to about 2% of the first area.
Landscapes
- Physics & Mathematics (AREA)
- General Physics & Mathematics (AREA)
- Force Measurement Appropriate To Specific Purposes (AREA)
- Measuring Fluid Pressure (AREA)
- Length Measuring Devices By Optical Means (AREA)
- Tires In General (AREA)
Abstract
Description
- The present invention concerns a method and a system for detecting pressure distribution in the footprint area of a tire.
- The articles "An Optical Method for Normal Contact Stress Measurement with Applications to Tire-Road Interaction" by Roth, Moore, Turner, Bridgestone/Firestone North American Tire, 2004 SEM X International Congress & Exposition on Experimental & Applied Mechanics, "An optical tire contact pressure test bench" by Castillo, Pérez De La Blanca, Cabrera & Simón, Department of Mechanical Engineering, University of Málaga, Campus El Ejido, 29013, Málaga, Spain - Vehicle System Dynamics, Feb 2007, and "Validation of a frustrated total internal reflection test bench for tire footprint pressure measurement" by Cheli, Zanoni, Sabato, Politecnico di Milano, Pirelli Tyre - Akron 2014, and the document
ES 2 222 776 A1 - The method comprises laterally illuminating a transparent plate in such a manner that the light rays propagate inside the plate, forming, with the line perpendicular to an upper surface, an angle greater than the critical angle of the plate material, pushing against the tread of an inflated tire against the surface, and acquiring an image of the resting surface with a camera placed under the plate.
- Given that the degree of suppression of the total internal reflection of the rays on the resting surface (and thus local brightness) is a function of the local pressure exerted by the footprint of the tire resting on the plate, it is possible to obtain the pressure distribution by processing the acquired image.
- To improve the results, a thin sheet is interposed between the tread and the plate.
- The Applicant has observed that the characteristics of the interposed sheet play an essential role in the quality of the results of the pressure distribution detection method and that this sheet is not selected in an optimal manner in the prior art.
- The Applicant has posed the issue of developing a method for detecting pressure distribution in the footprint area of a tire that is capable of providing accurate results with a high degree of sensitivity.
- Lastly, the Applicant has found that by selecting the interposed sheet on the basis of specific selection criteria, a detection method that has the above-mentioned desired characteristics is obtained.
- The term "maximum allowable pressure" is understood as the maximum pressure at which it is permitted to inflate the tire (value stamped on the tire according to the reference standards (e.g. ETRTO, NHTSA, etc.).
- The term "load index" is understood as the maximum load value that the tire can bear (value stamped on the tire according to the reference standards (e.g. ETRTO, NHTSA, etc.).
- The expression "characteristic curve associated with an assembly formed by a sheet, a plate, a beam of light rays and a camera" is understood as a curve that interrelates the pressure values exerted on the sheet and the corresponding grey-level values in the image acquired by the camera, once the operating conditions of the camera have been set (sensor sensitivity, exposure time etc.). An exemplary measurement test for determining the characteristic curve is described below. It is noted that the above-mentioned assembly, with the above-mentioned operating conditions used to determine the characteristic curve, is the same assembly used to perform the pressure distribution detection test.
- In one aspect, the invention concerns a method for detecting a pressure distribution in a footprint area of a tire.
- Preferably, it is envisaged that there be arranged a tire mounted on a wheel rim and inflated.
- Preferably, it is envisaged that there be arranged a plate of transparent material having a resting surface, and a camera suitable for acquiring images of said resting surface.
- Preferably, it is envisaged that there be inputted a beam of light rays into the plate, said light rays propagating at an angle, with respect to a line perpendicular to said resting surface, said angle being greater than an internal critical angle associated with said resting surface.
- Preferably, it is envisaged that a tread of said tire be pushed against said resting surface with a force, for the purpose of generating said footprint area on said resting surface, and that an image of said footprint area be acquired, said image having a full-scale grey level. Preferably, it is envisaged that said image be processed for the purpose of detecting said pressure distribution in said footprint area.
- Preferably, it is envisaged that a sheet be interposed between said tread and said resting surface during the acquisition of said image.
- In another aspect, the invention concerns a system for detecting a pressure distribution in a footprint area of a tire.
- The system comprises a plate of transparent material having a resting surface, a camera suitable for acquiring a digital image of said resting surface and a light source configured to input a beam of light rays into the plate, said light rays propagating into the plate at an angle, with respect to a line perpendicular to said resting surface, said angle being greater than an internal critical angle associated with said resting surface.
- The system comprises a sheet placed in contact with said supporting surface.
- Preferably, it is envisaged that said sheet be selected in such a manner that it satisfies the following condition:
- 1) at a predetermined maximum pressure to be detected, comprised between 1 bar and 50 bar, a characteristic curve associated with the assembly formed by said sheet, said plate, said beam of light rays and said camera, assumes a grey-level value that is less than or equal to 90% of said full-scale grey level.
- Preferably, it is envisaged that said sheet be selected in such a manner that it satisfies the following further condition:
2) said characteristic curve has a first derivative that is greater than or equal to 2 levels of grey per bar at the least in a pressure range comprised between 10% and 70% of said maximum pressure. - Preferably, it is envisaged that said sheet be selected in such a manner that it satisfies the following further condition:
3) in a test run, at a temperature ranging between 20° and 30°, comprising the following eight operations: - a) inflating said tire at a pressure greater than or equal to 1 bar and preferably less than or equal to a maximum allowable pressure for said tire;
- b) resting said tread on said resting surface, with said sheet interposed between said tread and said resting surface;
- c) inputting said beam of light rays into the plate;
- d) pushing said tread against said resting surface with a force perpendicular to said resting surface and having a value that increases linearly for one minute up to a predetermined value equal to half of a load index of said tire;
- e) acquiring a first image of said footprint area at said predetermined value of the perpendicular force;
- f) subsequently increasing said value of the perpendicular force linearly for one minute up to a maximum value equal to said load index and, subsequently, keeping said tire pushed against said resting surface with said force equal to said maximum value for a time interval equal to 5 minutes;
- g) subsequently decreasing said value of the perpendicular force linearly for one minute from said maximum value down to said predetermined value and acquiring a second image of said footprint area at said predetermined value;
- h) associating a corresponding pressure value with each pixel of the first and second image by way of said characteristic curve;
- According to the Applicant, the above-mentioned characteristics make the pressure distribution detection method particularly accurate and sensitive.
- In fact, the fact that at the predetermined maximum pressure to be detected, the characteristic curve assumes a grey-level value that is less than or equal to 90% of said full-scale grey level, makes it possible to measure all pressure values in the range of interest, thus avoiding that a substantial number of pixels assume a saturation or near-saturation grey level. In this situation, it would in fact become difficult to distinguish between different pressure values that would give rise to the same saturation grey level or to very close grey levels.
- Moreover, the fact that the first derivative of the characteristic curve is greater than or equal to 2 levels of grey per bar at least in a pressure range comprised between 10% and 70% of the maximum pressure, ensures sufficient differentiation of the brightness response of pixels corresponding to slightly different pressure levels, and thus sufficient sensitivity.
- Furthermore, according to the Applicant, the above-mentioned requirement in relation to the above-mentioned test run ensures that the interposed sheet does not adhere to the plate, or that the adherence thereof is sufficiently slight. In fact, in the case of excessive adhesion to the plate, the sheet leaves spurious regions of brightness originating from the previous measurements, which bring about changes in excess of the measured pressure values. The test run mentioned above was developed by the Applicant to verify that these spurious regions of brightness do not exceed a threshold of acceptability.
- Furthermore, according to the Applicant, this requirement ensures that the interposed sheet does not unacceptably generate memory effects, owing to which, due to excessive relaxation times of the material after removal of the cause of the deformation, the material retains at least part of the deformations to which it was subjected in the previous tests, yielding measured pressure values that are higher than the real values.
- Note that the present invention encompasses in the above-mentioned measurement method, the use of any sheet that meets the requirements described hereinabove relative to the characteristic curve and the test run, regardless of the fact that this characteristic curve is actually determined and/or the test run is actually carried out for the purpose of selecting the sheet.
- The present invention can offer one or more of the following preferred characteristics.
- Preferably, at said predetermined maximum pressure to be detected, said characteristic curve assumes a grey-level value that is less than or equal to 80% of said full-scale grey level, more preferably less than or equal to 70% of said full-scale grey level. In this manner, even higher dynamics are ensured in the range of interest.
- Preferably, said characteristic curve has a first derivative that is greater than or equal to 3 levels of grey per bar, more preferably greater than or equal to 5 levels of grey per bar, at least in a pressure range comprised between 10% and 70% of said maximum pressure, more preferably between 10% and 90% of said maximum pressure. Sensitivity in the desired measurement range is thus optimized.
- Preferably, said characteristic curve has a first derivative that is less than or equal to 50 levels of grey per bar, more preferably less than 30 levels of grey per bar, at least in a pressure range comprised between 10% and 70% of said maximum pressure, more preferably between 10% and 80% of said maximum pressure. Sensitivity in sufficiently broad measurement range is thus optimized.
- Said sheet is preferably made of elastomeric thermoplastic polyurethane.
- The term "elastomeric thermoplastic polyurethane" is understood as elastomeric polyurethane polyethers and elastomeric polyurethane polyesters.
- Generally, polyurethanes are understood as the products of the polymerization of at least one polyalcohol (polyol) having two or more hydroxyl groups per molecule with at least one isocyanate having two or more isocyanate groups per molecule (polyisocyanate). Depending on the type of polyol, the polyurethanes are further divided into two main groups: polyethers and polyesters.
- The isocyanates used in the preparation of the present elastomeric polyurethanes can be of the aliphatic type, preferably selected from among diisocyanates such as hexamethylene diisocyanate, isophorone diisocyanate, or dicyclohexyl-4,4' diisocyanate, or of the aromatic type, preferably selected from among diisocyanates such as naphthalene diisocyanate, para-phenylene diisocyanate, toluene diisocyanate (TDI) and methylene diphenyl diisocyanate (MDI), more preferably methylene diphenyl diisocyanate. Preferred elastomeric thermoplastic polyurethanes are those obtained by polymerization of aromatic isocyanates, more preferably by polymerization of aromatic diisocyanates selected from among naphthalene diisocyanate, para-phenylene diisocyanate, toluene diisocyanate (TDI) and methylene diphenyl diisocyanate (MDI).
- Short-chain diols such as 1,4-butanediol for example can be used as rigid phase "chain extenders".
- Preferred polyether polyurethanes are those obtained by polymerization of isocyanates, preferably of aromatic isocyanates, with polyols derived mainly from the polymerization of tetrahydrofuran (polyTHF), from the polymerization of propylene oxide or the polymerization of ethylene oxide, or by mixtures of propylene oxide and ethylene oxide.
- Preferred polyester polyurethanes are those obtained by polymerization of isocyanates, preferably of aromatic isocyanates, with polyols derived preferably from the polymerization of aliphatic dicarboxylic acids, including for example adipic acid, with glycols, preferably ethylene glycol, or from the polymerization of caprolactone.
- Elastomeric polyurethanes that are suitable as the principal, preferably sole, components of the elastomeric film according to the present invention are selected from the group of elastomeric thermoplastic polyurethanes (TPU) marketed under the trade names of Argoflex® (Argotec), Argothane® (Argotec), Epurex Platilon® line, preferably Platilon® U (Covestro), Desmopan® (Covestro), Texin® (Covestro), Pearlthane™ (Lubrizol), Estane® (Lubrizol), Pellethane® (Lubrizol), Elastollan® (BASF), and Adilithe® (Merylithe).
- The elastomeric thermoplastic polyurethanes marketed under the trade names of Argoflex® 19205 (polyether), Argothane® 19103 (polyether), Epurex Platilon® line, more preferably Platilon® U like Epurex U073 (polyether), Epurex 4201AU (polyether) and Epurex 4100D (polyester), and Platilon® U 4180 DK are particularly preferred.
- Preferably, said sheet is of a thickness of less than or equal to 150 microns, more preferably less than or equal to 100 microns, and/or more than or equal to 10 microns.
- In fact, the Applicant has found that the above-mentioned materials and/or the above-mentioned thicknesses give the sheet optimal characteristics in terms of the quality of the results of the measurement method, consistently with the fact of meeting the above-mentioned selection requirements.
- In another aspect, the invention concerns a method for detecting a pressure distribution in a footprint area of a tire, comprising:
- arranging said tire mounted on a wheel rim and inflated;
- arranging a plate of transparent material having a resting surface, and a camera suitable for acquiring images of said resting surface;
- inputting a beam of light rays into the plate, said light rays propagating at an angle, with respect to a line perpendicular to said resting surface, said angle being greater than an internal critical angle associated with said resting surface;
- pushing a tread of said tire against said resting surface with a force, for the purpose of generating said footprint area on said resting surface and acquiring an image of said footprint area;
- processing said image for the purpose of detecting said pressure distribution in said footprint area;
- In another aspect, the invention concerns a system for detecting a pressure distribution in a footprint area of a tire, the system comprising a plate of transparent material having a resting surface, a camera suitable for acquiring a digital image of said resting surface, a light source configured to input a beam of light rays into the plate, said light rays propagating into the plate at an angle, with respect to a line perpendicular to said resting surface, said angle being greater than an internal critical angle associated with said resting surface, and a sheet placed in contact with said resting surface, said sheet being made of elastomeric thermoplastic polyurethane, as described hereinabove.
- Further characteristics and advantages will become more apparent from the detailed description of several example, but not exclusive, embodiments of a method and a system for detecting a pressure distribution in the footprint area of a tire in accordance with the present invention. This description is provided herein below with reference to the attached drawings, which are provided solely as approximate and thus non-limiting examples, and of which:
-
Figure 1 is a schematic side view, which is not to scale, showing an exemplary measurement system in accordance with the present invention. -
Figure 2 is a schematic perspective view of a calibration device for determining the characteristic curves. -
Figures 3-5 show some examples of characteristic curves, solely for illustrative purposes. An exemplary measurement system in accordance with the present invention and that implements the method of the present invention is indicated inFigure 1 by thenumber 1. - The
system 1 comprises aplate 2 of transparent material having a resting surface 3. Suitable transparent materials can consist of glass, plexiglass or PMMA. - The
system 1 comprises acamera 4 typically arranged under the plate and oriented so as to acquire digital images of the resting surface 3. - Suitable light sources 5 (e.g. LEDs) are arranged laterally with respect to the plate so as to enable inputting of a beam of
light rays 6 into the plate, saidlight rays 6 propagating inside the plate owing to the phenomenon of total internal reflection. Based on this phenomenon, the rays forming an angle 7, with respect to the line perpendicular to the resting surface, said angle being greater than the internal critical angle associated with the resting surface, are reflected totally. For example, in the case of a glass plate in air, this internal critical angle is equal to about 41°. - When a
tread 11 of atire 10 is rested on the resting surface, this total internal reflection is suppressed because of the variation in the refraction index of the medium external to the plate. Therefore, somelight rays 8 are diffused by the resting surface and they can be captured by thecamera 4. - Typically, the greater the pressure exerted locally by the tire on the resting surface, the greater the number of rays diffused locally by the resting surface, in that the number of contact points between the tread and the surface is greater.
- Therefore, the corresponding pressure can be associated with a given grey level in the image acquired by the camera (grey levels corresponding to the brightness detected).
- During measurement, a sheet 9 is interposed in contact between the resting surface 3 and the
tread 11 of thetire 10. - Therefore, for the purpose of associating, pixel by pixel, the corresponding pressure levels with the grey levels in the image acquired by the camera, the characteristic curve of the sheet 9 associated with the test system used to acquire the image and essentially made up of the plate, the sheet, the lighting system (under the operating conditions utilized to acquire the image) and the camera (under the operating conditions utilized to acquire the image) should be known. These operating conditions are determined beforehand through the acquisition of a plurality of images obtained by varying the most influential parameters (including for example sensor sensitivity, exposure time, power of the light source, etc.) and selecting one of the conditions that has generated images of acceptable quality. These conditions are maintained during the pressure distribution detection process.
- A
calibration device 20 of the type shown inFigure 2 can be used for the purpose of determining the characteristic curve. - This device, which is substantially shaped in the form of a cup made of a metal such as steel, has a
cavity 21 within which the pressure can be changed, for example by letting air in or out through aconduit 22 in communication with the cavity. A suitable gasket 23 (e.g. an O-ring) extends around the entire circular edge to ensure sufficient airtightness. - The
device 20 is rested on the sheet 9 of thesystem 1, without thetire 10, with thegasket 23 adhering to the sheet 9, and the pressure in thecavity 21 is regulated. - The
device 20 is of a diameter that is adequate (for example 5 cm) for thedevice 20 to exert substantially homogeneous pressure on a sufficiently large area of the sheet 9. - Furthermore, the
device 20 is of a weight that is suitable (for example 200 g) for developing adequate pressure inside thecavity 21, e.g. 10 bar. - One then proceeds to change the pressure in the
cavity 21 in a controlled manner and the corresponding grey-level value is detected, mediating on the area affected by thedevice 20. -
Figure 3 shows some examples of characteristics curves that meet the requirements of the present invention, in which the predetermined maximum pressure to be detected is equal to 10 bar. The vertical axis inFigure 3 represents the pressure expressed in bars and the horizontal axis represents the corresponding grey-level value (wherein the full scale is equal to 256). As can be seen, at the maximum pressure of 10 bar, the characteristic curves have a grey-level value that is less than or equal to 230 levels of grey (that is, 90% of the full-scale grey level). -
Figure 4 compares an example of a characteristic curve (line 102) that meets the requirements of the present invention and an example of a comparative curve (line 101) that tends to saturate too quickly, the predetermined maximum pressure to be detected being equal to 10 bar. At the maximum pressure,line 102 has a grey level equal to about 100 (below 90% of the full scale), whereasline 101 has a grey level equal to about 250 (above 90% of the full scale). -
Figure 5 compares the above-mentioned example of a characteristic curve (line 102) and a comparative curve (line 501) that has a derivative that is too low (less than 2 levels of grey per bar), determining excessive lowering of the corresponding grey-level values. - To detect the pressure distribution in a footprint area of the tire, one can proceed using the following method.
- The
tire 10 to be tested is mounted on a wheel rim and inflated at a pressure of at least 0.5 bar, typically between 1 and 3 bar. - After having rested the
tread 11 on the sheet 9, the tread is pushed against the resting surface with acertain force 15, for example applied on the axis of the wheel rim and directed perpendicularly to the plate (inFigure 1 , theforce 15 is directed vertically downwards). In this manner, a footprint is generated on the resting surface, said footprint having a pressure distribution on the footprint area. - At this point, a digital image of the footprint area is acquired, in which a grey level is associated with each pixel, the image being characterized by a full-scale grey level, for example equal to level 256 for the maximum brightness.
- The image is then processed (as known and described for example in the articles cited hereinabove and included here for reference) for the purpose of detecting the pressure distribution in the footprint area, using the characteristic curve associated with the test system used.
- According to the present invention, the sheet 9 used is for example a sheet of polyurethane marketed by Covestro® with the name Platilon® U 4180 DK Night Black and having a thickness of 25 µm.
- Subjecting the above-mentioned sheet of Platilon® U 4180 DK Night Black to the above-mentioned test run, with an inflation pressure equal to 2 bar and with a load equal to 400 Kg, the difference, in absolute value, between the first and the second area as defined above is equal to about 2% of the first area.
Claims (12)
- A method for detecting a pressure distribution in a footprint area of a tire (10), comprising:- arranging said tire mounted on a wheel rim and inflated;- arranging a plate (2) of transparent material having a resting surface (3), and a camera (4) suitable for acquiring images of said resting surface;- inputting a beam of light rays (6) into the plate, said light rays (6) propagating at an angle (7), with respect to a line perpendicular to said resting surface, said angle (7) being greater than an internal critical angle associated with said resting surface;- pushing a tread (11) of said tire against said resting surface with a force, for the purpose of generating said footprint area on said resting surface and acquiring an image of said footprint area;- processing said image for the purpose of detecting said pressure distribution in said footprint area;wherein a sheet (9) is interposed between said tread (11) and said resting surface (3) during the acquisition of said image, said sheet being made of elastomeric thermoplastic polyurethane.
- The method according to claim 1, wherein said sheet (9) is made of elastomeric polyurethane polyether or elastomeric polyurethane polyester.
- The method according to claim 1 or 2, wherein said elastomeric thermoplastic polyurethane is obtained by polymerization of aromatic isocyanates.
- The method according to claim 3, wherein said elastomeric thermoplastic polyurethane is obtained by polymerization of aromatic diisocyanates selected from among: naphthalene diisocyanate, para-phenylene diisocyanate, toluene diisocyanate (TDI) and methylene diphenyl diisocyanate (MDI).
- The method according to any one of the preceding claims, wherein said elastomeric thermoplastic polyurethane is selected from the group of elastomeric thermoplastic polyurethanes (TPU) marketed under the trade names of Argoflex® (Argotec), Argothane® (Argotec), Epurex Platilon® line, preferably Platilon® U (Covestro), Desmopan® (Covestro), Texin® (Covestro), Pearlthane™ (Lubrizol), Estane® (Lubrizol), Pellethane® (Lubrizol), Elastollan® (BASF), and Adilithe® (Merylithe).
- The method according to any one of the preceding claims, where said sheet (9) is of a thickness of less than or equal to 150 microns and more than or equal to 10 microns.
- A system (1) for detecting a pressure distribution in a footprint area of a tire (10), the system comprising:- a plate (2) of transparent material having a resting surface (3),- a camera (4) suitable for acquiring a digital image of said resting surface (11);- a light source (5) configured to input a beam of light rays (6) into the plate, said light rays (6) being propagated into the plate at an angle (7), with respect to a line perpendicular to said resting surface, said angle (7) being greater than an internal critical angle associated with said resting surface;- a sheet (9) placed in contact with said resting surface, said sheet (9) being made of elastomeric thermoplastic polyurethane.
- The system according to claim 7, wherein said sheet (9) is made of elastomeric polyurethane polyether or elastomeric polyurethane polyester.
- The system according to claim 7 or 8, wherein said elastomeric thermoplastic polyurethane is obtained by polymerization of aromatic isocyanates.
- The system according to claim 9, wherein said elastomeric thermoplastic polyurethane is obtained by polymerization of aromatic diisocyanates selected from among: naphthalene diisocyanate, para-phenylene diisocyanate, toluene diisocyanate (TDI) and methylene diphenyl diisocyanate (MDI).
- The system according to any one of claims 7 to 10, wherein said elastomeric thermoplastic polyurethane is selected from the group of elastomeric thermoplastic polyurethanes (TPU) marketed under the trade names of Argoflex® (Argotec), Argothane® (Argotec), Epurex Platilon® line, preferably Platilon® U (Covestro), Desmopan® (Covestro), Texin® (Covestro), Pearlthane™ (Lubrizol), Estane® (Lubrizol), Pellethane® (Lubrizol), Elastollan® (BASF), and Adilithe® (Merylithe).
- The system according to any one of claims 7 to 11, where said sheet (9) is of a thickness of less than or equal to 150 microns and more than or equal to 10 microns.
Applications Claiming Priority (3)
| Application Number | Priority Date | Filing Date | Title |
|---|---|---|---|
| IT201600098247 | 2016-09-30 | ||
| EP17781192.4A EP3519792B1 (en) | 2016-09-30 | 2017-09-22 | Method and system for detecting a pressure distribution in a footprint area of a tire |
| PCT/IB2017/055752 WO2018060819A1 (en) | 2016-09-30 | 2017-09-22 | Method and system for detecting a pressure distribution in a footprint area of a tire |
Related Parent Applications (2)
| Application Number | Title | Priority Date | Filing Date |
|---|---|---|---|
| EP17781192.4A Division EP3519792B1 (en) | 2016-09-30 | 2017-09-22 | Method and system for detecting a pressure distribution in a footprint area of a tire |
| EP17781192.4A Division-Into EP3519792B1 (en) | 2016-09-30 | 2017-09-22 | Method and system for detecting a pressure distribution in a footprint area of a tire |
Publications (2)
| Publication Number | Publication Date |
|---|---|
| EP4450950A2 true EP4450950A2 (en) | 2024-10-23 |
| EP4450950A3 EP4450950A3 (en) | 2024-11-13 |
Family
ID=57910006
Family Applications (2)
| Application Number | Title | Priority Date | Filing Date |
|---|---|---|---|
| EP24198501.9A Pending EP4450950A3 (en) | 2016-09-30 | 2017-09-22 | Method and system for detecting a pressure distribution in a footprint area of a tire |
| EP17781192.4A Active EP3519792B1 (en) | 2016-09-30 | 2017-09-22 | Method and system for detecting a pressure distribution in a footprint area of a tire |
Family Applications After (1)
| Application Number | Title | Priority Date | Filing Date |
|---|---|---|---|
| EP17781192.4A Active EP3519792B1 (en) | 2016-09-30 | 2017-09-22 | Method and system for detecting a pressure distribution in a footprint area of a tire |
Country Status (4)
| Country | Link |
|---|---|
| EP (2) | EP4450950A3 (en) |
| CN (1) | CN109716098B (en) |
| BR (1) | BR112019004905B1 (en) |
| WO (1) | WO2018060819A1 (en) |
Families Citing this family (2)
| Publication number | Priority date | Publication date | Assignee | Title |
|---|---|---|---|---|
| IT201800010155A1 (en) * | 2018-11-08 | 2020-05-08 | Bridgestone Europe Nv Sa | UNIT AND TEST METHOD TO OPTICALLY ACQUIRE A GROUND FOOTPRINT OR ANALOGUE FEATURE OF A TIRE |
| CN113569872B (en) * | 2021-08-10 | 2024-03-19 | 大连海事大学 | A multi-resolution shoe footprint sequence recognition method based on pressure saliency |
Citations (1)
| Publication number | Priority date | Publication date | Assignee | Title |
|---|---|---|---|---|
| ES2222776A1 (en) | 2002-02-25 | 2005-02-01 | Universidad De Malaga | SYSTEM OF MEASURING THE DISTRIBUTION OF NORMAL PRESSURES AND THE GEOMETRY OF THE CONTACT IN THE FOOTPRINT CONTACT FOOTPRINT WITH ITS BEARING TRACK. |
Family Cites Families (6)
| Publication number | Priority date | Publication date | Assignee | Title |
|---|---|---|---|---|
| US5347588A (en) * | 1991-10-11 | 1994-09-13 | Bridgestone | Method and apparatus for video imaging of tire ground contact patch |
| US5777219A (en) * | 1996-10-16 | 1998-07-07 | Bridgestone/Firestone, Inc. | Apparatus and related methods for automatically testing and analyzing tires utilizing a test pod with a slidably movable cover plate and a gray scale normalization technique |
| CN2468032Y (en) * | 2001-03-13 | 2001-12-26 | 上海轮胎橡胶(集团)股份有限公司 | Forced type tread and tyre body deformed volume testing equipment |
| CN201740650U (en) * | 2010-06-24 | 2011-02-09 | 浙江吉利汽车研究院有限公司 | Angle-adjustable camera installation rack used for automobile safety test |
| DE102012208177A1 (en) * | 2012-05-16 | 2013-11-21 | Robert Bosch Gmbh | Method and system for automatically optically inspecting a tread pattern of at least one wheel of a vehicle |
| FR3030373B1 (en) * | 2014-12-17 | 2018-03-23 | Continental Automotive France | METHOD FOR ESTIMATING THE RELIABILITY OF WHEEL SENSOR MEASUREMENTS OF A VEHICLE AND SYSTEM FOR IMPLEMENTING SAID METHOD |
-
2017
- 2017-09-22 EP EP24198501.9A patent/EP4450950A3/en active Pending
- 2017-09-22 EP EP17781192.4A patent/EP3519792B1/en active Active
- 2017-09-22 CN CN201780058087.XA patent/CN109716098B/en active Active
- 2017-09-22 WO PCT/IB2017/055752 patent/WO2018060819A1/en not_active Ceased
- 2017-09-22 BR BR112019004905-3A patent/BR112019004905B1/en active IP Right Grant
Patent Citations (1)
| Publication number | Priority date | Publication date | Assignee | Title |
|---|---|---|---|---|
| ES2222776A1 (en) | 2002-02-25 | 2005-02-01 | Universidad De Malaga | SYSTEM OF MEASURING THE DISTRIBUTION OF NORMAL PRESSURES AND THE GEOMETRY OF THE CONTACT IN THE FOOTPRINT CONTACT FOOTPRINT WITH ITS BEARING TRACK. |
Non-Patent Citations (3)
| Title |
|---|
| CASTILLOPÉREZ DE LA BLANCACABRERASIMÓN: "Vehicle System Dynamics", February 2007, UNIVERSITY OF MALAGA, article "An optical tire contact pressure test bench" |
| CHELIZANONISABATO: "Pirelli Tyre - Akron", 2014, POLITECNICO DI MILANO, article "Validation of a frustrated total internal reflection test bench for tire footprint pressure measurement" |
| ROTHMOORETURNER: "SEM X International Congress & Exposition on Experimental & Applied Mechanics", 2004, BRIDGESTONE/FIRESTONE NORTH AMERICAN TIRE, article "An Optical Method for Normal Contact Stress Measurement with Applications to Tire-Road Interaction" |
Also Published As
| Publication number | Publication date |
|---|---|
| BR112019004905A2 (en) | 2019-06-04 |
| CN109716098A (en) | 2019-05-03 |
| EP3519792B1 (en) | 2024-11-06 |
| WO2018060819A1 (en) | 2018-04-05 |
| CN109716098B (en) | 2021-02-05 |
| EP3519792C0 (en) | 2024-11-06 |
| EP3519792A1 (en) | 2019-08-07 |
| BR112019004905B1 (en) | 2023-04-04 |
| EP4450950A3 (en) | 2024-11-13 |
Similar Documents
| Publication | Publication Date | Title |
|---|---|---|
| EP3519792B1 (en) | Method and system for detecting a pressure distribution in a footprint area of a tire | |
| CN101896806B (en) | Methods for evaluation by comparing acquired images with reference images | |
| EP2793013A1 (en) | Automotive shop service apparatus having means for determining the rolling resistance coefficient of a tyre | |
| EP1810851A2 (en) | Apparatus and method for detecting an internal mechanical failure occurring in a tire | |
| EP2986937B1 (en) | Method for assessing the state of hair | |
| CN106530291A (en) | Polished surface detection method and system based on image processing | |
| US10365084B2 (en) | Bead measurement system | |
| DE10062251A1 (en) | Device and method for checking the quality of a body | |
| EP2931470B1 (en) | Efficient high speed uniformity measurements using speed ramps | |
| US20250137877A1 (en) | Method and apparatus for quality control of ophthalmic lenses | |
| KR20130105684A (en) | Calibration method for multi-component force detector provided in rolling resistance testing machine | |
| US20030205080A1 (en) | Cross-correlation method for identification and removal of machine contribution from tire uniformity measurements | |
| US8028570B2 (en) | Method for testing tires | |
| Rindler et al. | Moisture related elastic and viscoelastic behaviour of wood adhesives by means of in-situ nanoindentation | |
| WO1999049286A2 (en) | Method and apparatus for determining tire inflation status | |
| CN111982711A (en) | Single shear test method for shear-resistant elastic modulus of plate-type rubber support | |
| AU2016327397B2 (en) | Method for recognizing wear state of conveyor belt | |
| CN114354541A (en) | Rice processing precision detection method and system | |
| CN109477772A (en) | Method and apparatus for checking tires | |
| KR101920912B1 (en) | Method for recycling carbon fiber used | |
| Leucker et al. | Novel objective test method for the abrasion and pilling behaviour of low basis weight spunbond polypropylene nonwovens | |
| Emeigh et al. | The effects of balloon thickness on the viability of a microfluidic cell compression device | |
| EP3175214B1 (en) | Tire uniformity improvement through identification of measurement process harmonics | |
| US10613001B2 (en) | Apparatus and method for measuring diametrical stiffness of tread ring | |
| KR102220349B1 (en) | Apparatus and method for testing self healiing property |
Legal Events
| Date | Code | Title | Description |
|---|---|---|---|
| PUAI | Public reference made under article 153(3) epc to a published international application that has entered the european phase |
Free format text: ORIGINAL CODE: 0009012 |
|
| STAA | Information on the status of an ep patent application or granted ep patent |
Free format text: STATUS: THE APPLICATION HAS BEEN PUBLISHED |
|
| PUAL | Search report despatched |
Free format text: ORIGINAL CODE: 0009013 |
|
| AC | Divisional application: reference to earlier application |
Ref document number: 3519792 Country of ref document: EP Kind code of ref document: P |
|
| AK | Designated contracting states |
Kind code of ref document: A2 Designated state(s): AL AT BE BG CH CY CZ DE DK EE ES FI FR GB GR HR HU IE IS IT LI LT LU LV MC MK MT NL NO PL PT RO RS SE SI SK SM TR |
|
| AK | Designated contracting states |
Kind code of ref document: A3 Designated state(s): AL AT BE BG CH CY CZ DE DK EE ES FI FR GB GR HR HU IE IS IT LI LT LU LV MC MK MT NL NO PL PT RO RS SE SI SK SM TR |
|
| RIC1 | Information provided on ipc code assigned before grant |
Ipc: G01M 17/02 20060101AFI20241004BHEP |
|
| STAA | Information on the status of an ep patent application or granted ep patent |
Free format text: STATUS: REQUEST FOR EXAMINATION WAS MADE |
|
| 17P | Request for examination filed |
Effective date: 20250507 |