EP4434462A1 - Method and system for determining cardiac abnormalities using chaos-based classification model from multi-lead ecg - Google Patents
Method and system for determining cardiac abnormalities using chaos-based classification model from multi-lead ecg Download PDFInfo
- Publication number
- EP4434462A1 EP4434462A1 EP23217587.7A EP23217587A EP4434462A1 EP 4434462 A1 EP4434462 A1 EP 4434462A1 EP 23217587 A EP23217587 A EP 23217587A EP 4434462 A1 EP4434462 A1 EP 4434462A1
- Authority
- EP
- European Patent Office
- Prior art keywords
- feature
- data
- chaos
- time series
- features
- Prior art date
- Legal status (The legal status is an assumption and is not a legal conclusion. Google has not performed a legal analysis and makes no representation as to the accuracy of the status listed.)
- Granted
Links
Images

Classifications
-
- A—HUMAN NECESSITIES
- A61—MEDICAL OR VETERINARY SCIENCE; HYGIENE
- A61B—DIAGNOSIS; SURGERY; IDENTIFICATION
- A61B5/00—Measuring for diagnostic purposes; Identification of persons
- A61B5/72—Signal processing specially adapted for physiological signals or for diagnostic purposes
- A61B5/7235—Details of waveform analysis
- A61B5/7264—Classification of physiological signals or data, e.g. using neural networks, statistical classifiers, expert systems or fuzzy systems
-
- A—HUMAN NECESSITIES
- A61—MEDICAL OR VETERINARY SCIENCE; HYGIENE
- A61B—DIAGNOSIS; SURGERY; IDENTIFICATION
- A61B5/00—Measuring for diagnostic purposes; Identification of persons
- A61B5/24—Detecting, measuring or recording bioelectric or biomagnetic signals of the body or parts thereof
- A61B5/316—Modalities, i.e. specific diagnostic methods
- A61B5/318—Heart-related electrical modalities, e.g. electrocardiography [ECG]
-
- A—HUMAN NECESSITIES
- A61—MEDICAL OR VETERINARY SCIENCE; HYGIENE
- A61B—DIAGNOSIS; SURGERY; IDENTIFICATION
- A61B5/00—Measuring for diagnostic purposes; Identification of persons
- A61B5/24—Detecting, measuring or recording bioelectric or biomagnetic signals of the body or parts thereof
- A61B5/316—Modalities, i.e. specific diagnostic methods
- A61B5/318—Heart-related electrical modalities, e.g. electrocardiography [ECG]
- A61B5/346—Analysis of electrocardiograms
- A61B5/349—Detecting specific parameters of the electrocardiograph cycle
-
- A—HUMAN NECESSITIES
- A61—MEDICAL OR VETERINARY SCIENCE; HYGIENE
- A61B—DIAGNOSIS; SURGERY; IDENTIFICATION
- A61B5/00—Measuring for diagnostic purposes; Identification of persons
- A61B5/24—Detecting, measuring or recording bioelectric or biomagnetic signals of the body or parts thereof
- A61B5/316—Modalities, i.e. specific diagnostic methods
- A61B5/318—Heart-related electrical modalities, e.g. electrocardiography [ECG]
- A61B5/346—Analysis of electrocardiograms
- A61B5/349—Detecting specific parameters of the electrocardiograph cycle
- A61B5/361—Detecting fibrillation
-
- A—HUMAN NECESSITIES
- A61—MEDICAL OR VETERINARY SCIENCE; HYGIENE
- A61B—DIAGNOSIS; SURGERY; IDENTIFICATION
- A61B5/00—Measuring for diagnostic purposes; Identification of persons
- A61B5/72—Signal processing specially adapted for physiological signals or for diagnostic purposes
-
- A—HUMAN NECESSITIES
- A61—MEDICAL OR VETERINARY SCIENCE; HYGIENE
- A61B—DIAGNOSIS; SURGERY; IDENTIFICATION
- A61B5/00—Measuring for diagnostic purposes; Identification of persons
- A61B5/72—Signal processing specially adapted for physiological signals or for diagnostic purposes
- A61B5/7235—Details of waveform analysis
- A61B5/7264—Classification of physiological signals or data, e.g. using neural networks, statistical classifiers, expert systems or fuzzy systems
- A61B5/7267—Classification of physiological signals or data, e.g. using neural networks, statistical classifiers, expert systems or fuzzy systems involving training the classification device
-
- A—HUMAN NECESSITIES
- A61—MEDICAL OR VETERINARY SCIENCE; HYGIENE
- A61B—DIAGNOSIS; SURGERY; IDENTIFICATION
- A61B5/00—Measuring for diagnostic purposes; Identification of persons
- A61B5/72—Signal processing specially adapted for physiological signals or for diagnostic purposes
- A61B5/7271—Specific aspects of physiological measurement analysis
-
- G—PHYSICS
- G06—COMPUTING OR CALCULATING; COUNTING
- G06N—COMPUTING ARRANGEMENTS BASED ON SPECIFIC COMPUTATIONAL MODELS
- G06N3/00—Computing arrangements based on biological models
- G06N3/02—Neural networks
- G06N3/04—Architecture, e.g. interconnection topology
- G06N3/045—Combinations of networks
-
- G—PHYSICS
- G16—INFORMATION AND COMMUNICATION TECHNOLOGY [ICT] SPECIALLY ADAPTED FOR SPECIFIC APPLICATION FIELDS
- G16H—HEALTHCARE INFORMATICS, i.e. INFORMATION AND COMMUNICATION TECHNOLOGY [ICT] SPECIALLY ADAPTED FOR THE HANDLING OR PROCESSING OF MEDICAL OR HEALTHCARE DATA
- G16H50/00—ICT specially adapted for medical diagnosis, medical simulation or medical data mining; ICT specially adapted for detecting, monitoring or modelling epidemics or pandemics
- G16H50/20—ICT specially adapted for medical diagnosis, medical simulation or medical data mining; ICT specially adapted for detecting, monitoring or modelling epidemics or pandemics for computer-aided diagnosis, e.g. based on medical expert systems
-
- G—PHYSICS
- G16—INFORMATION AND COMMUNICATION TECHNOLOGY [ICT] SPECIALLY ADAPTED FOR SPECIFIC APPLICATION FIELDS
- G16H—HEALTHCARE INFORMATICS, i.e. INFORMATION AND COMMUNICATION TECHNOLOGY [ICT] SPECIALLY ADAPTED FOR THE HANDLING OR PROCESSING OF MEDICAL OR HEALTHCARE DATA
- G16H50/00—ICT specially adapted for medical diagnosis, medical simulation or medical data mining; ICT specially adapted for detecting, monitoring or modelling epidemics or pandemics
- G16H50/30—ICT specially adapted for medical diagnosis, medical simulation or medical data mining; ICT specially adapted for detecting, monitoring or modelling epidemics or pandemics for calculating health indices; for individual health risk assessment
-
- G—PHYSICS
- G16—INFORMATION AND COMMUNICATION TECHNOLOGY [ICT] SPECIALLY ADAPTED FOR SPECIFIC APPLICATION FIELDS
- G16H—HEALTHCARE INFORMATICS, i.e. INFORMATION AND COMMUNICATION TECHNOLOGY [ICT] SPECIALLY ADAPTED FOR THE HANDLING OR PROCESSING OF MEDICAL OR HEALTHCARE DATA
- G16H50/00—ICT specially adapted for medical diagnosis, medical simulation or medical data mining; ICT specially adapted for detecting, monitoring or modelling epidemics or pandemics
- G16H50/70—ICT specially adapted for medical diagnosis, medical simulation or medical data mining; ICT specially adapted for detecting, monitoring or modelling epidemics or pandemics for mining of medical data, e.g. analysing previous cases of other patients
-
- G—PHYSICS
- G06—COMPUTING OR CALCULATING; COUNTING
- G06N—COMPUTING ARRANGEMENTS BASED ON SPECIFIC COMPUTATIONAL MODELS
- G06N3/00—Computing arrangements based on biological models
- G06N3/02—Neural networks
Definitions
- the embodiments herein generally relate to the field of Machine learning based cardiac abnormality detection and, more particularly, to a method and system for determining cardiac abnormalities using chaos-based classification model from multi-lead electrocardiogram (ECG) signals.
- ECG electrocardiogram
- Machine Learning has a significant role in the automation of early diagnosis of diseases.
- Chaos theory provides a good non-linear dynamics model for a time-series.
- biological systems like the human heart are non-linear but not completely random (stochastic).
- ECG electrocardiogram
- Studies have shown that there is a strong indication of ECG being a non-linear chaotic signal.
- chaos theory parameters are used to extract pure ECG signals from noisy ECG. Attempts have been made towards usage of chaos-based features for classifying ECG into various classes of arrhythmia.
- Embodiments of the present disclosure present technological improvements as solutions to one or more of the above-mentioned technical problems recognized by the inventors in conventional systems.
- a method for determining cardiac abnormalities includes segmenting time series data associated with multi-lead electrocardiogram (ECG) signals captured for each of a plurality of subjects, into a plurality of overlapping windows. Further, the method includes decomposing the time series data associated with each of the plurality of overlapping windows to generate raw (RAW) data comprising windowed decomposed time series. Further, the method includes applying de-trending and de-seasonalizing on the windowed decomposed time series data to generate Trend and Seasonally Adjusted (TSA) data. Furthermore, the method includes deriving a plurality of features from at least one of the RAW data and the TSA data.
- ECG electrocardiogram
- the plurality of features comprising: a) a chaos feature for the RAW data providing a uni-dimensional measure of cardiac abnormalities present in each windowed decomposed time series; b) a set of chaos-related statistical features comprising, i) a non-linearity feature and a Chebyshev distance feature for the RAW data and the TSA data, and ii) a spectral flatness feature and a self-similarity feature for the RAW data, to add multiple dimensions to the chaos feature for generating a holistic view of the cardiac abnormalities; and c) a set of statistical features comprising, i) a serial correlation feature, a skewness feature and a kurtosis feature for the RAW data and the TSA data, ii) a trend feature and a seasonality feature for the TSA data, and iii) a periodicity feature for the RAW data, providing statistical distribution of the cardiac abnormalities.
- the method includes identifying a set of significant features from among the plurality of features using a feature importance technique. Further, the method includes training a chaos-based classification model on the set of significant features derived for each of the plurality of subject to classify the plurality of subjects into one of an abnormal class and a normal class.
- the method includes utilizing the trained chaos-based classification model during inferencing stage to classify an unseen subject into one of the normal class and the abnormal class in accordance with the set of significant features derived from the multi-lead ECG signal recorded for the unseen subject for a predefined duration of an ECG recording by segmenting the ECG recording into the plurality of overlapping windows, wherein the abnormal class indicates the unseen subject suffering from Atrial Fibrillation (AF), and the normal class indicates the unseen subject to be healthy with Sinus Rhythm.
- AF Atrial Fibrillation
- a system for determining cardiac abnormalities comprises a memory, storing instructions; one or more Input/Output (I/O) interfaces; and one or more hardware processors coupled to the memory via the one or more I/O interfaces, wherein the one or more hardware processors are configured by the instructions to determine cardiac abnormalities is provided. Further, the one or more hardware processors are configured to segment time series data associated with multi-lead electrocardiogram (ECG) signals captured for each of a plurality of subj ects, into a plurality of overlapping windows.
- ECG electrocardiogram
- the one or more hardware processors are configured to decompose the time series data associated with each of the plurality of overlapping windows to generate raw (RAW) data comprising windowed decomposed time series. Further, the one or more hardware processors are configured to apply de-trending and de-seasonalizing on the windowed decomposed time series data to generate Trend and Seasonally Adjusted (TSA) data. Furthermore, the one or more hardware processors are configured to derive a plurality of features from at least one of the RAW data and the TSA data.
- RAW raw
- TSA Trend and Seasonally Adjusted
- the plurality of features comprising: a) a chaos feature for the RAW data providing a uni-dimensional measure of cardiac abnormalities present in each windowed decomposed time series; b) a set of chaos-related statistical features comprising, i) a non-linearity feature and a Chebyshev distance feature for the RAW data and the TSA data, and ii) a spectral flatness feature and a self-similarity feature for the RAW data, to add multiple dimensions to the chaos feature for generating a holistic view of the cardiac abnormalities; and c) a set of statistical features comprising, i) a serial correlation feature, a skewness feature and a kurtosis feature for the RAW data and the TSA data, ii) a trend feature and a seasonality feature for the TSA data, and iii) a periodicity feature for the RAW data, providing statistical distribution of the cardiac abnormalities.
- the one or more hardware processors are configured to identify a set of significant features from among the plurality of features using a feature importance technique. Further, the one or more hardware processors are configured to train a chaos-based classification model on the set of significant features derived for each of the plurality of subject to classify the plurality of subjects into one of an abnormal class and a normal class.
- the one or more hardware processors are configured to utilize the trained chaos-based classification model during inferencing stage to classify an unseen subject into one of the normal class and the abnormal class in accordance with the set of significant features derived from the multi-lead ECG signal recorded for the unseen subject for a predefined duration of an ECG recording by segmenting the ECG recording into the plurality of overlapping windows, wherein the abnormal class indicates the unseen subject suffering from Atrial Fibrillation (AF), and the normal class indicates the unseen subject to be healthy with Sinus Rhythm.
- AF Atrial Fibrillation
- one or more non-transitory machine-readable information storage mediums comprising one or more instructions, which when executed by one or more hardware processors causes a method for determining cardiac abnormalities.
- the method includes segment time series data associated with multi-lead electrocardiogram (ECG) signals captured for each of a plurality of subjects, into a plurality of overlapping windows. Further, the method includes decomposing the time series data associated with each of the plurality of overlapping windows to generate raw (RAW) data comprising windowed decomposed time series. Further, the method includes applying de-trending and de-seasonalizing on the windowed decomposed time series data to generate Trend and Seasonally Adjusted (TSA) data.
- ECG electrocardiogram
- TSA Trend and Seasonally Adjusted
- the method includes deriving a plurality of features from at least one of the RAW data and the TSA data.
- the plurality of features comprising: a) a chaos feature for the RAW data providing a uni-dimensional measure of cardiac abnormalities present in each windowed decomposed time series; b) a set of chaos-related statistical features comprising, i) a non-linearity feature and a Chebyshev distance feature for the RAW data and the TSA data, and ii) a spectral flatness feature and a self-similarity feature for the RAW data, to add multiple dimensions to the chaos feature for generating a holistic view of the cardiac abnormalities; and c) a set of statistical features comprising, i) a serial correlation feature, a skewness feature and a kurtosis feature for the RAW data and the TSA data, ii) a trend feature and a seasonality feature for the TSA data, and iii) a periodicity feature for the RAW data,
- the method includes identifying a set of significant features from among the plurality of features using a feature importance technique. Further, the method includes training a chaos-based classification model on the set of significant features derived for each of the plurality of subject to classify the plurality of subjects into one of an abnormal class and a normal class.
- the method includes utilizing the trained chaos-based classification model during inferencing stage to classify an unseen subject into one of the normal class and the abnormal class in accordance with the set of significant features derived from the multi-lead ECG signal recorded for the unseen subject for a predefined duration of an ECG recording by segmenting the ECG recording into the plurality of overlapping windows, wherein the abnormal class indicates the unseen subject suffering from Atrial Fibrillation (AF), and the normal class indicates the unseen subject to be healthy with Sinus Rhythm.
- AF Atrial Fibrillation
- Embodiments of the present disclosure provide a method and system for determining cardiac abnormalities using chaos-based classification model from multi-lead electrocardiogram (ECG) signals.
- ECG electrocardiogram
- the method disclosed combines the commonly used chaos parameter with other set of chaos-related statistical parameters like non-linearity, self-similarity, Chebyshev distance and spectral flatness for a holistic approach towards the study of cardiac abnormalities.
- the method disclosed thus attempts to use above Machine Learning (ML) based measures for disease classification.
- ML Machine Learning
- the Chebyshev distance and the Spectral flatness have not been used so far to identify chaos in a disease detection environment.
- AF Atrial Fibrillation
- VF Ventricular Fibrillation
- Sinus Arrhythmia Ventricular Tachycardia
- VT Ventricular Tachycardia
- the method provides computation of percentage AF burden (AFB).
- AFB percentage AF burden
- the processor(s) 104 can be one or more hardware processors 104.
- the one or more hardware processors 104 can be implemented as one or more microprocessors, microcomputers, microcontrollers, digital signal processors, central processing units, state machines, logic circuitries, and/or any devices that manipulate signals based on operational instructions.
- the one or more hardware processors 104 are configured to fetch and execute computer-readable instructions stored in the memory 102.
- the system 100 can be implemented in a variety of computing systems including laptop computers, notebooks, hand-held devices such as mobile phones, workstations, mainframe computers, servers, and the like.
- the I/O interface(s) 106 can include a variety of software and hardware interfaces, for example, a web interface, a graphical user interface to display subject's cardiac status and findings, and the like and can facilitate multiple communications within a wide variety of networks N/W and protocol types, including wired networks, for example, LAN, cable, etc., and wireless networks, such as WLAN, cellular and the like.
- the I/O interface (s) 106 can include one or more ports for connecting to a number of external devices or to another server or devices.
- the memory 102 may include any computer-readable medium known in the art including, for example, volatile memory, such as static random access memory (SRAM) and dynamic random access memory (DRAM), and/or non-volatile memory, such as read only memory (ROM), erasable programmable ROM, flash memories, hard disks, optical disks, and magnetic tapes.
- volatile memory such as static random access memory (SRAM) and dynamic random access memory (DRAM)
- DRAM dynamic random access memory
- non-volatile memory such as read only memory (ROM), erasable programmable ROM, flash memories, hard disks, optical disks, and magnetic tapes.
- the memory 102 includes a plurality of modules 110 such as a chaos-based classification model, a AFB computation module, and so on as depicted in FIG. 1B .
- the plurality of modules 110 include programs or coded instructions that supplement applications or functions performed by the system 100 for executing different steps involved in the process of determining cardiac abnormalities using the chaos-based classification model from multi-lead ECG signals, being performed by the system 100.
- the plurality of modules 110 can include routines, programs, objects, components, and data structures, which performs particular tasks or implement particular abstract data types.
- the plurality of modules 110 may also be used as, signal processor(s), node machine(s), logic circuitries, and/or any other device or component that manipulates signals based on operational instructions. Further, the plurality of modules 110 can be used by hardware, by computer-readable instructions executed by the one or more hardware processors 104, or by a combination thereof. The plurality of modules 110 can include various sub-modules (not shown).
- the memory 102 may comprise information pertaining to input(s)/output(s) of each step performed by the processor(s) 104 of the system 100 and methods of the present disclosure.
- the memory 102 includes a database 108.
- the database (or repository) 108 may include a plurality of abstracted piece of code for refinement and data that is processed, received, or generated as a result of the execution of the plurality of modules in the module(s) 110.
- the database 108 is shown internal to the system 100, it will be noted that, in alternate embodiments, the database 108 can also be implemented external to the system 100, and communicatively coupled to the system 100. The data contained within such external database may be periodically updated. For example, new data may be added into the database (not shown in FIG.
- LDAP Lightweight Directory Access Protocol
- RDBMS Relational Database Management System
- FIG. 1B illustrates an architectural overview of the system of FIG. 1A , in accordance with some embodiments of the present disclosure.
- system 100 performs i) data acquisition from the multi-lead ECG signals and ii) data analysis using the feature extraction module, the chaos-based classification module, and the AF burden computation module, explained in conjunction with FIG. 2 .
- data presentation is performed such that the data associated with results of chaos-based classification model and the AF burden is presented in a physician friendly manner.
- a Lorenz plot well known in the art can be used to display the findings such as report arrhythmia via the I/O interface 106 to a collocated or remotely located physician in a manner that physicians understand.
- the ECG recording analysis is detailed in steps of FIG. 2 . It is to be noted, however, that the ECG analysis is lightweight and in health monitoring environments where a remote physician is not involved, the warning signal derived from findings can be provided to the patient/subject with an indication to visit their cardiologist. This is typically useful when the system100 is implemented in the form of a smart wearable. However, for more clinical use-cases like implantable loop recorders, the system 100 can send the data to a cloud server, with minimal local processing to determine irregularity, for further analysis of Atrial Fibrillation (AF) and determination of the AF burden. In one embodiment, as this system 100 uses window-based time-series analysis methods, it is capable of providing AF burden values, which is considered an important factor. As detailed in studies and discussed in literature, AF burden is important factor to decide the treatment, and for AF ablation therapy.
- AF burden is important factor to decide the treatment, and for AF ablation therapy.
- FIGS. 2A and 2B (collectively referred as FIG. 2 ) is a flow diagram illustrating a method 200 for determining cardiac abnormalities using the chaos-based classification model from multi-lead ECG signals, using the system of FIG. 1A , in accordance with some embodiments of the present disclosure.
- the system 100 comprises one or more data storage devices or the memory 102 operatively coupled to the processor(s) 104 and is configured to store instructions for execution of steps of the method 200 by the processor(s) or one or more hardware processors 104.
- the steps of the method 200 of the present disclosure will now be explained with reference to the components or blocks of the system 100 as depicted in FIG. 1A and 1B and the steps of flow diagram as depicted in FIG. 2 .
- the one or more hardware processors 104 segment time series data associated with the multi-lead electrocardiogram (ECG) signals captured for each of a plurality of subjects, into a plurality of overlapping windows.
- ECG electrocardiogram
- the method utilizes a 3-sec window. For a case where the heart rate is low, at least 2-3 beats will be present in a 3-sec window. The error in identifying ectopic beat is less in a short period, which increases the accuracy in computing AF Burden. Additionally, analyzing the time series data over such a short period provides better information extraction for deriving more accurate insights as the number of windows is higher and increases the training instances. The information extraction from such a small window size is enabled due to the unique combination of the plurality of features used by method 200, as described in step 208 below.
- the one or more hardware processors 104 decomposes, using a Box-Cox transformation decomposition model, the time series data associated with each of the plurality of overlapping windows to generate raw (RAW) data comprising windowed decomposed time series.
- RAW raw
- the one or more hardware processors 104 apply de-trending and de-seasonalizing on the windowed decomposed time series data to generate Trend and Seasonally Adjusted (TSA) data.
- TSA Trend and Seasonally Adjusted
- the one or more hardware processors 104 derive the plurality of features, via the feature extraction module ( FIG. 1B ) executed by the one or more hardware processor 104, from at least one of the RAW data and the TSA data.
- decomposing the data is necessary so that the data is fit for statistical measuring. Therefore, to obtain a precise and comprehensive calibration, some measures are calculated on both the raw time series data (referring as 'RAW' data), as well as the remaining time series after de-trending and de-seasonalizing (referring as "Trend and Seasonally Adjusted (TSA)" data).
- TSA Seasonally Adjusted
- not all features can be computed on the TSA data because, after de-seasonalizing there is no such concept as periodicity.
- some features are both for RAW and TSA data, some features are for only RAW data and some only for TSA data.
- the plurality of features comprise:
- Non-linearity which determines structure of a time series, can be found using Teraesvirta Test.
- Self-similarity is basically the long-range dependence structure in a time series that can be found using Hurst exponent.
- Chaos is characterized by sensitive dependence on initial values. Recognizing and quantifying chaos in time series represent helps to understand the nature of random behavior and reveal the extent to which short-term forecasts may be improved.
- Chaos is found using Lyupanov Exponent. Chebyshev distance measures distance between two points as the maximum difference over any of their axis values.
- Chebyshev distance will be the max, which means it captures if there is any of the above regularly missing, which is definitely a sign of abnormality.
- the spectral flatness is calculated by dividing the geometric mean of the power spectrum by the arithmetic mean of the power spectrum.
- time-series measures like autocorrelation, trend etc., are taken because they can give a detailed view of the statistical distribution.
- the one or more hardware processors 104 identify a set of significant features from among the plurality of features using a feature importance technique.
- the method 200 in one example uses a 5-fold cross validation and run a random forest and a Gaussian SVM. Results are averaged over 5-folds.
- the Table 2 below shows average accuracy, sensitivity, specificity, and F1-score along with their standard deviations in parentheses. Here sensitivity is regarding the detection of abnormal cases and specificity is regarding the detection of normal cases. It was observed that random forest gives better result.
- Table 2 Accuracy Sensitivity Specificity F1 Score SVM 0.62(0.11) 0.53(0.07) 0.73(0.11) 0.58(0.09) RF 0.73(0.06) 0.79(0.03) 0.71 0.05) 0.75(0.06)
- Feature importance Based on the random forest result, the feature importance analysis is performed using any feature importance model. Few example techniques are mentioned below:
- the one or more hardware processors 104 train the chaos-based classification model on the set of significant features derived for each of the plurality of subject to classify the plurality of subjects into one of an abnormal class and a normal class.
- the classification of time series is based on their structural characteristics. Unlike other alternatives, the method 200 does not classify point values using a distance metric, rather it classifies based on global features extracted from the time series.
- the feature measures are obtained from each individual series and can be fed into arbitrary classification algorithms, including Support Vector Machine (SVM), random forest, naive Bayes, or neural network.
- SVM Support Vector Machine
- Global measures describing the time series are obtained by applying statistical operations that best capture the underlying characteristics: trend, seasonality, periodicity, serial correlation, skewness, kurtosis, chaos, non-linearity, and self-similarity. Since the method 200uses extracted global measures, it reduces the dimensionality of the time series and is much less sensitive to missing or noisy data.
- the one or more hardware processors 104 utilize the trained chaos-based classification model during inferencing stage to classify an unseen subject into one of the normal class and the abnormal class.
- the set of significant features is derived from the multi-lead ECG signal recorded for the unseen subject for a predefined duration of an ECG recording, wherein the recorded ECG signal is segmented into the plurality of overlapping windows.
- the abnormal class indicates the unseen subject suffering from Atrial Fibrillation (AF)
- the normal class indicates the unseen subject to be healthy with Sinus Rhythm.
- the system 100 via the AFB computation module computes percentage of time spent in AF state by the subject within an observation period. For example, a patient is monitored for 24 hours, and time spent in AF is 2 hours, then percentage AF Burden is 8.33 (2/24*100). Obtaining accurate time spent in AF is dependent on accurate Normal/Abnormal classification. AF burden is usually computed over 14 days, however, for experiment herein, the system 100 calculates it over the time available due to the limitation of dataset length. For each subject, we calculate AFB % with respect to the total time monitored using below equation:
- D AF N AF ⁇ AF Avg ⁇ D Ovlp + D ovlp
- D Ovl p AF Avg ⁇ 0.5
- AFB % D AF / D T ⁇ 100
- D AF is the duration of AF and D T is the predefined duration of the ECG recording
- N AF is the number of AF windows detected for the unseen subject during the predefined duration of the ECG recording
- AF Avg is an average of an AF time over the plurality of overlapping windows of the entire ECG recording
- Do vlp is the AF time in the plurality of overlapping windows of the ECG recording, which is 50% of the AF Avg .
- a uni-variate time series is the simplest form of temporal data and is a sequence of real numbers collected regularly in time, where each number represents a value.
- the time series herein is represented as an ordered set of n real-valued variables.
- Time series can be described using a variety of qualitative terms such as seasonal, trending, noisy, non-linear, chaos, etc.
- decomposition is a critical step to transform the series into a format for statistical measuring. Therefore, to obtain a precise and comprehensive calibration, some measures are calculated on both the raw time series data (referring as ⁇ RAW' data), as well as the remaining time series after de-trending and de-seasonalizing (referring as "Trend and Seasonally Adjusted (TSA)" data). But some features can only be calculated on raw data to obtain meaningful measures, such as periodicity, etc. As exhibited in the table 1, a total of thirteen measures are extracted from each time series including seven on the RAW data and six on the TSA data. These measures later become inputs to the chaos-based classification model.
- the thirteen measures are a finite set used to quantify the global characteristics of any time series, regardless of its length and missing values. For each of the features described below, a most appropriate way to measure the presence of the feature is used, and ultimately normalize the metric to [0, 1] to indicate the degree of presence of the feature. A measure near 0 for a certain time series indicates an absence of the feature, while a measure near 1 indicates a strong presence of the feature. The calculation of the measures and scaling transformations has been coded using the R language.
- Spectral flatness The spectral flatness or tonality coefficient is also known as ⁇ Wiener Entropy' and is used to characterize the purity of an audio spectrum with respect to its tone. A high spectral flatness indicates a more white-noise signal. As well known in the art, spectral flatness is calculated by dividing the geometric mean of the power spectrum by the arithmetic mean of the power spectrum. Since spectral flatness gives the tonality of a signal, it should map to sinus rhythm of the ECG signal. In other words, high spectral flatness in ECG would indicate a wider distribution of the ECG spectrum at a given time. Therefore, arrhythmia should correlate well with the feature.
- Chebyshev distance is a metric defined on a vector space where the distance between two vectors is the greatest of their differences along any coordinate dimension. Thus, Chebyshev distance provides the maximum separation between two vectors. If an attempt is made to find the corresponding Chebyshev distance between two cardiac cycles, it will be along the dimension where the spectrum is maximum. If the distance is high, it means there is some anomaly in beat-to-beat dynamics indicating chaos, which can be a good indicator of arrhythmia.
- Non-linearity Nonlinear time series models have been used extensively in recent years to model complex dynamics not adequately represented use linear models. Because of the special characteristic (behavior) of time series data, the traditional linear models cannot handle the forecasting well compared to non-linear models. Therefore, non-linearity is an important characteristic of time series data to determine the selection of appropriate forecasting method.
- Teraesvirta's neural network test for time series data ⁇ non-linearity characteristics identification and extraction. It is a test for neglected nonlinearity likely to have power against a range of alternatives based on neural network model (augmented single-hidden-layer feed forward neural network model). The test is based on a test function chosen as the activation of 'phantom' hidden units.
- non-linearity essentially means the underlying state space models need to be reconstructed time and again and possibly after certain periodic cycles. That means the heartbeat may show irregularity since they do not come from a unified state space model, which can be an indicator of arrhythmia.
- Self-similarity Processes with long-range dependence have attracted a good deal of attention from probabilistic and theoretical physicists.
- the subject of self-similarity and the estimation of statistical parameters of time series in the presence of long-range dependence are becoming more common in several fields of science, to which the time series analysis and forecasting on a recent research topic of network traffic, has drawn a particular attention.
- This feature With such increasing importance of the 'self-similarity (long-range dependence)' as one of time series characteristics, this feature is included, although it is not widely used or is neglected in time series feature identification.
- the definition of self-similarity most related to the properties of time series is the self-similarity parameter Hurst exponent (H).
- the Self-similarity feature is only detected from the RAW data.
- ECG signal may behave in microlevel quite differently than in macro level, e.g., a signal observed over few seconds vs a signal observed over 5 minutes. This leads to the logical conclusion that something happens in the signal that causes to deflect in long range from its usual cyclic pattern. This can be an indicator of heart bit irregularities and thus, arrhythmia.
- Trend and seasonality are common features of time series, and it is natural to characterize a time series by its degree of trend and seasonality.
- de-trend and de-seasonalize the time series can be done to enable additional features such as noise or chaos to be more easily detectable.
- a trend pattern exists when there is a long-term change in the mean level.
- a smooth nonparametric method such as the penalized regression spline can be used.
- a seasonal pattern exists when a time series is influenced by seasonal factors, such as month of the year or day of the week.
- the seasonality of a time series is defined as a pattern that repeats itself over fixed intervals of time. In general, the seasonality can be found by identifying a large autocorrelation coefficient or a large partial autocorrelation coefficient at the seasonal lag.
- the basic decomposition model using Box-Cox transformation is used.
- Periodicity Since the periodicity is very important for determining the seasonality and examining the cyclic pattern of the time series, the periodicity feature extraction becomes a necessity. Unfortunately, many time series available from the dataset in different domains do not always come with known frequency or regular periodicity.
- the method 200 discloses a new approach to measure the periodicity in univariate time series. The periodicity detection is only applied for RAW data. The time series is detrended using a regression spline with 3 knots and autocorrelations for all lags up to 1/3 of series length is determined. Thereafter peaks and troughs are identified in autocorrelation function. Frequency is the first peak provided with the following conditions:
- a measure is extracted, which shows the degree of serial correlation of the dataset, to detect the series if it can fit a white noise model. The larger the degree is, noisier the series is. Normally in the white noise series, there are no recurring cycles (periodicity) in the data because each observation is completely independent of all other observations. A Box-Pierce statistics in used to estimate the serial correlation measure, and to extract the measures from both RAW and TSA data.
- Atrial Fibrillation AF
- the R-R peak intervals become chaotic, and the P-waves also are randomly missing, with intermittent F-waves (flutter) being present.
- Flutter F-waves
- the method and system disclosed herein provide a framework which uses chaos-based time series model on a multi-lead ECG signal to determine spatial distribution (across subjects) of anomaly-related parameters in the ECG signal, and also depicts how such chaos-related components have a pathophysiological basis based on the underlying condition.
- the unique combination of 16 features used herein enables classifying ECG into various conditions and provides a robust and explainable approach to classify arrhythmia on the basis of ECG signals.
- chaos-based features can be used to classify rare cardiac conditions accurately for which ample data is not available. This should be possible because the underlying method is not heavily empirical but uses very principled features based on knowledge of cardiac disorders.
- Such computer-readable storage means contain program-code means for implementation of one or more steps of the method, when the program runs on a server or mobile device or any suitable programmable device.
- the hardware device can be any kind of device which can be programmed including e.g., any kind of computer like a server or a personal computer, or the like, or any combination thereof.
- the device may also include means which could be e.g., hardware means like e.g., an application-specific integrated circuit (ASIC), a field-programmable gate array (FPGA), or a combination of hardware and software means, e.g., an ASIC and an FPGA, or at least one microprocessor and at least one memory with software processing components located therein.
- the means can include both hardware means, and software means.
- the method embodiments described herein could be implemented in hardware and software.
- the device may also include software means. Alternatively, the embodiments may be implemented on different hardware devices, e.g., using a plurality of CPUs.
- the embodiments herein can comprise hardware and software elements.
- the embodiments that are implemented in software include but are not limited to, firmware, resident software, microcode, etc.
- the functions performed by various components described herein may be implemented in other components or combinations of other components.
- a computer-usable or computer readable medium can be any apparatus that can comprise, store, communicate, propagate, or transport the program for use by or in connection with the instruction execution system, apparatus, or device.
- a computer-readable storage medium refers to any type of physical memory on which information or data readable by a processor may be stored.
- a computer-readable storage medium may store instructions for execution by one or more processors, including instructions for causing the processor(s) to perform steps or stages consistent with the embodiments described herein.
- the term "computer-readable medium” should be understood to include tangible items and exclude carrier waves and transient signals, i.e., be non-transitory. Examples include random access memory (RAM), read-only memory (ROM), volatile memory, nonvolatile memory, hard drives, CD ROMs, DVDs, flash drives, disks, and any other known physical storage media.
Landscapes
- Health & Medical Sciences (AREA)
- Engineering & Computer Science (AREA)
- Life Sciences & Earth Sciences (AREA)
- Public Health (AREA)
- Medical Informatics (AREA)
- Biomedical Technology (AREA)
- Physics & Mathematics (AREA)
- General Health & Medical Sciences (AREA)
- Pathology (AREA)
- Cardiology (AREA)
- Biophysics (AREA)
- Molecular Biology (AREA)
- Heart & Thoracic Surgery (AREA)
- Surgery (AREA)
- Animal Behavior & Ethology (AREA)
- Veterinary Medicine (AREA)
- Artificial Intelligence (AREA)
- Data Mining & Analysis (AREA)
- Computer Vision & Pattern Recognition (AREA)
- Psychiatry (AREA)
- Physiology (AREA)
- Signal Processing (AREA)
- Primary Health Care (AREA)
- Evolutionary Computation (AREA)
- Epidemiology (AREA)
- Databases & Information Systems (AREA)
- Mathematical Physics (AREA)
- Theoretical Computer Science (AREA)
- Fuzzy Systems (AREA)
- General Physics & Mathematics (AREA)
- General Engineering & Computer Science (AREA)
- Software Systems (AREA)
- Computing Systems (AREA)
- Computational Linguistics (AREA)
- Measurement And Recording Of Electrical Phenomena And Electrical Characteristics Of The Living Body (AREA)
- Probability & Statistics with Applications (AREA)
- Bioinformatics & Cheminformatics (AREA)
- Bioinformatics & Computational Biology (AREA)
- Evolutionary Biology (AREA)
Abstract
Description
- The present application claims priority to
Indian application no. 202321019383, filed on March 21, 2023 - The embodiments herein generally relate to the field of Machine learning based cardiac abnormality detection and, more particularly, to a method and system for determining cardiac abnormalities using chaos-based classification model from multi-lead electrocardiogram (ECG) signals.
- Machine Learning (ML) has a significant role in the automation of early diagnosis of diseases. Chaos theory provides a good non-linear dynamics model for a time-series. As well-known in the literature, biological systems like the human heart are non-linear but not completely random (stochastic). Hence, a normal electrocardiogram (ECG) signal may be best described as a signal having non-linear deterministic chaos. Studies have shown that there is a strong indication of ECG being a non-linear chaotic signal. Further, chaos theory parameters are used to extract pure ECG signals from noisy ECG. Attempts have been made towards usage of chaos-based features for classifying ECG into various classes of arrhythmia.
- However, the features considered by the works in the literature still have limitations in accurately detecting whether the arrhythmia so noticed is progressing towards an associated disease or is an abrupt/random event due to the subject's current state. Further, these methods rely on windows of around 10 seconds of ECG recordings (time series data) to detect the presence of arrhythmia or cardiac abnormalities. Therefore, significant window periods pose a challenge in accurate AF Burden computation. Furthermore, the number of heartbeats is also high for a more substantial window duration; therefore, the chances of error in AF Burden computation are also high.
- Thus, improvement in the accuracy of disease diagnosis associated with cardiac abnormalities is an open research area.
- Embodiments of the present disclosure present technological improvements as solutions to one or more of the above-mentioned technical problems recognized by the inventors in conventional systems.
- For example, in one embodiment, a method for determining cardiac abnormalities is provided. The method includes segmenting time series data associated with multi-lead electrocardiogram (ECG) signals captured for each of a plurality of subjects, into a plurality of overlapping windows. Further, the method includes decomposing the time series data associated with each of the plurality of overlapping windows to generate raw (RAW) data comprising windowed decomposed time series. Further, the method includes applying de-trending and de-seasonalizing on the windowed decomposed time series data to generate Trend and Seasonally Adjusted (TSA) data. Furthermore, the method includes deriving a plurality of features from at least one of the RAW data and the TSA data. The plurality of features comprising: a) a chaos feature for the RAW data providing a uni-dimensional measure of cardiac abnormalities present in each windowed decomposed time series; b) a set of chaos-related statistical features comprising, i) a non-linearity feature and a Chebyshev distance feature for the RAW data and the TSA data, and ii) a spectral flatness feature and a self-similarity feature for the RAW data, to add multiple dimensions to the chaos feature for generating a holistic view of the cardiac abnormalities; and c) a set of statistical features comprising, i) a serial correlation feature, a skewness feature and a kurtosis feature for the RAW data and the TSA data, ii) a trend feature and a seasonality feature for the TSA data, and iii) a periodicity feature for the RAW data, providing statistical distribution of the cardiac abnormalities.
- Further, the method includes identifying a set of significant features from among the plurality of features using a feature importance technique. Further, the method includes training a chaos-based classification model on the set of significant features derived for each of the plurality of subject to classify the plurality of subjects into one of an abnormal class and a normal class.
- Furthermore, the method includes utilizing the trained chaos-based classification model during inferencing stage to classify an unseen subject into one of the normal class and the abnormal class in accordance with the set of significant features derived from the multi-lead ECG signal recorded for the unseen subject for a predefined duration of an ECG recording by segmenting the ECG recording into the plurality of overlapping windows, wherein the abnormal class indicates the unseen subject suffering from Atrial Fibrillation (AF), and the normal class indicates the unseen subject to be healthy with Sinus Rhythm.
- In another aspect, a system for determining cardiac abnormalities is provided. The system comprises a memory, storing instructions; one or more Input/Output (I/O) interfaces; and one or more hardware processors coupled to the memory via the one or more I/O interfaces, wherein the one or more hardware processors are configured by the instructions to determine cardiac abnormalities is provided. Further, the one or more hardware processors are configured to segment time series data associated with multi-lead electrocardiogram (ECG) signals captured for each of a plurality of subj ects, into a plurality of overlapping windows. Further, the one or more hardware processors are configured to decompose the time series data associated with each of the plurality of overlapping windows to generate raw (RAW) data comprising windowed decomposed time series. Further, the one or more hardware processors are configured to apply de-trending and de-seasonalizing on the windowed decomposed time series data to generate Trend and Seasonally Adjusted (TSA) data. Furthermore, the one or more hardware processors are configured to derive a plurality of features from at least one of the RAW data and the TSA data. The plurality of features comprising: a) a chaos feature for the RAW data providing a uni-dimensional measure of cardiac abnormalities present in each windowed decomposed time series; b) a set of chaos-related statistical features comprising, i) a non-linearity feature and a Chebyshev distance feature for the RAW data and the TSA data, and ii) a spectral flatness feature and a self-similarity feature for the RAW data, to add multiple dimensions to the chaos feature for generating a holistic view of the cardiac abnormalities; and c) a set of statistical features comprising, i) a serial correlation feature, a skewness feature and a kurtosis feature for the RAW data and the TSA data, ii) a trend feature and a seasonality feature for the TSA data, and iii) a periodicity feature for the RAW data, providing statistical distribution of the cardiac abnormalities.
- Further, the one or more hardware processors are configured to identify a set of significant features from among the plurality of features using a feature importance technique. Further, the one or more hardware processors are configured to train a chaos-based classification model on the set of significant features derived for each of the plurality of subject to classify the plurality of subjects into one of an abnormal class and a normal class.
- Furthermore, the one or more hardware processors are configured to utilize the trained chaos-based classification model during inferencing stage to classify an unseen subject into one of the normal class and the abnormal class in accordance with the set of significant features derived from the multi-lead ECG signal recorded for the unseen subject for a predefined duration of an ECG recording by segmenting the ECG recording into the plurality of overlapping windows, wherein the abnormal class indicates the unseen subject suffering from Atrial Fibrillation (AF), and the normal class indicates the unseen subject to be healthy with Sinus Rhythm.
- In yet another aspect, there are provided one or more non-transitory machine-readable information storage mediums comprising one or more instructions, which when executed by one or more hardware processors causes a method for determining cardiac abnormalities. The method includes segment time series data associated with multi-lead electrocardiogram (ECG) signals captured for each of a plurality of subjects, into a plurality of overlapping windows. Further, the method includes decomposing the time series data associated with each of the plurality of overlapping windows to generate raw (RAW) data comprising windowed decomposed time series. Further, the method includes applying de-trending and de-seasonalizing on the windowed decomposed time series data to generate Trend and Seasonally Adjusted (TSA) data. Furthermore, the method includes deriving a plurality of features from at least one of the RAW data and the TSA data. The plurality of features comprising: a) a chaos feature for the RAW data providing a uni-dimensional measure of cardiac abnormalities present in each windowed decomposed time series; b) a set of chaos-related statistical features comprising, i) a non-linearity feature and a Chebyshev distance feature for the RAW data and the TSA data, and ii) a spectral flatness feature and a self-similarity feature for the RAW data, to add multiple dimensions to the chaos feature for generating a holistic view of the cardiac abnormalities; and c) a set of statistical features comprising, i) a serial correlation feature, a skewness feature and a kurtosis feature for the RAW data and the TSA data, ii) a trend feature and a seasonality feature for the TSA data, and iii) a periodicity feature for the RAW data, providing statistical distribution of the cardiac abnormalities.
- Further, the method includes identifying a set of significant features from among the plurality of features using a feature importance technique. Further, the method includes training a chaos-based classification model on the set of significant features derived for each of the plurality of subject to classify the plurality of subjects into one of an abnormal class and a normal class.
- Furthermore, the method includes utilizing the trained chaos-based classification model during inferencing stage to classify an unseen subject into one of the normal class and the abnormal class in accordance with the set of significant features derived from the multi-lead ECG signal recorded for the unseen subject for a predefined duration of an ECG recording by segmenting the ECG recording into the plurality of overlapping windows, wherein the abnormal class indicates the unseen subject suffering from Atrial Fibrillation (AF), and the normal class indicates the unseen subject to be healthy with Sinus Rhythm.
- It is to be understood that both the foregoing general description and the following detailed description are exemplary and explanatory only and are not restrictive of the invention, as claimed.
- The accompanying drawings, which are incorporated in and constitute a part of this disclosure, illustrate exemplary embodiments and, together with the description, serve to explain the disclosed principles:
-
FIG. 1A is a functional block diagram of a system for determining cardiac abnormalities using a chaos-based classification model from multi-lead electrocardiogram (ECG) signals, in accordance with some embodiments of the present disclosure. -
FIG. 1B illustrates an architectural overview of the system ofFIG. 1A , in accordance with some embodiments of the present disclosure. -
FIGS. 2A and2B (collectively referred asFIG. 2 ) is a flow diagram illustrating a method for determining cardiac abnormalities using the chaos-based classification model from multi-lead ECG signals, using the system ofFIG. 1A , in accordance with some embodiments of the present disclosure. - It should be appreciated by those skilled in the art that any block diagrams herein represent conceptual views of illustrative systems and devices embodying the principles of the present subject matter. Similarly, it will be appreciated that any flow charts, flow diagrams, and the like represent various processes which may be substantially represented in computer readable medium and so executed by a computer or processor, whether or not such computer or processor is explicitly shown.
- Exemplary embodiments are described with reference to the accompanying drawings. In the figures, the left-most digit(s) of a reference number identifies the figure in which the reference number first appears. Wherever convenient, the same reference numbers are used throughout the drawings to refer to the same or like parts. While examples and features of disclosed principles are described herein, modifications, adaptations, and other implementations are possible without departing from the scope of the disclosed embodiments.
- Improvement in accuracy of diseases diagnosis associated with cardiac abnormalities is an open research area. Appropriate feature selection to capture the underlying signs of a disease is critical in Machine Learning (ML) based approaches.
- Embodiments of the present disclosure provide a method and system for determining cardiac abnormalities using chaos-based classification model from multi-lead electrocardiogram (ECG) signals. The method disclosed combines the commonly used chaos parameter with other set of chaos-related statistical parameters like non-linearity, self-similarity, Chebyshev distance and spectral flatness for a holistic approach towards the study of cardiac abnormalities. The method disclosed thus attempts to use above Machine Learning (ML) based measures for disease classification. The Chebyshev distance and the Spectral flatness have not been used so far to identify chaos in a disease detection environment.
- Pathophysiology along with temporal information across leads is captured by the set of chaos-related features used herein, which contribute to improving the accuracy of detection of various cardiac diseases arising due to cardiac abnormalities such as Atrial Fibrillation (AF), Ventricular Fibrillation (VF), Sinus Arrhythmia, Ventricular Tachycardia (VT), complex conditions like VF followed by VT, and the like.
- Furthermore, the method provides computation of percentage AF burden (AFB). The improved accuracy in detection of AF, effectively contributes to improved accuracy in percentage AFB.
- Referring now to the drawings, and more particularly to
FIGS. 1A through 2B , where similar reference characters denote corresponding features consistently throughout the figures, there are shown preferred embodiments and these embodiments are described in the context of the following exemplary system and/or method. -
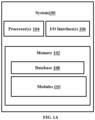
FIG. 1A is a functional block diagram of asystem 100 for determining cardiac abnormalities using a chaos-based classification model from multi-lead electrocardiogram (ECG) signals, in accordance with some embodiments of the present disclosure. In an embodiment, thesystem 100 includes a processor(s) 104, communication interface device(s), alternatively referred as input/output (I/O) interface(s) 106, and one or more data storage devices or amemory 102 operatively coupled to the processor(s) 104. Thesystem 100 with one or more hardware processors is configured to execute functions of one or more functional blocks of thesystem 100. - Referring to the components of
system 100, in an embodiment, the processor(s) 104, can be one ormore hardware processors 104. In an embodiment, the one ormore hardware processors 104 can be implemented as one or more microprocessors, microcomputers, microcontrollers, digital signal processors, central processing units, state machines, logic circuitries, and/or any devices that manipulate signals based on operational instructions. Among other capabilities, the one ormore hardware processors 104 are configured to fetch and execute computer-readable instructions stored in thememory 102. In an embodiment, thesystem 100 can be implemented in a variety of computing systems including laptop computers, notebooks, hand-held devices such as mobile phones, workstations, mainframe computers, servers, and the like. - The I/O interface(s) 106 can include a variety of software and hardware interfaces, for example, a web interface, a graphical user interface to display subject's cardiac status and findings, and the like and can facilitate multiple communications within a wide variety of networks N/W and protocol types, including wired networks, for example, LAN, cable, etc., and wireless networks, such as WLAN, cellular and the like. In an embodiment, the I/O interface (s) 106 can include one or more ports for connecting to a number of external devices or to another server or devices.
- The
memory 102 may include any computer-readable medium known in the art including, for example, volatile memory, such as static random access memory (SRAM) and dynamic random access memory (DRAM), and/or non-volatile memory, such as read only memory (ROM), erasable programmable ROM, flash memories, hard disks, optical disks, and magnetic tapes. - In an embodiment, the
memory 102 includes a plurality ofmodules 110 such as a chaos-based classification model, a AFB computation module, and so on as depicted inFIG. 1B . The plurality ofmodules 110 include programs or coded instructions that supplement applications or functions performed by thesystem 100 for executing different steps involved in the process of determining cardiac abnormalities using the chaos-based classification model from multi-lead ECG signals, being performed by thesystem 100. The plurality ofmodules 110, amongst other things, can include routines, programs, objects, components, and data structures, which performs particular tasks or implement particular abstract data types. The plurality ofmodules 110 may also be used as, signal processor(s), node machine(s), logic circuitries, and/or any other device or component that manipulates signals based on operational instructions. Further, the plurality ofmodules 110 can be used by hardware, by computer-readable instructions executed by the one ormore hardware processors 104, or by a combination thereof. The plurality ofmodules 110 can include various sub-modules (not shown). - Further, the
memory 102 may comprise information pertaining to input(s)/output(s) of each step performed by the processor(s) 104 of thesystem 100 and methods of the present disclosure. Further, thememory 102 includes adatabase 108. The database (or repository) 108 may include a plurality of abstracted piece of code for refinement and data that is processed, received, or generated as a result of the execution of the plurality of modules in the module(s) 110. Although thedatabase 108 is shown internal to thesystem 100, it will be noted that, in alternate embodiments, thedatabase 108 can also be implemented external to thesystem 100, and communicatively coupled to thesystem 100. The data contained within such external database may be periodically updated. For example, new data may be added into the database (not shown inFIG. 1A ) and/or existing data may be modified and/or non-useful data may be deleted from the database. In one example, the data may be stored in an external system, such as a Lightweight Directory Access Protocol (LDAP) directory and a Relational Database Management System (RDBMS). Functions of the components of thesystem 100 are now explained with reference toFIG. 1B and steps in flow diagrams inFIG. 2 . -
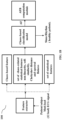
FIG. 1B illustrates an architectural overview of the system ofFIG. 1A , in accordance with some embodiments of the present disclosure. In one embodiment, whereinsystem 100 is built for AF detection, thesystem 100 performs i) data acquisition from the multi-lead ECG signals and ii) data analysis using the feature extraction module, the chaos-based classification module, and the AF burden computation module, explained in conjunction withFIG. 2 . Further, data presentation is performed such that the data associated with results of chaos-based classification model and the AF burden is presented in a physician friendly manner. A Lorenz plot well known in the art can be used to display the findings such as report arrhythmia via the I/O interface 106 to a collocated or remotely located physician in a manner that physicians understand. The ECG recording analysis is detailed in steps ofFIG. 2 . It is to be noted, however, that the ECG analysis is lightweight and in health monitoring environments where a remote physician is not involved, the warning signal derived from findings can be provided to the patient/subject with an indication to visit their cardiologist. This is typically useful when the system100 is implemented in the form of a smart wearable. However, for more clinical use-cases like implantable loop recorders, thesystem 100 can send the data to a cloud server, with minimal local processing to determine irregularity, for further analysis of Atrial Fibrillation (AF) and determination of the AF burden. In one embodiment, as thissystem 100 uses window-based time-series analysis methods, it is capable of providing AF burden values, which is considered an important factor. As detailed in studies and discussed in literature, AF burden is important factor to decide the treatment, and for AF ablation therapy. -
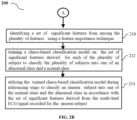
FIGS. 2A and2B (collectively referred asFIG. 2 ) is a flow diagram illustrating amethod 200 for determining cardiac abnormalities using the chaos-based classification model from multi-lead ECG signals, using the system ofFIG. 1A , in accordance with some embodiments of the present disclosure. In an embodiment, thesystem 100 comprises one or more data storage devices or thememory 102 operatively coupled to the processor(s) 104 and is configured to store instructions for execution of steps of themethod 200 by the processor(s) or one ormore hardware processors 104. The steps of themethod 200 of the present disclosure will now be explained with reference to the components or blocks of thesystem 100 as depicted inFIG. 1A and1B and the steps of flow diagram as depicted inFIG. 2 . Although process steps, method steps, techniques or the like may be described in a sequential order, such processes, methods, and techniques may be configured to work in alternate orders. In other words, any sequence or order of steps that may be described does not necessarily indicate a requirement that the steps to be performed in that order. The steps of processes described herein may be performed in any order practical. Further, some steps may be performed simultaneously. - Referring to the steps of the
method 200, atstep 202 of themethod 200, the one ormore hardware processors 104 segment time series data associated with the multi-lead electrocardiogram (ECG) signals captured for each of a plurality of subjects, into a plurality of overlapping windows. For example, either of Atrial Fibrillation, Ventricular Fibrillation and Sinus Arrhythmia is selected as the abnormal class (Class 1) and Sinus Rhythm as the normal class (Class 2). From each class (normal and abnormal) ECG recording, also referred to as or ECG data, of 125 patients, is taken. Each ECG data (ECG recording) is a time series where the sampling rate is 500Hz. The segmenting is performed at time series window of 3 seconds (sec) (1500 observations) with 50% overlap. Unlike using a 10-sec window, as in most state-of-the-art approaches, the method utilizes a 3-sec window. For a case where the heart rate is low, at least 2-3 beats will be present in a 3-sec window. The error in identifying ectopic beat is less in a short period, which increases the accuracy in computing AF Burden. Additionally, analyzing the time series data over such a short period provides better information extraction for deriving more accurate insights as the number of windows is higher and increases the training instances. The information extraction from such a small window size is enabled due to the unique combination of the plurality of features used bymethod 200, as described instep 208 below. - At
step 204 of themethod 200, the one ormore hardware processors 104 decomposes, using a Box-Cox transformation decomposition model, the time series data associated with each of the plurality of overlapping windows to generate raw (RAW) data comprising windowed decomposed time series. - At
step 206 of themethod 200, the one ormore hardware processors 104 apply de-trending and de-seasonalizing on the windowed decomposed time series data to generate Trend and Seasonally Adjusted (TSA) data. - At
step 208 of themethod 200, the one ormore hardware processors 104 derive the plurality of features, via the feature extraction module (FIG. 1B ) executed by the one ormore hardware processor 104, from at least one of the RAW data and the TSA data. In time series analysis, decomposing the data is necessary so that the data is fit for statistical measuring. Therefore, to obtain a precise and comprehensive calibration, some measures are calculated on both the raw time series data (referring as 'RAW' data), as well as the remaining time series after de-trending and de-seasonalizing (referring as "Trend and Seasonally Adjusted (TSA)" data). However, not all features can be computed on the TSA data because, after de-seasonalizing there is no such concept as periodicity. Thus, some features are both for RAW and TSA data, some features are for only RAW data and some only for TSA data. - The plurality of features comprise:
- 1) Chaos feature for the RAW data providing a uni-dimensional measure of cardiac abnormalities present in each windowed decomposed time series;
- 2) A set of chaos-related statistical features comprising, i) a non-linearity feature and a Chebyshev distance feature for the RAW data and the TSA data, and ii) a spectral flatness feature and a self-similarity feature for the RAW data, to add multiple dimensions to the chaos feature for generating a holistic view of the cardiac abnormalities.
- 3) A set of statistical features comprising, i) a serial correlation feature, a skewness feature and a kurtosis feature for the RAW data and the TSA data, ii) a trend feature and a seasonality feature for the TSA data, and iii) a periodicity feature for the RAW data, providing statistical distribution of the cardiac abnormalities.
- In totality, there are 16 features as depicted in Table 1 below. Trend and seasonality only for TSA data, serial correlation, non-linearity, skewness, kurtosis, and Chebyshev distance for both data, self-similarity, chaos, periodicity, and spectral flatness only for RAW data.
Table 1 Features RAW Data TSA Data Trend ✔ Seasonality ✔ Serial Correlation ✔ ✔ Non-Linearity ✔ ✔ Skewness ✔ ✔ Kurtosis ✔ ✔ Chebyshev distance ✔ ✔ Self-similarity ✔ Chaos ✔ Periodicity ✔ Spectral flatness ✔ - A trend pattern exists when there is a long-term change in the mean level, and seasonality of a time series is defined as a pattern that repeats itself over fixed intervals of time. Trend can be found using spline regression, and seasonality can be found using large partial autocorrelation at the seasonal lags. Periodicity determines the cyclic length of the time-series. Autocorrelation, skewness, and kurtosis are common features of time series that can be found using Box-Pierce statistics and method of moments, respectively.
- Non-linearity, which determines structure of a time series, can be found using Teraesvirta Test. Self-similarity is basically the long-range dependence structure in a time series that can be found using Hurst exponent. Chaos is characterized by sensitive dependence on initial values. Recognizing and quantifying chaos in time series represent helps to understand the nature of random behavior and reveal the extent to which short-term forecasts may be improved. Chaos is found using Lyupanov Exponent. Chebyshev distance measures distance between two points as the maximum difference over any of their axis values. So, if there is P-P, R-R, T-T distances, of the ECG signal, Chebyshev distance will be the max, which means it captures if there is any of the above regularly missing, which is definitely a sign of abnormality. The spectral flatness is calculated by dividing the geometric mean of the power spectrum by the arithmetic mean of the power spectrum.
- Among these features, chaos has been used before as an information theory parameter to identify heart-beat irregularities. However, only chaos cannot fully comprehend the extent of irregularities since it is a uni-dimensional measure. Hence other new features which have not been used so far to identify cardiac irregularities are appended by the
method 200. The features, non-linearity, Chebyshev distance, spectral flatness, and self-similarity, are related with the properties of chaos and irregularity in a complex manner, and it is observed that only when they are taken together the holistic view towards ECG abnormalities is obtained. - In addition, some well-known time-series measures like autocorrelation, trend etc., are taken because they can give a detailed view of the statistical distribution.
- Referring back to the steps of
method 200, upon extracting the plurality of features, atstep 210 of themethod 200, the one ormore hardware processors 104 identify a set of significant features from among the plurality of features using a feature importance technique. Themethod 200 in one example uses a 5-fold cross validation and run a random forest and a Gaussian SVM. Results are averaged over 5-folds. The Table 2 below shows average accuracy, sensitivity, specificity, and F1-score along with their standard deviations in parentheses. Here sensitivity is regarding the detection of abnormal cases and specificity is regarding the detection of normal cases. It was observed that random forest gives better result.Table 2 Accuracy Sensitivity Specificity F1 Score SVM 0.62(0.11) 0.53(0.07) 0.73(0.11) 0.58(0.09) RF 0.73(0.06) 0.79(0.03) 0.71 0.05) 0.75(0.06) - Feature importance: Based on the random forest result, the feature importance analysis is performed using any feature importance model. Few example techniques are mentioned below:
- 1. MRMR (Maximum Relevance Minimum Redundancy): It ranks the most correlated feature with the target and the least correlated between themselves (feature set).
- 2. Information Gain: It calculates the reduction in entropy from the transformation of a dataset. It evaluates the information gain of each feature in context of the target variable.
- In one example, it is observed that autocorrelation on the RAW data and periodicity are two most important features, while spectral flatness and kurtosis on the RAW data are the two least important features. However, with more experiments and new models being added, relative importance changes.
- At
step 212 of themethod 200, the one ormore hardware processors 104 train the chaos-based classification model on the set of significant features derived for each of the plurality of subject to classify the plurality of subjects into one of an abnormal class and a normal class. The classification of time series is based on their structural characteristics. Unlike other alternatives, themethod 200 does not classify point values using a distance metric, rather it classifies based on global features extracted from the time series. The feature measures are obtained from each individual series and can be fed into arbitrary classification algorithms, including Support Vector Machine (SVM), random forest, naive Bayes, or neural network. Global measures describing the time series are obtained by applying statistical operations that best capture the underlying characteristics: trend, seasonality, periodicity, serial correlation, skewness, kurtosis, chaos, non-linearity, and self-similarity. Since the method 200uses extracted global measures, it reduces the dimensionality of the time series and is much less sensitive to missing or noisy data. - At
step 214 of themethod 200, the one ormore hardware processors 104 utilize the trained chaos-based classification model during inferencing stage to classify an unseen subject into one of the normal class and the abnormal class. The set of significant features is derived from the multi-lead ECG signal recorded for the unseen subject for a predefined duration of an ECG recording, wherein the recorded ECG signal is segmented into the plurality of overlapping windows. - In one embodiment, wherein the chaos model is built and trained for AF detection, the abnormal class indicates the unseen subject suffering from Atrial Fibrillation (AF), and the normal class indicates the unseen subject to be healthy with Sinus Rhythm. Further, as depicted in
FIG. 1B , thesystem 100 via the AFB computation module computes percentage of time spent in AF state by the subject within an observation period. For example, a patient is monitored for 24 hours, and time spent in AF is 2 hours, then percentage AF Burden is 8.33 (2/24*100). Obtaining accurate time spent in AF is dependent on accurate Normal/Abnormal classification. AF burden is usually computed over 14 days, however, for experiment herein, thesystem 100 calculates it over the time available due to the limitation of dataset length. For each subject, we calculate AFB % with respect to the total time monitored using below equation: - Computation of the AF burden (AFB%) for the unseen subject is as below:


- Significance of features in detecting the cardiac abnormalities and Extraction of features: A uni-variate time series is the simplest form of temporal data and is a sequence of real numbers collected regularly in time, where each number represents a value. The time series herein is represented as an ordered set of n real-valued variables. Time series can be described using a variety of qualitative terms such as seasonal, trending, noisy, non-linear, chaos, etc. There are nine classical and advanced statistical features describing a time series' global characteristics. They are trend, seasonality, periodicity, serial correlation, skewness, kurtosis, non-linearity, self-similarity, and chaos. This collection of measures is quantified descriptors and can help provide a rich portrait of the nature of a time series. The features of trend, seasonality, periodic, serial correlation, skewness, and kurtosis have been widely used as exemplary measures in many time series feature-based research. Some advanced features are derived from the research on relatively new phenomena, which include non-linearity structure, self-similarity, and chaos. As a result, unique set of time series characteristics features are extracted by the
method 200 as measures. The feature extraction process can also be considered as a dimensionality reduction procedure in time series data mining. Extracting the summarized characteristics of the time series can provide a more meaningful dimensionality reduction compared to other existing methods. By applying a statistical treatment to the analysis of time series data, datasets with long-length or different-length time series are pre-processed to produce a limited number of measures and are less sensitive to noise. These features concisely represent the relevant characteristics of each time series as a finite set of inputs to a clustering algorithm that can then discern similarities and differences between the time series. The outcome of feature extraction is a set of measures that can be fed into any clustering techniques of choice. - In time series analysis, decomposition is a critical step to transform the series into a format for statistical measuring. Therefore, to obtain a precise and comprehensive calibration, some measures are calculated on both the raw time series data (referring as `RAW' data), as well as the remaining time series after de-trending and de-seasonalizing (referring as "Trend and Seasonally Adjusted (TSA)" data). But some features can only be calculated on raw data to obtain meaningful measures, such as periodicity, etc. As exhibited in the table 1, a total of thirteen measures are extracted from each time series including seven on the RAW data and six on the TSA data. These measures later become inputs to the chaos-based classification model. The thirteen measures are a finite set used to quantify the global characteristics of any time series, regardless of its length and missing values. For each of the features described below, a most appropriate way to measure the presence of the feature is used, and ultimately normalize the metric to [0, 1] to indicate the degree of presence of the feature. A measure near 0 for a certain time series indicates an absence of the feature, while a measure near 1 indicates a strong presence of the feature. The calculation of the measures and scaling transformations has been coded using the R language.
- Spectral flatness: The spectral flatness or tonality coefficient is also known as `Wiener Entropy' and is used to characterize the purity of an audio spectrum with respect to its tone. A high spectral flatness indicates a more white-noise signal. As well known in the art, spectral flatness is calculated by dividing the geometric mean of the power spectrum by the arithmetic mean of the power spectrum. Since spectral flatness gives the tonality of a signal, it should map to sinus rhythm of the ECG signal. In other words, high spectral flatness in ECG would indicate a wider distribution of the ECG spectrum at a given time. Therefore, arrhythmia should correlate well with the feature.
- Chebyshev distance: Chebyshev distance is a metric defined on a vector space where the distance between two vectors is the greatest of their differences along any coordinate dimension. Thus, Chebyshev distance provides the maximum separation between two vectors. If an attempt is made to find the corresponding Chebyshev distance between two cardiac cycles, it will be along the dimension where the spectrum is maximum. If the distance is high, it means there is some anomaly in beat-to-beat dynamics indicating chaos, which can be a good indicator of arrhythmia.
- Chaos: Many systems in nature that were previously considered random processes are now categorized as chaotic systems. Nonlinear dynamical systems often exhibit chaos, which is characterized by sensitive dependence on initial values, or more precisely by a positive Lyapunov Exponent (LE). Recognizing and quantifying chaos in time series represents important steps toward understanding the nature of random behavior and revealing the extent to which short-term forecasts may be improved. LE as a measure of the divergence of nearby trajectories has been used to qualifying chaos by giving a quantitative value. For a one-dimensional discrete time, series, an existing method demonstrated by Hilborn (1994) is used to calculate LE of a one-dimensional time series (RAW data).
- Non-linearity: Nonlinear time series models have been used extensively in recent years to model complex dynamics not adequately represented use linear models. Because of the special characteristic (behavior) of time series data, the traditional linear models cannot handle the forecasting well compared to non-linear models. Therefore, non-linearity is an important characteristic of time series data to determine the selection of appropriate forecasting method. Herein, Teraesvirta's neural network test for time series data¨ non-linearity characteristics identification and extraction. It is a test for neglected nonlinearity likely to have power against a range of alternatives based on neural network model (augmented single-hidden-layer feed forward neural network model). The test is based on a test function chosen as the activation of 'phantom' hidden units. This measure is taken because non-linearity essentially means the underlying state space models need to be reconstructed time and again and possibly after certain periodic cycles. That means the heartbeat may show irregularity since they do not come from a unified state space model, which can be an indicator of arrhythmia.
- Self-similarity: Processes with long-range dependence have attracted a good deal of attention from probabilistic and theoretical physicists. The subject of self-similarity and the estimation of statistical parameters of time series in the presence of long-range dependence are becoming more common in several fields of science, to which the time series analysis and forecasting on a recent research topic of network traffic, has drawn a particular attention. With such increasing importance of the 'self-similarity (long-range dependence)' as one of time series characteristics, this feature is included, although it is not widely used or is neglected in time series feature identification. The definition of self-similarity most related to the properties of time series is the self-similarity parameter Hurst exponent (H). The Self-similarity feature is only detected from the RAW data. This measure is taken because the less self-similar an ECG signal is, the less it is invariant in smaller parts. That means, the ECG signal may behave in microlevel quite differently than in macro level, e.g., a signal observed over few seconds vs a signal observed over 5 minutes. This leads to the logical conclusion that something happens in the signal that causes to deflect in long range from its usual cyclic pattern. This can be an indicator of heart bit irregularities and thus, arrhythmia.
- Trend and seasonality: Trend and seasonality are common features of time series, and it is natural to characterize a time series by its degree of trend and seasonality. In addition, once the trend and seasonality of a time series have been measured, de-trend and de-seasonalize the time series can be done to enable additional features such as noise or chaos to be more easily detectable. A trend pattern exists when there is a long-term change in the mean level. To estimate the trend, a smooth nonparametric method, such as the penalized regression spline can be used. A seasonal pattern exists when a time series is influenced by seasonal factors, such as month of the year or day of the week. The seasonality of a time series is defined as a pattern that repeats itself over fixed intervals of time. In general, the seasonality can be found by identifying a large autocorrelation coefficient or a large partial autocorrelation coefficient at the seasonal lag. In an example implementation herein, the basic decomposition model using Box-Cox transformation is used.
- Periodicity: Since the periodicity is very important for determining the seasonality and examining the cyclic pattern of the time series, the periodicity feature extraction becomes a necessity. Unfortunately, many time series available from the dataset in different domains do not always come with known frequency or regular periodicity. The
method 200 discloses a new approach to measure the periodicity in univariate time series. The periodicity detection is only applied for RAW data. The time series is detrended using a regression spline with 3 knots and autocorrelations for all lags up to 1/3 of series length is determined. Thereafter peaks and troughs are identified in autocorrelation function. Frequency is the first peak provided with the following conditions: - There is also a trough before it;
- The difference between peak and trough is at least 0.1; * the peak corresponds to positive correlation; and
- If no such peak is found, frequency is set to 1 (equivalent to non-seasonal).
- Serial Correlation: A measure is extracted, which shows the degree of serial correlation of the dataset, to detect the series if it can fit a white noise model. The larger the degree is, noisier the series is. Normally in the white noise series, there are no recurring cycles (periodicity) in the data because each observation is completely independent of all other observations. A Box-Pierce statistics in used to estimate the serial correlation measure, and to extract the measures from both RAW and TSA data.
- Skewness and kurtosis: Derivation is obvious, using well known method of moments. Using the above-mentioned set of features for estimating abnormality in cardiac rhythm has a strong pathophysiological basis. As we know the "sinus rhythm" present in ECG is a quasi-stationary signal, with the "quasi" factor contributing to heart-rate variability (HRV). However, there is a method in the madness and the HRV parameters have clinically sound limits within which they operate. Hence, using chaos as a measure of cardiac abnormality is actually checking the degree of entropy or disorderliness in the time-series. This may be due to some abnormality of the electrophysiology of the heart. For example, in Atrial Fibrillation (AF), the R-R peak intervals become chaotic, and the P-waves also are randomly missing, with intermittent F-waves (flutter) being present. This indicates a strong presence of chaos or randomness in the ECG signal, which is exploited by the
method 200 for analysis. Hence, such analysis can be easily made explainable clinically. - The method and system disclosed herein provide a framework which uses chaos-based time series model on a multi-lead ECG signal to determine spatial distribution (across subjects) of anomaly-related parameters in the ECG signal, and also depicts how such chaos-related components have a pathophysiological basis based on the underlying condition. The unique combination of 16 features used herein enables classifying ECG into various conditions and provides a robust and explainable approach to classify arrhythmia on the basis of ECG signals.
- In future, such chaos-based features can be used to classify rare cardiac conditions accurately for which ample data is not available. This should be possible because the underlying method is not heavily empirical but uses very principled features based on knowledge of cardiac disorders.
- The written description describes the subject matter herein to enable any person skilled in the art to make and use the embodiments. The scope of the subject matter embodiments is defined by the claims and may include other modifications that occur to those skilled in the art. Such other modifications are intended to be within the scope of the claims if they have similar elements that do not differ from the literal language of the claims or if they include equivalent elements with insubstantial differences from the literal language of the claims.
- It is to be understood that the scope of the protection is extended to such a program and in addition to a computer-readable means having a message therein; such computer-readable storage means contain program-code means for implementation of one or more steps of the method, when the program runs on a server or mobile device or any suitable programmable device. The hardware device can be any kind of device which can be programmed including e.g., any kind of computer like a server or a personal computer, or the like, or any combination thereof. The device may also include means which could be e.g., hardware means like e.g., an application-specific integrated circuit (ASIC), a field-programmable gate array (FPGA), or a combination of hardware and software means, e.g., an ASIC and an FPGA, or at least one microprocessor and at least one memory with software processing components located therein. Thus, the means can include both hardware means, and software means. The method embodiments described herein could be implemented in hardware and software. The device may also include software means. Alternatively, the embodiments may be implemented on different hardware devices, e.g., using a plurality of CPUs.
- The embodiments herein can comprise hardware and software elements. The embodiments that are implemented in software include but are not limited to, firmware, resident software, microcode, etc. The functions performed by various components described herein may be implemented in other components or combinations of other components. For the purposes of this description, a computer-usable or computer readable medium can be any apparatus that can comprise, store, communicate, propagate, or transport the program for use by or in connection with the instruction execution system, apparatus, or device.
- The illustrated steps are set out to explain the exemplary embodiments shown, and it should be anticipated that ongoing technological development will change the manner in which particular functions are performed. These examples are presented herein for purposes of illustration, and not limitation. Further, the boundaries of the functional building blocks have been arbitrarily defined herein for the convenience of the description. Alternative boundaries can be defined so long as the specified functions and relationships thereof are appropriately performed. Alternatives (including equivalents, extensions, variations, deviations, etc., of those described herein) will be apparent to persons skilled in the relevant art(s) based on the teachings contained herein. Such alternatives fall within the scope of the disclosed embodiments. Also, the words "comprising," "having," "containing," and "including," and other similar forms are intended to be equivalent in meaning and be open ended in that an item or items following any one of these words is not meant to be an exhaustive listing of such item or items or meant to be limited to only the listed item or items. It must also be noted that as used herein and in the appended claims, the singular forms "a," "an," and "the" include plural references unless the context clearly dictates otherwise.
- Furthermore, one or more computer-readable storage media may be utilized in implementing embodiments consistent with the present disclosure. A computer-readable storage medium refers to any type of physical memory on which information or data readable by a processor may be stored. Thus, a computer-readable storage medium may store instructions for execution by one or more processors, including instructions for causing the processor(s) to perform steps or stages consistent with the embodiments described herein. The term "computer-readable medium" should be understood to include tangible items and exclude carrier waves and transient signals, i.e., be non-transitory. Examples include random access memory (RAM), read-only memory (ROM), volatile memory, nonvolatile memory, hard drives, CD ROMs, DVDs, flash drives, disks, and any other known physical storage media.
- It is intended that the disclosure and examples be considered as exemplary only, with a true scope of disclosed embodiments being indicated by the following claims.
Claims (15)
- A processor implemented method (200) for determining cardiac abnormalities, the method comprising:segmenting (202) via one or more hardware processors, time series data associated with multi-lead electrocardiogram (ECG) signals captured for each of a plurality of subjects, into a plurality of overlapping windows;decomposing (204) via the one or more hardware processors, the time series data associated with each of the plurality of overlapping windows to generate raw (RAW) data comprising windowed decomposed time series;applying (206) via the one or more hardware processors, de-trending and de-seasonalizing on the windowed decomposed time series data to generate Trend and Seasonally Adjusted (TSA) data;deriving (208) via the one or more hardware processors, a plurality of features from at least one of the RAW data and the TSA data, wherein the plurality of features comprising:a chaos feature for the RAW data providing a uni-dimensional measure of the cardiac abnormalities present in each windowed decomposed time series;a set of chaos-related statistical features comprising, i) a non-linearity feature and a Chebyshev distance feature for the RAW data and the TSA data, and ii) a spectral flatness feature and a self-similarity feature for the RAW data, to add multiple dimensions to the chaos feature for generating a holistic view of the cardiac abnormalities; anda set of statistical features comprising, i) a serial correlation feature, a skewness feature and a kurtosis feature for the RAW data and the TSA data, ii) a trend feature and a seasonality feature for the TSA data, and iii) a periodicity feature for the RAW data, providing statistical distribution of the cardiac abnormalities;identifying (210) via the one or more hardware processors, a set of significant features from among the plurality of features using a feature importance technique; andtraining (212) via the one or more hardware processors, a chaos-based classification model on the set of significant features derived for each of the plurality of subject to classify the plurality of subjects into one of an abnormal class and a normal class.
- The processor implemented method as claimed in claim 1 comprising utilizing the trained chaos-based classification model during an inferencing stage to classify an unseen subject into one of the normal class and the abnormal class in accordance with the set of significant features derived from the multi-lead ECG signal recorded for the unseen subject for a predefined duration of an ECG recording by segmenting the ECG recording into the plurality of overlapping windows, wherein the abnormal class indicates the unseen subject suffering from Atrial Fibrillation (AF), and the normal class indicates the unseen subject to be healthy with Sinus Rhythm.
- The processor implemented method as claimed in claim 2 comprising computing percentage AF burden (AFB%) for the unseen subject, wherein


- The processor implemented method as claimed in claim 1, wherein each of the plurality of overlapping windows has a window period of 3 sec.
- The processor implemented method as claimed in claim 1, wherein the chaos-based classification model is trained on the set of significant features derived for each of the plurality of subject to classify the plurality of subjects into one of the abnormal class indicating Ventricular Fibrillation (VF) and the normal class indicating Sinus Rhythm.
- The processor implemented method as claimed in claim 1, wherein the chaos-based classification model is trained on the set of significant features derived for each of the plurality of subject to classify the plurality of subjects into one of the abnormal class indicating Sinus Arrhythmia and the normal class indicating Sinus Rhythm.
- A system (100) for determining cardiac abnormalities, the system (100) comprising:a memory (102) storing instructions;one or more Input/Output (I/O) interfaces (106); andone or more hardware processors (104) coupled to the memory (102) via the one or more I/O interfaces (106), wherein the one or more hardware processors (104) are configured by the instructions to:segment time series data associated with multi-lead electrocardiogram (ECG) signals captured for each of a plurality of subjects, into a plurality of overlapping windows;decompose the time series data associated with each of the plurality of overlapping windows to generate raw (RAW) data comprising windowed decomposed time series;apply de-trending and de-seasonalizing on the windowed decomposed time series data to generate Trend and Seasonally Adjusted (TSA) data;derive a plurality of features from at least one of the RAW data and the TSA data, wherein the plurality of features comprising:a chaos feature for the RAW data providing a uni-dimensional measure of cardiac abnormalities present in each windowed decomposed time series;a set of chaos-related statistical features comprising, i) a non-linearity feature and a Chebyshev distance feature for the RAW data and the TSA data, and ii) a spectral flatness feature and a self-similarity feature for the RAW data, to add multiple dimensions to the chaos feature for generating a holistic view of the cardiac abnormalities; anda set of statistical features comprising, i) a serial correlation feature, a skewness feature and a kurtosis feature for the RAW data and the TSA data, ii) a trend feature and a seasonality feature for the TSA data, and iii) a periodicity feature for the RAW data, providing statistical distribution of the cardiac abnormalities;identify a set of significant features from among the plurality of features using a feature importance technique; andtrain a chaos-based classification model on the set of significant features derived for each of the plurality of subject to classify the plurality of subjects into one of an abnormal class and a normal class.
- The system as claimed in claim 7, wherein the one or more hardware processors are configured to utilize the trained chaos-based classification model during inferencing stage to classify an unseen subject into one of the normal class and the abnormal class in accordance with the set of significant features derived from the multi-lead ECG signal recorded for the unseen subject for a predefined duration of an ECG recording by segmenting the ECG recording into the plurality of overlapping windows, wherein the abnormal class indicates the unseen subject suffering from Atrial Fibrillation (AF), and the normal class indicates the unseen subject to be healthy with Sinus Rhythm.
- The system as claimed in claim 8, wherein the one or more hardware processors are configured to computing percentage AF burden (AFB%) for the unseen subject, wherein


- The system as claimed in claim 7, wherein each of the plurality of overlapping windows has a window period of 3 sec.
- The system as claimed in claim 7, wherein the chaos-based classification model is trained on the set of significant features derived for each of the plurality of subject to classify the plurality of subjects into one of the abnormal class indicating Ventricular Fibrillation (VF) and the normal class indicating Sinus Rhythm.
- The system as claimed in claim 7, wherein the chaos-based classification model is trained on the set of significant features derived for each of the plurality of subject to classify the plurality of subjects into one of the abnormal class indicating Sinus Arrhythmia and the normal class indicating Sinus Rhythm.
- One or more non-transitory machine-readable information storage mediums comprising one or more instructions which when executed by one or more hardware processors cause:segmenting time series data associated with multi-lead electrocardiogram (ECG) signals captured for each of a plurality of subjects, into a plurality of overlapping windows;decomposing the time series data associated with each of the plurality of overlapping windows to generate raw (RAW) data comprising windowed decomposed time series;applying de-trending and de-seasonalizing on the windowed decomposed time series data to generate Trend and Seasonally Adjusted (TSA) data;deriving a plurality of features from at least one of the RAW data and the TSA data, wherein the plurality of features comprising:a chaos feature for the RAW data providing a uni-dimensional measure of the cardiac abnormalities present in each windowed decomposed time series;a set of chaos-related statistical features comprising, i) a non-linearity feature and a Chebyshev distance feature for the RAW data and the TSA data, and ii) a spectral flatness feature and a self-similarity feature for the RAW data, to add multiple dimensions to the chaos feature for generating a holistic view of the cardiac abnormalities; anda set of statistical features comprising, i) a serial correlation feature, a skewness feature and a kurtosis feature for the RAW data and the TSA data, ii) a trend feature and a seasonality feature for the TSA data, and iii) a periodicity feature for the RAW data, providing statistical distribution of the cardiac abnormalities;identifying a set of significant features from among the plurality of features using a feature importance technique; andtraining a chaos-based classification model on the set of significant features derived for each of the plurality of subject to classify the plurality of subjects into one of an abnormal class and a normal class.
- The one or more non-transitory machine-readable information storage mediums of claim 13 comprising utilizing the trained chaos-based classification model during an inferencing stage to classify an unseen subject into one of the normal class and the abnormal class in accordance with the set of significant features derived from the multi-lead ECG signal recorded for the unseen subject for a predefined duration of an ECG recording by segmenting the ECG recording into the plurality of overlapping windows, wherein the abnormal class indicates the unseen subject suffering from Atrial Fibrillation (AF), and the normal class indicates the unseen subject to be healthy with Sinus Rhythm.
- The one or more non-transitory machine-readable information storage mediums of claim 14 comprising computing percentage AF burden (AFB%) for the unseen subject, wherein



Applications Claiming Priority (1)
| Application Number | Priority Date | Filing Date | Title |
|---|---|---|---|
| IN202321019383 | 2023-03-21 |
Publications (3)
| Publication Number | Publication Date |
|---|---|
| EP4434462A1 true EP4434462A1 (en) | 2024-09-25 |
| EP4434462B1 EP4434462B1 (en) | 2025-07-09 |
| EP4434462C0 EP4434462C0 (en) | 2025-07-09 |
Family
ID=89223851
Family Applications (1)
| Application Number | Title | Priority Date | Filing Date |
|---|---|---|---|
| EP23217587.7A Active EP4434462B1 (en) | 2023-03-21 | 2023-12-18 | Method and system for determining cardiac abnormalities using chaos-based classification model from multi-lead ecg |
Country Status (2)
| Country | Link |
|---|---|
| US (1) | US20240321450A1 (en) |
| EP (1) | EP4434462B1 (en) |
Cited By (1)
| Publication number | Priority date | Publication date | Assignee | Title |
|---|---|---|---|---|
| RU2849934C1 (en) * | 2025-03-31 | 2025-10-31 | Закрытое Акционерное Общество "Ес-Лизинг" | Method for assessing and correcting the functional state of a person (variations) and system for implementing this method |
Families Citing this family (1)
| Publication number | Priority date | Publication date | Assignee | Title |
|---|---|---|---|---|
| CN121456433A (en) * | 2026-01-07 | 2026-02-03 | 杭州电子科技大学 | Atrial fibrillation prediction method and system based on free lead channel |
Citations (1)
| Publication number | Priority date | Publication date | Assignee | Title |
|---|---|---|---|---|
| WO2023019022A1 (en) * | 2021-08-13 | 2023-02-16 | Mayo Foundation For Medical Education And Research | Machine-learning for processing lead-invariant electrocardiogram inputs |
Family Cites Families (1)
| Publication number | Priority date | Publication date | Assignee | Title |
|---|---|---|---|---|
| US7412282B2 (en) * | 2005-01-26 | 2008-08-12 | Medtronic, Inc. | Algorithms for detecting cardiac arrhythmia and methods and apparatuses utilizing the algorithms |
-
2023
- 2023-12-18 EP EP23217587.7A patent/EP4434462B1/en active Active
- 2023-12-21 US US18/393,358 patent/US20240321450A1/en active Pending
Patent Citations (1)
| Publication number | Priority date | Publication date | Assignee | Title |
|---|---|---|---|---|
| WO2023019022A1 (en) * | 2021-08-13 | 2023-02-16 | Mayo Foundation For Medical Education And Research | Machine-learning for processing lead-invariant electrocardiogram inputs |
Non-Patent Citations (3)
| Title |
|---|
| ELTRASS AHMED S ET AL: "Automated ECG multi-class classification system based on combining deep learning features with HRV and ECG measures", NEURAL COMPUTING AND APPLICATIONS, SPRINGER LONDON, LONDON, vol. 34, no. 11, 29 January 2022 (2022-01-29), pages 8755 - 8775, XP037828328, ISSN: 0941-0643, [retrieved on 20220129], DOI: 10.1007/S00521-022-06889-Z * |
| IGNACIO PAUL SAMUEL ET AL: "Classification of Single-Lead Electrocardiograms: TDA Informed Machine Learning", 2019 18TH IEEE INTERNATIONAL CONFERENCE ON MACHINE LEARNING AND APPLICATIONS (ICMLA), IEEE, 16 December 2019 (2019-12-16), pages 1241 - 1246, XP033719681, DOI: 10.1109/ICMLA.2019.00204 * |
| XIAOZHE WANG ET AL: "Characteristic-Based Clustering for Time Series Data", DATA MINING AND KNOWLEDGE DISCOVERY, KLUWER ACADEMIC PUBLISHERS, BO, vol. 13, no. 3, 16 May 2006 (2006-05-16), pages 335 - 364, XP019434079, ISSN: 1573-756X, DOI: 10.1007/S10618-005-0039-X * |
Cited By (1)
| Publication number | Priority date | Publication date | Assignee | Title |
|---|---|---|---|---|
| RU2849934C1 (en) * | 2025-03-31 | 2025-10-31 | Закрытое Акционерное Общество "Ес-Лизинг" | Method for assessing and correcting the functional state of a person (variations) and system for implementing this method |
Also Published As
| Publication number | Publication date |
|---|---|
| US20240321450A1 (en) | 2024-09-26 |
| EP4434462B1 (en) | 2025-07-09 |
| EP4434462C0 (en) | 2025-07-09 |
Similar Documents
| Publication | Publication Date | Title |
|---|---|---|
| US10265029B2 (en) | Methods and systems for calculating and using statistical models to predict medical events | |
| CN113613559A (en) | Electrocardiogram processing system for delineation and classification | |
| Raj et al. | A personalized point-of-care platform for real-time ECG monitoring | |
| CN116194044B (en) | Method and system for analyzing heart rhythm | |
| US11179088B2 (en) | Electrocardiogram analysis | |
| US11653871B2 (en) | Atrial fibrillation prediction using heart rate variability | |
| Leite et al. | Heartbeat classification with low computational cost using Hjorth parameters | |
| Moses et al. | A survey of data mining algorithms used in cardiovascular disease diagnosis from multi-lead ECG data | |
| Malik et al. | An adaptive QRS detection algorithm for ultra-long-term ECG recordings | |
| CN119442124B (en) | A method, apparatus, device, and storage medium for identifying abnormal electrocardiogram (ECG) data based on deep learning. | |
| Cai et al. | Rule-based rough-refined two-step-procedure for real-time premature beat detection in single-lead ECG | |
| Husain | Effecient ECG signal classification using sparsely connected radial basis function neural network | |
| EP4434462B1 (en) | Method and system for determining cardiac abnormalities using chaos-based classification model from multi-lead ecg | |
| Ngo et al. | Design of a real-time morphology-based anomaly detection method from ecg streams | |
| US20250295365A1 (en) | Method, server, and computer program for generating heart diseases prediction model | |
| Mohebbi et al. | Structures of the recurrence plot of heart rate variability signal as a tool for predicting the onset of paroxysmal atrial fibrillation | |
| Annadate et al. | Harnessing deep learning for early detection of cardiac abnormalities | |
| US20250143623A1 (en) | Method and system of detecting arrythmia | |
| Singh et al. | Extreme gradient boosting algorithm for automatic cardiac arrhythmia classification | |
| Mallick et al. | Resource-constrained device characterization for detecting sleep apnea using machine learning | |
| Srinivasulu et al. | A signal processing framework for the detection of abnormal cardiac episodes | |
| Pragash et al. | Survey on Explainable AI Based Meta-Learning to Enhance Patient-Specific ECG Anomaly Detection | |
| Yebra et al. | Machine Learning for Arrhythmia Detection: Integrating ECG Biomarkers for Improved Diagnostic Performance | |
| Rosa et al. | Multi-class detection of arrhythmia conditions through the combination of compressed sensing and machine learning | |
| Suresh et al. | Auto-detection of Atrial Fibrillation with Improved Classification and Noise Removal Algorithm along with Dimensionality Reduction Methods |
Legal Events
| Date | Code | Title | Description |
|---|---|---|---|
| PUAI | Public reference made under article 153(3) epc to a published international application that has entered the european phase |
Free format text: ORIGINAL CODE: 0009012 |
|
| STAA | Information on the status of an ep patent application or granted ep patent |
Free format text: STATUS: THE APPLICATION HAS BEEN PUBLISHED |
|
| STAA | Information on the status of an ep patent application or granted ep patent |
Free format text: STATUS: REQUEST FOR EXAMINATION WAS MADE |
|
| AK | Designated contracting states |
Kind code of ref document: A1 Designated state(s): AL AT BE BG CH CY CZ DE DK EE ES FI FR GB GR HR HU IE IS IT LI LT LU LV MC ME MK MT NL NO PL PT RO RS SE SI SK SM TR |
|
| 17P | Request for examination filed |
Effective date: 20240828 |
|
| RBV | Designated contracting states (corrected) |
Designated state(s): AL AT BE BG CH CY CZ DE DK EE ES FI FR GB GR HR HU IE IS IT LI LT LU LV MC ME MK MT NL NO PL PT RO RS SE SI SK SM TR |
|
| GRAP | Despatch of communication of intention to grant a patent |
Free format text: ORIGINAL CODE: EPIDOSNIGR1 |
|
| STAA | Information on the status of an ep patent application or granted ep patent |
Free format text: STATUS: GRANT OF PATENT IS INTENDED |
|
| RIC1 | Information provided on ipc code assigned before grant |
Ipc: G06N 3/02 20060101ALN20250327BHEP Ipc: G16H 50/70 20180101ALI20250327BHEP Ipc: G16H 50/30 20180101ALI20250327BHEP Ipc: A61B 5/00 20060101ALI20250327BHEP Ipc: A61B 5/349 20210101ALI20250327BHEP Ipc: A61B 5/318 20210101AFI20250327BHEP |
|
| INTG | Intention to grant announced |
Effective date: 20250403 |
|
| GRAS | Grant fee paid |
Free format text: ORIGINAL CODE: EPIDOSNIGR3 |
|
| GRAA | (expected) grant |
Free format text: ORIGINAL CODE: 0009210 |
|
| STAA | Information on the status of an ep patent application or granted ep patent |
Free format text: STATUS: THE PATENT HAS BEEN GRANTED |
|
| AK | Designated contracting states |
Kind code of ref document: B1 Designated state(s): AL AT BE BG CH CY CZ DE DK EE ES FI FR GB GR HR HU IE IS IT LI LT LU LV MC ME MK MT NL NO PL PT RO RS SE SI SK SM TR |
|
| REG | Reference to a national code |
Ref country code: GB Ref legal event code: FG4D |
|
| REG | Reference to a national code |
Ref country code: CH Ref legal event code: EP |
|
| REG | Reference to a national code |
Ref country code: IE Ref legal event code: FG4D |
|
| U01 | Request for unitary effect filed |
Effective date: 20250709 |
|
| U07 | Unitary effect registered |
Designated state(s): AT BE BG DE DK EE FI FR IT LT LU LV MT NL PT RO SE SI Effective date: 20250715 |
|
| PG25 | Lapsed in a contracting state [announced via postgrant information from national office to epo] |
Ref country code: IS Free format text: LAPSE BECAUSE OF FAILURE TO SUBMIT A TRANSLATION OF THE DESCRIPTION OR TO PAY THE FEE WITHIN THE PRESCRIBED TIME-LIMIT Effective date: 20251109 |
|
| PG25 | Lapsed in a contracting state [announced via postgrant information from national office to epo] |
Ref country code: NO Free format text: LAPSE BECAUSE OF FAILURE TO SUBMIT A TRANSLATION OF THE DESCRIPTION OR TO PAY THE FEE WITHIN THE PRESCRIBED TIME-LIMIT Effective date: 20251009 |
|
| PG25 | Lapsed in a contracting state [announced via postgrant information from national office to epo] |
Ref country code: HR Free format text: LAPSE BECAUSE OF FAILURE TO SUBMIT A TRANSLATION OF THE DESCRIPTION OR TO PAY THE FEE WITHIN THE PRESCRIBED TIME-LIMIT Effective date: 20250709 |
|
| PG25 | Lapsed in a contracting state [announced via postgrant information from national office to epo] |
Ref country code: GR Free format text: LAPSE BECAUSE OF FAILURE TO SUBMIT A TRANSLATION OF THE DESCRIPTION OR TO PAY THE FEE WITHIN THE PRESCRIBED TIME-LIMIT Effective date: 20251010 |
|
| PG25 | Lapsed in a contracting state [announced via postgrant information from national office to epo] |
Ref country code: PL Free format text: LAPSE BECAUSE OF FAILURE TO SUBMIT A TRANSLATION OF THE DESCRIPTION OR TO PAY THE FEE WITHIN THE PRESCRIBED TIME-LIMIT Effective date: 20250709 |
|
| PG25 | Lapsed in a contracting state [announced via postgrant information from national office to epo] |
Ref country code: RS Free format text: LAPSE BECAUSE OF FAILURE TO SUBMIT A TRANSLATION OF THE DESCRIPTION OR TO PAY THE FEE WITHIN THE PRESCRIBED TIME-LIMIT Effective date: 20251009 |
|
| U20 | Renewal fee for the european patent with unitary effect paid |
Year of fee payment: 3 Effective date: 20251225 |
|
| PG25 | Lapsed in a contracting state [announced via postgrant information from national office to epo] |
Ref country code: ES Free format text: LAPSE BECAUSE OF FAILURE TO SUBMIT A TRANSLATION OF THE DESCRIPTION OR TO PAY THE FEE WITHIN THE PRESCRIBED TIME-LIMIT Effective date: 20250709 |
|
| PG25 | Lapsed in a contracting state [announced via postgrant information from national office to epo] |
Ref country code: SM Free format text: LAPSE BECAUSE OF FAILURE TO SUBMIT A TRANSLATION OF THE DESCRIPTION OR TO PAY THE FEE WITHIN THE PRESCRIBED TIME-LIMIT Effective date: 20250709 |
|
| PG25 | Lapsed in a contracting state [announced via postgrant information from national office to epo] |
Ref country code: CZ Free format text: LAPSE BECAUSE OF FAILURE TO SUBMIT A TRANSLATION OF THE DESCRIPTION OR TO PAY THE FEE WITHIN THE PRESCRIBED TIME-LIMIT Effective date: 20250709 |
|
| PG25 | Lapsed in a contracting state [announced via postgrant information from national office to epo] |
Ref country code: SK Free format text: LAPSE BECAUSE OF FAILURE TO SUBMIT A TRANSLATION OF THE DESCRIPTION OR TO PAY THE FEE WITHIN THE PRESCRIBED TIME-LIMIT Effective date: 20250709 |
|
| PLBE | No opposition filed within time limit |
Free format text: ORIGINAL CODE: 0009261 |
|
| STAA | Information on the status of an ep patent application or granted ep patent |
Free format text: STATUS: NO OPPOSITION FILED WITHIN TIME LIMIT |