EP4432094A1 - Application flow recognition in managed serverless applications - Google Patents
Application flow recognition in managed serverless applications Download PDFInfo
- Publication number
- EP4432094A1 EP4432094A1 EP24163674.5A EP24163674A EP4432094A1 EP 4432094 A1 EP4432094 A1 EP 4432094A1 EP 24163674 A EP24163674 A EP 24163674A EP 4432094 A1 EP4432094 A1 EP 4432094A1
- Authority
- EP
- European Patent Office
- Prior art keywords
- application
- event
- graph
- nodes
- entities
- Prior art date
- Legal status (The legal status is an assumption and is not a legal conclusion. Google has not performed a legal analysis and makes no representation as to the accuracy of the status listed.)
- Granted
Links
Images


Classifications
-
- G—PHYSICS
- G06—COMPUTING OR CALCULATING; COUNTING
- G06F—ELECTRIC DIGITAL DATA PROCESSING
- G06F11/00—Error detection; Error correction; Monitoring
- G06F11/30—Monitoring
- G06F11/34—Recording or statistical evaluation of computer activity, e.g. of down time, of input/output operation ; Recording or statistical evaluation of user activity, e.g. usability assessment
- G06F11/3466—Performance evaluation by tracing or monitoring
- G06F11/3476—Data logging
-
- G—PHYSICS
- G06—COMPUTING OR CALCULATING; COUNTING
- G06F—ELECTRIC DIGITAL DATA PROCESSING
- G06F21/00—Security arrangements for protecting computers, components thereof, programs or data against unauthorised activity
- G06F21/50—Monitoring users, programs or devices to maintain the integrity of platforms, e.g. of processors, firmware or operating systems
- G06F21/52—Monitoring users, programs or devices to maintain the integrity of platforms, e.g. of processors, firmware or operating systems during program execution, e.g. stack integrity ; Preventing unwanted data erasure; Buffer overflow
-
- G—PHYSICS
- G06—COMPUTING OR CALCULATING; COUNTING
- G06F—ELECTRIC DIGITAL DATA PROCESSING
- G06F11/00—Error detection; Error correction; Monitoring
- G06F11/30—Monitoring
- G06F11/3003—Monitoring arrangements specially adapted to the computing system or computing system component being monitored
- G06F11/3006—Monitoring arrangements specially adapted to the computing system or computing system component being monitored where the computing system is distributed, e.g. networked systems, clusters, multiprocessor systems
-
- G—PHYSICS
- G06—COMPUTING OR CALCULATING; COUNTING
- G06F—ELECTRIC DIGITAL DATA PROCESSING
- G06F11/00—Error detection; Error correction; Monitoring
- G06F11/30—Monitoring
- G06F11/3003—Monitoring arrangements specially adapted to the computing system or computing system component being monitored
- G06F11/302—Monitoring arrangements specially adapted to the computing system or computing system component being monitored where the computing system component is a software system
-
- G—PHYSICS
- G06—COMPUTING OR CALCULATING; COUNTING
- G06F—ELECTRIC DIGITAL DATA PROCESSING
- G06F11/00—Error detection; Error correction; Monitoring
- G06F11/30—Monitoring
- G06F11/32—Monitoring with visual or acoustical indication of the functioning of the machine
- G06F11/323—Visualisation of programs or trace data
Definitions
- the present invention relates to the field of cyber security. More particularly, the invention relates to a graph-based method for application flows recognition, based on managed serverless activity logs.
- Serverless computing provides automatic scaling features, built-in high availability, and a pay-for-use billing model that supports agility and cost optimization [18]. This allows developers to deal almost exclusively with application logic, rather than handling infrastructure management tasks, such as capacity provisioning and patching.
- FaaS Function as a Service
- aaS Function as a Service
- Such functions are initiated and halted frequently during the application runtime, to reflect the business logic invoked by the user and other system components.
- serverless computing environments A significant benefit of serverless computing environments is the high level of control and monitoring, and the high granularity logging that the computational cloud provider offers and manages.
- the serverless application's unique architecture increases the visibility of internal events between low-level functions and resources in a standardized manner [6].
- the serverless application's default logs can capture information about the execution of serverless functions, including data access, errors, or exceptions during runtime.
- serverless applications there are also a number of potential risks, due to the fact that in a serverless architecture the underlying infrastructure is managed by a cloud provider, which means that the application developer has less control over the security of the infrastructure. This can make it more difficult to implement and enforce security policies, and can also introduce new vulnerabilities, such as the potential data breaches or malicious attacks on the serverless functions themselves. Additionally, serverless architectures can make security incidents more difficult to monitor and detect, since the functions are typically ephemeral and the underlying infrastructure is abstracted away [7].
- serverless architecture includes many isolated entities, analyzing incidents and pinpointing potential security risks becomes more complex, as raw data logs do not allow a complete understanding of the application's behavior and the executed application-level logic. In such an environment, it is difficult for security teams (or third-party security service providers) who are unfamiliar with the application's structure, to quickly derive meaningful operational information about the application when handling an incident [6]. Since Security Operations Centers (SOC) are expensive and complex, companies outsource the monitoring and threat intelligence gathering, to third-party managed security service providers (MSSPs) [8].
- SOC Security Operations Centers
- MSSPs third-party managed security service providers
- Cloud computing has become an essential management and operations tool for most technology companies [2], [3].
- Serverless computing is one of the most advanced abstractions of cloud infrastructure. It highlights the benefits of cloud computing by allowing developers to focus on the logic of their applications instead of maintaining configurations and server-side management while the computational cloud provider is responsible for managing, scaling, and providing different resources to ensure that these functions run smoothly [1], [12].
- serverless computing is still developing, and security concerns have not yet been addressed.
- Over-privileged functions Serverless provides the ability to give privileges to individual functions, but such privileges must be limited to the smallest scope possible. As a result, many developers grant over-privileged permissions that are too high unnecessarily, which makes many functions vulnerable to hacking [13]. No direct interaction and flow of information between functions: The majority of applications rely on other services to transfer control from one function to another. To safely transfer arbitrary data between functions or requests, one should use storage services, which can be a potential point of attack [14]. There are additional security issues that are described in the Cloud Security Alliance report [15]; these include function event data injection, broken authentication, and insecure application secrets storage.
- a method for automatically recognizing the structure and the flows of an application according to which data is collected from managed serverless activity logs of a computational cloud provider that provides on-demand computing resources using distributed servers and then, an event-based graph is constructed, based on the activity logs, such that each node in the graph represents an entity of the application and each edge in the event-based graph represents an event being an interaction between entities or nodes.
- Application flows are recognized in the applications, based on the event-based graph and overlaps between the application flows are identified, based on the event-based graph characteristics.
- Monitoring services e.g., CloudWatch and CloudTrail
- AWS cloud may be used for observing the activities performed by the application.
- community detection algorithms are used to identify groups of nodes that are closely linked, based on interactions or similarities between them.
- the recognition of application flows and their entities are refined using graph-theory centrality measures (including degree, closeness, and betweenness centrality) to detect overlapping application flows.
- the nodes represent an individual user or a resource, and the edge can represent interaction or relationship among them.
- the raw activity logs that are collected from the computational cloud provider may describe entities, which are functions and resources and events of interactions between the entities.
- a preprocessing step may be performed, that includes the extraction of the source and target service for each event and the type of operation performed by the source.
- the application activities may be reconstructed by constructing a directed weighted graph using the activity logs, by linking entities, based on their interactions.
- the nodes may be sorted according to their centrality value in descending order.
- all the neighbors and their communities of each central node may be collected and each central node may be added to the neighbors' communities.
- a system for automatically recognizing the structure and flows of an application comprising:
- the present invention provides a graph-based method for application flows recognition from managed serverless activity logs (an activity log is a computer-generated record of events and changes that happen on a system).
- the method utilizes activity logs containing events associated with low-level operations between functions and resources.
- the activity logs are standard logs provided by the computational cloud provider monitoring tools that reflected the application behavior.
- the inactivity logs are produced without adding logging and operational overhead.
- the proposed method is automatic and does not rely on developers' manual intervention.
- the present invention also provides a system for application flows recognition from managed serverless activity logs, using a computerized device with at least one processor and operating software, which is adapted to perform the following steps:
- an event-based graph (a graphical representation of a system, based on the events that progress the system state with nodes and directed edges) is constructed, based on the activity logs that are collected from the computational cloud provider (an IT company that provides on-demand, scalable computing resources like computing power, data storage, or applications over the internet).
- Each node in the graph represents an entity of the application, (i.e., a function or resource, such as a table or a bucket)).
- Each edge in the graph represents an event (e.g., invocation, read, write operations) between the nodes.
- an application flow is a set of functions and resources which share common interaction patterns across multiple executions of an application, representing a logical process or a functional unit within a larger application.
- overlaps between the application flows are identified, based on the event-based graph characteristics.
- the present invention utilizes two main monitoring services available in the AWS cloud for observing the activities performed by the application (monitoring tools with the same capabilities are available on other computational cloud providers such as Azure and Google Cloud):
- a community detection algorithm to identify groups of nodes in the constructed graph
- communicate detection algorithms also known as graph clustering
- the algorithms aim to identify groups of nodes that are closely linked, based on interactions or similarities between them).
- G (V,E) where V is the set of nodes and E is the set of edges
- the nodes can represent an individual user or a resource, and the edge can represent interaction or relationship among them [9], [10].
- the Louvain algorithm [11] is used, which utilized the modularity measure of community strength, which quantifies the quality of an assignment of nodes to communities.
- the present invention provides a generic method for the automatic discovery of application flows in managed serverless applications.
- the discovery of application flows is crucial for improving the understanding of the structure of serverless applications and their associated entities (functions and resources) interactions by using logical connections.
- the present invention utilizes the raw default activity logs provided by the computational cloud provider, which reflect interactions (i.e., events) between entities in the application. Accordingly, the continuous interactions between entities are transformed into a graph that represents the application's activity.
- entities are grouped to discover the main application flows in a given application.
- centrality is a concept in graph analytics that deals with distinguishing important nodes in a graph and recognizes nodes that are important or central among the whole list of other nodes in a graph. Centrality offers all the relevant analytical information regarding that node and the graph from which the conclusion can be derived. The different perspectives of a particular node are studied under different indices, which are collectively known as centrality measures) are utilized to detect overlapping application flows.
- the proposed method is generic, it can be used by any platform that offers serverless computing services.
- the method has been applied to the AWS Lambda serverless computing platform.
- Fig. 1 illustrates the steps performed for application flows recognition: data collection and preprocessing, graph construction, grouping entities into communities, and refining communities by identifying overlapping nodes.
- raw activity logs are collected from the computational cloud provider's default monitoring tools. These activity logs describe entities, which are functions (e.g., Lambda) and resources (e.g., DynamoDB tables, S3 buckets) and events of interactions between those entities (e.g., Lambda function invocations and create, read, update, and delete operations on databases) used by the application.
- the preprocessing step includes the extraction of the source and target service for each event and the type of operation performed by the source.
- the source is the "userldentity principalld” field (representing the name of the Lambda function)
- the target is the "requestParameters tableName” field (representing the name of the DynamoDB table)
- "Getltem” is the operation (event name) performed.
- a directed weighted graph (a graph with edges being arrows that show path direction, where weights are assigned to each edge) is constructed using the activity logs, by linking entities (functions and resources) based on their interactions.
- Each edge ( u,v ) ⁇ V has a weight w ( u,v ) that represents the number of interactions executed between two entities ( u and v ).
- Fig. 2 is an example of graph construction and overlapping community detection, which illustrates the effects of each step on a given application. The following interactions are depicted by assuming AWS logs collected from a serverless application:
- a directed weighted graph is constructed.
- the graph consists of nine nodes and nine edges ( Fig. 2 ).
- C c 1 , c 2 ,...,c k , is obtained, where C is a set of disjoint communities and k ranges from one to
- Each community c consists of one to
- the first community (in yellow) consists of four nodes: the API Gateway, L1 Lambda function, L2 Lambda function, and S3 bucket, whereas the second community (in blue) includes five nodes: the step function, L3 Lambda function, L4 Lambda function, SNS topic, and DynamoDB table.
- central nodes are searched in the constructed graph to recognize potential overlapping entities.
- Central nodes are important components in the graph, since many entities interact with them, making them likely candidates for participating in multiple communities (i.e., application flows).
- centrality measures In order to detect central nodes, three different centrality measures are applied: degree, closeness, and betweenness centrality. Each centrality measure contributes its perspective to identify central nodes in a given graph.
- the degree centrality defines the importance of a node based on the number of edges connected to the given node [25].
- the closeness centrality identifies a node's importance based on how close it is to all the other nodes in the graph [25] and is based on the total geodesic distance from a given node to all other nodes.
- the geodesic distance between two nodes is the number of edges of the shortest path between the nodes.
- the betweenness centrality defines the importance of a node based on the number of times it occurs in the shortest paths between other nodes.
- the betweenness centrality measures the percentage of the shortest path in a network and where a particular node lies in it [25].
- the nodes After computing the three centrality values for each node in the graph, the nodes are sorted according to their centrality value (the centrality value is the number of edges of a node, divided by the number of edges of the highest-degree node) in descending order. Then, the k - 1 nodes with the highest values are chosen, where k is the number of communities, and store these high-valued nodes detected by the three centrality measures.
- each central node all its neighbors and their communities are collected and each central node is added to the neighbors' communities.
- the DynamoDB table was found to be a central node, since two Lambda functions (L2 and L3) interact with this storage resource. It can be seen that L2 is associated with Community 0 (yellow), whereas L3 is related to Community 1 (blue). Therefore, this central node (the DynamoDB table) is identified as an overlapping node. As a result, this table is associated with both communities rather than being associated solely with Community 1 ( Fig. 2 ).
- workflow orchestration services such as AWS Step Function 1 , Azure Logic Apps 2 , and Google cloud Workflows. 7 These services are used to orchestrate multiple serverless services in order to create an abstraction of business logic. The goal is to create and implement a business logic flow. In a single execution of a workflow, multiple functions are invoked. The workflow is responsible for a dedicated task, this implies that the step function and all of the Lambda functions invoked by it are related to the same business logic, and thus to the same application flows.
- the step function interacts with two Lambda functions: L2 and L3, and belongs to Community 1.
- the L3 Lambda function is already associated with Community 1, however, the L2 Lambda function is associated solely with Community 0.
- L2 is also added to Community 1.
- a serverless evaluation testbed has been created in an AWS environment that contains two open-source serverless applications: Airline Booking and Video on Demand (VOD).
- the testbed comprises a simulator to activate those applications for a certain period of time to simulate legitimate user activity.
- the activity logs of those applications were collected using two AWS monitoring tools: CloudTrail and CloudWatch.
- testbed has been developed to: (1) cover several serverless development paradigms that utilize many types of serverless cloud services, and (2) generate a large amount of logging data through "real-life" activities.
- the testbed includes two applications, an Airline Booking application, and a VOD application, that were deployed using AWS. These applications were selected because they utilize a variety of AWS's serverless services, and cover two different approaches to serverless development.
- Airline Booking application most of the Lambda functions have one specific use in the business logic, while the Lambda functions in the VOD application are more generic and can be used multiple times in different contexts (i.e., overlapping between application flows).
- the entire testbed is monitored by AWS CloudTrail and CloudWatch, and we used these monitoring tools to produce and collect the activity logs.
- VOD Video On Demand
- This application is based on "Video on Demand on AWS.” 3 from AWS solutions, a ready-to-deploy solution developed by Amazon.
- This VOD application converts videos stored in a designated S3 bucket into a streaming format and stores it in another bucket (including only the back-end side) written in JavaScript.
- the application contains four step functions which are responsible for four out of five main application flows of the application.
- Three of the step functions are part of the main flow that converts the format of the video files: (1) Ingest, which checks the file's validity, (2) Process, which changes the file from regular video file coding to a different type of coding using the AWS Elemental MediaConvert service, and (3) Publish, which creates a link to the file's location in the cloud and sends it by mail using AWS SQS.
- the (4) Mailing flow a service that uses AWS SES (Simple Mailing service, a flexible service that enables developers to send mail from within any application), to insert mail into the S3 bucket and process it.
- AWS SES Simple Mailing service, a flexible service that enables developers to send mail from within any application
- EventBridge triggers and step functions a time-based trigger event that collects application usage statistics and writes them to an S3 bucket (similarly to the back office process in the airline application).
- This application is based on "AWS-serverless-airline-booking" 4 and deployed through AWS Amplify. Its front-end web server was developed in Vue js, and the backend was developed in JavaScript and Python.
- the application contains multiple REST API endpoints that allow users to interact with it. It contains a variety of AWS services: four DynamoDB tables, four S3 buckets, SQS and SNS services (queue and notifications services), the Appsync API service, and 12 Lambda functions. Some of the Lambda functions are orchestrated using the AWS Step Function service.
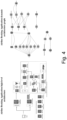
- the main application flows in the airline application can be divided into four groups: (1) Loyalty, an API request that retrieves information from a DynamoDB table and presents the data to the user (e.g., the current balance of points in the loyalty account); (2) Catalog, an API request that retrieves information on flights from a DynamoDB table and presents the data to the user. These types of events are brief and contain one access to a data source at a time. (3) Booking, an API request for flight booking, which triggers a series of data accesses and Lambda invocations. This series of events is orchestrated by a step function. (4) Logging, time-based trigger events that collect statistics on the application and write them to an S3 bucket, based on the AWS EventBridge service. An example of such a Lambda is the back office Lambda which logs recent bookings every hour. Fig. 4 presents the Airline Booking application high-level architecture.
- a simulator was created to activate those applications for a certain period of time to simulate legitimate user activity and generate data for the experiments. For each application, a unique simulator suited to the application's characteristics was created, based on Python scripts that activate functions in a logical order as would occur when a regular user uses the application. Also, actions that would simulate errors that could occur if a user was not as well-versed in the application were included.
- This application consists of uploads of files into an S3 bucket, we created a staging S3 bucket that imitates a virtual "local drive" of a user that uploads video files to the source bucket of the application.
- the simulator uses the AWS SDK for Python (Boto3) in order to perform the cloud operations that trigger the application's workflow (Upload files to S3 buckets).
- Boto3 Python
- a domain was purchased via the Amazon Route 53 service and configured the Amazon SES to receive and store emails from that domain.
- the simulator also uses Python's email library to send emails to the domain.
- the "Trending YouTube Video Statistics" dataset from Kaggle was used. 10 This dataset contains information about trending videos on YouTube. The distribution of the uploads of these videos was used to simulate the same distribution for the activity in the VOD application.
- VOD and Airline Booking applications have been executed in the testbed with the simulator.
- the raw activity logs were collected using the AWS monitoring services (CloudTrail and CloudWatch) and divided into two distinct datasets: a video on demand application dataset and an airline booking application dataset.
- This application has been executed for 21 hours, while collecting 215,369 events using the AWS monitoring services.
- 150,810 events were associated with data access calls, and 64,568 events were related to Lambda invocations (as indicated in Table I below).
- the application is data-driven.
- the main workflow in the application is based on accessing S3 buckets and DynamoDB tables, as opposed to the Airline Booking application, in which VOD the workflow is function-driven.
- the structure of the applications affects the number of events during the applications' runtime.
- a collection of activity logs were obtained using the VOD and Airline Booking application datasets.
- the activity logs were processed by extracting the source and target service from each event, and the type of operation performed by each source.
- a directed weighted graph has been constructed for each application based on the source and target services, where each node represents an entity (e.g., cloud services like Lambda functions or DynamoDB tables) and each edge represents the type of operation performed (e.g., Invoke, GetObject, Putltem).
- the weight of each edge is the number of the same operations performed between two entities (e.g., L1 Lambda performed the same GetObject operation on a DynamboDB table T1 10 times).
- the Louvain community detection algorithm has been applied to group entities into disjoint communities based on their interactions. The communities detected serve as raw or initial application flows.
- the detection of application flows has been refined by applying three centrality measures: degree, closeness, and betweenness centrality measures. Then, for each centrality measure (calculating the importance of any given node in a network using graph theory), the top two and four central nodes that obtained the highest centrality scores in the Airline Booking and VOD application datasets were chosen, respectively. The difference in the number of top central nodes is related to the k - 1 parameter, which resembles the number of communities detected by the Louvain algorithm in each application, three and five, respectively. Then, these central nodes were added to their neighbors' communities to improve the recognition of application flows.
- Graph Construction Two directed weighted graphs were constructed based on the VOD and Airline Booking application datasets, respectively. These weighted graphs reflect the activities performed in each application by its entities (resources and functions).
- the graph constructed based on the VOD Application dataset contains 37 nodes and 48 edges.
- the graph constructed based on the Airline Booking application dataset contains 25 nodes and 28 edges (as illustrated in Fig. 3A ).
- the VOD application graph shows that most of the activities are dominated by several Lambda functions. Most of these Lambda functions are triggered by step functions, and in many cases, these functions interact with storage resources, such as DynamboDBs and S3s.
- Fig. 4 shows the high-level architecture of the Airline Booking application, based on the original AWS repository (on the left) and the dynamic graph architecture generated by AFRISE (on the right).
- the original AWS architecture consists of static connections between the application's functions and resources. Since according to the present invention, the constructed graph is based on the application activity logs, it includes more connections that do not appear in the static architecture (some resources in the extended application do not appear the in original AWS architecture).
- Fig. 3B presented the community detection in the Airline Booking application graph.
- five and three main application flows were detected in the VOD and Airline Booking applications.
- the disjoint communities that were detected obtained an overlapping NMI score of 0.785, an Omega index score of 0.866, and an average Jaccard similarity of 0.748 (Table IV).
Landscapes
- Engineering & Computer Science (AREA)
- Theoretical Computer Science (AREA)
- Computer Security & Cryptography (AREA)
- General Engineering & Computer Science (AREA)
- Software Systems (AREA)
- Computer Hardware Design (AREA)
- Physics & Mathematics (AREA)
- General Physics & Mathematics (AREA)
- Quality & Reliability (AREA)
- Management, Administration, Business Operations System, And Electronic Commerce (AREA)
Abstract
Description
- The present invention relates to the field of cyber security. More particularly, the invention relates to a graph-based method for application flows recognition, based on managed serverless activity logs.
- The use of cloud-based environments in computing and particularly, in serverless computing, has grown dramatically in recent years [12, 14, 29]. Serverless computing provides automatic scaling features, built-in high availability, and a pay-for-use billing model that supports agility and cost optimization [18]. This allows developers to deal almost exclusively with application logic, rather than handling infrastructure management tasks, such as capacity provisioning and patching.
- Current serverless applications use the Function as a Service (FaaS) model, which is capable of executing many atomic low-level functions that interact with each other via native APIs of the cloud provider [28]. Such functions are initiated and halted frequently during the application runtime, to reflect the business logic invoked by the user and other system components.
- A significant benefit of serverless computing environments is the high level of control and monitoring, and the high granularity logging that the computational cloud provider offers and manages. In contrast to a monolithic application (in which the logging mechanism is performed according to the developers' decision), the serverless application's unique architecture increases the visibility of internal events between low-level functions and resources in a standardized manner [6]. The serverless application's default logs can capture information about the execution of serverless functions, including data access, errors, or exceptions during runtime.
- Alongside the advantages of serverless applications, there are also a number of potential risks, due to the fact that in a serverless architecture the underlying infrastructure is managed by a cloud provider, which means that the application developer has less control over the security of the infrastructure. This can make it more difficult to implement and enforce security policies, and can also introduce new vulnerabilities, such as the potential data breaches or malicious attacks on the serverless functions themselves. Additionally, serverless architectures can make security incidents more difficult to monitor and detect, since the functions are typically ephemeral and the underlying infrastructure is abstracted away [7].
- In addition to serverless security challenges, there are also challenges associated with security operations management. Since serverless architecture includes many isolated entities, analyzing incidents and pinpointing potential security risks becomes more complex, as raw data logs do not allow a complete understanding of the application's behavior and the executed application-level logic. In such an environment, it is difficult for security teams (or third-party security service providers) who are unfamiliar with the application's structure, to quickly derive meaningful operational information about the application when handling an incident [6]. Since Security Operations Centers (SOC) are expensive and complex, companies outsource the monitoring and threat intelligence gathering, to third-party managed security service providers (MSSPs) [8].
- Access to the raw data logs by third party entities (e.g., MSSP subcontractors) or potential attackers may be problematic, since valuable information can be inferred or leaked from these logs. This valuable information can be misused and compromise the security and privacy of the application owner.
- Cloud computing has become an essential management and operations tool for most technology companies [2], [3]. Serverless computing is one of the most advanced abstractions of cloud infrastructure. It highlights the benefits of cloud computing by allowing developers to focus on the logic of their applications instead of maintaining configurations and server-side management while the computational cloud provider is responsible for managing, scaling, and providing different resources to ensure that these functions run smoothly [1], [12]. Despite its many benefits, serverless computing is still developing, and security concerns have not yet been addressed.
- The following are some of the security threats associated with serverless computing:
Over-privileged functions: Serverless provides the ability to give privileges to individual functions, but such privileges must be limited to the smallest scope possible. As a result, many developers grant over-privileged permissions that are too high unnecessarily, which makes many functions vulnerable to hacking [13]. No direct interaction and flow of information between functions: The majority of applications rely on other services to transfer control from one function to another. To safely transfer arbitrary data between functions or requests, one should use storage services, which can be a potential point of attack [14]. There are additional security issues that are described in the Cloud Security Alliance report [15]; these include function event data injection, broken authentication, and insecure application secrets storage. - Several attempts were made to solve these problems: Alpernas et al. [16] created the Trapeze architecture, an approach for securing serverless systems using dynamic information flow control (IFC) to monitor and track the system by monitoring inputs and outputs of all of the functions. Obetz et al. [17] proposed a static analysis technique using call graphs that utilizes information about relationships between serverless functions and the platform services with which they interact. Datta et al. [18] presented the Valve, a platform for dynamic information flow control, which uses networklevel tainting to monitor functions activity and detect attacks, in order to ensure control flow integrity. The SecLambda security framework, presented by Jegan et al. [14], leverages the local function state and global application state to perform sophisticated security tasks aimed at protecting an application in a serverless environment. The authors provided three tasks: flow integrity, credential protection, and DoS rate limiting. Sankaran et al. [19] proposed the WILL.IAM, workflow aware access control model to secure serverless applications. The model aims to enable developers to specify permissible transitions of workflows, using policies they build, aligned to AWS IAM permissions.
- However, the above solutions are designed for non-managed serverless environments, where the organization manages the infrastructure itself, giving them more control in detecting cyberattacks on serverless applications
It is therefore an object of the present invention to provide an infrastructure for inferring the structure of an application. - It is another object of the present invention to provide an infrastructure for the recognition of application flows.
- Other objects and advantages of the invention will become apparent as the description proceeds.
- A method for automatically recognizing the structure and the flows of an application, according to which data is collected from managed serverless activity logs of a computational cloud provider that provides on-demand computing resources using distributed servers and then, an event-based graph is constructed, based on the activity logs, such that each node in the graph represents an entity of the application and each edge in the event-based graph represents an event being an interaction between entities or nodes. Application flows are recognized in the applications, based on the event-based graph and overlaps between the application flows are identified, based on the event-based graph characteristics.
- Monitoring services (e.g., CloudWatch and CloudTrail), available in the AWS cloud, may be used for observing the activities performed by the application.
- In one aspect, community detection algorithms are used to identify groups of nodes that are closely linked, based on interactions or similarities between them.
- In another aspect, the recognition of application flows and their entities are refined using graph-theory centrality measures (including degree, closeness, and betweenness centrality) to detect overlapping application flows.
- The nodes represent an individual user or a resource, and the edge can represent interaction or relationship among them.
- The raw activity logs that are collected from the computational cloud provider may describe entities, which are functions and resources and events of interactions between the entities.
- A preprocessing step may be performed, that includes the extraction of the source and target service for each event and the type of operation performed by the source.
- The application activities may be reconstructed by constructing a directed weighted graph using the activity logs, by linking entities, based on their interactions.
- The nodes may be sorted according to their centrality value in descending order.
- In one aspect, all the neighbors and their communities of each central node may be collected and each central node may be added to the neighbors' communities.
- A system for automatically recognizing the structure and flows of an application, comprising:
- a) a computational cloud provider that provides on-demand computing resources using distributed servers;
- b) a computerized device having at least one processor and operating software, being adapted to:
- b.1) collect data from managed serverless activity logs of a computational cloud provider that provides on-demand computing resources using distributed servers;
- b.2) construct an event-based graph, based on the activity logs, where each node in the event-based graph represents an entity of the application and each edge in the event-based graph represents an event being an interaction between entities or nodes;
- b.3) recognize application flows in the application, based on the event-based graph; and
- b.4) identify overlaps between the application flows, based on the event-based graph characteristics.
- The above and other characteristics and advantages of the invention will be better understood through the following illustrative and non-limitative detailed description of preferred embodiments thereof, with reference to the appended drawings, wherein:
-
Fig. 1 illustrates the steps performed for application flows recognition, according to an embodiment of the invention; -
Fig. 2 is an example of graph construction and overlapping community detection, which illustrates the effects of each step on a given application; -
Fig. 3 illustrates an Airline Booking application graph and disjoint community detection partition using the Louvain algorithm; and. -
Fig. 4 illustrates an Airline Booking application high-level architecture and the graph that was constructed, according to an embodiment of the invention. - The present invention provides a graph-based method for application flows recognition from managed serverless activity logs (an activity log is a computer-generated record of events and changes that happen on a system). The method utilizes activity logs containing events associated with low-level operations between functions and resources. The activity logs are standard logs provided by the computational cloud provider monitoring tools that reflected the application behavior. The inactivity logs are produced without adding logging and operational overhead. The proposed method is automatic and does not rely on developers' manual intervention. The present invention also provides a system for application flows recognition from managed serverless activity logs, using a computerized device with at least one processor and operating software, which is adapted to perform the following steps:
At the first step, an event-based graph (a graphical representation of a system, based on the events that progress the system state with nodes and directed edges) is constructed, based on the activity logs that are collected from the computational cloud provider (an IT company that provides on-demand, scalable computing resources like computing power, data storage, or applications over the internet). Each node in the graph represents an entity of the application, (i.e., a function or resource, such as a table or a bucket)). Each edge in the graph represents an event (e.g., invocation, read, write operations) between the nodes. - At the next step, application flows in the applications are recognized, based on the event-based graph (an application flow is a set of functions and resources which share common interaction patterns across multiple executions of an application, representing a logical process or a functional unit within a larger application). At the next step, overlaps between the application flows are identified, based on the event-based graph characteristics.
- The present invention utilizes two main monitoring services available in the AWS cloud for observing the activities performed by the application (monitoring tools with the same capabilities are available on other computational cloud providers such as Azure and Google Cloud):
- CloudWatch: The service provides data and actionable insights on applications' performance and resource utilization. CloudWatch collects monitoring and operational data in the form of activity logs, metrics, and events. The activity logs contain events, each event has two cloud resources and one operation between them.
- CloudTrail: The service provides activity logs for every API call (i.e., event) in the cloud environment between the cloud services. These API calls might be a create, read, update, delete (CRUD) operation on a table in a database, an invocation of a Lambda function, etc. The trail contains data associated with the application's resources (e.g., S3, Lambda, and DynamoDB) and needed to create manually.
- In the method of the present invention uses a community detection algorithm to identify groups of nodes in the constructed graph (community detection algorithms, also known as graph clustering, are a group of algorithms designed for network analysis, which rely on the connection between the nodes as a single attribute type. The algorithms aim to identify groups of nodes that are closely linked, based on interactions or similarities between them). For a given graph, represented by G = (V,E) where V is the set of nodes and E is the set of edges, the community detection finds a community structure, which is the partition of the nodes in V in the form of P = C1,C2,...,Ck, such that each Ci,1 ≤ i ≤ k exhibits the community structure that presents groups of nodes' so-called communities. The nodes can represent an individual user or a resource, and the edge can represent interaction or relationship among them [9], [10]. In the method of the present invention, the Louvain algorithm [11] is used, which utilized the modularity measure of community strength, which quantifies the quality of an assignment of nodes to communities.
- The present invention provides a generic method for the automatic discovery of application flows in managed serverless applications. The discovery of application flows is crucial for improving the understanding of the structure of serverless applications and their associated entities (functions and resources) interactions by using logical connections. The present invention utilizes the raw default activity logs provided by the computational cloud provider, which reflect interactions (i.e., events) between entities in the application. Accordingly, the continuous interactions between entities are transformed into a graph that represents the application's activity. Using a community detection algorithm, entities are grouped to discover the main application flows in a given application. In order to refine the recognition of an application's main application flows and their entities, graph-theory centrality measures (centrality is a concept in graph analytics that deals with distinguishing important nodes in a graph and recognizes nodes that are important or central among the whole list of other nodes in a graph. Centrality offers all the relevant analytical information regarding that node and the graph from which the conclusion can be derived. The different perspectives of a particular node are studied under different indices, which are collectively known as centrality measures) are utilized to detect overlapping application flows.
- Since the proposed method is generic, it can be used by any platform that offers serverless computing services. In this example, the method has been applied to the AWS Lambda serverless computing platform.
-
Fig. 1 illustrates the steps performed for application flows recognition: data collection and preprocessing, graph construction, grouping entities into communities, and refining communities by identifying overlapping nodes. - In this step, raw activity logs are collected from the computational cloud provider's default monitoring tools. These activity logs describe entities, which are functions (e.g., Lambda) and resources (e.g., DynamoDB tables, S3 buckets) and events of interactions between those entities (e.g., Lambda function invocations and create, read, update, and delete operations on databases) used by the application. The preprocessing step includes the extraction of the source and target service for each event and the type of operation performed by the source. For example, in an event of a Lambda function that retrieves data from a DynamoDB table, the source is the "userldentity principalld" field (representing the name of the Lambda function), the target is the "requestParameters tableName" field (representing the name of the DynamoDB table), and "Getltem" is the operation (event name) performed.
- To reconstruct the application activities, a directed weighted graph (a graph with edges being arrows that show path direction, where weights are assigned to each edge) is constructed using the activity logs, by linking entities (functions and resources) based on their interactions. The directed weighted graph is given by G = (V,E),W : E → N, where V is a set of entities and E is a set of directed edges between these entities. These directed edges represent the interactions performed between two entities. Each edge (u,v) ∈ V has a weight w(u,v) that represents the number of interactions executed between two entities (u and v).
-
Fig. 2 is an example of graph construction and overlapping community detection, which illustrates the effects of each step on a given application. The following interactions are depicted by assuming AWS logs collected from a serverless application: - a) The requests through the API gateway invoke five and three times the L1 and L2 Lambda functions, respectively;
- b) The step function invokes seven times and five times for L3 and L2 lambda functions, respectively;
- The L1 lambda function applies five getObject events on the S3 bucket;
- The L2 lambda function applies three putltem events on the DynamoDB table;
- The L3 lambda function queries the DynamoDB table four times;
- The L3 lambda function applies three Publish events on the SNS topic;
- The requests through the SNS topic invoke three times the L4 Lambda function.
- Based on this example, a directed weighted graph is constructed. The graph consists of nine nodes and nine edges (
Fig. 2 ). - We apply a community detection algorithm (e.g., Louvain [11], Grivan-Newman [24]) to group entities into communities, based on their interactions. The entities associated with a disjoint community represent an application flow in the constructed graph. At the end of this step, C = c 1,c 2 ,...,ck, is obtained, where C is a set of disjoint communities and k ranges from one to |V| nodes. Each community c;consists of one to |V| distinct nodes.
- In the example presented in
Fig. 2 , after applying a community detection algorithm in this step, two raw communities were discovered. The first community (in yellow) consists of four nodes: the API Gateway, L1 Lambda function, L2 Lambda function, and S3 bucket, whereas the second community (in blue) includes five nodes: the step function, L3 Lambda function, L4 Lambda function, SNS topic, and DynamoDB table. - The use of community detection algorithms on the constructed graph produces a set of disjoint communities composed of serverless entities (functions and resources). However, there are many serverless applications, in which some of the entities are involved in more than a single application flow. Therefore, in order to improve the recognition of application flows in such complex applications, entities (i.e., nodes in the graph) participating in multiple application flows are identified
- First, central nodes are searched in the constructed graph to recognize potential overlapping entities. Central nodes are important components in the graph, since many entities interact with them, making them likely candidates for participating in multiple communities (i.e., application flows).
- In order to detect central nodes, three different centrality measures are applied: degree, closeness, and betweenness centrality. Each centrality measure contributes its perspective to identify central nodes in a given graph. The degree centrality defines the importance of a node based on the number of edges connected to the given node [25]. The closeness centrality identifies a node's importance based on how close it is to all the other nodes in the graph [25] and is based on the total geodesic distance from a given node to all other nodes.
- The geodesic distance between two nodes is the number of edges of the shortest path between the nodes. The betweenness centrality defines the importance of a node based on the number of times it occurs in the shortest paths between other nodes. The betweenness centrality measures the percentage of the shortest path in a network and where a particular node lies in it [25].
- After computing the three centrality values for each node in the graph, the nodes are sorted according to their centrality value (the centrality value is the number of edges of a node, divided by the number of edges of the highest-degree node) in descending order. Then, the k - 1 nodes with the highest values are chosen, where k is the number of communities, and store these high-valued nodes detected by the three centrality measures.
- Then, for each central node, all its neighbors and their communities are collected and each central node is added to the neighbors' communities.
- In the example presented in
Fig. 2 , after applying the centrality measures in this step, the DynamoDB table was found to be a central node, since two Lambda functions (L2 and L3) interact with this storage resource. It can be seen that L2 is associated with Community 0 (yellow), whereas L3 is related to Community 1 (blue). Therefore, this central node (the DynamoDB table) is identified as an overlapping node. As a result, this table is associated with both communities rather than being associated solely with Community 1 (Fig. 2 ). - In order to identify additional overlapping nodes, we also focus on workflow orchestration services, such as AWS Step Function1, Azure Logic Apps2, and Google cloud Workflows.7 These services are used to orchestrate multiple serverless services in order to create an abstraction of business logic. The goal is to create and implement a business logic flow. In a single execution of a workflow, multiple functions are invoked. The workflow is responsible for a dedicated task, this implies that the step function and all of the Lambda functions invoked by it are related to the same business logic, and thus to the same application flows.
- As a result, we add these Lambda functions to the step function's community, based on the executions in the logs.
- In the example of
Fig. 2 , the step function interacts with two Lambda functions: L2 and L3, and belongs toCommunity 1. The L3 Lambda function is already associated withCommunity 1, however, the L2 Lambda function is associated solely withCommunity 0. By performing this step, L2 is also added toCommunity 1. - To analyze and evaluate the performance of the proposed method, an experimental serverless cloud environment was required.
- To evaluate the performance of the present invention, a serverless evaluation testbed has been created in an AWS environment that contains two open-source serverless applications: Airline Booking and Video on Demand (VOD). The testbed comprises a simulator to activate those applications for a certain period of time to simulate legitimate user activity. The activity logs of those applications were collected using two AWS monitoring tools: CloudTrail and CloudWatch.
- The testbed has been developed to: (1) cover several serverless development paradigms that utilize many types of serverless cloud services, and (2) generate a large amount of logging data through "real-life" activities.
- The testbed includes two applications, an Airline Booking application, and a VOD application, that were deployed using AWS. These applications were selected because they utilize a variety of AWS's serverless services, and cover two different approaches to serverless development. In the Airline Booking application, most of the Lambda functions have one specific use in the business logic, while the Lambda functions in the VOD application are more generic and can be used multiple times in different contexts (i.e., overlapping between application flows). The entire testbed is monitored by AWS CloudTrail and CloudWatch, and we used these monitoring tools to produce and collect the activity logs.
- This application is based on "Video on Demand on AWS."3 from AWS solutions, a ready-to-deploy solution developed by Amazon. This VOD application converts videos stored in a designated S3 bucket into a streaming format and stores it in another bucket (including only the back-end side) written in JavaScript. The application contains four step functions which are responsible for four out of five main application flows of the application. Three of the step functions are part of the main flow that converts the format of the video files: (1) Ingest, which checks the file's validity, (2) Process, which changes the file from regular video file coding to a different type of coding using the AWS Elemental MediaConvert service, and (3) Publish, which creates a link to the file's location in the cloud and sends it by mail using AWS SQS. In addition the (4) Mailing flow, a service that uses AWS SES (Simple Mailing service, a flexible service that enables developers to send mail from within any application), to insert mail into the S3 bucket and process it. There are two ways of interacting with the application: by manually uploading the files to the source S3 bucket or by sending an email to a predefined mail endpoint. Once the file arrives at the source S3 bucket, the remainder of the flow is performed automatically via EventBridge triggers and step functions. (5) Logging, a time-based trigger event that collects application usage statistics and writes them to an S3 bucket (similarly to the back office process in the airline application).
- This application is based on "AWS-serverless-airline-booking"4 and deployed through AWS Amplify. Its front-end web server was developed in Vue js, and the backend was developed in JavaScript and Python. The application contains multiple REST API endpoints that allow users to interact with it. It contains a variety of AWS services: four DynamoDB tables, four S3 buckets, SQS and SNS services (queue and notifications services), the Appsync API service, and 12 Lambda functions. Some of the Lambda functions are orchestrated using the AWS Step Function service. The main application flows in the airline application can be divided into four groups: (1) Loyalty, an API request that retrieves information from a DynamoDB table and presents the data to the user (e.g., the current balance of points in the loyalty account); (2) Catalog, an API request that retrieves information on flights from a DynamoDB table and presents the data to the user. These types of events are brief and contain one access to a data source at a time. (3) Booking, an API request for flight booking, which triggers a series of data accesses and Lambda invocations. This series of events is orchestrated by a step function. (4) Logging, time-based trigger events that collect statistics on the application and write them to an S3 bucket, based on the AWS EventBridge service. An example of such a Lambda is the back office Lambda which logs recent bookings every hour.
Fig. 4 presents the Airline Booking application high-level architecture. - A simulator was created to activate those applications for a certain period of time to simulate legitimate user activity and generate data for the experiments. For each application, a unique simulator suited to the application's characteristics was created, based on Python scripts that activate functions in a logical order as would occur when a regular user uses the application. Also, actions that would simulate errors that could occur if a user was not as well-versed in the application were included.
- This application consists of uploads of files into an S3 bucket, we created a staging S3 bucket that imitates a virtual "local drive" of a user that uploads video files to the source bucket of the application. The simulator uses the AWS SDK for Python (Boto3) in order to perform the cloud operations that trigger the application's workflow (Upload files to S3 buckets). In order to trigger the mailing flow, a domain was purchased via the Amazon Route 53 service and configured the Amazon SES to receive and store emails from that domain. In addition to the direct uploads via Boto3, the simulator also uses Python's email library to send emails to the domain. To simulate the accurate timing of file uploads, the "Trending YouTube Video Statistics" dataset from Kaggle was used. 10This dataset contains information about trending videos on YouTube. The distribution of the uploads of these videos was used to simulate the same distribution for the activity in the VOD application.
- traffic through the website that serves as the front-end of the application has been simulated, where the simulation has fixed probabilities for different types of booking reservations (e.g., one-way or two-way). Once the simulator completes the booking reservation, the step function within the cloud environment is triggered and starts its workflow. Within that workflow, there are error-handling mechanisms that invoke different combinations of Lambda functions. To generate additional behavior patterns for our application, we added some failure paths to the Lambda functions which are part of the error-handling process. The probability for the execution of these paths is defined in the Airline Booking application's configuration table. The total time of the simulation is dictated by the number of iterations we set before we run the script. To simulate a real-life activity across an application, we set intervals that create gaps between users' activities with respect to the time of day and the users' actions. This creates a distributed activity load that is more aligned with the real behavior of users.
- In order to evaluate performance on the task of discovering application flows in serverless applications, the VOD and Airline Booking applications have been executed in the testbed with the simulator. The raw activity logs were collected using the AWS monitoring services (CloudTrail and CloudWatch) and divided into two distinct datasets: a video on demand application dataset and an airline booking application dataset.
- This application has been executed for 21 hours, while collecting 215,369 events using the AWS monitoring services. In the activity logs, 150,810 events were associated with data access calls, and 64,568 events were related to Lambda invocations (as indicated in Table I below). The application is data-driven. The main workflow in the application is based on accessing S3 buckets and DynamoDB tables, as opposed to the Airline Booking application, in which VOD the workflow is function-driven.
- This application has been executed for 24 hours, while collecting 112,973 events using the AWS monitoring services. In the activity logs, 81,059 events were associated with data access calls, and 31,914 events were related to Lambda invocations (as indicated in Table I below).
Table I THE TOTAL NUMBER OF RAW LOGS COLLECTED IN THE TESTBED SIMULATION. THE LOGS WERE GROUPED BY APPLICATION (VOD AND AIRLINE BOOKING) AND EVENT TYPE (DATA ACCESS CALLS, I.E., S3 AND DYNAMODB, AND LAMBDA FUNCTION INVOCATIONS) Application Event Type Number of events Data access calls 150,810 VOD Lambda invocations 64,586 Total 215,396 Data access calls 81,059 Airline Lambda invocations 31,914 Total 112,973 - The structure of the applications affects the number of events during the applications' runtime.
- To evaluate the detected application flows, an expert-based ground-truth dataset was manually created for each application, based on the application's architecture, source code, and documentation. Based on their roles, each entity (functions and resources) in the application was associated with a single or multiple application flows. The ground truth was created with the assistance of two experts (closely familiar with both applications), who had to agree on the application flows. The VOD application contains 33 entities divided into five application flows. The Airline Booking application contains 22 entities divided into four application flows (Table II).
Table II THE NUMBER OF ENTITIES (FUNCTIONS AND RESOURCES) FOR EACH TYPE OF APPLICATION FLOW IN THE VOD AND AIRLINE BOOKING APPLICATIONS IN THE CONSTRUCTED GROUND TRUTH Application Application Flow Number of Entities Publish 10 Logging 11 VOD Mail 12 Process 9 Ingest 10 Unique Entities 37 Booking 10 Loyalty 5 Airline Catalog 2 Logging 10 Unique Entities 25 - A collection of activity logs were obtained using the VOD and Airline Booking application datasets. The activity logs were processed by extracting the source and target service from each event, and the type of operation performed by each source. A directed weighted graph has been constructed for each application based on the source and target services, where each node represents an entity (e.g., cloud services like Lambda functions or DynamoDB tables) and each edge represents the type of operation performed (e.g., Invoke, GetObject, Putltem). The weight of each edge is the number of the same operations performed between two entities (e.g., L1 Lambda performed the same GetObject operation on a DynamboDB table T1 10 times). Next, using this directed weighted graph, the Louvain community detection algorithm has been applied to group entities into disjoint communities based on their interactions. The communities detected serve as raw or initial application flows.
- Since there are entities that can be associated with multiple application flows, the detection of application flows has been refined by applying three centrality measures: degree, closeness, and betweenness centrality measures. Then, for each centrality measure (calculating the importance of any given node in a network using graph theory), the top two and four central nodes that obtained the highest centrality scores in the Airline Booking and VOD application datasets were chosen, respectively. The difference in the number of top central nodes is related to the k - 1 parameter, which resembles the number of communities detected by the Louvain algorithm in each application, three and five, respectively. Then, these central nodes were added to their neighbors' communities to improve the recognition of application flows.
- Finally, since both of the applications include step function services, the Lambda functions executed by each step function were added to the step function's community (if they were not already included) based on the step function's executions in the activity logs. At the end of this phase, a group of overlapping communities was obtained, each of which reflects an application flow.
- Graph Construction: Two directed weighted graphs were constructed based on the VOD and Airline Booking application datasets, respectively. These weighted graphs reflect the activities performed in each application by its entities (resources and functions). The graph constructed based on the VOD Application dataset contains 37 nodes and 48 edges. The graph constructed based on the Airline Booking application dataset contains 25 nodes and 28 edges (as illustrated in
Fig. 3A ). - The VOD application graph shows that most of the activities are dominated by several Lambda functions. Most of these Lambda functions are triggered by step functions, and in many cases, these functions interact with storage resources, such as DynamboDBs and S3s.
- There are two isolated sub-graphs on the Airline Booking application graph, which represent different flows in the Airline Booking application. For example,
nodes 4, 5, 12, 13, and 15 are totally isolated from the larger sub-graph, which implies independent application flows. -
Fig. 4 shows the high-level architecture of the Airline Booking application, based on the original AWS repository (on the left) and the dynamic graph architecture generated by AFRISE (on the right). The original AWS architecture consists of static connections between the application's functions and resources. Since according to the present invention, the constructed graph is based on the application activity logs, it includes more connections that do not appear in the static architecture (some resources in the extended application do not appear the in original AWS architecture). - Using the Louvain community detection algorithm, five and three disjoint communities were revealed in the VOD and Airline Booking application graphs, respectively.
Fig. 3B presented the community detection in the Airline Booking application graph. As a result, five and three main application flows were detected in the VOD and Airline Booking applications. - Upon applying the proposed method on the VOD application (by detecting disjoint communities), the overlapping NMI score of 0.511, Omega index score of 0.534, and average Jaccard similarity of 0.643 were obtained (Table III).

- Upon applying the proposed method to the Airline Booking application, the disjoint communities that were detected obtained an overlapping NMI score of 0.785, an Omega index score of 0.866, and an average Jaccard similarity of 0.748 (Table IV).

- Upon applying the proposed method on the VOD application (by assigning overlapping nodes to multiple communities using only nodes that were identified based on a high centrality score) an overlapping NMI score of 0.682, an Omega index score of 0.778, and an average Jaccard score of 0.806 (see Table III) were obtained. Upon applying the proposed method to the Airline Booking application (based on the overlapping communities), the overlapping NMI, Omega index, and average Jaccard similarity scores of 0.806, 0.858, and 0.75, respectively (see Table IV) were obtained.
- Using centrality measures to identify overlapping nodes improved performance compared to performance, based on the application of centrality measures alone on most of the performance measures. Therefore, this step contributes to the recognition of actual application flows.
- The present invention is characterized by the following items:
- 1. A method for automatically recognizing the structure and flows of an application, comprising:
- a) collecting data from managed serverless activity logs of a computational cloud provider that provides on-demand computing resources using distributed servers;
- b) constructing an event-based graph, based on said activity logs, where each node in said event-based graph represents an entity of said application and each edge in said event-based graph represents an event being an interaction between entities or nodes;
- c) recognizing application flows in said application, based on said event-based graph; and
- d) identifying overlaps between the application flows, based on the event-based graph characteristics.
- 2. A method according to
item 1, wherein monitoring services available in the AWS cloud are used for observing the activities performed by the application. - 3. A method according to
item 1, wherein the monitoring services include CloudWatch and CloudTrail. - 4. A method according to
item 1, further comprising using community detection algorithms to identify groups of nodes that are closely linked, based on interactions or similarities between said groups of nodes. - 5. A method according to
item 1, further comprising refining the recognition of application flows and their entities using graph-theory centrality measures to detect overlapping application flows. - 6. A method according to
item 1, wherein the nodes represent an individual user or a resource, and the edge can represent interaction or relationship among them. - 7. A method according to
item 1, wherein the raw activity logs being collected from the computational cloud provider describe entities, which are functions, resources and events of interactions between said entities. - 8. A method according to
item 1, further comprising a preprocessing step that includes the extraction of the source and target service for each event and the type of operation performed by a source. - 9. A method according to
item 1, wherein the application activities are reconstructed by constructing a directed weighted graph using the activity logs, by linking entities, based on their interactions. - 10. A method according to
item 1, wherein the centrality measures include degree, closeness, and betweenness centrality. - 11. A method according to
item 1, wherein the nodes are sorted according to their centrality value in descending order. - 12. A method according to
item 11, wherein for each central node, all its neighbors and their communities are collected and each central node is added to the neighbors' communities. - 13. A system for automatically recognizing the structure and flows of an application, comprising:
- a) a computational cloud provider that provides on-demand computing resources using distributed servers;
- b) a computerized device having at least one processor and operating software, being adapted to:
- b.1) collect data from managed serverless activity logs of a computational cloud provider that provides on-demand computing resources using distributed servers;
- b.2) construct an event-based graph, based on said activity logs, where each node in said event-based graph represents an entity of said application and each edge in said event-based graph represents an event being an interaction between entities or nodes;
- b.3) recognize application flows in said application, based on said event-based graph; and
- b.4) identify overlaps between the application flows, based on the event-based graph characteristics.
- 14. A system according to item 13, wherein monitoring services available in the AWS cloud are used for observing the activities performed by the application.
- 15. A system according to item 13, wherein the monitoring services include CloudWatch and CloudTrail.
- 16. A system according to item 13, further comprising using community detection algorithms to identify groups of nodes that are closely linked, based on interactions or similarities between said groups of nodes.
- 17. A system according to item 13, further comprising refining the recognition of application flows and their entities using graph-theory centrality measures to detect overlapping application flows.
- 18. A system according to item 13, wherein the nodes represent an individual user or a resource, and the edge can represent interaction or relationship among them.
- 19. A system according to item 13, wherein the raw activity logs being collected from the computational cloud provider describe entities, which are functions, resources and events of interactions between said entities.
- 20. A system according to item 13, further comprising a preprocessing step that includes the extraction of the source and target service for each event and the type of operation performed by a source.
- 21. A system according to item 13, wherein the application activities are reconstructed by constructing a directed weighted graph using the activity logs, by linking entities, based on their interactions.
- 22. A system according to item 13, wherein the centrality measures include degree, closeness, and betweenness centrality.
- 23. A system according to item 13, wherein the nodes are sorted according to their centrality value in descending order.
- 24. A system according to item 23, wherein for each central node, all its neighbors and their communities are collected and each central node is added to the neighbors' communities.
Claims (15)
- A method for automatically recognizing the structure and flows of an application, comprising:e) collecting data from managed serverless activity logs of a computational cloud provider that provides on-demand computing resources using distributed servers;f) constructing an event-based graph, based on said activity logs, where each node in said event-based graph represents an entity of said application and each edge in said event-based graph represents an event being an interaction between entities or nodes;g) recognizing application flows in said application, based on said event-based graph; andh) identifying overlaps between the application flows, based on the event-based graph characteristics.
- A method according to claim 1, wherein monitoring services available in the AWS cloud are used for observing the activities performed by the application.
- A method according to claim 1, wherein the monitoring services include CloudWatch and CloudTrail.
- A method according to claim 1, further comprising using community detection algorithms to identify groups of nodes that are closely linked, based on interactions or similarities between said groups of nodes.
- A method according to claim 1, further comprising refining the recognition of application flows and their entities using graph-theory centrality measures to detect overlapping application flows.
- A method according to claim 1, wherein the nodes represent an individual user or a resource, and the edge can represent interaction or relationship among them.
- A method according to claim 1, wherein the raw activity logs being collected from the computational cloud provider describe entities, which are functions, resources and events of interactions between said entities.
- A method according to claim 1, further comprising a preprocessing step that includes the extraction of the source and target service for each event and the type of operation performed by a source.
- A method according to claim 1, wherein the application activities are reconstructed by constructing a directed weighted graph using the activity logs, by linking entities, based on their interactions,
orwherein the centrality measures include degree, closeness, and betweenness centrality,
orwherein the nodes are sorted according to their centrality value in descending order,
orwherein for each central node, all its neighbors and their communities are collected and each central node is added to the neighbors' communities. - A system for automatically recognizing the structure and flows of an application, comprising:c) a computational cloud provider that provides on-demand computing resources using distributed servers;d) a computerized device having at least one processor and operating software, being adapted to:b.1) collect data from managed serverless activity logs of a computational cloud provider that provides on-demand computing resources using distributed servers;b.2) construct an event-based graph, based on said activity logs, where each node in said event-based graph represents an entity of said application and each edge in said event-based graph represents an event being an interaction between entities or nodes;b.3) recognize application flows in said application, based on said event-based graph; andb.4) identify overlaps between the application flows, based on the event-based graph characteristics.
- A system according to claim 10, wherein monitoring services available in the AWS cloud are used for observing the activities performed by the application.
- A system according to claim 10, wherein the monitoring services include CloudWatch and CloudTrail.
- A system according to claim 10, further comprising using community detection algorithms to identify groups of nodes that are closely linked, based on interactions or similarities between said groups of nodes.
- A system according to claim 10, further comprising refining the recognition of application flows and their entities using graph-theory centrality measures to detect overlapping application flows
orwherein the nodes represent an individual user or a resource, and the edge can represent interaction or relationship among them,
orwherein the raw activity logs being collected from the computational cloud provider describe entities, which are functions, resources and events of interactions between said entities,
orfurther comprising a preprocessing step that includes the extraction of the source and target service for each event and the type of operation performed by a source,
orwherein the application activities are reconstructed by constructing a directed weighted graph using the activity logs, by linking entities, based on their interactions,
orwherein the centrality measures include degree, closeness, and betweenness centrality,
orwherein the nodes are sorted according to their centrality value in descending order. - A system according to claim 14, wherein for each central node, all its neighbors and their communities are collected and each central node is added to the neighbors' communities.
Applications Claiming Priority (1)
| Application Number | Priority Date | Filing Date | Title |
|---|---|---|---|
| IL301384A IL301384A (en) | 2023-03-14 | 2023-03-14 | Identifying application flows in serverless managed applications |
Publications (2)
| Publication Number | Publication Date |
|---|---|
| EP4432094A1 true EP4432094A1 (en) | 2024-09-18 |
| EP4432094B1 EP4432094B1 (en) | 2026-02-04 |
Family
ID=90365491
Family Applications (1)
| Application Number | Title | Priority Date | Filing Date |
|---|---|---|---|
| EP24163674.5A Active EP4432094B1 (en) | 2023-03-14 | 2024-03-14 | Application flow recognition in managed serverless applications |
Country Status (2)
| Country | Link |
|---|---|
| EP (1) | EP4432094B1 (en) |
| IL (1) | IL301384A (en) |
Cited By (1)
| Publication number | Priority date | Publication date | Assignee | Title |
|---|---|---|---|---|
| US20250373631A1 (en) * | 2024-06-03 | 2025-12-04 | State Grid Jiangsu Electric Power Co., Ltd. Information & Telecommunication Branch | Attack detection and source tracing method and apparatus, electronic device, and storage medium |
Citations (1)
| Publication number | Priority date | Publication date | Assignee | Title |
|---|---|---|---|---|
| US20200128047A1 (en) * | 2018-10-19 | 2020-04-23 | Oracle International Corporation | Autonomous monitoring of applications in a cloud environment |
-
2023
- 2023-03-14 IL IL301384A patent/IL301384A/en unknown
-
2024
- 2024-03-14 EP EP24163674.5A patent/EP4432094B1/en active Active
Patent Citations (1)
| Publication number | Priority date | Publication date | Assignee | Title |
|---|---|---|---|---|
| US20200128047A1 (en) * | 2018-10-19 | 2020-04-23 | Oracle International Corporation | Autonomous monitoring of applications in a cloud environment |
Non-Patent Citations (1)
| Title |
|---|
| LIN WEI-TSUNG ET AL: "Tracking Causal Order in AWS Lambda Applications", 2018 IEEE INTERNATIONAL CONFERENCE ON CLOUD ENGINEERING (IC2E), IEEE, 17 April 2018 (2018-04-17), pages 50 - 60, XP033340499, DOI: 10.1109/IC2E.2018.00027 * |
Cited By (2)
| Publication number | Priority date | Publication date | Assignee | Title |
|---|---|---|---|---|
| US20250373631A1 (en) * | 2024-06-03 | 2025-12-04 | State Grid Jiangsu Electric Power Co., Ltd. Information & Telecommunication Branch | Attack detection and source tracing method and apparatus, electronic device, and storage medium |
| US12537834B2 (en) * | 2024-06-03 | 2026-01-27 | State Grid Jiangsu Electric Power Co., Ltd. Information & Telecommunication Braunch | Attack detection and source tracing method and apparatus, electronic device, and storage medium |
Also Published As
| Publication number | Publication date |
|---|---|
| IL301384A (en) | 2024-10-01 |
| EP4432094B1 (en) | 2026-02-04 |
Similar Documents
| Publication | Publication Date | Title |
|---|---|---|
| US12126643B1 (en) | Leveraging generative artificial intelligence (‘AI’) for securing a monitored deployment | |
| US12621325B2 (en) | Adaptive system for network and security management | |
| US12418555B1 (en) | Guiding query creation for a generative artificial intelligence (AI)-enabled assistant | |
| US12309185B1 (en) | Architecture for a generative artificial intelligence (AI)-enabled assistant | |
| US20230244812A1 (en) | Identifying Sensitive Data Risks in Cloud-Based Enterprise Deployments Based on Graph Analytics | |
| US12348545B1 (en) | Customizable generative artificial intelligence (‘AI’) assistant | |
| US20220027331A1 (en) | Cross-Environment Event Correlation Using Domain-Space Exploration and Machine Learning Techniques | |
| US11977471B2 (en) | Activity tracing through event correlation across multiple software applications | |
| Xu et al. | ProcSAGE: an efficient host threat detection method based on graph representation learning | |
| Chen et al. | Building machine learning-based threat hunting system from scratch | |
| US12563071B1 (en) | Using generative artificial intelligence to interface with a knowledge graph | |
| Viegas et al. | Enhancing service maintainability by monitoring and auditing SLA in cloud computing | |
| EP4478227A1 (en) | Permission misuse detection method in a serverless cloud environment | |
| Majumdar et al. | Learning probabilistic dependencies among events for proactive security auditing in clouds | |
| Lavi et al. | Detection of compromised functions in a serverless cloud environment | |
| EP4432094B1 (en) | Application flow recognition in managed serverless applications | |
| Wu et al. | Angus: efficient active learning strategies for provenance based intrusion detection | |
| Kumar Raju et al. | Event correlation in cloud: a forensic perspective | |
| US20250384074A1 (en) | Large language model security summarization | |
| CN121012662A (en) | Attack detection and handling methods, devices, electronic equipment, media and program products | |
| WO2026005846A1 (en) | Iterative data processing optimization engine in a data intelligence system | |
| US12634376B1 (en) | Predicting attack paths using code analysis | |
| Ashkenazi et al. | SMART: serverless module analysis and recognition technique for managed applications | |
| Adediran et al. | Retrieval-Augmented Large Language Model for AWS Cloud Threat Detection and Modelling: Cloudtrail Mitre ATT&CK Mapping | |
| Longo | Applying Neural Topic Modeling to Detect Anomalous Permission Requests in Microsoft 365 Applications |
Legal Events
| Date | Code | Title | Description |
|---|---|---|---|
| PUAI | Public reference made under article 153(3) epc to a published international application that has entered the european phase |
Free format text: ORIGINAL CODE: 0009012 |
|
| STAA | Information on the status of an ep patent application or granted ep patent |
Free format text: STATUS: REQUEST FOR EXAMINATION WAS MADE |
|
| 17P | Request for examination filed |
Effective date: 20240604 |
|
| AK | Designated contracting states |
Kind code of ref document: A1 Designated state(s): AL AT BE BG CH CY CZ DE DK EE ES FI FR GB GR HR HU IE IS IT LI LT LU LV MC ME MK MT NL NO PL PT RO RS SE SI SK SM TR |
|
| GRAP | Despatch of communication of intention to grant a patent |
Free format text: ORIGINAL CODE: EPIDOSNIGR1 |
|
| STAA | Information on the status of an ep patent application or granted ep patent |
Free format text: STATUS: GRANT OF PATENT IS INTENDED |
|
| RIC1 | Information provided on ipc code assigned before grant |
Ipc: G06F 11/34 20060101AFI20250731BHEP Ipc: G06F 21/52 20130101ALI20250731BHEP Ipc: G06F 11/32 20060101ALN20250731BHEP Ipc: G06F 11/30 20060101ALN20250731BHEP |
|
| RIC1 | Information provided on ipc code assigned before grant |
Ipc: G06F 11/34 20060101AFI20250818BHEP Ipc: G06F 21/52 20130101ALI20250818BHEP Ipc: G06F 11/32 20060101ALN20250818BHEP Ipc: G06F 11/30 20060101ALN20250818BHEP |
|
| INTG | Intention to grant announced |
Effective date: 20250902 |
|
| RIN1 | Information on inventor provided before grant (corrected) |
Inventor name: ASHKENAZI, ADI Inventor name: ELYASHAR, AVIAD Inventor name: MIMRAN, DAVID Inventor name: ELOVICI, YUVAL Inventor name: SHABTAI, ASAF Inventor name: BRODT, OLEG Inventor name: LEHMAN, HEIKO |
|
| GRAS | Grant fee paid |
Free format text: ORIGINAL CODE: EPIDOSNIGR3 |
|
| GRAA | (expected) grant |
Free format text: ORIGINAL CODE: 0009210 |
|
| STAA | Information on the status of an ep patent application or granted ep patent |
Free format text: STATUS: THE PATENT HAS BEEN GRANTED |
|
| AK | Designated contracting states |
Kind code of ref document: B1 Designated state(s): AL AT BE BG CH CY CZ DE DK EE ES FI FR GB GR HR HU IE IS IT LI LT LU LV MC ME MK MT NL NO PL PT RO RS SE SI SK SM TR |
|
| REG | Reference to a national code |
Ref country code: CH Ref legal event code: F10 Free format text: ST27 STATUS EVENT CODE: U-0-0-F10-F00 (AS PROVIDED BY THE NATIONAL OFFICE) Effective date: 20260204 Ref country code: GB Ref legal event code: FG4D |
|
| REG | Reference to a national code |
Ref country code: DE Ref legal event code: R096 Ref document number: 602024002348 Country of ref document: DE |
|
| REG | Reference to a national code |
Ref country code: IE Ref legal event code: FG4D |
|
| PGFP | Annual fee paid to national office [announced via postgrant information from national office to epo] |
Ref country code: AT Payment date: 20260301 Year of fee payment: 3 |
|
| PGFP | Annual fee paid to national office [announced via postgrant information from national office to epo] |
Ref country code: FR Payment date: 20260330 Year of fee payment: 3 |
|
| REG | Reference to a national code |
Ref country code: NL Ref legal event code: MP Effective date: 20260204 |
|
| PG25 | Lapsed in a contracting state [announced via postgrant information from national office to epo] |
Ref country code: RS Free format text: LAPSE BECAUSE OF FAILURE TO SUBMIT A TRANSLATION OF THE DESCRIPTION OR TO PAY THE FEE WITHIN THE PRESCRIBED TIME-LIMIT Effective date: 20260504 |
|
| PG25 | Lapsed in a contracting state [announced via postgrant information from national office to epo] |
Ref country code: ES Free format text: LAPSE BECAUSE OF FAILURE TO SUBMIT A TRANSLATION OF THE DESCRIPTION OR TO PAY THE FEE WITHIN THE PRESCRIBED TIME-LIMIT Effective date: 20260204 |
|
| PG25 | Lapsed in a contracting state [announced via postgrant information from national office to epo] |
Ref country code: PL Free format text: LAPSE BECAUSE OF FAILURE TO SUBMIT A TRANSLATION OF THE DESCRIPTION OR TO PAY THE FEE WITHIN THE PRESCRIBED TIME-LIMIT Effective date: 20260204 |
|
| PG25 | Lapsed in a contracting state [announced via postgrant information from national office to epo] |
Ref country code: GR Free format text: LAPSE BECAUSE OF FAILURE TO SUBMIT A TRANSLATION OF THE DESCRIPTION OR TO PAY THE FEE WITHIN THE PRESCRIBED TIME-LIMIT Effective date: 20260505 |
|
| REG | Reference to a national code |
Ref country code: LT Ref legal event code: MG9D |
|
| PG25 | Lapsed in a contracting state [announced via postgrant information from national office to epo] |
Ref country code: LT Free format text: LAPSE BECAUSE OF FAILURE TO SUBMIT A TRANSLATION OF THE DESCRIPTION OR TO PAY THE FEE WITHIN THE PRESCRIBED TIME-LIMIT Effective date: 20260204 |
|
| PGFP | Annual fee paid to national office [announced via postgrant information from national office to epo] |
Ref country code: DE Payment date: 20260330 Year of fee payment: 3 |
|
| PG25 | Lapsed in a contracting state [announced via postgrant information from national office to epo] |
Ref country code: NO Free format text: LAPSE BECAUSE OF FAILURE TO SUBMIT A TRANSLATION OF THE DESCRIPTION OR TO PAY THE FEE WITHIN THE PRESCRIBED TIME-LIMIT Effective date: 20260504 |
|
| PG25 | Lapsed in a contracting state [announced via postgrant information from national office to epo] |
Ref country code: AT Free format text: LAPSE BECAUSE OF FAILURE TO SUBMIT A TRANSLATION OF THE DESCRIPTION OR TO PAY THE FEE WITHIN THE PRESCRIBED TIME-LIMIT Effective date: 20260204 Ref country code: FI Free format text: LAPSE BECAUSE OF FAILURE TO SUBMIT A TRANSLATION OF THE DESCRIPTION OR TO PAY THE FEE WITHIN THE PRESCRIBED TIME-LIMIT Effective date: 20260204 Ref country code: SE Free format text: LAPSE BECAUSE OF FAILURE TO SUBMIT A TRANSLATION OF THE DESCRIPTION OR TO PAY THE FEE WITHIN THE PRESCRIBED TIME-LIMIT Effective date: 20260204 |
|
| REG | Reference to a national code |
Ref country code: AT Ref legal event code: MK05 Ref document number: 1884417 Country of ref document: AT Kind code of ref document: T Effective date: 20260204 |
|
| PG25 | Lapsed in a contracting state [announced via postgrant information from national office to epo] |
Ref country code: HR Free format text: LAPSE BECAUSE OF FAILURE TO SUBMIT A TRANSLATION OF THE DESCRIPTION OR TO PAY THE FEE WITHIN THE PRESCRIBED TIME-LIMIT Effective date: 20260204 |
|
| PG25 | Lapsed in a contracting state [announced via postgrant information from national office to epo] |
Ref country code: IS Free format text: LAPSE BECAUSE OF FAILURE TO SUBMIT A TRANSLATION OF THE DESCRIPTION OR TO PAY THE FEE WITHIN THE PRESCRIBED TIME-LIMIT Effective date: 20260604 Ref country code: PT Free format text: LAPSE BECAUSE OF FAILURE TO SUBMIT A TRANSLATION OF THE DESCRIPTION OR TO PAY THE FEE WITHIN THE PRESCRIBED TIME-LIMIT Effective date: 20260605 |
|
| PG25 | Lapsed in a contracting state [announced via postgrant information from national office to epo] |
Ref country code: NL Free format text: LAPSE BECAUSE OF FAILURE TO SUBMIT A TRANSLATION OF THE DESCRIPTION OR TO PAY THE FEE WITHIN THE PRESCRIBED TIME-LIMIT Effective date: 20260204 |
|
| PG25 | Lapsed in a contracting state [announced via postgrant information from national office to epo] |
Ref country code: LV Free format text: LAPSE BECAUSE OF FAILURE TO SUBMIT A TRANSLATION OF THE DESCRIPTION OR TO PAY THE FEE WITHIN THE PRESCRIBED TIME-LIMIT Effective date: 20260204 |
|
| PG25 | Lapsed in a contracting state [announced via postgrant information from national office to epo] |
Ref country code: BG Free format text: LAPSE BECAUSE OF FAILURE TO SUBMIT A TRANSLATION OF THE DESCRIPTION OR TO PAY THE FEE WITHIN THE PRESCRIBED TIME-LIMIT Effective date: 20260204 |