EP4414445A1 - Cell image analysis system - Google Patents
Cell image analysis system Download PDFInfo
- Publication number
- EP4414445A1 EP4414445A1 EP22878144.9A EP22878144A EP4414445A1 EP 4414445 A1 EP4414445 A1 EP 4414445A1 EP 22878144 A EP22878144 A EP 22878144A EP 4414445 A1 EP4414445 A1 EP 4414445A1
- Authority
- EP
- European Patent Office
- Prior art keywords
- data tree
- graph
- data
- cell
- user
- Prior art date
- Legal status (The legal status is an assumption and is not a legal conclusion. Google has not performed a legal analysis and makes no representation as to the accuracy of the status listed.)
- Pending
Links
Images


Classifications
-
- G—PHYSICS
- G06—COMPUTING OR CALCULATING; COUNTING
- G06V—IMAGE OR VIDEO RECOGNITION OR UNDERSTANDING
- G06V20/00—Scenes; Scene-specific elements
- G06V20/60—Type of objects
- G06V20/69—Microscopic objects, e.g. biological cells or cellular parts
- G06V20/698—Matching; Classification
-
- G—PHYSICS
- G06—COMPUTING OR CALCULATING; COUNTING
- G06T—IMAGE DATA PROCESSING OR GENERATION, IN GENERAL
- G06T11/00—Two-dimensional [2D] image generation
- G06T11/20—Drawing from basic elements
- G06T11/26—Drawing of charts or graphs
-
- G—PHYSICS
- G06—COMPUTING OR CALCULATING; COUNTING
- G06V—IMAGE OR VIDEO RECOGNITION OR UNDERSTANDING
- G06V10/00—Arrangements for image or video recognition or understanding
- G06V10/94—Hardware or software architectures specially adapted for image or video understanding
- G06V10/945—User interactive design; Environments; Toolboxes
-
- G—PHYSICS
- G06—COMPUTING OR CALCULATING; COUNTING
- G06V—IMAGE OR VIDEO RECOGNITION OR UNDERSTANDING
- G06V20/00—Scenes; Scene-specific elements
- G06V20/60—Type of objects
- G06V20/69—Microscopic objects, e.g. biological cells or cellular parts
-
- G—PHYSICS
- G16—INFORMATION AND COMMUNICATION TECHNOLOGY [ICT] SPECIALLY ADAPTED FOR SPECIFIC APPLICATION FIELDS
- G16H—HEALTHCARE INFORMATICS, i.e. INFORMATION AND COMMUNICATION TECHNOLOGY [ICT] SPECIALLY ADAPTED FOR THE HANDLING OR PROCESSING OF MEDICAL OR HEALTHCARE DATA
- G16H30/00—ICT specially adapted for the handling or processing of medical images
- G16H30/40—ICT specially adapted for the handling or processing of medical images for processing medical images, e.g. editing
-
- G—PHYSICS
- G16—INFORMATION AND COMMUNICATION TECHNOLOGY [ICT] SPECIALLY ADAPTED FOR SPECIFIC APPLICATION FIELDS
- G16H—HEALTHCARE INFORMATICS, i.e. INFORMATION AND COMMUNICATION TECHNOLOGY [ICT] SPECIALLY ADAPTED FOR THE HANDLING OR PROCESSING OF MEDICAL OR HEALTHCARE DATA
- G16H50/00—ICT specially adapted for medical diagnosis, medical simulation or medical data mining; ICT specially adapted for detecting, monitoring or modelling epidemics or pandemics
- G16H50/20—ICT specially adapted for medical diagnosis, medical simulation or medical data mining; ICT specially adapted for detecting, monitoring or modelling epidemics or pandemics for computer-aided diagnosis, e.g. based on medical expert systems
-
- G—PHYSICS
- G16—INFORMATION AND COMMUNICATION TECHNOLOGY [ICT] SPECIALLY ADAPTED FOR SPECIFIC APPLICATION FIELDS
- G16H—HEALTHCARE INFORMATICS, i.e. INFORMATION AND COMMUNICATION TECHNOLOGY [ICT] SPECIALLY ADAPTED FOR THE HANDLING OR PROCESSING OF MEDICAL OR HEALTHCARE DATA
- G16H50/00—ICT specially adapted for medical diagnosis, medical simulation or medical data mining; ICT specially adapted for detecting, monitoring or modelling epidemics or pandemics
- G16H50/50—ICT specially adapted for medical diagnosis, medical simulation or medical data mining; ICT specially adapted for detecting, monitoring or modelling epidemics or pandemics for simulation or modelling of medical disorders
-
- C—CHEMISTRY; METALLURGY
- C12—BIOCHEMISTRY; BEER; SPIRITS; WINE; VINEGAR; MICROBIOLOGY; ENZYMOLOGY; MUTATION OR GENETIC ENGINEERING
- C12M—APPARATUS FOR ENZYMOLOGY OR MICROBIOLOGY; APPARATUS FOR CULTURING MICROORGANISMS FOR PRODUCING BIOMASS, FOR GROWING CELLS OR FOR OBTAINING FERMENTATION OR METABOLIC PRODUCTS, i.e. BIOREACTORS OR FERMENTERS
- C12M41/00—Means for regulation, monitoring, measurement or control, e.g. flow regulation
- C12M41/30—Means for regulation, monitoring, measurement or control, e.g. flow regulation of concentration
- C12M41/36—Means for regulation, monitoring, measurement or control, e.g. flow regulation of concentration of biomass, e.g. colony counters or by turbidity measurements
-
- G—PHYSICS
- G06—COMPUTING OR CALCULATING; COUNTING
- G06T—IMAGE DATA PROCESSING OR GENERATION, IN GENERAL
- G06T2207/00—Indexing scheme for image analysis or image enhancement
- G06T2207/10—Image acquisition modality
- G06T2207/10056—Microscopic image
-
- G—PHYSICS
- G06—COMPUTING OR CALCULATING; COUNTING
- G06T—IMAGE DATA PROCESSING OR GENERATION, IN GENERAL
- G06T2207/00—Indexing scheme for image analysis or image enhancement
- G06T2207/30—Subject of image; Context of image processing
- G06T2207/30004—Biomedical image processing
- G06T2207/30024—Cell structures in vitro; Tissue sections in vitro
Definitions
- the present invention relates to a cell image analysis system.
- the above Japanese Patent Laid-Open Publication No. JP 2021-64115 discloses a technique for analyzing a cell image captured by using a microscope. Specifically, the above Japanese Patent Laid-Open Publication No. JP 2021-64115 discloses calculation of an entire area of a cell from the cell image, and calculation of a ratio of the cell area to an entire area of the cell image captured.
- Patent Document 1 Japanese Patent Laid-Open Publication No. JP 2021-64115
- a data tree that classifies the cell images based on a hierarchical structure is created in some cases.
- graphs representing the analysis results of the cell images are created for the data tree in some cases.
- the cell analysis system can merely display the graphs for each data tree but data trees different from each other cannot be easily compared with each other. For this reason, it is desired to easily compare different data trees with each other in a case in which cell images are managed by using data trees.
- the present invention is intended to solve the above problem, and one object of the present invention is to provide a cell image analysis system capable of easily comparing different data trees with each other in a case in which cell images are managed by using data trees.
- a cell image analysis system includes a data tree creator configured to create a plurality of data trees relating to cell images by classifying the cell images into a plurality of groups each of which includes the cell images that have common classification information; a data tree storage configured to store the plurality of data trees created by the data tree creator, and a data tree storage area that stores the data trees created by the data tree creator; a graph creator configured to create a graph relating to a first data tree that is selected by a user, and having classification information of a bottom layer or a second layer from the bottom layer of the first data tree as a horizontal axis parameter and analysis results of the cell images that are included in the first data tree as a vertical axis parameter; and a display controller configured to display the graph created by the graph creator, wherein the display controller is configured to display a second data tree that is different from the first data tree and has common horizontal and vertical axis parameters to the first data tree in the plurality of data trees stored in the
- the graph is updated by adding the analysis results of the cell images that are included in the second data tree, which is different from the first data tree and has common horizontal and vertical axis parameters to the first data tree to the graph. Accordingly, it possible to display analysis results of the cell images that are included in the first data tree, and the analysis results of the cell images that are included in the second data tree, which is different from the first data tree and has common horizontal and vertical axis parameters to the first data tree on the same graph to compare them with each other. Consequently, it is possible to easily compare different data trees with each other in a case in which cell images are managed by using data trees.
- the graph is updated by adding the analysis results of the cell images that are included in the second data tree, which is different from the first data tree and has common horizontal and vertical axis parameters to the first data tree, as discussed above. Accordingly, because the graph is automatically updated when the second data tree is selected by the user, the user can easily compare the different data trees with each other without such an additional operation for adding the data of the second data tree to the first data tree.
- the graph is updated by adding the analysis results of the cell images that are included in the second data tree, which is different from the first data tree and has common horizontal and vertical axis parameters to the first data tree, to the graph as discussed above. Accordingly, because the graph is automatically updated when the second data tree is selected by the user, the user can easily compare the different data trees with each other without such an additional operation for appropriately aligning the vertical and horizontal axes of the graph.
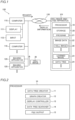
- the cell image analysis system 100 shown in FIG. 1 is a single system that allows users who cultivate cells, etc. integrally to capture cell images 30, to apply analysis processing to the cell images 30, and to peruse images to which the analysis processing is applied.
- the cell image analysis system 100 includes a cell image analysis apparatus 101, a computer 110, and an imaging apparatus 120.
- the cell image analysis system 100 shown in FIG. 1 is illustratively constructed of a client-server model.
- the computer 110 serves as a client terminal in the cell image analysis system 100.
- the cell image analysis apparatus 101 serves as a server in the cell image analysis system 100.
- the cell image analysis apparatus 101, the computer 110, and the imaging apparatus 120 are connected through a network 130, and can communicate with each other through the network.
- the cell image analysis apparatus 101 performs various types of information processing in response to requests (processing requests) from the computer 110 operated by users.
- the cell image analysis apparatus 101 is configured to apply analysis processing to the cell images 30 in response to request and to transmit images to which the analysis processing is applied to the computer 110.
- a graphical user interface (GUI) is displayed on a display 111 of the computer 110, and is configured to accept instructions provided to the cell image analysis apparatus 101 and to display analysis results analyzed by the cell image analysis apparatus 101 and images after the analysis.
- GUI graphical user interface
- the network 130 connects the cell image analysis apparatus 101, the computer 110, and the imaging apparatus 120 to each other so that they can communicate with each other.
- the network 130 can be LAN (Local Area Network) configured in the facility, for example.
- the network 130 can be the Internet, for example.
- the cell image analysis system 100 can be a system configured in a cloud computing form.
- the computer 110 is a so-called personal computer including a processor and a storage.
- the display 111 and an input 112 are connected to the computer 110.
- the display 111 is a liquid crystal display.
- the display 111 can be an electroluminescence display, a projector, or a head-mounted display.
- the input 112 is an input device including a computer mouse and a key-board.
- the input 112 can be a touch panel.
- the cell image analysis system 100 can include one or more computers 110.
- the Imaging apparatus 120 includes a microscope, and is configured to generate the cell images 30.
- the imaging apparatus 120 can send the generated cell images 30 to the computer 110 and/or the cell image analysis apparatus 101 through the network 130.
- the imaging apparatus 120 is configured to capture microscopic images of cells.
- the imaging apparatus 120 can use imaging methods such as bright-field observation, dark-field observation, phase contrast observation, differential interference observation, and the like for imaging.
- One or more of the imaging apparatuses 120 are used in accordance with imaging methods.
- the cell image analysis system 100 can include one or more imaging apparatuses 120.
- the cell image analysis apparatus 101 includes a processor 10, such as CPU (Central Processing Unit), FPGA (Field-Programmable Gate Array), and ASIC (Aplication Specific Integrated Circuit).
- the cell image analysis apparatus 101 is configured to perform arithmetic processing by using the processor 10 by executing a predetermined program 21.
- the cell image analysis apparatus 101 includes a storage 20.
- the storage 20 includes a non-volatile storage device.
- the non-volatile storage device is a hard disk drives, solid state drives, and the like.
- the storage 20 is configured to store various programs 21 to be executed by the processor 10.
- the storage 20 is configured to store image data 22.
- the image data 22 includes the cell images 30 captured by the Imaging apparatus 120, and various processed images generated by applying image processing to the cell images 30.
- the storage 20 stores a learned model 23 that has learned to acquire cell areas from the cell images 30.
- the storage 20 stores data trees 24 including the cell images 30 classified based on a hierarchical structure. The data trees 24 will be described later.
- the storage 20 is an example of a "data tree storage" in the claims.
- the cell image analysis apparatus 101 is configured to analyze the cell images 30 and to display analysis results in response to requests from the computer 110. In the analysis, the cell image analysis apparatus 101 acquires features based on the cell images 30. In the displaying of analysis results, the cell image analysis apparatus 101 generates display information such as a graph 50, which will be described later. The cell image analysis apparatus 101 transmits the display information generated to the computer 110. The computer 110 displays a screen display based on the display information on the display 111 when receiving the display information.
- the processor 10 of the cell image analysis apparatus 101 includes a data tree creator 11, a graph creator 12, and a display controller 13, a data tree searcher 14, and a file output 15 as function blocks.
- the processor 10 is configured to execute the program 21 stored in the storage 20 to serve as the data tree creator 11, the graph creator 12, and the display controller 13, the data tree searcher 14, and the file output 15.
- the data tree creator 11 is configured to create a plurality of data trees 24 relating to cell images 30 by classifying the cell images 30 into a plurality of groups each of which includes the cell images that have common classification information 40.
- a plurality of types of classification information 40 are associated with each cell image 30.
- the data tree creator 11 is configured to create the virtual data tree 24 having a hierarchical structure by grouping the cell images 30 based on the classification information 40 associated with the cell images 30.
- the data tree creator 11 is configured to create the virtual data tree 24 having a hierarchical structure by grouping the cell images in stages based on a sorting order (priority) specified for each of the plurality of types of classification information 40.
- the display controller 13 is configured to transmit the data tree 24 created by the data tree creator 11 to the computer 110 so as to display the data tree on the display 111.
- the data tree 24 is formed as the virtual data tree 24 having the hierarchical structure on a screen of the display 111.
- the imaging apparatus 120 (identification number of microscope) that captured the cell image 30, the phase contrast observation that captured the cell image 30, the number of passages of the cells, the number of cultivation days of the cells, and a well (well number) that is a recessed part in which the cells were cultivated are specified as the classification information 40.
- the sorting order is set as the order of the imaging apparatus 120 (identification number of microscope), the phase contrast observation, the number of passages, the cultivation days, and the well (well number).
- the data tree creator 11 creates a five-layer data tree 24 including the imaging apparatus 120 as the top layer, and the well as the bottom layer.
- One or more cell images 30 are assigned to each of "Well_1", “Well_2", and "Well_3" in the bottom layer.
- the data tree creator 11 is configured be able to change the sorting order (priority) of the classification information 40 included in the data tree 24. Specifically, the data tree creator 11 is configured to change the sorting order of the hierarchical structure of the data tree 24 by changing the sorting order of the classification information 40 on the screen of the display 111 in accordance with on an instruction input through the input 112 by a user. Also, the data tree creator 11 is configured to change the sorting order of the hierarchical structure of the data tree 24 to delete a part of the sorting order by deleting the part of the sorting order of the classification information 40 on the screen of the display 111 in accordance with on an instruction input through the input 112 by the user. Also, the display controller 13 is configured to display the changed data tree 24 on the display 111. Also, the data tree 24 created by the data tree creator 11 is stored in the storage 20 associated with the data tree being associated with a project and cultivation conditions relating to cell cultivation.
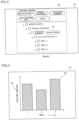
- the graph creator 12 is configured to create the graph 50 relating to a first data tree 24a that is selected from the plurality of data trees by the user, and having classification information 40 (in this case, "well") of the bottom layer the first data tree 24a as a horizontal axis parameter 51, and analysis results of the cell images 30 that are included in the first data tree 24a as a vertical axis parameter 52.
- the graph creator 12 is configured to create the graph 50 if an indication item 61 "Show the graph" on the screen of the display 111 is selected in accordance with an instruction input through the input 112 by the user.
- the display controller 13 is configured to transmit the graph 50 created by the graph creator 12 to the computer 110 so as to display the graph on the display 111.
- the horizontal axis parameter 51 is accessory information on cell cultivation or imaging.
- the horizontal axis parameter 51 is not specifically limited, but can be cultivation days, wells, passages, microscope, imaging method, microscope channels, cell type, cultivation medium, cell line, ground substance, inductor, oxygen concentration, carbon dioxide concentration, temperature, or the like, for example.
- the vertical axis parameter 52 corresponds to feature amounts acquired based on the cell images 30.
- the vertical axis parameter 52 is not specifically limited, but can be the number of cells, morphological information of the cells (length, roundness, radii, aspect ratios, etc.), a percentage of differentiated/undifferentiated cells, similarity of cell texture, area information of cells, or the like.
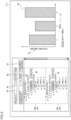
- the display controller 13 is configured to display a second data tree 24b that is different from the first data tree 24a and has the horizontal axis parameter 51 and the vertical axis parameter 52 that are common to the first data tree 24a in the plurality of data trees 24 stored in the storage 20 to be selectable by the user, and, when the second data tree 24b is selected by the user, to update the graph 50 by adding the analysis results of the cell images 30 that are included in the second data tree 24b selected by the user to the graph 50.
- the display controller 13 is configured to display comparative past cases (second data tree 24b) corresponding to the first data tree 24a to be selectable by the user, and to update the graph 50 to be able to compare analysis results of the cell images 30 that are included in the comparative past cases (second data tree 24b) selected by the user with the analysis results of the cell images 30 that are included in the first data tree 24a.
- the user can compare validities of tendencies of the analysis results between the data trees 24 having the same horizontal and vertical axis parameters 51 and 52, or can compare differences in the analysis results between the data trees, for example.
- the display controller 13 is configured to update the graph 50, if a plurality of (two in FIG. 6 ) second data trees 24b are selected by the user, by adding the analysis results of the cell images 30 that are included in the plurality of second data trees 24b selected by the user to the graph 50.
- the display controller 13 is configured to display, on the display 111, an indication item 62 "Compare” corresponding to an instruction of the user to add the analysis results of the cell images 30 that are included in the second data tree 24b to the graph 50.
- the graph creator 12 is configured to re-create the graph 50, if the indication item 62 "Compare” on the screen of the display 111 is selected in accordance with an instruction input through the input 112 by the user, by adding the analysis results of the cell images 30 that are included in the second data tree 24b selected by the user to the graph 50.
- the display controller 13 is configured to transmit the graph 50 re-created by the graph creator 12 to the computer 110 so as to update the graph 50 displayed on the display 111.
- the graph creator 12 is configured to re-create the graph 50, if an indication item 62 "Compare" corresponding to another second data tree 24b on the screen of the display 111 is selected in accordance with an instruction input through the input 112 by the user with the analysis results of the cell images 30 that are included in the second data tree 24b being added to the graph 50, by further adding the analysis results of the cell images 30 that are included in the second data tree 24b selected by the user to the graph 50.
- the display controller 13 is configured to transmit the graph 50 that is re-created by further adding the another second data tree 24b by the graph creator 12 to the computer 110 so as to update the graph 50 displayed on the display 111. The user can add analysis results of cell images 30 of any number of the second data trees 24b to the graph 50.
- the data tree searcher 14 is configured to search for the second data tree 24b in the plurality of data trees 24 stored in the storage 20.
- the display controller 13 is configured to display the second data tree 24b searched by the data tree searcher 14 so as to be selectable by the user. In this case, the display controller 13 is configured to display the second data tree 24b searched by the data tree searcher 14 in list form.
- the data tree searcher 14 is configured to be able to search for the second data tree 24b in the plurality of data trees 24 stored in the storage 20 with the project and the cultivation conditions relating to cell cultivation being specified as search criteria. Also, the display controller 13 is configured to display the second data tree 24b searched by the data tree searcher 14 with the search criteria being specified so as to be selectable by the user.
- the display controller 13 is configured to display, on the display 111, a pull-down indication item 63 for selecting a project type (project name), and a pull-down indication item 64 for selecting a cultivation condition type (cultivation condition name).
- the data tree searcher 14 is configured to search, if the project and cultivation condition are selected in the indication items 63 and 64 on the display screen of the display 111 in accordance with instructions input through the input 112 by the user, for the second data tree 24b corresponding to the project and cultivation condition selected. That is, the data tree searcher 14 is configured to search for the second data tree 24b associated with the project selected and with the cultivation condition selected, and having the horizontal axis parameter 51 and the vertical axis parameter 52 that are common to the first data tree 24a.
- the name of the project and the names of the cultivation conditions are previously specified by the user.
- the data tree searcher 14 searches for the second data tree 24b in the plurality of data trees 24 stored in the storage 20 with the project different from the first data tree 24a and the cultivation condition common to the first data tree being specified as the search criteria.
- the display controller 13 is configured to display the second data tree 24b that corresponds to the project different from the first data tree 24a and the cultivation condition common to the first data tree searched by the data tree searcher 14 with the project different from the first data tree 24a and the cultivation condition common to the first data tree being specified as the search criteria.
- the data tree searcher 14 searches for the second data tree 24b in the plurality of data trees 24 stored in the storage 20 with the project common to the first data tree 24a and the cultivation condition different from the first data tree being specified as the search criteria.
- the display controller 13 is configured to display the second data tree 24b that corresponds to the project common to the first data tree 24a and the cultivation condition different from the first data tree searched by the data tree searcher 14 with the project different from the first data tree 24a and the cultivation condition common to the first data tree being specified as the search criteria.
- the user can specify a project and a cultivation condition common to the first data tree 24a as search criteria, and can specify a project and a cultivation condition different from the first data tree 24a as search criteria.
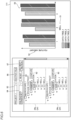
- the display controller 13 is configured to update the graph 50 by adding the analysis results of the cell images 30 that are included in the second data tree 24b selected by the user in a color different from the analysis results of the cell images 30 that are included in the first data tree 24a to the graph 50. For example, in a case in which the analysis results of the cell images 30 that are included in the first data tree 24a are displayed in red in the graph 50, the display controller 13 displays the analysis results of the cell images 30 that are included in the second data tree 24b in green, which is different from the red, in the graph 50.
- the display controller 13 is configured to update the graph 50 by further adding the analysis results of the cell images 30 that are included in the another second data tree 24b in a color different from the analysis results of the cell images 30 that are included in the first data tree 24a and the analysis results of the cell images 30 that are included in the second data tree 24b and have been added to the graph 50.
- the display controller 13 displays the analysis results of the cell images 30 that are included in the another second data tree 24b in blue, which is different from the red and the green, in the graph 50.
- the display controller 13 is configured to update the graph 50, when the user provides an instruction to delete the analysis results that are included in the second data tree 24b and have been added to the graph 50, by deleting the analysis results of the cell images 30 that are included in the second data tree 24b and have been added to the graph 50 from the graph 50.
- the display controller 13 is configured to display, on the display 111, an indication item 65 "Reset" corresponding to an instruction to delete the analysis results that are included in the second data tree 24b and have been added to the graph 50.
- the graph creator 12 is configured to re-create the graph 50, if the indication item 65 "Reset" on the screen of the display 111 is selected in accordance with an instruction input through the input 112 by the user, by deleting all the analysis results of the cell images 30 that are included in the second data tree 24b that have been added to the graph 50 from the graph 50.
- the graph creator 12 is configured to re-create the graph 50 by deleting all the analysis results of the cell images 30 that are included in the second data tree 24b that have been added to the graph 50 from the graph 50 so as to return the graph to an initial state (state shown in FIG. 5 ).
- the display controller 13 is configured to transmit the graph 50 re-created by the graph creator 12 to the computer 110 so as to update the graph 50 displayed on the display 111.
- the file output 15 is configured to output the cell images 30 that serve as a basis for the graph 50 including the added analysis results of the cell images 30 that are included in the second data tree 24b, and the graph 50 that includes the added analysis results of the cell images 30 that are included in the second data tree 24b as a CSV (Comma Separated Value) file 70, which includes values separated with commas.
- CSV Common Separated Value
- the file output 15 is configured to acquire the cell images 30 that serve as a basis for the graph 50 including the first data tree 24a and the cell image 30 that serve as a basis for the graph including the second data tree 24b, and the graph 50 as numerical data separated with commas, and to output the CSV file 70 including the cell images 30 and the graph 50 acquired as numerical data to the computer 110. Also, the file output 15 is configured to output the CSV file 70 to the computer 110 if an indication item 66 "Output File" on the screen of the display 111 is selected in accordance with an instruction input through the input 112 by the user.
- the file output 15 is configured to output the CSV file 70 with additional information including information on projects and cultivation conditions relating to cell cultivation.
- the additional information is not specifically limited, but can include project names, cultivation condition names, classification information 40 (microscope, phase contrast observation, number of passages, cultivation days, wells, etc.).
- the display controller 13 is configured to display a third data tree 24c that is different from the first data tree 24a and has the horizontal axis parameter 51, which is common to the first data tree 24a, and a vertical axis parameter 52 that is different from the first data tree in the plurality of data trees 24 stored in the storage 20 to be selectable by the user, and, when the third data tree 24c is selected by the user, to update the graph 50 by adding the analysis results of the cell images 30 that are included in the third data tree 24c selected by the user to the graph 50. Based on the updated graph 50, the user can check correlation of analysis results between data trees 24 having different vertical axis parameters 52.
- the display controller 13 is configured to display an indication item 68 "No Restriction" for allowing the user to select the third data tree 24c to display the third data tree on the display 111. Also, the display controller 13 is configured to, if the indication item 67 "No Restriction" on the display 111 is selected in accordance with an instruction input through the input 112 by the user, remove a restriction that restricts the search for the second data tree 24b within a condition that the second data tree has the horizontal axis parameter 51 and the vertical axis parameter 52 common to the first data tree 24a so as to display the plurality of data trees 24 stored in the storage 20 on the display 111 so as to be selectable by the user. The user can select the third data tree 24c that has the horizontal axis parameter 51 common to the first data tree 24a and the vertical axis parameter 52 different from the first data tree in the data trees 24 that are displayed on the display 111.
- the display controller 13 is configured to display, on the display 111, an indication item 68 "Compare” corresponding to an instruction of the user to add the analysis results of the cell images 30 that are included in the third data tree 24c to the graph 50.
- the graph creator 12 is configured to re-create the graph 50, if the indication item 68 "Compare” on the screen of the display 111 is selected in accordance with an instruction input through the input 112 by the user, by adding the analysis results of the cell images 30 that are included in the third data tree 24c selected by the user to the graph 50.
- the display controller 13 is configured to transmit the graph 50 re-created by the graph creator 12 to the computer 110 so as to update the graph 50 displayed on the display 111.
- the graph 50 updated has the vertical axis parameter 52 (aspect ratio in FIG. 8 ) of the first data tree 24a on a left side of the graph, and the vertical axis parameter 52 (number of cells in FIG. 8 ) of the third data tree 24c on a right side of the graph.
- the following description describes a control process for comparing data trees 24 with each other of the cell image analysis system 100 according to this embodiment with reference to FIG. 9 .
- step 201 the first data tree 24a that serves as a basis for the graph 50 is first selected in accordance with an instruction input through the input 112 by the user as shown in FIG. 9 .
- step 202 a hierarchical structure of the first data tree 24a is determined (changed) in accordance with an instruction input through the input 112 by the user.
- step 203 the graph creator 12 creates the graph 50 relating to the first data tree 24a, and the display controller 13 displays the graph 50 created by the graph creator 12 on the display 111.
- step 204 the data tree searcher 14 searches for the second data tree 24b, and the display controller 13 displays the second data tree 24b searched by the data tree searcher 14 on the display 111.
- step 205 the second data tree 24b to be added to the graph 50 is selected from the second data trees 24b that are displayed on the display 111 in accordance with an instruction input through the input 112 by the user.
- step 206 the graph creator 12 re-creates the graph 50 by adding the analysis results of the cell images 30 that are included in the second data tree 24b, the display controller 13 displays the graph 50 re-created by the graph creator 12 on the display 111 (updates the graph 50 on the display 111).
- step 207 it is determined by the user whether to further add another second data tree 24b. If it is determined by the user to further add another second data tree 24b in step 207, the procedure goes to step 205. Subsequently, the processes of steps 205 and 206 are executed. Also, if it is determined by the user to further add another second data tree 24b in step 207, the procedure goes to step 208.
- step 208 it is determined by the user whether to output the CSV file 70. If it is determined by the user to output the CSV file 70 in step 208, the procedure goes to step 209. Subsequently, in step 209, the file output 15 outputs the CSV file 70 including the cell images 30 that serve as a basis for the graph 50, and the numerical data of the graph 50 to the computer 110. Subsequently, the procedure goes to step 210. Also, if it is not determined by the user to output the CSV file 70 in step 208, the procedure goes to step 210 without executing the process of step 209.
- step 210 it is determined by the user whether to delete the second data tree 24b that has been added to the graph 50 and to return the graph to the initial state. Subsequently, it is determined by the user to delete the second data tree 24b that has been added to the graph 50 and to return the graph to the initial state in step 210, the procedure goes to step 203. Subsequently, the processes of steps 203 to 209 are appropriately executed. Also, if it is not determined by the user to delete the second data tree 24b that has been added to the graph 50 and to return the graph to the initial state, and an instruction to end the control process is input by the user, the control process ends.
- a cell image analysis system 100 includes a data tree creator 11 configured to create a plurality of data trees 24 relating to cell images 30 by classifying the cell images 30 into a plurality of groups each of which includes the cell images that have common classification information 40; a storage 20 configured to store the plurality of data trees 24 created by the data tree creator 11; a graph creator 12 configured to create a graph 50 relating to a first data tree 24a that is selected by a user, and having classification information 40 of a bottom layer of the first data tree 24a as a horizontal axis parameter 51 and analysis results of the cell images 30 that are included in the first data tree 24a as a vertical axis parameter 52; and a display controller 13 configured to display the graph 50 created by the graph creator 12, wherein the display controller 13 is configured to display a second data tree 24b that is different from the first data tree 24a and has the horizontal axis parameter 51 and the vertical axis parameter 52 that are common to the first data tree 24a in the plurality of data trees 24 stored in
- the graph 50 is updated by adding the analysis results of the cell images 30 that are included in the second data tree 24b, which is different from the first data tree 24a and has common horizontal and vertical axis parameters 51 and 52 to the first data tree 24a, to the graph 50 as described above. Accordingly, because the graph 50 is automatically updated when the second data tree 24b is selected by the user, the user can easily compare the different data trees 24 with each other without such an additional operation for adding the data of the second data tree 24b to the first data tree 24a.
- the graph 50 is updated by adding the analysis results of the cell images 30 that are included in the second data tree 24b, which is different from the first data tree 24a and has common horizontal and vertical axis parameters 51 and 52 to the first data tree 24a, to the graph 50 as described above. Accordingly, because the graph 50 is automatically updated when the second data tree 24b is selected by the user, the user can easily compare the different data trees 24 with each other without such an additional operation for appropriately aligning the vertical and horizontal axes of the graph 50.
- a data tree searcher 14 configured to search for the second data tree 24b in the plurality of data trees 24 stored in the storage 20 is further provided; and the display controller 13 is configured to display the second data tree 24b searched by the data tree searcher 14 so as to be selectable by the user. Accordingly, because the second data tree 24b searched by the data tree searcher 14 is shown to the user, the user can easily select the desired second data tree 24b.
- the data tree searcher 14 is configured to be able to search for the second data tree 24b in the plurality of data trees 24 stored in the storage 20 with the project and the cultivation conditions relating to cell cultivation being specified as search criteria; and the display controller 13 is configured to display the second data tree 24b searched by the data tree searcher 14 with the search criteria being specified so as to be selectable by the user. Accordingly, because the second data tree 24b searched by the data tree searcher 14 is shown to the user with the project and the cultivation conditions being specified as search criteria, the user can easily select the desired second data tree 24b.
- the data tree searcher 14 is configured to be able to search for the second data tree 24b in the plurality of data trees 24 stored in the storage 20 with a cultivation condition that is common to the first data tree 24a being specified as the search criterion; and the display controller 13 is configured to display the second data tree 24b, which corresponds to the cultivation condition that is common to the first data tree 24a, searched by the data tree searcher 14 with the cultivation condition that is common to the first data tree 24a being specified as the search criterion.
- the user can easily select the desired second data tree 24b corresponding to the cultivation condition that is common to the first data tree 24a, which is often desired for comparison by the user.
- the display controller 13 is configured to update the graph 50 by adding the analysis results of the cell images 30 that are included in the second data tree 24b selected by the user in a color different from the analysis results of the cell images 30 that are included in the first data tree 24a to the graph 50. Accordingly, because the user can easily visually distinguish between the analysis results of the cell images 30 that are included in the second data tree 24b and the analysis results of the cell images 30 that are included in the first data tree 24a, the user can easily compare the data trees 24 with each other.
- the display controller 13 is configured to update the graph 50, if the user provides an instruction to delete the analysis results that are included in the second data tree 24b and have been added to the graph 50, by deleting the analysis results of the cell images 30 that are included in the second data tree 24b and have been added to the graph 50 from the graph 50. Accordingly, if the analysis results of the cell images 30 that are included in the second data tree 24b and have been added to the graph 50 becomes unnecessary for comparison, the unnecessary analysis results of the cell images 30 that are included in the second data tree 24b can be deleted from the graph 50.
- the horizontal axis parameter 51 is accessory information on cell cultivation or imaging. Accordingly, because the horizontal axis parameter 51 is accessory information on cell cultivation or imaging, the horizontal axis parameter 51 can be appropriately specified.
- the vertical axis parameter 52 corresponds to feature amounts based on the cell images 30. Accordingly, because the vertical axis parameter 52 corresponds to feature amounts based on the cell images 30, the vertical axis parameter 52 can be appropriately specified.
- the data tree 24 is formed as a virtual data tree 24 having a hierarchical structure on a display screen. Accordingly, dissimilar to a case in which the data tree 24 is formed by forming a folder having a hierarchical structure, an additional complicated operation such as reformation of the folder is not required to change the hierarchical structure. Consequently, it is possible to manage the cell images 30 by using data trees 24 without such an additional complicated operation.
- the cell image analysis system 100 further includes a file output 15 configured to output the cell images 30 that serve as a basis for the graph 50 including the added analysis results of the cell images 30 that are included in the second data tree 24b, and the graph 50 that includes the added analysis results of the cell images 30 that are included in the second data tree 24b as a CSV file 70. Accordingly, because the cell images 30 and the graph 50 that form a comparison result can be output as the versatile CSV file 70, data of the comparison result (CSV file 70) can be easily edited and the data of the comparison result (CSV file 70) can be easily sent between users.
- the file output 15 is configured to output the CSV file 70 with additional information including information on at least one of a project and a cultivation condition relating to cell cultivation. Accordingly, the user can check the project and the cultivation condition only based on the CSV file 70 in operations using the CSV file 70. Consequently, it is possible to avoid an additional operation for checking the project and the cultivation condition by using a file other than the CSV file 70.
- the display controller 13 is configured to display a third data tree 24c that is different from the first data tree 24a and has the horizontal axis parameter 51, which is common to the first data tree 24a, and a vertical axis parameter 52 that is different from the first data tree in the plurality of data trees 24 stored in the storage 20 to be selectable by the user, and, when the third data tree 24c is selected by the user, to update the graph 50 by adding the analysis results of the cell images 30 that are included in the third data tree 24c selected by the user to the graph 50.
- cell image analysis apparatus can be constructed of an independent computer, for example, as shown in FIG. 10 .
- the cell image analysis apparatus 101 according to a modified embodiment of FIG. 10 includes a computer 300 including a processor 310 and a storage 320.
- a display 330 and an input 340 are connected to the computer 300.
- the computer 300 is connected to and can communicate with an imaging apparatus 120.
- the processor 310 of the computer 300 includes a data tree creator 11, a graph creator 12, and a display controller 13, a data tree searcher 14, and a file output 15, which are described in the aforementioned embodiment, as function blocks.
- the storage 320 is an example of the "data tree storage” in the claims.
- the present invention is not limited to this.
- a plurality of processors can share the aforementioned processes applied to the cell images in the present invention.
- each process can be executed by one of the processors.
- the plurality of processors can be included in independent computers.
- the cell image analysis apparatus can be constructed of a plurality of computers for executing image processing.
- the present invention is not limited to this.
- the cell image analysis system does not necessarily include the display.
- the processor can be configured to output display information to an external display.
- the graph creator configured to create a graph relating to a first data tree, and having classification information of a bottom layer of the first data tree as a horizontal axis parameter and analysis results of the cell images that are included in the first data tree as a vertical axis parameter.
- the graph creator can be configured to create a graph relating to the first data tree, and having classification information of a second layer from the bottom layer of the first data tree as a horizontal axis parameter and analysis results of the cell images that are included in the first data tree as a vertical axis parameter.
- the present invention is not limited to this.
- the cell image analysis system does not necessarily include the data tree searcher.
- the display controller can display data trees stored in the storage without searching so that the user can select the second data tree from the data trees displayed.
- the cell image analysis system includes the data tree searcher.
- the data tree searcher is configured to be able to search for the second data tree with the project and the cultivation condition being specified as search criteria
- the present invention is not limited to this.
- the data tree searcher can be configured to be able to search for the second data tree with one of the project and the cultivation condition being specified as a search criterion.
- the data tree searcher can be configured to be able to search for the second data tree with a condition other than the project and the cultivation conditions being specified as a search criterion.
- the present invention is not limited to this.
- the display controller can be configured to update the graph, if the user provides an instruction to delete the analysis results that are included in the second data tree and have been added to the graph, by deleting some (one selected by the user, latest added one, etc.) of the analysis results of the cell images that are included in the second data tree and have been added to the graph from the graph.
- the present invention is not limited to this.
- the cell image analysis system does not necessarily include the file output.
- the cell image analysis system includes the file output.
- the present invention is not limited to this.
- the data tree searcher can be configured to be able to search for the third data tree that has the horizontal axis parameter common to the first data tree and the vertical axis parameter different from the first data tree.
- the display controller can be configured to display the third data tree searched by the data tree searcher so as to be selectable by the user.
- the present invention is not limited to this.
- the display controller is not necessarily configured to display the third data tree so as to be selectable by the user as long as the first data tree is displayed so as to be selectable by the user.
- a cell image analysis system includes a data tree creator configured to create a plurality of data trees relating to cell images by classifying the cell images into a plurality of groups each of which includes the cell images that have common classification information; a data tree storage configured to store the plurality of data trees created by the data tree creator, and a data tree storage area that stores the data trees created by the data tree creator; a graph creator configured to create a graph relating to a first data tree that is selected by a user, and having classification information of a bottom layer or a second layer from the bottom layer of the first data tree as a horizontal axis parameter and analysis results of the cell images that are included in the first data tree as a vertical axis parameter; and a display controller configured to display the graph created by the graph creator, wherein the display controller is configured to display a second data tree that is different from the first data tree and has common horizontal and vertical axis parameters to the first data tree in the plurality of data trees stored in the data tree storage to be selectable by the user, and, when the second data tree
- a data tree searcher configured to search for the second data tree in the plurality of data trees stored in the data tree storage
- the display controller is configured to display the second data tree searched by the data tree searcher so as to be selectable by the user.
- the data tree searcher is configured to be able to search for the second data tree in the plurality of data trees stored in the data tree storage with at least one of a project and a cultivation condition relating to cell cultivation being specified as a search criterion; and the display controller is configured to display the second data tree searched by the data tree searcher with the search criterion being specified to be selectable by the user.
- the data tree searcher is configured to be able to search for the second data tree in the plurality of data trees stored in the data tree storage with a cultivation condition that is common to the first data tree being specified as the search criterion; and the display controller is configured to display the second data tree, which corresponds to the cultivation condition that is common to the first data tree, searched by the data tree searcher with the cultivation condition that is common to the first data tree being specified as the search criterion.
- the display controller is configured to update the graph by adding the analysis results of the cell images that are included in the second data tree selected by the user in a color different from the analysis results of the cell images that are included in the first data tree to the graph.
- the display controller is configured to update the graph, when the user provides an instruction to delete the analysis results that are included in the second data tree and have been added to the graph, by deleting the analysis results of the cell images that are included in the second data tree and have been added to the graph from the graph.
- the horizontal axis parameter is accessory information on cell cultivation or imaging.
- the vertical axis parameter corresponds to feature amounts based on the cell images.
- the data tree is formed as a virtual data tree having a hierarchical structure on a display screen.
- a file output configured to output the cell images that serve as a basis for the graph including the added analysis results of the cell images that are included in the second data tree, and the graph that includes the added analysis results of the cell images that are included in the second data tree as a CSV file is further provided.
- the file output is configured to output the CSV file with additional information including information on at least one of a project and a cultivation condition relating to cell cultivation.
- the display controller is configured to display a third data tree that is different from the first data tree and has a common horizontal axis parameter to the first data tree and a vertical axis parameter different from the first data tree in the plurality of data trees stored in the data tree storage to be selectable by the user, and, when the third data tree is selected by the user, to update the graph by adding the analysis results of the cell images that are included in the third data tree selected by the user to the graph.
Landscapes
- Engineering & Computer Science (AREA)
- Health & Medical Sciences (AREA)
- General Health & Medical Sciences (AREA)
- Public Health (AREA)
- Medical Informatics (AREA)
- Biomedical Technology (AREA)
- General Physics & Mathematics (AREA)
- Theoretical Computer Science (AREA)
- Physics & Mathematics (AREA)
- Epidemiology (AREA)
- Primary Health Care (AREA)
- Multimedia (AREA)
- Life Sciences & Earth Sciences (AREA)
- Radiology & Medical Imaging (AREA)
- Molecular Biology (AREA)
- Nuclear Medicine, Radiotherapy & Molecular Imaging (AREA)
- Data Mining & Analysis (AREA)
- Databases & Information Systems (AREA)
- Pathology (AREA)
- Software Systems (AREA)
- User Interface Of Digital Computer (AREA)
- Investigating Or Analysing Biological Materials (AREA)
- Apparatus Associated With Microorganisms And Enzymes (AREA)
Abstract
Description
- The present invention relates to a cell image analysis system.
- Techniques for analyzing a cell image are disclosed in the art. Such a technology is disclosed in Japanese Patent Laid-Open Publication No.
JP 2021-64115 - The above Japanese Patent Laid-Open Publication No.
JP 2021-64115 JP 2021-64115 - Patent Document 1: Japanese Patent Laid-Open Publication No.
JP 2021-64115 - Although not stated in the above Japanese Patent Laid-Open Publication No.
JP 2021-64115 - The present invention is intended to solve the above problem, and one object of the present invention is to provide a cell image analysis system capable of easily comparing different data trees with each other in a case in which cell images are managed by using data trees. Means for Solving the Problems
- In order to attain the aforementioned object, a cell image analysis system according to one aspect of the present invention includes a data tree creator configured to create a plurality of data trees relating to cell images by classifying the cell images into a plurality of groups each of which includes the cell images that have common classification information; a data tree storage configured to store the plurality of data trees created by the data tree creator, and a data tree storage area that stores the data trees created by the data tree creator; a graph creator configured to create a graph relating to a first data tree that is selected by a user, and having classification information of a bottom layer or a second layer from the bottom layer of the first data tree as a horizontal axis parameter and analysis results of the cell images that are included in the first data tree as a vertical axis parameter; and a display controller configured to display the graph created by the graph creator, wherein the display controller is configured to display a second data tree that is different from the first data tree and has common horizontal and vertical axis parameters to the first data tree in the plurality of data trees stored in the data tree storage to be selectable by the user, and, when the second data tree is selected by the user, to update the graph by adding the analysis results of the cell images that are included in the second data tree selected by the user to the graph.
- In the cell image analysis system according to the one aspect, the graph is updated by adding the analysis results of the cell images that are included in the second data tree, which is different from the first data tree and has common horizontal and vertical axis parameters to the first data tree to the graph. Accordingly, it possible to display analysis results of the cell images that are included in the first data tree, and the analysis results of the cell images that are included in the second data tree, which is different from the first data tree and has common horizontal and vertical axis parameters to the first data tree on the same graph to compare them with each other. Consequently, it is possible to easily compare different data trees with each other in a case in which cell images are managed by using data trees.
- Although it is conceivable that a user adds data of the second data tree to the first data tree and creates a new data tree in order to compare the different data trees, an additional operation is required for the user to add the data of the second data tree to the first data tree in such a case of new data tree creation. Contrary to this, the graph is updated by adding the analysis results of the cell images that are included in the second data tree, which is different from the first data tree and has common horizontal and vertical axis parameters to the first data tree, as discussed above. Accordingly, because the graph is automatically updated when the second data tree is selected by the user, the user can easily compare the different data trees with each other without such an additional operation for adding the data of the second data tree to the first data tree.
- Also, because the user necessarily appropriately aligns the vertical and horizontal axes of the graph when comparing the different data trees with each other, an additional operation is required for the user to appropriately align the vertical and horizontal axes of the graph in this case. Contrary to this, as discussed above, the graph is updated by adding the analysis results of the cell images that are included in the second data tree, which is different from the first data tree and has common horizontal and vertical axis parameters to the first data tree, to the graph as discussed above. Accordingly, because the graph is automatically updated when the second data tree is selected by the user, the user can easily compare the different data trees with each other without such an additional operation for appropriately aligning the vertical and horizontal axes of the graph.
-
-
FIG. 1 is a block diagram showing a cell image analysis system according to one embodiment. -
FIG. 2 is a functional block diagram showing a cell image analysis apparatus according to the one embodiment. -
FIG. 3 is a diagram illustrating a data tree of the cell image analysis apparatus according to the one embodiment. -
FIG. 4 is a diagram illustrating a graph relating to the data tree of the cell image analysis apparatus according to the one embodiment. -
FIG. 5 is a diagram illustrating a process for searching in the data tree of the cell image analysis apparatus according to the one embodiment. -
FIG. 6 is a diagram illustrating a process for updating in the graph of the cell image analysis apparatus according to the one embodiment. -
FIG. 7 is a diagram illustrating a process for outputting a CSV file of the cell image analysis apparatus according to the one embodiment. -
FIG. 8 is a diagram illustrating a process for comparing data trees having different vertical axis parameters with each other of the cell image analysis apparatus according to the one embodiment. -
FIG. 9 is a flowchart illustrating a control process for comparing data trees with each other of the cell image analysis apparatus according to the one embodiment. -
FIG. 10 is a block diagram showing a cell image analysis system according to a modified example of the one embodiment. - The embodiment of the present invention is described below based on the drawings.
- Refer to
FIGS. 1 to 9 to explain the structure of the cellimage analysis system 100 by one embodiment. Modes for Carrying Out the Invention - The cell
image analysis system 100 shown inFIG. 1 is a single system that allows users who cultivate cells, etc. integrally to capturecell images 30, to apply analysis processing to thecell images 30, and to peruse images to which the analysis processing is applied. - The cell
image analysis system 100 includes a cellimage analysis apparatus 101, acomputer 110, and animaging apparatus 120. - The cell
image analysis system 100 shown inFIG. 1 is illustratively constructed of a client-server model. Thecomputer 110 serves as a client terminal in the cellimage analysis system 100. The cellimage analysis apparatus 101 serves as a server in the cellimage analysis system 100. The cellimage analysis apparatus 101, thecomputer 110, and theimaging apparatus 120 are connected through anetwork 130, and can communicate with each other through the network. The cellimage analysis apparatus 101 performs various types of information processing in response to requests (processing requests) from thecomputer 110 operated by users. The cellimage analysis apparatus 101 is configured to apply analysis processing to thecell images 30 in response to request and to transmit images to which the analysis processing is applied to thecomputer 110. A graphical user interface (GUI) is displayed on adisplay 111 of thecomputer 110, and is configured to accept instructions provided to the cellimage analysis apparatus 101 and to display analysis results analyzed by the cellimage analysis apparatus 101 and images after the analysis. - The
network 130 connects the cellimage analysis apparatus 101, thecomputer 110, and theimaging apparatus 120 to each other so that they can communicate with each other. Thenetwork 130 can be LAN (Local Area Network) configured in the facility, for example. Thenetwork 130 can be the Internet, for example. In a case in which thenetwork 130 is the Internet, the cellimage analysis system 100 can be a system configured in a cloud computing form. - The
computer 110 is a so-called personal computer including a processor and a storage. Thedisplay 111 and aninput 112 are connected to thecomputer 110. For example, thedisplay 111 is a liquid crystal display. Alternatively, thedisplay 111 can be an electroluminescence display, a projector, or a head-mounted display. For example, theinput 112 is an input device including a computer mouse and a key-board. Alternatively, theinput 112 can be a touch panel. The cellimage analysis system 100 can include one ormore computers 110. - The
Imaging apparatus 120 includes a microscope, and is configured to generate thecell images 30. Theimaging apparatus 120 can send the generatedcell images 30 to thecomputer 110 and/or the cellimage analysis apparatus 101 through thenetwork 130. Theimaging apparatus 120 is configured to capture microscopic images of cells. Theimaging apparatus 120 can use imaging methods such as bright-field observation, dark-field observation, phase contrast observation, differential interference observation, and the like for imaging. One or more of theimaging apparatuses 120 are used in accordance with imaging methods. The cellimage analysis system 100 can include one ormore imaging apparatuses 120. - The cell
image analysis apparatus 101 includes aprocessor 10, such as CPU (Central Processing Unit), FPGA (Field-Programmable Gate Array), and ASIC (Aplication Specific Integrated Circuit). The cellimage analysis apparatus 101 is configured to perform arithmetic processing by using theprocessor 10 by executing apredetermined program 21. - The cell
image analysis apparatus 101 includes astorage 20. Thestorage 20 includes a non-volatile storage device. For example, the non-volatile storage device is a hard disk drives, solid state drives, and the like. Thestorage 20 is configured to storevarious programs 21 to be executed by theprocessor 10. Thestorage 20 is configured to storeimage data 22. Theimage data 22 includes thecell images 30 captured by theImaging apparatus 120, and various processed images generated by applying image processing to thecell images 30. Thestorage 20 stores a learnedmodel 23 that has learned to acquire cell areas from thecell images 30. Also, thestorage 20stores data trees 24 including thecell images 30 classified based on a hierarchical structure. Thedata trees 24 will be described later. Thestorage 20 is an example of a "data tree storage" in the claims. - The cell
image analysis apparatus 101 is configured to analyze thecell images 30 and to display analysis results in response to requests from thecomputer 110. In the analysis, the cellimage analysis apparatus 101 acquires features based on thecell images 30. In the displaying of analysis results, the cellimage analysis apparatus 101 generates display information such as agraph 50, which will be described later. The cellimage analysis apparatus 101 transmits the display information generated to thecomputer 110. Thecomputer 110 displays a screen display based on the display information on thedisplay 111 when receiving the display information. - As shown in
FIG. 2 , theprocessor 10 of the cellimage analysis apparatus 101 includes adata tree creator 11, agraph creator 12, and adisplay controller 13, adata tree searcher 14, and afile output 15 as function blocks. In other words, theprocessor 10 is configured to execute theprogram 21 stored in thestorage 20 to serve as thedata tree creator 11, thegraph creator 12, and thedisplay controller 13, thedata tree searcher 14, and thefile output 15. - As shown in
FIGS. 2 and3 , thedata tree creator 11 is configured to create a plurality ofdata trees 24 relating tocell images 30 by classifying thecell images 30 into a plurality of groups each of which includes the cell images that havecommon classification information 40. A plurality of types ofclassification information 40 are associated with eachcell image 30. Thedata tree creator 11 is configured to create thevirtual data tree 24 having a hierarchical structure by grouping thecell images 30 based on theclassification information 40 associated with thecell images 30. Also, thedata tree creator 11 is configured to create thevirtual data tree 24 having a hierarchical structure by grouping the cell images in stages based on a sorting order (priority) specified for each of the plurality of types ofclassification information 40. Also, thedisplay controller 13 is configured to transmit thedata tree 24 created by thedata tree creator 11 to thecomputer 110 so as to display the data tree on thedisplay 111. In this embodiment, thedata tree 24 is formed as thevirtual data tree 24 having the hierarchical structure on a screen of thedisplay 111. - In an exemplary screen shown in
FIG. 3 , the imaging apparatus 120 (identification number of microscope) that captured thecell image 30, the phase contrast observation that captured thecell image 30, the number of passages of the cells, the number of cultivation days of the cells, and a well (well number) that is a recessed part in which the cells were cultivated are specified as theclassification information 40. Also, the sorting order is set as the order of the imaging apparatus 120 (identification number of microscope), the phase contrast observation, the number of passages, the cultivation days, and the well (well number). In this case, thedata tree creator 11 creates a five-layer data tree 24 including theimaging apparatus 120 as the top layer, and the well as the bottom layer. One ormore cell images 30 are assigned to each of "Well_1", "Well_2", and "Well_3" in the bottom layer. - Also, the
data tree creator 11 is configured be able to change the sorting order (priority) of theclassification information 40 included in thedata tree 24. Specifically, thedata tree creator 11 is configured to change the sorting order of the hierarchical structure of thedata tree 24 by changing the sorting order of theclassification information 40 on the screen of thedisplay 111 in accordance with on an instruction input through theinput 112 by a user. Also, thedata tree creator 11 is configured to change the sorting order of the hierarchical structure of thedata tree 24 to delete a part of the sorting order by deleting the part of the sorting order of theclassification information 40 on the screen of thedisplay 111 in accordance with on an instruction input through theinput 112 by the user. Also, thedisplay controller 13 is configured to display the changeddata tree 24 on thedisplay 111. Also, thedata tree 24 created by thedata tree creator 11 is stored in thestorage 20 associated with the data tree being associated with a project and cultivation conditions relating to cell cultivation. - As shown in
FIGS. 2 to 4 , thegraph creator 12 is configured to create thegraph 50 relating to afirst data tree 24a that is selected from the plurality of data trees by the user, and having classification information 40 (in this case, "well") of the bottom layer thefirst data tree 24a as ahorizontal axis parameter 51, and analysis results of thecell images 30 that are included in thefirst data tree 24a as avertical axis parameter 52. Specifically, thegraph creator 12 is configured to create thegraph 50 if anindication item 61 "Show the graph" on the screen of thedisplay 111 is selected in accordance with an instruction input through theinput 112 by the user. Also, thedisplay controller 13 is configured to transmit thegraph 50 created by thegraph creator 12 to thecomputer 110 so as to display the graph on thedisplay 111. - In this embodiment, the
horizontal axis parameter 51 is accessory information on cell cultivation or imaging. Thehorizontal axis parameter 51 is not specifically limited, but can be cultivation days, wells, passages, microscope, imaging method, microscope channels, cell type, cultivation medium, cell line, ground substance, inductor, oxygen concentration, carbon dioxide concentration, temperature, or the like, for example. Thevertical axis parameter 52 corresponds to feature amounts acquired based on thecell images 30. Thevertical axis parameter 52 is not specifically limited, but can be the number of cells, morphological information of the cells (length, roundness, radii, aspect ratios, etc.), a percentage of differentiated/undifferentiated cells, similarity of cell texture, area information of cells, or the like. - In this embodiment, as shown in
FIGS. 5 and6 , thedisplay controller 13 is configured to display asecond data tree 24b that is different from thefirst data tree 24a and has thehorizontal axis parameter 51 and thevertical axis parameter 52 that are common to thefirst data tree 24a in the plurality ofdata trees 24 stored in thestorage 20 to be selectable by the user, and, when thesecond data tree 24b is selected by the user, to update thegraph 50 by adding the analysis results of thecell images 30 that are included in thesecond data tree 24b selected by the user to thegraph 50. - In other words, the
display controller 13 is configured to display comparative past cases (second data tree 24b) corresponding to thefirst data tree 24a to be selectable by the user, and to update thegraph 50 to be able to compare analysis results of thecell images 30 that are included in the comparative past cases (second data tree 24b) selected by the user with the analysis results of thecell images 30 that are included in thefirst data tree 24a. Based on the updatedgraph 50, the user can compare validities of tendencies of the analysis results between thedata trees 24 having the same horizontal andvertical axis parameters display controller 13 is configured to update thegraph 50, if a plurality of (two inFIG. 6 )second data trees 24b are selected by the user, by adding the analysis results of thecell images 30 that are included in the plurality ofsecond data trees 24b selected by the user to thegraph 50. - Specifically, the
display controller 13 is configured to display, on thedisplay 111, anindication item 62 "Compare" corresponding to an instruction of the user to add the analysis results of thecell images 30 that are included in thesecond data tree 24b to thegraph 50. Specifically, thegraph creator 12 is configured to re-create thegraph 50, if theindication item 62 "Compare" on the screen of thedisplay 111 is selected in accordance with an instruction input through theinput 112 by the user, by adding the analysis results of thecell images 30 that are included in thesecond data tree 24b selected by the user to thegraph 50. Also, thedisplay controller 13 is configured to transmit thegraph 50 re-created by thegraph creator 12 to thecomputer 110 so as to update thegraph 50 displayed on thedisplay 111. - Also, the
graph creator 12 is configured to re-create thegraph 50, if anindication item 62 "Compare" corresponding to anothersecond data tree 24b on the screen of thedisplay 111 is selected in accordance with an instruction input through theinput 112 by the user with the analysis results of thecell images 30 that are included in thesecond data tree 24b being added to thegraph 50, by further adding the analysis results of thecell images 30 that are included in thesecond data tree 24b selected by the user to thegraph 50. Also, thedisplay controller 13 is configured to transmit thegraph 50 that is re-created by further adding the anothersecond data tree 24b by thegraph creator 12 to thecomputer 110 so as to update thegraph 50 displayed on thedisplay 111. The user can add analysis results ofcell images 30 of any number of thesecond data trees 24b to thegraph 50. - In this embodiment, the
data tree searcher 14 is configured to search for thesecond data tree 24b in the plurality ofdata trees 24 stored in thestorage 20. Also, thedisplay controller 13 is configured to display thesecond data tree 24b searched by thedata tree searcher 14 so as to be selectable by the user. In this case, thedisplay controller 13 is configured to display thesecond data tree 24b searched by thedata tree searcher 14 in list form. - In this embodiment, the
data tree searcher 14 is configured to be able to search for thesecond data tree 24b in the plurality ofdata trees 24 stored in thestorage 20 with the project and the cultivation conditions relating to cell cultivation being specified as search criteria. Also, thedisplay controller 13 is configured to display thesecond data tree 24b searched by thedata tree searcher 14 with the search criteria being specified so as to be selectable by the user. - The
display controller 13 is configured to display, on thedisplay 111, a pull-down indication item 63 for selecting a project type (project name), and a pull-down indication item 64 for selecting a cultivation condition type (cultivation condition name). Also, thedata tree searcher 14 is configured to search, if the project and cultivation condition are selected in theindication items display 111 in accordance with instructions input through theinput 112 by the user, for thesecond data tree 24b corresponding to the project and cultivation condition selected. That is, thedata tree searcher 14 is configured to search for thesecond data tree 24b associated with the project selected and with the cultivation condition selected, and having thehorizontal axis parameter 51 and thevertical axis parameter 52 that are common to thefirst data tree 24a. The name of the project and the names of the cultivation conditions are previously specified by the user. - For example, a case in which the user specifies (selects) a project different from the
first data tree 24a and a cultivation condition common to the first data tree as the search criteria is considered. In this case, thedata tree searcher 14 searches for thesecond data tree 24b in the plurality ofdata trees 24 stored in thestorage 20 with the project different from thefirst data tree 24a and the cultivation condition common to the first data tree being specified as the search criteria. Also, thedisplay controller 13 is configured to display thesecond data tree 24b that corresponds to the project different from thefirst data tree 24a and the cultivation condition common to the first data tree searched by thedata tree searcher 14 with the project different from thefirst data tree 24a and the cultivation condition common to the first data tree being specified as the search criteria. - Also, for example, a case in which the user specifies (selects) a project common to the
first data tree 24a and a cultivation condition different from the first data tree as the search criteria is considered. In this case, thedata tree searcher 14 searches for thesecond data tree 24b in the plurality ofdata trees 24 stored in thestorage 20 with the project common to thefirst data tree 24a and the cultivation condition different from the first data tree being specified as the search criteria. Also, thedisplay controller 13 is configured to display thesecond data tree 24b that corresponds to the project common to thefirst data tree 24a and the cultivation condition different from the first data tree searched by thedata tree searcher 14 with the project different from thefirst data tree 24a and the cultivation condition common to the first data tree being specified as the search criteria. In addition, the user can specify a project and a cultivation condition common to thefirst data tree 24a as search criteria, and can specify a project and a cultivation condition different from thefirst data tree 24a as search criteria. - The
display controller 13 is configured to update thegraph 50 by adding the analysis results of thecell images 30 that are included in thesecond data tree 24b selected by the user in a color different from the analysis results of thecell images 30 that are included in thefirst data tree 24a to thegraph 50. For example, in a case in which the analysis results of thecell images 30 that are included in thefirst data tree 24a are displayed in red in thegraph 50, thedisplay controller 13 displays the analysis results of thecell images 30 that are included in thesecond data tree 24b in green, which is different from the red, in thegraph 50. - Also, in a case in which, after the analysis results of the
cell images 30 that are included in thesecond data tree 24b have been added to thegraph 50, analysis results of thecell images 30 that are included in anothersecond data tree 24b are further added to thegraph 50, thedisplay controller 13 is configured to update thegraph 50 by further adding the analysis results of thecell images 30 that are included in the anothersecond data tree 24b in a color different from the analysis results of thecell images 30 that are included in thefirst data tree 24a and the analysis results of thecell images 30 that are included in thesecond data tree 24b and have been added to thegraph 50. For example, in a case in which the analysis results of thecell images 30 that are included in thefirst data tree 24a are displayed in red and the analysis results of thecell images 30 that are included in thesecond data tree 24b and have been added are displayed in green in thegraph 50, thedisplay controller 13 displays the analysis results of thecell images 30 that are included in the anothersecond data tree 24b in blue, which is different from the red and the green, in thegraph 50. - In this embodiment, the
display controller 13 is configured to update thegraph 50, when the user provides an instruction to delete the analysis results that are included in thesecond data tree 24b and have been added to thegraph 50, by deleting the analysis results of thecell images 30 that are included in thesecond data tree 24b and have been added to thegraph 50 from thegraph 50. Specifically, thedisplay controller 13 is configured to display, on thedisplay 111, anindication item 65 "Reset" corresponding to an instruction to delete the analysis results that are included in thesecond data tree 24b and have been added to thegraph 50. Also, thegraph creator 12 is configured to re-create thegraph 50, if theindication item 65 "Reset" on the screen of thedisplay 111 is selected in accordance with an instruction input through theinput 112 by the user, by deleting all the analysis results of thecell images 30 that are included in thesecond data tree 24b that have been added to thegraph 50 from thegraph 50. In other words, thegraph creator 12 is configured to re-create thegraph 50 by deleting all the analysis results of thecell images 30 that are included in thesecond data tree 24b that have been added to thegraph 50 from thegraph 50 so as to return the graph to an initial state (state shown inFIG. 5 ). Also, thedisplay controller 13 is configured to transmit thegraph 50 re-created by thegraph creator 12 to thecomputer 110 so as to update thegraph 50 displayed on thedisplay 111. - In this embodiment, as shown in
FIG. 7 , thefile output 15 is configured to output thecell images 30 that serve as a basis for thegraph 50 including the added analysis results of thecell images 30 that are included in thesecond data tree 24b, and thegraph 50 that includes the added analysis results of thecell images 30 that are included in thesecond data tree 24b as a CSV (Comma Separated Value)file 70, which includes values separated with commas. In other words, thefile output 15 is configured to acquire thecell images 30 that serve as a basis for thegraph 50 including thefirst data tree 24a and thecell image 30 that serve as a basis for the graph including thesecond data tree 24b, and thegraph 50 as numerical data separated with commas, and to output theCSV file 70 including thecell images 30 and thegraph 50 acquired as numerical data to thecomputer 110. Also, thefile output 15 is configured to output theCSV file 70 to thecomputer 110 if anindication item 66 "Output File" on the screen of thedisplay 111 is selected in accordance with an instruction input through theinput 112 by the user. - In this embodiment, the
file output 15 is configured to output theCSV file 70 with additional information including information on projects and cultivation conditions relating to cell cultivation. The additional information is not specifically limited, but can include project names, cultivation condition names, classification information 40 (microscope, phase contrast observation, number of passages, cultivation days, wells, etc.). - In this embodiment, as shown in
FIG. 8 , thedisplay controller 13 is configured to display athird data tree 24c that is different from thefirst data tree 24a and has thehorizontal axis parameter 51, which is common to thefirst data tree 24a, and avertical axis parameter 52 that is different from the first data tree in the plurality ofdata trees 24 stored in thestorage 20 to be selectable by the user, and, when thethird data tree 24c is selected by the user, to update thegraph 50 by adding the analysis results of thecell images 30 that are included in thethird data tree 24c selected by the user to thegraph 50. Based on the updatedgraph 50, the user can check correlation of analysis results betweendata trees 24 having differentvertical axis parameters 52. - Specifically, the
display controller 13 is configured to display anindication item 68 "No Restriction" for allowing the user to select thethird data tree 24c to display the third data tree on thedisplay 111. Also, thedisplay controller 13 is configured to, if theindication item 67 "No Restriction" on thedisplay 111 is selected in accordance with an instruction input through theinput 112 by the user, remove a restriction that restricts the search for thesecond data tree 24b within a condition that the second data tree has thehorizontal axis parameter 51 and thevertical axis parameter 52 common to thefirst data tree 24a so as to display the plurality ofdata trees 24 stored in thestorage 20 on thedisplay 111 so as to be selectable by the user. The user can select thethird data tree 24c that has thehorizontal axis parameter 51 common to thefirst data tree 24a and thevertical axis parameter 52 different from the first data tree in thedata trees 24 that are displayed on thedisplay 111. - Also, the
display controller 13 is configured to display, on thedisplay 111, anindication item 68 "Compare" corresponding to an instruction of the user to add the analysis results of thecell images 30 that are included in thethird data tree 24c to thegraph 50. Specifically, thegraph creator 12 is configured to re-create thegraph 50, if theindication item 68 "Compare" on the screen of thedisplay 111 is selected in accordance with an instruction input through theinput 112 by the user, by adding the analysis results of thecell images 30 that are included in thethird data tree 24c selected by the user to thegraph 50. Also, thedisplay controller 13 is configured to transmit thegraph 50 re-created by thegraph creator 12 to thecomputer 110 so as to update thegraph 50 displayed on thedisplay 111. For example, thegraph 50 updated has the vertical axis parameter 52 (aspect ratio inFIG. 8 ) of thefirst data tree 24a on a left side of the graph, and the vertical axis parameter 52 (number of cells inFIG. 8 ) of thethird data tree 24c on a right side of the graph. - The following description describes a control process for comparing
data trees 24 with each other of the cellimage analysis system 100 according to this embodiment with reference toFIG. 9 . - In
step 201, thefirst data tree 24a that serves as a basis for thegraph 50 is first selected in accordance with an instruction input through theinput 112 by the user as shown inFIG. 9 . Subsequently, instep 202, a hierarchical structure of thefirst data tree 24a is determined (changed) in accordance with an instruction input through theinput 112 by the user. Subsequently, instep 203, thegraph creator 12 creates thegraph 50 relating to thefirst data tree 24a, and thedisplay controller 13 displays thegraph 50 created by thegraph creator 12 on thedisplay 111. - Subsequently, in
step 204, thedata tree searcher 14 searches for thesecond data tree 24b, and thedisplay controller 13 displays thesecond data tree 24b searched by thedata tree searcher 14 on thedisplay 111. Subsequently, instep 205, thesecond data tree 24b to be added to thegraph 50 is selected from thesecond data trees 24b that are displayed on thedisplay 111 in accordance with an instruction input through theinput 112 by the user. Subsequently, instep 206, thegraph creator 12 re-creates thegraph 50 by adding the analysis results of thecell images 30 that are included in thesecond data tree 24b, thedisplay controller 13 displays thegraph 50 re-created by thegraph creator 12 on the display 111 (updates thegraph 50 on the display 111). - Subsequently, in
step 207, it is determined by the user whether to further add anothersecond data tree 24b. If it is determined by the user to further add anothersecond data tree 24b instep 207, the procedure goes to step 205. Subsequently, the processes ofsteps second data tree 24b instep 207, the procedure goes to step 208. - Subsequently, in
step 208, it is determined by the user whether to output theCSV file 70. If it is determined by the user to output theCSV file 70 instep 208, the procedure goes to step 209. Subsequently, instep 209, thefile output 15 outputs theCSV file 70 including thecell images 30 that serve as a basis for thegraph 50, and the numerical data of thegraph 50 to thecomputer 110. Subsequently, the procedure goes to step 210. Also, if it is not determined by the user to output theCSV file 70 instep 208, the procedure goes to step 210 without executing the process ofstep 209. - Subsequently, in
step 210, it is determined by the user whether to delete thesecond data tree 24b that has been added to thegraph 50 and to return the graph to the initial state. Subsequently, it is determined by the user to delete thesecond data tree 24b that has been added to thegraph 50 and to return the graph to the initial state instep 210, the procedure goes to step 203. Subsequently, the processes ofsteps 203 to 209 are appropriately executed. Also, if it is not determined by the user to delete thesecond data tree 24b that has been added to thegraph 50 and to return the graph to the initial state, and an instruction to end the control process is input by the user, the control process ends. - In this embodiment, the following advantages are obtained.
- In this embodiment, as described above, a cell image analysis system 100 includes a data tree creator 11 configured to create a plurality of data trees 24 relating to cell images 30 by classifying the cell images 30 into a plurality of groups each of which includes the cell images that have common classification information 40; a storage 20 configured to store the plurality of data trees 24 created by the data tree creator 11; a graph creator 12 configured to create a graph 50 relating to a first data tree 24a that is selected by a user, and having classification information 40 of a bottom layer of the first data tree 24a as a horizontal axis parameter 51 and analysis results of the cell images 30 that are included in the first data tree 24a as a vertical axis parameter 52; and a display controller 13 configured to display the graph 50 created by the graph creator 12, wherein the display controller 13 is configured to display a second data tree 24b that is different from the first data tree 24a and has the horizontal axis parameter 51 and the vertical axis parameter 52 that are common to the first data tree 24a in the plurality of data trees 24 stored in the storage 20 to be selectable by the user, and, when the second data tree 24b is selected by the user, to update the graph 50 by adding the analysis results of the cell images 30 that are included in the second data tree 24b selected by the user to the graph 50.
- Accordingly, it possible to display analysis results of the
cell images 30 that are included in thefirst data tree 24a, and the analysis results of thecell images 30 that are included in thesecond data tree 24b, which is different from thefirst data tree 24a and has common horizontal andvertical axis parameters first data tree 24a on thesame graph 50 to compare them with each other. Consequently, it is possible to easily comparedifferent data trees 24 with each other in a case in whichcell images 30 are managed by usingdata trees 24. - Although it is conceivable that a user adds data of the
second data tree 24b to thefirst data tree 24a and creates anew data tree 24 in order to compare thedifferent data trees 24, an additional operation is required for the user to add the data of thesecond data tree 24b to thefirst data tree 24a in such a case of new data tree creation. Contrary to this, thegraph 50 is updated by adding the analysis results of thecell images 30 that are included in thesecond data tree 24b, which is different from thefirst data tree 24a and has common horizontal andvertical axis parameters first data tree 24a, to thegraph 50 as described above. Accordingly, because thegraph 50 is automatically updated when thesecond data tree 24b is selected by the user, the user can easily compare thedifferent data trees 24 with each other without such an additional operation for adding the data of thesecond data tree 24b to thefirst data tree 24a. - Also, because the user necessarily appropriately aligns the vertical and horizontal axes of the
graph 50 when comparing thedifferent data trees 24 with each other, an additional operation is required for the user to appropriately align the vertical and horizontal axes of thegraph 50 in this case. Contrary to this, thegraph 50 is updated by adding the analysis results of thecell images 30 that are included in thesecond data tree 24b, which is different from thefirst data tree 24a and has common horizontal andvertical axis parameters first data tree 24a, to thegraph 50 as described above. Accordingly, because thegraph 50 is automatically updated when thesecond data tree 24b is selected by the user, the user can easily compare thedifferent data trees 24 with each other without such an additional operation for appropriately aligning the vertical and horizontal axes of thegraph 50. - In addition, following additional advantages can be obtained by the aforementioned embodiment added with configurations discussed below.
- That is, in the cell
image analysis system 100 according to this embodiment, as discussed above, adata tree searcher 14 configured to search for thesecond data tree 24b in the plurality ofdata trees 24 stored in thestorage 20 is further provided; and thedisplay controller 13 is configured to display thesecond data tree 24b searched by thedata tree searcher 14 so as to be selectable by the user. Accordingly, because thesecond data tree 24b searched by thedata tree searcher 14 is shown to the user, the user can easily select the desiredsecond data tree 24b. - In this embodiment, as described above, the
data tree searcher 14 is configured to be able to search for thesecond data tree 24b in the plurality ofdata trees 24 stored in thestorage 20 with the project and the cultivation conditions relating to cell cultivation being specified as search criteria; and thedisplay controller 13 is configured to display thesecond data tree 24b searched by thedata tree searcher 14 with the search criteria being specified so as to be selectable by the user. Accordingly, because thesecond data tree 24b searched by thedata tree searcher 14 is shown to the user with the project and the cultivation conditions being specified as search criteria, the user can easily select the desiredsecond data tree 24b. - In this embodiment, as described above, the
data tree searcher 14 is configured to be able to search for thesecond data tree 24b in the plurality ofdata trees 24 stored in thestorage 20 with a cultivation condition that is common to thefirst data tree 24a being specified as the search criterion; and thedisplay controller 13 is configured to display thesecond data tree 24b, which corresponds to the cultivation condition that is common to thefirst data tree 24a, searched by thedata tree searcher 14 with the cultivation condition that is common to thefirst data tree 24a being specified as the search criterion. Accordingly, because thesecond data tree 24b that is searched by thedata tree searcher 14 with the project and the cultivation conditions common to thefirst data tree 24a being specified as search criteria, and corresponds to the cultivation condition that is common to thefirst data tree 24a is shown, the user can easily select the desiredsecond data tree 24b corresponding to the cultivation condition that is common to thefirst data tree 24a, which is often desired for comparison by the user. - In this embodiment, as described above, the
display controller 13 is configured to update thegraph 50 by adding the analysis results of thecell images 30 that are included in thesecond data tree 24b selected by the user in a color different from the analysis results of thecell images 30 that are included in thefirst data tree 24a to thegraph 50. Accordingly, because the user can easily visually distinguish between the analysis results of thecell images 30 that are included in thesecond data tree 24b and the analysis results of thecell images 30 that are included in thefirst data tree 24a, the user can easily compare thedata trees 24 with each other. - In this embodiment, as described above, the
display controller 13 is configured to update thegraph 50, if the user provides an instruction to delete the analysis results that are included in thesecond data tree 24b and have been added to thegraph 50, by deleting the analysis results of thecell images 30 that are included in thesecond data tree 24b and have been added to thegraph 50 from thegraph 50. Accordingly, if the analysis results of thecell images 30 that are included in thesecond data tree 24b and have been added to thegraph 50 becomes unnecessary for comparison, the unnecessary analysis results of thecell images 30 that are included in thesecond data tree 24b can be deleted from thegraph 50. - In this embodiment, as described above, the
horizontal axis parameter 51 is accessory information on cell cultivation or imaging. Accordingly, because thehorizontal axis parameter 51 is accessory information on cell cultivation or imaging, thehorizontal axis parameter 51 can be appropriately specified. - In this embodiment, as described above, the
vertical axis parameter 52 corresponds to feature amounts based on thecell images 30. Accordingly, because thevertical axis parameter 52 corresponds to feature amounts based on thecell images 30, thevertical axis parameter 52 can be appropriately specified. - In this embodiment, as described above, the
data tree 24 is formed as avirtual data tree 24 having a hierarchical structure on a display screen. Accordingly, dissimilar to a case in which thedata tree 24 is formed by forming a folder having a hierarchical structure, an additional complicated operation such as reformation of the folder is not required to change the hierarchical structure. Consequently, it is possible to manage thecell images 30 by usingdata trees 24 without such an additional complicated operation. - In this embodiment, as discussed above, the cell
image analysis system 100 further includes afile output 15 configured to output thecell images 30 that serve as a basis for thegraph 50 including the added analysis results of thecell images 30 that are included in thesecond data tree 24b, and thegraph 50 that includes the added analysis results of thecell images 30 that are included in thesecond data tree 24b as aCSV file 70. Accordingly, because thecell images 30 and thegraph 50 that form a comparison result can be output as theversatile CSV file 70, data of the comparison result (CSV file 70) can be easily edited and the data of the comparison result (CSV file 70) can be easily sent between users. - In this embodiment, as discussed above, the
file output 15 is configured to output theCSV file 70 with additional information including information on at least one of a project and a cultivation condition relating to cell cultivation. Accordingly, the user can check the project and the cultivation condition only based on theCSV file 70 in operations using theCSV file 70. Consequently, it is possible to avoid an additional operation for checking the project and the cultivation condition by using a file other than theCSV file 70. - In this embodiment, as discussed above, the
display controller 13 is configured to display athird data tree 24c that is different from thefirst data tree 24a and has thehorizontal axis parameter 51, which is common to thefirst data tree 24a, and avertical axis parameter 52 that is different from the first data tree in the plurality ofdata trees 24 stored in thestorage 20 to be selectable by the user, and, when thethird data tree 24c is selected by the user, to update thegraph 50 by adding the analysis results of thecell images 30 that are included in thethird data tree 24c selected by the user to thegraph 50. Accordingly, it is possible to display not only the data trees 24 (first data tree 24a andsecond data tree 24b) that have the samevertical axis parameter 52 but also the data trees 24 (first data tree 24a andthird data tree 24c) that have differentvertical axis parameter 52 on thesame graph 50 to be compared with each other. Consequently, it is possible to improve a degree of freedom of comparison between the analysis results of thecell images 30 for the user. - Note that the embodiment disclosed this time must be considered as illustrative in all points and not restrictive. The scope of the present invention is not shown by the above description of the embodiments but by the scope of claims for patent, and all modifications (modified embodiments) within the meaning and scope equivalent to the scope of claims for patent are further included.
- While the example in which the cell image analysis apparatus serves as a server in the cell image analysis system constructed of a client-server model has been shown in the aforementioned embodiment, the present invention is not limited to this. In the present invention, cell image analysis apparatus can be constructed of an independent computer, for example, as shown in
FIG. 10 . The cellimage analysis apparatus 101 according to a modified embodiment ofFIG. 10 includes acomputer 300 including aprocessor 310 and astorage 320. Adisplay 330 and aninput 340 are connected to thecomputer 300. Thecomputer 300 is connected to and can communicate with animaging apparatus 120. Theprocessor 310 of thecomputer 300 includes adata tree creator 11, agraph creator 12, and adisplay controller 13, adata tree searcher 14, and afile output 15, which are described in the aforementioned embodiment, as function blocks. Thestorage 320 is an example of the "data tree storage" in the claims. - While the example in which the single processor is configured to execute all functions (functions of the data tree creator, the graph creator, the display controller, the data tree searcher, and the file output) has been shown in the aforementioned embodiment and in the modified embodiment shown in
FIG. 10 , the present invention is not limited to this. Alternatively, a plurality of processors can share the aforementioned processes applied to the cell images in the present invention. Alternatively, each process can be executed by one of the processors. The plurality of processors can be included in independent computers. In other words, the cell image analysis apparatus can be constructed of a plurality of computers for executing image processing. - While the example in which the cell image analysis system includes the display has been shown in the aforementioned embodiment, the present invention is not limited to this. For example, the cell image analysis system does not necessarily include the display. In a case in which the cell image analysis system does not include the display, the processor can be configured to output display information to an external display.
- While the example in which the graph creator configured to create a graph relating to a first data tree, and having classification information of a bottom layer of the first data tree as a horizontal axis parameter and analysis results of the cell images that are included in the first data tree as a vertical axis parameter has been shown in the aforementioned embodiment, the present invention is not limited to this. For example, alternatively, the graph creator can be configured to create a graph relating to the first data tree, and having classification information of a second layer from the bottom layer of the first data tree as a horizontal axis parameter and analysis results of the cell images that are included in the first data tree as a vertical axis parameter.
- While the example in which the cell image analysis system (cell image analysis apparatus) includes the data tree searcher has been shown in the aforementioned embodiment, the present invention is not limited to this. For example, the cell image analysis system (cell image analysis apparatus) does not necessarily include the data tree searcher. In this case, the display controller can display data trees stored in the storage without searching so that the user can select the second data tree from the data trees displayed. However, from the viewpoint of user convenience, it is preferable that the cell image analysis system (cell image analysis device) include the data tree searcher.
- While the example in which the data tree searcher is configured to be able to search for the second data tree with the project and the cultivation condition being specified as search criteria has been shown in the aforementioned embodiment, the present invention is not limited to this. In the present invention, alternatively, the data tree searcher can be configured to be able to search for the second data tree with one of the project and the cultivation condition being specified as a search criterion. Alternatively, the data tree searcher can be configured to be able to search for the second data tree with a condition other than the project and the cultivation conditions being specified as a search criterion.
- While the example in which the display controller is configured to update the graph, if the user provides an instruction to delete the analysis results that are included in the second data tree and have been added to the graph, by deleting all the analysis results of the cell images that are included in the second data tree and have been added to the graph from the graph has been shown in the aforementioned embodiment, the present invention is not limited to this. In the present invention, alternatively, the display controller can be configured to update the graph, if the user provides an instruction to delete the analysis results that are included in the second data tree and have been added to the graph, by deleting some (one selected by the user, latest added one, etc.) of the analysis results of the cell images that are included in the second data tree and have been added to the graph from the graph.
- While the example in which the cell image analysis system (cell image analysis apparatus) includes the file output has been shown in the aforementioned embodiment, the present invention is not limited to this. For example, the cell image analysis system (cell image analysis apparatus) does not necessarily include the file output. However, from the viewpoint of user convenience, it is preferable that the cell image analysis system (cell image analysis device) include the file output.
- While the example in which the display controller is configured to display a plurality of data trees stored in the storage so that the user can select the third data tree has been shown in the aforementioned embodiment, the present invention is not limited to this. For example, alternatively, the data tree searcher can be configured to be able to search for the third data tree that has the horizontal axis parameter common to the first data tree and the vertical axis parameter different from the first data tree. In this case, the display controller can be configured to display the third data tree searched by the data tree searcher so as to be selectable by the user.
- While the example in which the display controller is configured to display the third data tree so as to be selectable by the user has been shown in the aforementioned embodiment, the present invention is not limited to this. In the present invention, the display controller is not necessarily configured to display the third data tree so as to be selectable by the user as long as the first data tree is displayed so as to be selectable by the user.
- The aforementioned exemplary embodiment will be understood as concrete examples of the following modes by those skilled in the art.
- A cell image analysis system includes a data tree creator configured to create a plurality of data trees relating to cell images by classifying the cell images into a plurality of groups each of which includes the cell images that have common classification information; a data tree storage configured to store the plurality of data trees created by the data tree creator, and a data tree storage area that stores the data trees created by the data tree creator; a graph creator configured to create a graph relating to a first data tree that is selected by a user, and having classification information of a bottom layer or a second layer from the bottom layer of the first data tree as a horizontal axis parameter and analysis results of the cell images that are included in the first data tree as a vertical axis parameter; and a display controller configured to display the graph created by the graph creator, wherein the display controller is configured to display a second data tree that is different from the first data tree and has common horizontal and vertical axis parameters to the first data tree in the plurality of data trees stored in the data tree storage to be selectable by the user, and, when the second data tree is selected by the user, to update the graph by adding the analysis results of the cell images that are included in the second data tree selected by the user to the graph.
- In the cell image analysis system according to
mode item 1, a data tree searcher configured to search for the second data tree in the plurality of data trees stored in the data tree storage is further provided; and the display controller is configured to display the second data tree searched by the data tree searcher so as to be selectable by the user. - In the cell image analysis system according to
mode item 2, the data tree searcher is configured to be able to search for the second data tree in the plurality of data trees stored in the data tree storage with at least one of a project and a cultivation condition relating to cell cultivation being specified as a search criterion; and the display controller is configured to display the second data tree searched by the data tree searcher with the search criterion being specified to be selectable by the user. - In the cell image analysis system according to
mode item 3, the data tree searcher is configured to be able to search for the second data tree in the plurality of data trees stored in the data tree storage with a cultivation condition that is common to the first data tree being specified as the search criterion; and the display controller is configured to display the second data tree, which corresponds to the cultivation condition that is common to the first data tree, searched by the data tree searcher with the cultivation condition that is common to the first data tree being specified as the search criterion. - In the cell image analysis system according to any of
mode items 1 to 4, the display controller is configured to update the graph by adding the analysis results of the cell images that are included in the second data tree selected by the user in a color different from the analysis results of the cell images that are included in the first data tree to the graph. - In the cell image analysis system according to any of
mode items 1 to 5, the display controller is configured to update the graph, when the user provides an instruction to delete the analysis results that are included in the second data tree and have been added to the graph, by deleting the analysis results of the cell images that are included in the second data tree and have been added to the graph from the graph. - In the cell image analysis system according to any of
mode items 1 to 6, the horizontal axis parameter is accessory information on cell cultivation or imaging. - In the cell image analysis system according to any of
mode items 1 to 7, the vertical axis parameter corresponds to feature amounts based on the cell images. - In the cell image analysis system according to any of
mode items 1 to 8, the data tree is formed as a virtual data tree having a hierarchical structure on a display screen. - In the cell image analysis system according to any of
mode items 1 to 9, a file output configured to output the cell images that serve as a basis for the graph including the added analysis results of the cell images that are included in the second data tree, and the graph that includes the added analysis results of the cell images that are included in the second data tree as a CSV file is further provided. - In the cell image analysis system according to
mode item 10, the file output is configured to output the CSV file with additional information including information on at least one of a project and a cultivation condition relating to cell cultivation. - In the cell image analysis system according to any of
mode items 1 to 11, the display controller is configured to display a third data tree that is different from the first data tree and has a common horizontal axis parameter to the first data tree and a vertical axis parameter different from the first data tree in the plurality of data trees stored in the data tree storage to be selectable by the user, and, when the third data tree is selected by the user, to update the graph by adding the analysis results of the cell images that are included in the third data tree selected by the user to the graph. Description of Reference Numerals -
- 11; data tree creator
- 12; graph creator
- 13; display controller
- 14; data tree searcher
- 15; file output
- 20, 320; storage (data tree storage)
- 24; data tree
- 24a; first data tree
- 24b; second data tree
- 24c; third data tree
- 30; cell image
- 40; classification information
- 50; graph
- 51; horizontal axis parameter
- 52; vertical axis parameter
- 70; CSV file
- 100; cell image analysis system
Claims (12)
- A cell image analysis system comprising:a data tree creator configured to create a plurality of data trees relating to cell images by classifying the cell images into a plurality of groups each of which includes the cell images that have common classification information;a data tree storage configured to store the plurality of data trees created by the data tree creator;a graph creator configured to create a graph relating to a first data tree that is selected by a user, and having classification information of a bottom layer or a second layer from the bottom layer of the first data tree as a horizontal axis parameter and analysis results of the cell images that are included in the first data tree as a vertical axis parameter; anda display controller configured to display the graph created by the graph creator, whereinthe display controller is configured to display a second data tree that is different from the first data tree and has common horizontal and vertical axis parameters to the first data tree in the plurality of data trees stored in the data tree storage to be selectable by the user, and, when the second data tree is selected by the user, to update the graph by adding the analysis results of the cell images that are included in the second data tree selected by the user to the graph.
- The cell image analysis system according to claim 1 further comprising a data tree searcher configured to search for the second data tree in the plurality of data trees stored in the data tree storage, wherein
the display controller is configured to display the second data tree searched by the data tree searcher so as to be selectable by the user. - The cell image analysis system according to claim 2, whereinthe data tree searcher is configured to be able to search for the second data tree in the plurality of data trees stored in the data tree storage with at least one of a project and a cultivation condition relating to cell cultivation being specified as a search criterion; andthe display controller is configured to display the second data tree searched by the data tree searcher with the search criterion being specified to be selectable by the user.
- The cell image analysis system according to claim 3, whereinthe data tree searcher is configured to be able to search for the second data tree in the plurality of data trees stored in the data tree storage with a cultivation condition that is common to the first data tree being specified as the search criterion; andthe display controller is configured to display the second data tree, which corresponds to the cultivation condition that is common to the first data tree, searched by the data tree searcher with the cultivation condition that is common to the first data tree being specified as the search criterion.
- The cell image analysis system according to claim 1, wherein the display controller is configured to update the graph by adding the analysis results of the cell images that are included in the second data tree selected by the user in a color different from the analysis results of the cell images that are included in the first data tree to the graph.
- The cell image analysis system according to claim 1, wherein the display controller is configured to update the graph, when the user provides an instruction to delete the analysis results that are included in the second data tree and have been added to the graph, by deleting the analysis results of the cell images that are included in the second data tree and have been added to the graph from the graph.
- The cell image analysis system according to claim 1, wherein the horizontal axis parameter is accessory information on cell cultivation or imaging.
- The cell image analysis system according to claim 1, wherein the vertical axis parameter corresponds to feature amounts based on the cell images.
- The cell image analysis system according to claim 1, wherein the data tree is formed as a virtual data tree having a hierarchical structure on a display screen.
- The cell image analysis system according to claim 1 further comprising a file output configured to output the cell images that serve as a basis for the graph including the added analysis results of the cell images that are included in the second data tree, and the graph that includes the added analysis results of the cell images that are included in the second data tree as a CSV file.
- The cell image analysis system according to claim 10, wherein the file output is configured to output the CSV file with additional information including information on at least one of a project and a cultivation condition relating to cell cultivation.
- The cell image analysis system according to claim 1, wherein the display controller is configured to display a third data tree that is different from the first data tree and has a common horizontal axis parameter to the first data tree and a vertical axis parameter different from the first data tree in the plurality of data trees stored in the data tree storage to be selectable by the user, and, when the third data tree is selected by the user, to update the graph by adding the analysis results of the cell images that are included in the third data tree selected by the user to the graph.
Applications Claiming Priority (2)
| Application Number | Priority Date | Filing Date | Title |
|---|---|---|---|
| JP2021166370 | 2021-10-08 | ||
| PCT/JP2022/024899 WO2023058271A1 (en) | 2021-10-08 | 2022-06-22 | Cell image analysis system |
Publications (2)
| Publication Number | Publication Date |
|---|---|
| EP4414445A1 true EP4414445A1 (en) | 2024-08-14 |
| EP4414445A4 EP4414445A4 (en) | 2025-08-20 |
Family
ID=85804077
Family Applications (1)
| Application Number | Title | Priority Date | Filing Date |
|---|---|---|---|
| EP22878144.9A Pending EP4414445A4 (en) | 2021-10-08 | 2022-06-22 | CELL IMAGE ANALYSIS SYSTEM |
Country Status (5)
| Country | Link |
|---|---|
| US (1) | US20250232600A1 (en) |
| EP (1) | EP4414445A4 (en) |
| JP (1) | JP7758046B2 (en) |
| CN (1) | CN117940551A (en) |
| WO (1) | WO2023058271A1 (en) |
Family Cites Families (4)
| Publication number | Priority date | Publication date | Assignee | Title |
|---|---|---|---|---|
| JP2006031593A (en) * | 2004-07-21 | 2006-02-02 | Fuji Electric Systems Co Ltd | Bacteria culture process animation creation system |
| JP7530709B2 (en) | 2019-10-11 | 2024-08-08 | 株式会社島津製作所 | Cell image analysis method and cell analysis device |
| WO2021199709A1 (en) * | 2020-03-31 | 2021-10-07 | 富士フイルム株式会社 | Cell culture evaluation device, operation method for cell culture evaluation device, and operation program for cell culture evaluation device |
| US12572507B2 (en) * | 2020-09-30 | 2026-03-10 | Shimadzu Corporation | Data processing system, data processing method, and computer program for executing data processing method using information processing device |
-
2022
- 2022-06-22 EP EP22878144.9A patent/EP4414445A4/en active Pending
- 2022-06-22 WO PCT/JP2022/024899 patent/WO2023058271A1/en not_active Ceased
- 2022-06-22 JP JP2023552693A patent/JP7758046B2/en active Active
- 2022-06-22 US US18/699,096 patent/US20250232600A1/en active Pending
- 2022-06-22 CN CN202280060719.7A patent/CN117940551A/en active Pending
Also Published As
| Publication number | Publication date |
|---|---|
| WO2023058271A1 (en) | 2023-04-13 |
| JP7758046B2 (en) | 2025-10-22 |
| US20250232600A1 (en) | 2025-07-17 |
| CN117940551A (en) | 2024-04-26 |
| JPWO2023058271A1 (en) | 2023-04-13 |
| EP4414445A4 (en) | 2025-08-20 |
Similar Documents
| Publication | Publication Date | Title |
|---|---|---|
| JP7378597B2 (en) | Preparing the training dataset using machine learning algorithms | |
| US20250028736A1 (en) | Systems and methods for combining data analyses | |
| US7296021B2 (en) | Method, system, and article to specify compound query, displaying visual indication includes a series of graphical bars specify weight relevance, ordered segments of unique colors where each segment length indicative of the extent of match of each object with one of search parameters | |
| KR101794373B1 (en) | Temporary formatting and charting of selected data | |
| CN107851031B (en) | data discovery node | |
| US9009617B2 (en) | Decision aiding user interfaces | |
| US20110109632A1 (en) | Rule based visualization mechanism | |
| JP4821000B2 (en) | Object display processing device, object display processing method, and object display processing program | |
| US20200342029A1 (en) | Systems and methods for querying databases using interactive search paths | |
| AU2011357672B2 (en) | A method for multiple pass symbol and components-based visual object searching of documents | |
| CN107657150A (en) | One kind visualization analysis of biological information instrument generation method and device | |
| US20200118305A1 (en) | Automatic line drawing coloring program, automatic line drawing coloring apparatus, and graphical user interface program | |
| JP2025121863A (en) | Artificial intelligence assistant for work protocols | |
| US20230133985A1 (en) | Display control device and display control method | |
| EP4414445A1 (en) | Cell image analysis system | |
| CN116009737A (en) | Cell image processing system and cell image processing method | |
| Auber et al. | EVAT-Environment for Visualization and Analysis of Trees | |
| US12347088B2 (en) | Data processing system | |
| WO2018147529A1 (en) | Method for allowing charts in dashboard implemented in online environment to interact | |
| US20240362904A1 (en) | Data analysis system, data analysis apparatus and data analysis method | |
| US20250111896A1 (en) | Information processing apparatus, information processing method, and program | |
| JP6988430B2 (en) | Systems for visually investigating apposition relationships in data, methods for visualizing relationship data, programs, and computer equipment. | |
| JP4356640B2 (en) | Document management device | |
| JP2003075202A (en) | Data analyzer and method thereof | |
| Cho | PRE-render Content Using Tiles (PRECUT). 1. Large-Scale Compound-Target Relationship Analyses |
Legal Events
| Date | Code | Title | Description |
|---|---|---|---|
| STAA | Information on the status of an ep patent application or granted ep patent |
Free format text: STATUS: THE INTERNATIONAL PUBLICATION HAS BEEN MADE |
|
| PUAI | Public reference made under article 153(3) epc to a published international application that has entered the european phase |
Free format text: ORIGINAL CODE: 0009012 |
|
| STAA | Information on the status of an ep patent application or granted ep patent |
Free format text: STATUS: REQUEST FOR EXAMINATION WAS MADE |
|
| 17P | Request for examination filed |
Effective date: 20240419 |
|
| AK | Designated contracting states |
Kind code of ref document: A1 Designated state(s): AL AT BE BG CH CY CZ DE DK EE ES FI FR GB GR HR HU IE IS IT LI LT LU LV MC MK MT NL NO PL PT RO RS SE SI SK SM TR |
|
| DAV | Request for validation of the european patent (deleted) | ||
| DAX | Request for extension of the european patent (deleted) | ||
| A4 | Supplementary search report drawn up and despatched |
Effective date: 20250718 |
|
| RIC1 | Information provided on ipc code assigned before grant |
Ipc: C12M 1/34 20060101AFI20250714BHEP Ipc: G01N 33/48 20060101ALI20250714BHEP Ipc: G06T 7/00 20170101ALI20250714BHEP Ipc: G06V 20/69 20220101ALI20250714BHEP Ipc: G06V 10/94 20220101ALI20250714BHEP |