EP4390786A1 - Method for optimizing the energy management of a fleet of electric transportation vehicles, more particularly a fleet of electric buses - Google Patents
Method for optimizing the energy management of a fleet of electric transportation vehicles, more particularly a fleet of electric buses Download PDFInfo
- Publication number
- EP4390786A1 EP4390786A1 EP22216353.7A EP22216353A EP4390786A1 EP 4390786 A1 EP4390786 A1 EP 4390786A1 EP 22216353 A EP22216353 A EP 22216353A EP 4390786 A1 EP4390786 A1 EP 4390786A1
- Authority
- EP
- European Patent Office
- Prior art keywords
- attributes
- vehicle
- activity
- fleet
- journey
- Prior art date
- Legal status (The legal status is an assumption and is not a legal conclusion. Google has not performed a legal analysis and makes no representation as to the accuracy of the status listed.)
- Pending
Links
Images


Classifications
-
- G—PHYSICS
- G06—COMPUTING OR CALCULATING; COUNTING
- G06Q—INFORMATION AND COMMUNICATION TECHNOLOGY [ICT] SPECIALLY ADAPTED FOR ADMINISTRATIVE, COMMERCIAL, FINANCIAL, MANAGERIAL OR SUPERVISORY PURPOSES; SYSTEMS OR METHODS SPECIALLY ADAPTED FOR ADMINISTRATIVE, COMMERCIAL, FINANCIAL, MANAGERIAL OR SUPERVISORY PURPOSES, NOT OTHERWISE PROVIDED FOR
- G06Q10/00—Administration; Management
- G06Q10/04—Forecasting or optimisation specially adapted for administrative or management purposes, e.g. linear programming or "cutting stock problem"
-
- G—PHYSICS
- G01—MEASURING; TESTING
- G01C—MEASURING DISTANCES, LEVELS OR BEARINGS; SURVEYING; NAVIGATION; GYROSCOPIC INSTRUMENTS; PHOTOGRAMMETRY OR VIDEOGRAMMETRY
- G01C21/00—Navigation; Navigational instruments not provided for in groups G01C1/00 - G01C19/00
- G01C21/26—Navigation; Navigational instruments not provided for in groups G01C1/00 - G01C19/00 specially adapted for navigation in a road network
- G01C21/34—Route searching; Route guidance
- G01C21/3453—Special cost functions, i.e. other than distance or default speed limit of road segments
- G01C21/3469—Fuel consumption; Energy use; Emission aspects
-
- G—PHYSICS
- G01—MEASURING; TESTING
- G01C—MEASURING DISTANCES, LEVELS OR BEARINGS; SURVEYING; NAVIGATION; GYROSCOPIC INSTRUMENTS; PHOTOGRAMMETRY OR VIDEOGRAMMETRY
- G01C21/00—Navigation; Navigational instruments not provided for in groups G01C1/00 - G01C19/00
- G01C21/26—Navigation; Navigational instruments not provided for in groups G01C1/00 - G01C19/00 specially adapted for navigation in a road network
- G01C21/34—Route searching; Route guidance
- G01C21/3453—Special cost functions, i.e. other than distance or default speed limit of road segments
- G01C21/3492—Special cost functions, i.e. other than distance or default speed limit of road segments employing speed data or traffic data, e.g. real-time or historical
-
- G—PHYSICS
- G01—MEASURING; TESTING
- G01C—MEASURING DISTANCES, LEVELS OR BEARINGS; SURVEYING; NAVIGATION; GYROSCOPIC INSTRUMENTS; PHOTOGRAMMETRY OR VIDEOGRAMMETRY
- G01C21/00—Navigation; Navigational instruments not provided for in groups G01C1/00 - G01C19/00
- G01C21/38—Electronic maps specially adapted for navigation; Updating thereof
- G01C21/3863—Structures of map data
- G01C21/387—Organisation of map data, e.g. version management or database structures
- G01C21/3874—Structures specially adapted for data searching and retrieval
-
- G—PHYSICS
- G06—COMPUTING OR CALCULATING; COUNTING
- G06F—ELECTRIC DIGITAL DATA PROCESSING
- G06F16/00—Information retrieval; Database structures therefor; File system structures therefor
- G06F16/20—Information retrieval; Database structures therefor; File system structures therefor of structured data, e.g. relational data
- G06F16/24—Querying
- G06F16/242—Query formulation
- G06F16/2425—Iterative querying; Query formulation based on the results of a preceding query
-
- G—PHYSICS
- G06—COMPUTING OR CALCULATING; COUNTING
- G06Q—INFORMATION AND COMMUNICATION TECHNOLOGY [ICT] SPECIALLY ADAPTED FOR ADMINISTRATIVE, COMMERCIAL, FINANCIAL, MANAGERIAL OR SUPERVISORY PURPOSES; SYSTEMS OR METHODS SPECIALLY ADAPTED FOR ADMINISTRATIVE, COMMERCIAL, FINANCIAL, MANAGERIAL OR SUPERVISORY PURPOSES, NOT OTHERWISE PROVIDED FOR
- G06Q10/00—Administration; Management
- G06Q10/06—Resources, workflows, human or project management; Enterprise or organisation planning; Enterprise or organisation modelling
- G06Q10/063—Operations research, analysis or management
- G06Q10/0631—Resource planning, allocation, distributing or scheduling for enterprises or organisations
- G06Q10/06311—Scheduling, planning or task assignment for a person or group
-
- G—PHYSICS
- G06—COMPUTING OR CALCULATING; COUNTING
- G06Q—INFORMATION AND COMMUNICATION TECHNOLOGY [ICT] SPECIALLY ADAPTED FOR ADMINISTRATIVE, COMMERCIAL, FINANCIAL, MANAGERIAL OR SUPERVISORY PURPOSES; SYSTEMS OR METHODS SPECIALLY ADAPTED FOR ADMINISTRATIVE, COMMERCIAL, FINANCIAL, MANAGERIAL OR SUPERVISORY PURPOSES, NOT OTHERWISE PROVIDED FOR
- G06Q10/00—Administration; Management
- G06Q10/06—Resources, workflows, human or project management; Enterprise or organisation planning; Enterprise or organisation modelling
- G06Q10/063—Operations research, analysis or management
- G06Q10/0631—Resource planning, allocation, distributing or scheduling for enterprises or organisations
- G06Q10/06312—Adjustment or analysis of established resource schedule, e.g. resource or task levelling, or dynamic rescheduling
-
- G—PHYSICS
- G06—COMPUTING OR CALCULATING; COUNTING
- G06Q—INFORMATION AND COMMUNICATION TECHNOLOGY [ICT] SPECIALLY ADAPTED FOR ADMINISTRATIVE, COMMERCIAL, FINANCIAL, MANAGERIAL OR SUPERVISORY PURPOSES; SYSTEMS OR METHODS SPECIALLY ADAPTED FOR ADMINISTRATIVE, COMMERCIAL, FINANCIAL, MANAGERIAL OR SUPERVISORY PURPOSES, NOT OTHERWISE PROVIDED FOR
- G06Q10/00—Administration; Management
- G06Q10/06—Resources, workflows, human or project management; Enterprise or organisation planning; Enterprise or organisation modelling
- G06Q10/063—Operations research, analysis or management
- G06Q10/0635—Risk analysis of enterprise or organisation activities
-
- G—PHYSICS
- G06—COMPUTING OR CALCULATING; COUNTING
- G06Q—INFORMATION AND COMMUNICATION TECHNOLOGY [ICT] SPECIALLY ADAPTED FOR ADMINISTRATIVE, COMMERCIAL, FINANCIAL, MANAGERIAL OR SUPERVISORY PURPOSES; SYSTEMS OR METHODS SPECIALLY ADAPTED FOR ADMINISTRATIVE, COMMERCIAL, FINANCIAL, MANAGERIAL OR SUPERVISORY PURPOSES, NOT OTHERWISE PROVIDED FOR
- G06Q50/00—Information and communication technology [ICT] specially adapted for implementation of business processes of specific business sectors, e.g. utilities or tourism
- G06Q50/40—Business processes related to the transportation industry
Definitions
- the invention relates to a method for optimizing the energy management of a fleet of electric transportation vehicles, more particularly a fleet of electric buses.
- a fleet of vehicles for instance for public transportation, is operated from a control center where operators take decisions usually involving many manual calculations.
- the vehicle schedules generated were not accurate enough and they were not able to take into account all the new parameters, associated with electric vehicles, such as battery SoH, energy consumption, charge rate, etc., resulting in too much slack in the schedules, more energy usage, more busses required, more hours from drivers, and a higher CO 2 impact.
- said performance index comprises an efficiency value or a couple of values of energy and distance.
- the historic data are stored in a data-cube.
- the performance index can also be a charge rate, but the 'dimensions' of the database, here the cube, would be different, e.g., ambient temperature, battery temp, start SoC, etc.
- the method comprises in a repetitive manner, until the query returns at least one performance index, a step of:
- the database stores the activity distance and the energy consumed during the activity along with the set of attributes calculated before starting the activity.
- the invention also concerns a graphical user interface for optimizing the energy management of a fleet of electric transportation vehicles, said interface comprising a list of vehicles of the electric vehicle fleet, each electric vehicle being associated with a plurality of intended activities;
- said estimated SoC at the end of the next scheduled activity is calculated by the implementation of the method as exposed previously.
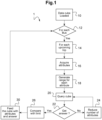
- Figure 1 is a flowchart of the method of the invention:
- the invention relates to a method for optimizing the management of a fleet of electric vehicles; in this embodiment a fleet of electric-buses, also called e-bus.
- This method is usually implemented as a software run by a computer.
- This computer it must be understood that we are referring to any kind of electronic devices, acting alone or together with other computers in a network environment.
- This computer can be a server, a desktop station, a laptop, a mobile device or any other adapted device.
- This software is separated in different modules, also called dashboard, which can be described as different views of the inputs, outputs and parameters of the method according to the invention.
- the method logic is therefore employed for decision making and planning tool for the bus drivers, traffic control center employees, depot coordinators, depot manager and concession director and makes use of three different dashboards that visualize the information needed for the specific end-users, monitor and use operational data in real time.
- dashboards we can cite the departure board, the charger location dashboard, and the vehicle in service dashboard, which is represented in figure 2 .
- a plurality of other dashboards, not described here, can also be implemented in such software.
- dashboards are depending on a common core running a common optimization logic, here described as the method according to the invention.
- This optimization and management method allows to efficiently manage the daily operations of the e-buses, by anticipating the needs and the situations that might be encountered by the drivers, instead of only solving the issues as it was implemented in the prior art solutions.
- the general idea of the method according to the invention is to take into consideration a complete set of relevant parameters, in an all-embracing approach.
- the logic of the method optimizes operations, from initial scheduling, managing the schedule to real-world execution of the schedule and forecasting for future use, leading to resources economy, to better servicing the passenger community and to lower cost, improving the overall operation.
- resource is used to encompass a plurality of managed elements and related data.
- a resource is the items we want to manage, comprising but not limited to:
- a set of rules can be added to the method to take in consideration regulatory compliance safety considerations, and local market conditions.
- the parameters of this list of resources can be individually measured, estimated, acquired, or calculated in different ways, for instance measured in real-time.
- the End-of-Life parameter (usually called EOL) and/or the State of Health (SoH) of the battery, can be estimated taking into consideration either the Original Equipment Manufacturer (abbreviated OEM) operating parameters, or, alternatively, implementing a specific model of battery aging.
- EOL End-of-Life parameter
- SoH State of Health
- the vehicles in service dashboard 3 includes a first list 31 of vehicles in service, these vehicles belonging to the vehicle fleet.
- the control panel When a vehicle from the list is selected, for example here the selected vehicle 318, the control panel then includes a detailed list of activities 32 that the vehicle has or is to perform during its schedule.
- An activity can correspond to a journey (for example the route of a line), a charging session, a period of inactivity of the vehicle.
- a group of activities of a vehicle during a day, according to a schedule, are called a block of the vehicle.
- a block is therefore made of a succession of activities.
- This list of activities 32 includes for each line, from left to right:
- the activities are displayed in a list in chronological order, the current activity being in bold font and the activities already completed being grayed out.
- These already completed activities then include the actual data of the departure time 321 and arrival time 323, as well as an indication of the planned SoC 324 at the end of the activity and the Soc reached 325 at the end of this already completed activity.
- the planned SoC 324 is updated at every activity start.
- the start time 321 and finish time 323 are estimated times.
- the estimated SoC is then calculated according to the method according to the invention, and the actual SoC is then not displayed.
- a graph 33 is displayed allowing to visualize the SoC for this activity.
- This graph 33 comprises:
- the selected vehicle is also shown in real time on a map 34 to visualize the route, and charger locations are depicted.
- This dashboard takes into account the method according to the invention for estimating the predictive SoC of the bus in service.
- the battery indicator 316 is a visual user interface element comprising, on the one hand, a graphic indication and, on the other hand, a color indication enabling the user to identify in an intuitive manner the problems that may be associated with each bus in the list 31.
- this battery indicator 316 is in the shape of a schematic battery, however this battery incorporates two distinct pieces of information: on the one hand its filling level 41, corresponding to the SoC of the battery, illustrated by the filling of the main shape, and on the other hand a color code, indicating the capacity of the bus to carry out the remainder of the vehicle task ( block ) considering the SoC.”
- SoC charge level is represented according to only three levels:
- This color estimation is based on the following method according to the invention.
- the purpose is to verify that the schedule previously calculated for each bus of the fleet can be made or to alert the operator, or any other person or system concerned, of a potential failed schedule.
- conditions may have varied between the scheduling and execution of the schedule.
- the weather, the drivers, and the traffic can vary between the moment the schedule was made and when the operations are performed. This impacts the performance and the average usage of the bus.
- a schedule is made to minimize the resource used or needed, where resources can be:
- a schedule is made to reduce at least the duration of charge sessions as much as possible. Provided a given timetable and set of available vehicles, the number and duration of charge sessions that must be built into the schedule depends mostly on:
- an activity is a part of the schedule of a bus during a day. Therefore, an activity can be a trip or a journey (for instance the complete route of a bus line), also called a journey-type activity, a charging session, an idle period, and also for instance a maintenance period, or any other operational timeframe of an electric bus during a day.
- a trip or a journey for instance the complete route of a bus line
- a journey-type activity for instance the complete route of a bus line
- charging session for instance the complete route of a bus line
- an idle period for instance a charging session
- an idle period for instance a maintenance period, or any other operational timeframe of an electric bus during a day.
- an activity comprises different type of events the method must be able to also deal with a plurality of forecasting.
- different ways of forecasting have been implemented.
- the estimation can consider more criteria like weather, usage limitations set forth by the manufacturer, etc.
- the "net energy consumed" is calculated for the current and upcoming activities.
- This value is relevant to see the evolution of the energy consumption of the vehicle during the schedule.
- the Baseline Estimate assumes that the SoC will be 100% SoC at the start of the first activity of the day.
- the Dynamic Estimate uses the actual SoC at the start of the next activity as a starting point.
- the method according to the invention requires a database of historic data, for the journey-type activity efficiency.
- this database is architected as a data cube. It is known in the field of computer science that a data-cube is a n-dimensional array intended for storing a high volume of data.
- the data set of parameters comprises a set of relevant parameters for describing a journey activity and the conditions under which it was executed.
- index is used to refer to the performance index, or performance indicator, while the parameters are the entries of the data-cube search (sometimes called indexes in computer science vocabulary).
- this set of parameters comprises the line connection, the estimated wind during the activity, the outside temperature, the driver style, the time of the day, the expected passenger numbers, and the day type.
- Each set of data stored in the data cube is associated with a performance index, which will be the output of the query of the data cube.
- connection refers to the journey between the start and end point of a line (Activity level journey) or to the journey between two bus stops (Step level journey).
- journey we refer to the term journey as a certain distance traveled over a specific path.
- a journey is identified by a start and end location.
- start and end location are not sufficient to describe it correctly.
- a journey is identified by just the start location and the end location.
- the Connection is one of the parameters (or dimensions of the cube) that is used to organize data in the cube. Others are, as mentioned, for example Vehicle Type, Temperature, Driver Score, Time of Day, etc.
- the performance index is a couple of values: distance and kWh estimation, allowing to calculate the efficiency number, which is dimensioned as kWh/km or miles/kWh.
- the performance index stored in the data cube could also be alternatively the efficiency number itself, instead of the couple of values distance and kWh estimation. However, it is preferable to store the values of distance and energy separated rather than combined, as they can also be used separately.
- This date cube is filled with historical data created from previous journey-type activities, comprising the parameters that applied at the start of the activity and associated with the distance travelled during the activity and the energy consumed, in kWh.
- the data cube When a journey-type activity is made, for any kind of bus and at any moment of the day, the data cube is enhanced 30 with the data of that activity. Therefore, the data cube is permanently growing.
- the data cube does not store the value itself, but a range of values, also called a "bracket".
- a parameter or dimension
- it must be discrete and must have a limited set of possible values. If a parameter does not match these criteria, the chance of finding matches when querying the cube with a specific set of parameters are extremely small.
- Line number is an attribute of a connection as defined previously. As such they are indirectly a parameter for the cube.
- the attributes must be discrete and have a limited set of values.
- Vehicle Type is an example of such a discrete parameter.
- Temperature is an example of a non-discrete parameter. Therefore, a solution is to round the temperature to the closest integer value, but we would still get a wide range of possible values.
- connection 1234 When it comes to connections, there is no such thing as “proximity”. Results obtained for connection 1234 are not more relevant for connection 1235 or 1233 than they are for connection 0000 or 9999. If we cannot find a perfect match using the connection number, the connection number must be ignored.
- bracket id When adding efficiency data from a trip to the cube, we determine which bracket the temperature falls in and use the bracket id as parameter.
- the bracket id itself is meaningless, but it tells us if two trips fell into the same bracket, temperature wise.
- a set of operational attributes are acquired 16 for the upcoming activity.
- connection estimated wind during the journey, outside temperature, driver style, time of day, expected passenger numbers and day type.
- the day type is defined as a numerical value related to the day of the week, as in 1 is Monday, 2 is Tuesday etc.
- some attributes are easy to acquire, for instance starting time, some attributes will need a connection to an outside source of data, like a weather data provider, for wind and temperature.
- hit is to be understood as a relevant result after a query in the data-cube.
- a query 20 is launched in the cube for a precise match of the whole set of converted attributes.
- a subset of attributes (and converted attributes) is selected 24, according to a predetermined priority pattern, and a new query 20 is launched.
- the pattern is selected in a list as shown below, ordered from top priority to the lowest priority: Connection, Vehicle Type, Line, Temperature, Time, Driver, Day type Connection, Vehicle Type, Temperature, Time, Driver, Day type Vehicle Type, Line, Temperature, Time, Driver, Day type Connection, Vehicle Type, Temperature, Driver, Day type Vehicle Type, Line, Temperature, Driver, Day type Connection, Vehicle Type, Temperature, Day type Vehicle Type, Line, Temperature, Day type Vehicle Type, Temperature, Time, Driver, Day type Vehicle Type, Temperature, Driver, Day type Vehicle Type, Temperature, Day type Connection, Vehicle Type, Day type Vehicle Type, Line, Day type Vehicle Type, Day type Connection, Vehicle Type Vehicle Type, Line Vehicle Type Vehicle Type, Day type Connection, Vehicle Type Vehicle Type, Line Vehicle Type Vehicle Type, Line Vehicle Type Vehicle Type, Line Vehicle Type Vehicle Type, Line Vehicle Type Vehicle Type, Line Vehicle Type Vehicle Type, Line Vehicle Type Vehicle Type, Line Vehicle Type Vehicle Type, Line Vehicle Type Vehicle Type, Line Vehicle Type Vehicle Type, Line Vehicle Type Vehicle Type, Line Vehicle Type Vehicle Type, Line Vehicle Type Vehicle Type, Line Vehicle
- This operation is repeated until the query returns a "hit" (a value matching the query).
- a hit is a result indicating whether the query has provided results or not, as well as the number of associated results.
- the associated results of a hit comprise a list of couple of values (distance, kWh estimation), referred as the efficiency index.
- a "hit" comprising a single associated result (a single couple of values) can be considered as not relevant. Therefore, only answers that obtain enough associated results to the hit will usually be used.
- a predetermined number is therefore define at this end, for instance a number of at least 50 results for a significant hit.
- the first rule incorporates all available parameters. So, a query using the first rule will return at most one cell.
- This cell provides the following values (among others):
- the average efficiency index for trips contributing to that cell can be calculated at any time. But it is also saved in the cell itself, so we do not have to do that calculation at that moment.
- the other rules do not incorporate all available parameters. So, a single query using one of the other rules will most likely bring back multiple cells. We must sum the total energy used from each of these cells as well as the total distance driven from each of these cells and divide these sums to get a weighted average efficiency over all of the cells returned. And this resulting number is used for the estimation. The stored efficiency value in each of the cells is no relevant here.
- That calculated "estimated end SoC for this Activity” is used to calculate the “estimated end SoC of the next Activity” and so on. All estimated end SoC values are then compared to the charge limit.
- this estimated SoC is compared with a first alert value, for instance 10% or 5%, and with the 0% limit, to update the battery indicator 316 as described previously in the "Vehicle in Service".
- the SoC When, according to the Dynamic Estimation, the SoC is expected to drop below 5%, or 10%, during any of the upcoming activities, the battery symbol turns yellow.
- the SoC When, according to the Dynamic Estimation, the SoC is expected to drop below 0% during any of the upcoming activities, the battery symbol turns red.
- the method according to the invention is also relevant to improve scheduling and charging sessions.
- an important objective in the energy management of a fleet of electric bus is to limit the energy demand peak at the charging depots.
- the charging depots are not limited in demand, they can for instance provide 1130kW at their peak, allowing almost every vehicle of the fleet to get the required SoC, but such peak should be avoided.
- the Energy Demand in kWh is equal to the Net Energy Consumption at the end of the last non charging activity before each charge activity in each of the vehicle blocks that are generated by the planning or scheduling tool.
Landscapes
- Engineering & Computer Science (AREA)
- Business, Economics & Management (AREA)
- Human Resources & Organizations (AREA)
- Remote Sensing (AREA)
- Radar, Positioning & Navigation (AREA)
- Physics & Mathematics (AREA)
- General Physics & Mathematics (AREA)
- Economics (AREA)
- Strategic Management (AREA)
- Entrepreneurship & Innovation (AREA)
- Theoretical Computer Science (AREA)
- Automation & Control Theory (AREA)
- Tourism & Hospitality (AREA)
- Marketing (AREA)
- General Business, Economics & Management (AREA)
- Development Economics (AREA)
- Quality & Reliability (AREA)
- Operations Research (AREA)
- Game Theory and Decision Science (AREA)
- Educational Administration (AREA)
- Databases & Information Systems (AREA)
- Mathematical Physics (AREA)
- Data Mining & Analysis (AREA)
- General Engineering & Computer Science (AREA)
- Health & Medical Sciences (AREA)
- Computational Linguistics (AREA)
- General Health & Medical Sciences (AREA)
- Primary Health Care (AREA)
- Management, Administration, Business Operations System, And Electronic Commerce (AREA)
Abstract
Computer-implemented method for optimizing the energy management of a fleet of electric transportation vehicles comprising:
for each vehicle of the fleet, before performing each of the said at least one journey of the schedule:
Acquiring a set of attributes for the upcoming journey;
Launching a query in a database in order to obtain at least one performance index in function of the attributes;
If said query returns at least one performance index, calculating an expected state of charge of the battery at the end of the upcoming journey;
Comparing said expected state of charge with a predetermined state of charge limit; and if said expected state of charge is lower than said predetermined state of charge limit, deliver a signal on a human-machine interface to signal a potential failure of said upcoming journey.
for each vehicle of the fleet, before performing each of the said at least one journey of the schedule:
Acquiring a set of attributes for the upcoming journey;
Launching a query in a database in order to obtain at least one performance index in function of the attributes;
If said query returns at least one performance index, calculating an expected state of charge of the battery at the end of the upcoming journey;
Comparing said expected state of charge with a predetermined state of charge limit; and if said expected state of charge is lower than said predetermined state of charge limit, deliver a signal on a human-machine interface to signal a potential failure of said upcoming journey.
Description
- The invention relates to a method for optimizing the energy management of a fleet of electric transportation vehicles, more particularly a fleet of electric buses.
- The transition from diesel busses to a large electric bus fleet has brought new challenges for public transit system operators. Compared to the diesel busses, electric busses have more interdependent variables and consequently the existing methods for the management of combustion engine vehicles cannot be directly transposed to electric vehicles.
- Usually, a fleet of vehicles, for instance for public transportation, is operated from a control center where operators take decisions usually involving many manual calculations.
- Particularly in an electric fleet environment, the operator deals with many incoming requests from drivers who feared "range" anxiety, while they did not have any insights in the actual performance of the busses on the road. Most of the actions they had to take were involving manual theoretical calculations, from low value, corrective, and comprising administrative measures instead of pro-active, preventive and value added for the driver and for the general organization.
- In addition to operational issues, the prior art planning and scheduling process from network design to daily operations is not flexible enough to solve operational challenges, meet drivers wishes and provide efficient concessions to their clients, for instance the public transportation authorities, particularly in a context of a fleet of electric vehicles.
- Moreover, the vehicle schedules generated were not accurate enough and they were not able to take into account all the new parameters, associated with electric vehicles, such as battery SoH, energy consumption, charge rate, etc., resulting in too much slack in the schedules, more energy usage, more busses required, more hours from drivers, and a higher CO2 impact.
- We propose a computer-implemented method for optimizing the energy management of a fleet of electric transportation vehicles comprising:
- Providing an operation schedule for a given timeframe; said operation schedule comprising for each vehicle a plurality of activities to complete, said plurality of activities comprising at least one journey;
- Providing a database of historic data; said historic data being configured to associate at least one performance index, with a plurality of data attributes, for instance as vehicle type, a transportation line, the outside temperature, daytime, driver's performance, day type;
- And for each vehicle of the fleet, before performing each of the said at least one journey of the schedule:
- Acquiring a set of attributes for the upcoming journey, said set of attributes comprising the same type of attributes as the set of attributes of the provided historic data;
- Converting at least one attributes of the set of attributes into a range of values; said range of values replacing said attribute in the set of attributes acquired;
- Launching a query in said database in order to obtain at least one performance index;
- If said query returns at least one performance index, calculating an expected state of charge of the battery at the end of the upcoming journey;
- Comparing said expected state of charge with a predetermined state of charge limit; and if said expected state of charge is lower than said predetermined state of charge limit, deliver a signal on a human-machine interface to signal a potential failure of said upcoming journey.
- Here the potential failure is the inability to make the next journey due to an insufficient SoC of the vehicle.
- This allows to anticipate problems that may arise in the context of operating an electric vehicle fleet, in particular by anticipating low SoC before a journey begins.
- Advantageously, said performance index comprises an efficiency value or a couple of values of energy and distance.
- Advantageously, the historic data are stored in a data-cube.
- According to an alternative embodiment of the invention, the performance index can also be a charge rate, but the 'dimensions' of the database, here the cube, would be different, e.g., ambient temperature, battery temp, start SoC, etc.
- Advantageously, if the query returns no answer, also called "hit", then the method comprises in a repetitive manner, until the query returns at least one performance index, a step of:
- reducing the number of attributes in the set of attributes, according to a predetermined pattern, and
- relaunch a query.
- Advantageously, after an activity is completed by a vehicle, the database stores the activity distance and the energy consumed during the activity along with the set of attributes calculated before starting the activity.
- The invention also concerns a graphical user interface for optimizing the energy management of a fleet of electric transportation vehicles, said interface comprising a list of vehicles of the electric vehicle fleet, each electric vehicle being associated with a plurality of intended activities;
- each vehicle of the list comprising a battery indicator associated with vehicle,
- characterized in that the battery indicator is formed of an image representing the measured SoC of the battery and colorized in function of the estimated SoC at the end of the next scheduled activity.
- This allows the user to intuitively understand the status of the vehicle and to know if the vehicle will be able to complete the planned schedule with a single visual element of information.
- Advantageously, said estimated SoC at the end of the next scheduled activity is calculated by the implementation of the method as exposed previously.
- The invention will now be described, by way of a non-limiting example, and in reference to the accompanying drawings, where:
Figure 1 is a flowchart of the method of the invention: -
Figure 2 is a dashboard of a Graphical User Interface implementing the method of the invention; -
Figure 3 is a detailed view of the battery indicator according to the invention. - The invention relates to a method for optimizing the management of a fleet of electric vehicles; in this embodiment a fleet of electric-buses, also called e-bus.
- This method is usually implemented as a software run by a computer.
- By the term computer it must be understood that we are referring to any kind of electronic devices, acting alone or together with other computers in a network environment. This computer can be a server, a desktop station, a laptop, a mobile device or any other adapted device.
- This software is separated in different modules, also called dashboard, which can be described as different views of the inputs, outputs and parameters of the method according to the invention.
- The method logic is therefore employed for decision making and planning tool for the bus drivers, traffic control center employees, depot coordinators, depot manager and concession director and makes use of three different dashboards that visualize the information needed for the specific end-users, monitor and use operational data in real time.
- Among the dashboards, we can cite the departure board, the charger location dashboard, and the vehicle in service dashboard, which is represented in
figure 2 . - A plurality of other dashboards, not described here, can also be implemented in such software.
- However, most of the dashboard are depending on a common core running a common optimization logic, here described as the method according to the invention.
- This optimization and management method allows to efficiently manage the daily operations of the e-buses, by anticipating the needs and the situations that might be encountered by the drivers, instead of only solving the issues as it was implemented in the prior art solutions.
- The general idea of the method according to the invention is to take into consideration a complete set of relevant parameters, in an all-embracing approach.
- Furthermore, the logic of the method optimizes operations, from initial scheduling, managing the schedule to real-world execution of the schedule and forecasting for future use, leading to resources economy, to better servicing the passenger community and to lower cost, improving the overall operation.
- In the invention, the term "resource" is used to encompass a plurality of managed elements and related data. In other words, a resource is the items we want to manage, comprising but not limited to:
- Electric vehicles (size or type of vehicle, charging type)
- Batteries of the vehicles (comprising the parameters State of Charge SoC, State of Heath SoH, End-of-Life EOF)
- charging stations (size, positioning) and charging plan
- route descriptions (flat, ascending, descending, frequency of stops, urban or rural environment, average speed etc.)
- rate of degradation of the battery;
- state of charge SoC when subject to re-charging, considering both depot charging and opportunity charging
- environmental conditions and their implications (including temperature and the need for heating/cooling, humidity, etc.)
- driving style (for instance a numeral classification of driver's style, or a categorization of driver's style, as a letter classification)
- idle time of the vehicle
- trips without passengers
- maintenance of the vehicle
- incidental or systemic passenger behavior (for instance: Covid influence, energy consumption due to mobile devices charging)
- Moreover, a set of rules can be added to the method to take in consideration regulatory compliance safety considerations, and local market conditions.
- The parameters of this list of resources can be individually measured, estimated, acquired, or calculated in different ways, for instance measured in real-time.
- As an example, the End-of-Life parameter (usually called EOL) and/or the State of Health (SoH) of the battery, can be estimated taking into consideration either the Original Equipment Manufacturer (abbreviated OEM) operating parameters, or, alternatively, implementing a specific model of battery aging.
- An embodiment of the computer-implemented
method 1 according to the invention, and representedfigure 2 , is described in relation with the dashboard "vehicle in service" 3, according tofigure 1 . - The vehicles in
service dashboard 3 includes afirst list 31 of vehicles in service, these vehicles belonging to the vehicle fleet. - Each line of the
list 31 comprising: - a vehicle identifier 311,
- a
latency indicator 312 displaying an alert, in this case an exclamation mark displayed in red, indicating that the vehicle has not communicated for 5 minutes and that itsSoC 317 displayed in real time may be outdated; - an block, also called vehicle task,
identifier 313; - the
transport line 314 associated with the vehicle; this column can also refer to a deadhead ('9999') or a charge session ("charge"); - the vehicle type 315 (e.g., single or articulated bus, and/or equipment reference),
- a
battery indicator 316 according to the invention; and - The real-
time SoC measurement 317 transmitted by the vehicle. - When a vehicle from the list is selected, for example here the selected vehicle 318, the control panel then includes a detailed list of
activities 32 that the vehicle has or is to perform during its schedule. - An activity can correspond to a journey (for example the route of a line), a charging session, a period of inactivity of the vehicle.
- A group of activities of a vehicle during a day, according to a schedule, are called a block of the vehicle. A block is therefore made of a succession of activities.
- This list of
activities 32 includes for each line, from left to right: - an activity number;
- a bus icon;
- a
departure time 321, - the description of the activity 322 (line traveled, deadhead, charging session),
- the
arrival time 323. - The activities are displayed in a list in chronological order, the current activity being in bold font and the activities already completed being grayed out.
- These already completed activities then include the actual data of the
departure time 321 andarrival time 323, as well as an indication of the planned SoC 324 at the end of the activity and the Soc reached 325 at the end of this already completed activity. - Every time a new activity starts, that activity and upcoming activities are replanned, based on, among others, end SoC of previous trip. Therefore, the planned SoC 324 is updated at every activity start.
- When the list item is an activity that has not yet been completed, or not started, the
start time 321 and finishtime 323 are estimated times. The estimated SoC is then calculated according to the method according to the invention, and the actual SoC is then not displayed. - When a
block 313 of thefirst list 31 is selected, for instance the line of the selected vehicle 318, agraph 33 is displayed allowing to visualize the SoC for this activity. - This
graph 33 comprises: - an actual graph 331 of the evolution of the SoC up to the point reached in the activity concerned (in particular if the activity is not completed, only the realized portion of the actual SoC is displayed),
- An first estimation of the
SoC 332; - a dynamic prediction of the SoC 334 according to the invention, and
- A threshold of SoC 335 at which a green battery turns yellow.
- The selected vehicle is also shown in real time on a
map 34 to visualize the route, and charger locations are depicted. - This dashboard takes into account the method according to the invention for estimating the predictive SoC of the bus in service.
- The
battery indicator 316 according to the invention is a visual user interface element comprising, on the one hand, a graphic indication and, on the other hand, a color indication enabling the user to identify in an intuitive manner the problems that may be associated with each bus in thelist 31. - Indeed, this
battery indicator 316 is in the shape of a schematic battery, however this battery incorporates two distinct pieces of information: on the one hand its fillinglevel 41, corresponding to the SoC of the battery, illustrated by the filling of the main shape, and on the other hand a color code, indicating the capacity of the bus to carry out the remainder of the vehicle task (block) considering the SoC." - In order to simplify even more the quick and intuitive interpretation of the user, the SoC charge level is represented according to only three levels:
- SoC level above 75% of
full capacity 410; - SoC level between 30% and 75% of
full capacity 411; and - SoC level below 30% of
full capacity 412. - Only three
colors 42 are provided: - green 420 indicating that the vehicle includes a battery with sufficient SoC to complete the Activity;
-
orange 421 indicating that there is a significant risk that the battery will have a level below a predetermined threshold, in thiscase 10%, or in analternate embodiment 5%, at the end of the activity; - red 422 indicating that the SoC of the vehicle will not allow the activity to be completed.
- This color estimation is based on the following method according to the invention.
- Indeed, in the embodiment of the method of the invention, the purpose is to verify that the schedule previously calculated for each bus of the fleet can be made or to alert the operator, or any other person or system concerned, of a potential failed schedule.
- Indeed, as the schedule is calculated prior to the operational day, or at least before any operation of a day, conditions may have varied between the scheduling and execution of the schedule. For instance, the weather, the drivers, and the traffic can vary between the moment the schedule was made and when the operations are performed. This impacts the performance and the average usage of the bus.
- Usually, a schedule is made to minimize the resource used or needed, where resources can be:
- driver hours
- energy
- vehicle kilometers
- battery (in terms of degradation)
- chargers, etc.
- In particular, a schedule is made to reduce at least the duration of charge sessions as much as possible. Provided a given timetable and set of available vehicles, the number and duration of charge sessions that must be built into the schedule depends mostly on:
- The resulting efficiency of the vehicle after considering the known operational conditions when creating the schedule
- The SoC safety threshold that is considered when creating the schedule
- The usable capacity of the battery for the vehicle when creating the schedule (function of the raw capacity of the battery, operational safety buffers applied, and known state-of-health SoH of the battery).
- Therefore, the purpose of the method is to estimate in real-time if a bus can successfully complete the calculated schedule or not.
- In this description, a daily schedule for a bus of the fleet is subdivided in activities.
- An activity is a part of the schedule of a bus during a day. Therefore, an activity can be a trip or a journey (for instance the complete route of a bus line), also called a journey-type activity, a charging session, an idle period, and also for instance a maintenance period, or any other operational timeframe of an electric bus during a day.
- As an activity comprises different type of events the method must be able to also deal with a plurality of forecasting. In other words, for different types of activities, different ways of forecasting have been implemented.
- For the vehicles in Service dashboard the following calculations are made so we can obtain the dynamically predicted SoC as exposed below, in function of the associated attributes:
- Estimation of energy consumption during a non-charging activity, considering: driver, vehicle type / vehicle, trip / terrain, distance travelled, idle time, weather, time of day, day of week, historical data, etc. This estimation is made for instance during a said journey-type activity
- Estimation of energy ingestion during a charging activity, considering for instance charger type, vehicle type, SoC at arrival, duration of the charging activity. This estimation is made for a charging activity, where the vehicle accumulate energy.
- The estimation can consider more criteria like weather, usage limitations set forth by the manufacturer, etc.
- But it is also needed to estimate net energy consumed during the day by:
- Chaining together a series of estimated driving activities and estimated charging activities to predict how "net energy consumed" will develop over the course of the operating day.
- Adjust the estimate "net energy consumed" and "SoC" based on real time SoC readings.
- Indeed, after each activity made by the vehicle, the "net energy consumed" is calculated for the current and upcoming activities.
- For instance, at the beginning of the day, we calculate the SoC for each activity by:
- adding up all estimated consumptions from
activity # 1 up to that activity - subtracting all estimated ingestions from
activity # 1 up to that activity - assuming we will start
activity # 1 with 100%. - The at the start of each of the next activities (for instance here activity #3), we re-estimate SoC for each of the
activities 3 and up by: - adding up all estimated consumptions from
activity # 3 up to that activity - subtracting all estimated ingestions from
activity # 3 up to that activity - knowing that we have started
activity # 3 with whatever SoC was reported by the Vehicle. - We never look back at estimated consumption or estimated ingestion for activities already completed, but we depart from the actual SoC of the last activity completed.
- This value is relevant to see the evolution of the energy consumption of the vehicle during the schedule.
- When the schedule and all related activities are initially prepared the net energy consumed value is estimated for the end of each of the activities. This is called the Baseline Estimate. The Baseline Estimate assumes that the SoC will be 100% SoC at the start of the first activity of the day.
- When the Vehicle starts an activity of the scheduled block, the "Net Energy Consumed" is estimated again for the end of this next activity and each of the upcoming activities of a block. This is called the Dynamic Estimate.
- The Dynamic Estimate uses the actual SoC at the start of the next activity as a starting point.
- The method according to the invention requires a database of historic data, for the journey-type activity efficiency.
- In this embodiment of the invention this database is architected as a data cube. It is known in the field of computer science that a data-cube is a n-dimensional array intended for storing a high volume of data.
- The data set of parameters comprises a set of relevant parameters for describing a journey activity and the conditions under which it was executed.
- In the context of the present invention, to avoid any terminological confusion, the term "index" is used to refer to the performance index, or performance indicator, while the parameters are the entries of the data-cube search (sometimes called indexes in computer science vocabulary).
- For instance, but in a non-limiting way, this set of parameters comprises the line connection, the estimated wind during the activity, the outside temperature, the driver style, the time of the day, the expected passenger numbers, and the day type. Each set of data stored in the data cube is associated with a performance index, which will be the output of the query of the data cube.
- The term connection refers to the journey between the start and end point of a line (Activity level journey) or to the journey between two bus stops (Step level journey).
- In this invention we refer to the term journey as a certain distance traveled over a specific path. Usually, a journey is identified by a start and end location. However, in case of an activity level journey, the start and end location are not sufficient to describe it correctly.
- Two busses travelling from one city to another city may follow different paths, depending on the line number and route number they are following. Therefore, an Activity Level journey is described by:
- start location
- end location
- line number
- route number
- At a Step Level, a journey is identified by just the start location and the end location.
- The Connection is one of the parameters (or dimensions of the cube) that is used to organize data in the cube. Others are, as mentioned, for example Vehicle Type, Temperature, Driver Score, Time of Day, etc.
- In this embodiment of this invention, the performance index is a couple of values: distance and kWh estimation, allowing to calculate the efficiency number, which is dimensioned as kWh/km or miles/kWh.
- In other words, in this embodiment of the invention, per data cell in the cube, we store the total number of kilometers and the total amount of energy used (for trips performed under those exact same conditions), and we calculate the efficiency (e.g., kWh/km) when we need it. This allows us to add additional data to already populated cells without having to go through all the historic data again.
- The performance index stored in the data cube could also be alternatively the efficiency number itself, instead of the couple of values distance and kWh estimation. However, it is preferable to store the values of distance and energy separated rather than combined, as they can also be used separately.
- Indeed, the purpose of storing these values, rather than the efficiency, is twofold:
- It allows us to add data to an already populated cell in the cube,
- It allows us to calculate the weighted average over multiple cells.
- It must be noted that we store the number of actual activities performed that have contributed to the data found in a cell. This tells us something about the trustworthiness of the data.
- This date cube is filled with historical data created from previous journey-type activities, comprising the parameters that applied at the start of the activity and associated with the distance travelled during the activity and the energy consumed, in kWh.
- When a journey-type activity is made, for any kind of bus and at any moment of the day, the data cube is enhanced 30 with the data of that activity. Therefore, the data cube is permanently growing.
- However, it could also be possible to manage and enhance the data cube in a more sporadic manner, for instance spaced from a plurality of days or weeks, with a preliminary check of the data added, to ensure that the data added are not adding irrelevant values.
- For instance, rather than rebuilding the cube in its entirety, we add data to the cube on a daily basis. Storing the total distance travelled and total energy used per cell allows us to do so.
- In a preliminary step of the
method 1, we load 10 into a data-cube a historical data set of parameters. - As it will be exposed later in the description, when the parameter is a numeric value, for instance an hour, a temperature, a number of passengers or a wind indication, the data cube does not store the value itself, but a range of values, also called a "bracket".
- Indeed, for a parameter (or dimension) to be suitable as a cube parameter, it must be discrete and must have a limited set of possible values. If a parameter does not match these criteria, the chance of finding matches when querying the cube with a specific set of parameters are extremely small.
- Line number is an attribute of a connection as defined previously. As such they are indirectly a parameter for the cube.
- As already stated, the attributes must be discrete and have a limited set of values.
- The "Vehicle Type" is an example of such a discrete parameter.
- Temperature is an example of a non-discrete parameter. Therefore, a solution is to round the temperature to the closest integer value, but we would still get a wide range of possible values.
- For instance, looking at temperature, 5°C and 6°C are in each other's proximity. So, a result obtained from trips executed at 5°C still have some relevance when estimating a trip expected to happen at 6°C. So, we do not want to restrict the method by only looking at results obtained for exactly 5°C when estimating a trip expected to happen at 6°C.
- Therefore, a solution is to round the temperature to the closest integer value, but we would still get a wide range of possible values.
- It is therefore also possible to divide the temperature by a predetermined integer, for example 5, and round to the closest integer value. This would give a smaller range of values.
- For this purpose, we have chosen in this embodiment of the invention to divide the range of temperature, and other non-discrete parameters of the invention that we must deal with into temperature brackets.
- When it comes to connections, there is no such thing as "proximity". Results obtained for connection 1234 are not more relevant for connection 1235 or 1233 than they are for
connection 0000 or 9999. If we cannot find a perfect match using the connection number, the connection number must be ignored. - When adding efficiency data from a trip to the cube, we determine which bracket the temperature falls in and use the bracket id as parameter. The bracket id itself is meaningless, but it tells us if two trips fell into the same bracket, temperature wise.
- Before each beginning of a journey-
type activity 14 in the daily schedule, a set of operational attributes are acquired 16 for the upcoming activity. - In other words, we acquire 16 data attributes for any upcoming "journey type" activity to estimate the efficiency number of the bus for this activity.
- These operational attributes are in this embodiment of the invention the connection, estimated wind during the journey, outside temperature, driver style, time of day, expected passenger numbers and day type.
- The day type is defined as a numerical value related to the day of the week, as in 1 is Monday, 2 is Tuesday etc.
- If some attributes are easy to acquire, for instance starting time, some attributes will need a connection to an outside source of data, like a weather data provider, for wind and temperature.
- Some other attributes will also be predefined or calculated as expected passenger numbers and connection.
- These operational attributes are converted 18 into brackets, also called range of values.
- Converting the attributes into brackets allow for 'hits' to be made when looking up the results from new journeys taking place.
- In the context of the invention the term "hit" is to be understood as a relevant result after a query in the data-cube.
- For instance, the chances of finding another historical journey on a Tuesday that starts at 9:03 where the temperature is 17.2 degrees and the driver's efficiency score is 68.2 are slim. But it is likely that thousands of journeys have been recorded on a day between 07:00-9:00 where the temperature was between 15-20 degrees and the driver had an efficiency score of B.
- Then, for each bus of the fleet, before a bus starts a journey-type activity, a
query 20 is launched in the cube for a precise match of the whole set of converted attributes. - If the cube return does not return a relevant answer, a subset of attributes (and converted attributes) is selected 24, according to a predetermined priority pattern, and a
new query 20 is launched. - For instance, the pattern is selected in a list as shown below, ordered from top priority to the lowest priority:
Connection, Vehicle Type, Line, Temperature, Time, Driver, Day type Connection, Vehicle Type, Temperature, Time, Driver, Day type Vehicle Type, Line, Temperature, Time, Driver, Day type Connection, Vehicle Type, Temperature, Driver, Day type Vehicle Type, Line, Temperature, Driver, Day type Connection, Vehicle Type, Temperature, Day type Vehicle Type, Line, Temperature, Day type Vehicle Type, Temperature, Time, Driver, Day type Vehicle Type, Temperature, Driver, Day type Vehicle Type, Temperature, Day type Connection, Vehicle Type, Day type Vehicle Type, Line, Day type Vehicle Type, Day type Connection, Vehicle Type Vehicle Type, Line Vehicle Type - This operation is repeated until the query returns a "hit" (a value matching the query).
- In the context of the invention, a hit is a result indicating whether the query has provided results or not, as well as the number of associated results.
- In this embodiment the associated results of a hit comprise a list of couple of values (distance, kWh estimation), referred as the efficiency index.
- Usually, a "hit" comprising a single associated result (a single couple of values) can be considered as not relevant. Therefore, only answers that obtain enough associated results to the hit will usually be used. A predetermined number is therefore define at this end, for instance a number of at least 50 results for a significant hit.
- In the worst situation, if the data-cube does not provide any hit at the end of the reducing pattern, We would use the efficiency data also used by the planning tool, like Hastus®, as a fallback, and if that does not exist either, we will use a predetermined baseline value will be used.
- However, given the large amount of data collected, it is unlikely that no answers will be returned by the data cube query at some point of the pattern.
- In other words, the first rule incorporates all available parameters. So, a query using the first rule will return at most one cell.
- This cell provides the following values (among others):
- total energy used;
- total distance driven;
- number of trips contributing to the data in the cell; this number allowing to decide whether the data can be used or not.
- Based on these values, the average efficiency index for trips contributing to that cell can be calculated at any time. But it is also saved in the cell itself, so we do not have to do that calculation at that moment.
- The other rules do not incorporate all available parameters. So, a single query using one of the other rules will most likely bring back multiple cells. We must sum the total energy used from each of these cells as well as the total distance driven from each of these cells and divide these sums to get a weighted average efficiency over all of the cells returned. And this resulting number is used for the estimation. The stored efficiency value in each of the cells is no relevant here.
- When the efficiency index is acquired, then the estimated State of Charge SoC is calculated.
- To estimate such SoC, a model is implemented taking in consideration this efficiency number and parameters of the battery. Such model is usually known from the man skilled in the art.
- That calculated "estimated end SoC for this Activity" is used to calculate the "estimated end SoC of the next Activity" and so on. All estimated end SoC values are then compared to the charge limit.
- In this embodiment of the invention, this estimated SoC is compared with a first alert value, for
instance 10% or 5%, and with the 0% limit, to update thebattery indicator 316 as described previously in the "Vehicle in Service". - When, according to the Dynamic Estimation, the SoC is expected to drop below 5%, or 10%, during any of the upcoming activities, the battery symbol turns yellow.
- When, according to the Dynamic Estimation, the SoC is expected to drop below 0% during any of the upcoming activities, the battery symbol turns red.
- When the activity to start is a charging activity, another approach is used as it is not necessary to estimate this SoC based on historic data. Even if it could be a solution, it is more efficient to implement a charging model of the batteries to calculate the estimated SoC.
- Being able to predict the effect of changes in operational conditions on the SoC of vehicles in service, operators can mitigate potential problems at an early stage. This reduces the number of failed journeys in the current operation that impact the public's travel experience and provides confidence to create more efficient schedules that use less conservative efficiency rates.
- These schedules with lower SoC safety margins for future operation reduce the number of vehicles required. This leads to less kilometers driven and subsequently less energy used as well as less embedded carbon emissions from new vehicles if the current fleet can be used elsewhere.
- The method according to the invention is also relevant to improve scheduling and charging sessions.
- Indeed, an important objective in the energy management of a fleet of electric bus is to limit the energy demand peak at the charging depots.
- When the charging depots are not limited in demand, they can for instance provide 1130kW at their peak, allowing almost every vehicle of the fleet to get the required SoC, but such peak should be avoided.
- However, when it comes to reduce the electric demand peak, for instance at 800kW, in an unmanaged way, then a high percentage of vehicles (in our test about 20%) will be in a situation where they will fail to make the schedule, because of a non-completed charging session.
- We could observe that using our dynamic estimation method to calculate the schedules and organize the charging sessions over the days, allows to limit the electric demand peak at 800kw, with the same success rate than when there is no limit in the unmanaged way.
- As already explained, the Energy Demand in kWh is equal to the Net Energy Consumption at the end of the last non charging activity before each charge activity in each of the vehicle blocks that are generated by the planning or scheduling tool.
- Therefore, we can visualize what the power drawn over the day will be when we let the vehicles charge unmanaged, from the moment they arrive at the charge locations, versus what it will be when we limit the maximum charge current.
- We can produce a table of charging session requirements using the blocks of vehicles scheduled for the current day (as shown on the in-service vehicle table) and use the net energy consumed from the baseline estimate, i.e., at the beginning of the day, or the dynamic estimate, i.e., during the day, to calculate the energy demand for each charging session.
- This will allow us to see what the maximum energy consumption would be, in an unmanaged load with unlimited grid capacity, or how many outages we might have, in a managed load with limited grid capacity.
Claims (7)
- Computer-implemented method (1) for optimizing the energy management of a fleet of electric transportation vehicles comprising:Providing an operation schedule for a given timeframe; said operation schedule comprising for each vehicle a plurality of activities to complete, said plurality of activities comprising at least one journey;Providing (10) a database of historic data; said historic data being configured to associate at least one performance index, with a plurality of data attributes, for instance as vehicle type, a transportation line, the outside temperature, daytime, driver's performance, day type;And for each vehicle of the fleet, before performing each of the said at least one journey of the schedule:Acquiring (16) a set of attributes for the upcoming journey, said set of attributes comprising the same type of attributes as the set of attributes of the provided historic data;Converting (18) at least one attributes of the set of attributes into a range of values; said range of values replacing said attribute in the set of attributes acquired;Launching a query (20) in said database in order to obtain at least one performance index;If said query returns (22) at least one performance index, calculating an expected state of charge of the battery at the end of the upcoming journey;Comparing (26) said expected state of charge with a predetermined state of charge limit; and if said expected state of charge is lower than said predetermined state of charge limit, deliver a signal on a human-machine interface to signal a potential failure of said upcoming journey.
- Computer-implemented method (1) according to claim 1 wherein said performance index comprises an efficiency value or a couple of values of energy and distance.
- Computer-implemented method (1) according to claim 1 or 2, wherein the historic data are stored in a data-cube.
- Computer-implemented method (1) according to any one of claim 1 to 3, wherein if the query (20) returns no answer, then the method comprises in a repetitive manner, until the query returns at least one performance index, a step of:- reducing (24) the number of attributes in the set of attributes, according to a predetermined pattern, and- relaunch a query (20).
- Computer-implemented method (1) according to any one of claims 1 to 4, wherein after an activity is completed by a vehicle, the database stores the activity distance and the energy consumed during the activity along with the set of attributes calculated before starting the activity.
- A graphical user interface (3) for optimizing the energy management of a fleet of electric transportation vehicles, said interface comprising a list (31) of vehicles of the electric vehicle fleet, each electric vehicle being associated with a plurality of intended activities;each vehicle of the list comprising a battery indicator (316) associated with vehicle,characterized in that the battery indicator (316) is formed of an image representing the measured SoC of the battery and colorized in function of the estimated SoC at the end of the next scheduled activity.
- The graphical user interface (3) according to claim 6, wherein said estimated SoC at the end of the next scheduled activity is calculated by the implementation of the method according to any of claims 1 to 5.
Priority Applications (3)
| Application Number | Priority Date | Filing Date | Title |
|---|---|---|---|
| EP22216353.7A EP4390786A1 (en) | 2022-12-23 | 2022-12-23 | Method for optimizing the energy management of a fleet of electric transportation vehicles, more particularly a fleet of electric buses |
| AU2023285835A AU2023285835A1 (en) | 2022-12-23 | 2023-12-21 | Method for optimizing the energy management of a fleet of electric transportation vehicles, more particularly a fleet of electric buses |
| US18/394,426 US12535327B2 (en) | 2022-12-23 | 2023-12-22 | Method for optimizing the energy management of a fleet of electronic transportation vehicles, more particularly a fleet of electric buses |
Applications Claiming Priority (1)
| Application Number | Priority Date | Filing Date | Title |
|---|---|---|---|
| EP22216353.7A EP4390786A1 (en) | 2022-12-23 | 2022-12-23 | Method for optimizing the energy management of a fleet of electric transportation vehicles, more particularly a fleet of electric buses |
Publications (1)
| Publication Number | Publication Date |
|---|---|
| EP4390786A1 true EP4390786A1 (en) | 2024-06-26 |
Family
ID=84604189
Family Applications (1)
| Application Number | Title | Priority Date | Filing Date |
|---|---|---|---|
| EP22216353.7A Pending EP4390786A1 (en) | 2022-12-23 | 2022-12-23 | Method for optimizing the energy management of a fleet of electric transportation vehicles, more particularly a fleet of electric buses |
Country Status (3)
| Country | Link |
|---|---|
| US (1) | US12535327B2 (en) |
| EP (1) | EP4390786A1 (en) |
| AU (1) | AU2023285835A1 (en) |
Families Citing this family (1)
| Publication number | Priority date | Publication date | Assignee | Title |
|---|---|---|---|---|
| US12361350B2 (en) * | 2023-01-19 | 2025-07-15 | Volkswagen Group of America Investments, LLC | Method for autonomous vehicle resource allocation and scheduling |
Citations (3)
| Publication number | Priority date | Publication date | Assignee | Title |
|---|---|---|---|---|
| US20170010114A1 (en) * | 2012-01-09 | 2017-01-12 | Airbiquity Inc. | Electric vehicle charging network services |
| GB2546565A (en) * | 2016-01-20 | 2017-07-26 | Mahindra Reva Electric Vehicles Ltd | A method and system for trip planning for vehicles with limited on-board energy |
| US20200166356A1 (en) * | 2018-11-27 | 2020-05-28 | Here Global B.V. | Method, apparatus, and computer program product for predicting range of an electric vehicle |
Family Cites Families (3)
| Publication number | Priority date | Publication date | Assignee | Title |
|---|---|---|---|---|
| US12296721B2 (en) * | 2021-12-10 | 2025-05-13 | Sustainable Energy Technologies, Inc. | Method and systems to trickle charge electric vehicle's supercapacitors using solar energy |
| US20230234592A1 (en) * | 2022-01-26 | 2023-07-27 | Wireless Advanced Vehicle Electrification, Llc | Electric vehicle fleet optimization based on driver behavior |
| US12242984B2 (en) * | 2022-07-05 | 2025-03-04 | GM Global Technology Operations LLC | Ownership cost optimization for fleet with electric vehicles |
-
2022
- 2022-12-23 EP EP22216353.7A patent/EP4390786A1/en active Pending
-
2023
- 2023-12-21 AU AU2023285835A patent/AU2023285835A1/en active Pending
- 2023-12-22 US US18/394,426 patent/US12535327B2/en active Active
Patent Citations (3)
| Publication number | Priority date | Publication date | Assignee | Title |
|---|---|---|---|---|
| US20170010114A1 (en) * | 2012-01-09 | 2017-01-12 | Airbiquity Inc. | Electric vehicle charging network services |
| GB2546565A (en) * | 2016-01-20 | 2017-07-26 | Mahindra Reva Electric Vehicles Ltd | A method and system for trip planning for vehicles with limited on-board energy |
| US20200166356A1 (en) * | 2018-11-27 | 2020-05-28 | Here Global B.V. | Method, apparatus, and computer program product for predicting range of an electric vehicle |
Non-Patent Citations (2)
| Title |
|---|
| "Database and Expert Systems Applications", vol. 2453, 2 September 2002, SPRINGER BERLIN HEIDELBERG, Berlin, Heidelberg, ISBN: 978-3-540-46146-3, ISSN: 0302-9743, article LOH ZHENG XUAN ET AL: "Adaptive Method for Range Top-k Queries in OLAP Data Cubes", pages: 648 - 657, XP093046823, DOI: 10.1007/3-540-46146-9_64 * |
| MISHRA CHAITANYA ET AL: "Interactive query refinement", EXTENDING DATABASE TECHNOLOGY, 24 March 2009 (2009-03-24), 2 Penn Plaza, Suite 701 New York NY 10121-0701 USA, pages 862 - 873, XP093046869, ISBN: 978-1-60558-422-5, Retrieved from the Internet <URL:https://dl.acm.org/doi/pdf/10.1145/1516360.1516459> [retrieved on 20230515], DOI: 10.1145/1516360.1516459 * |
Also Published As
| Publication number | Publication date |
|---|---|
| US12535327B2 (en) | 2026-01-27 |
| AU2023285835A1 (en) | 2024-07-11 |
| US20240210188A1 (en) | 2024-06-27 |
Similar Documents
| Publication | Publication Date | Title |
|---|---|---|
| CN109795371A (en) | Electric vehicle charging based reminding method and device based on mobile terminal route planning | |
| US8543287B2 (en) | System, method and computer program for simulating vehicle energy use | |
| US8849499B2 (en) | Methods and systems for monitoring a vehicle's energy source | |
| CN117391564B (en) | New energy logistics vehicle energy supplementing and scheduling data model and scheduling optimization method | |
| JP7068852B2 (en) | Vehicle selection device and method | |
| JP2017112830A (en) | Supply power management device, vehicle-mounted device, and electric vehicle | |
| CN113312699A (en) | Techniques for energy scheduling optimization for hybrid architecture vehicles | |
| US12400156B2 (en) | Systems and methods for data-driven energy management of a vehicle fleet with electric vehicles | |
| Bauer et al. | Leveraging big data and coordinated charging for effective taxi fleet electrification: The 100% EV conversion of Shenzhen, China | |
| Purnell et al. | Impacts of electrifying public transit on the electricity grid, from regional to state level analysis | |
| WO2024239494A1 (en) | Intelligent reservation charging method and device for extended-range plug-in hybrid electric vehicle, and computer system | |
| US12535327B2 (en) | Method for optimizing the energy management of a fleet of electronic transportation vehicles, more particularly a fleet of electric buses | |
| CN106682759A (en) | Battery supply system and network optimization method for electric taxis | |
| US12031833B2 (en) | Devices for range estimation in battery powered vehicles | |
| CN116432985A (en) | Intelligent community information processing method and system based on Internet of things | |
| Burke et al. | Evaluation of the Economics of Battery-Electric and Fuel Cell Trucks and Buses: Methods | |
| JP2022117137A (en) | Information processing device, information processing method, and information processing system | |
| Liu et al. | Evaluation of Mixed Electric Fleet for Ride-Hailing Services under California's Clean Miles Standard: A Case Study in San Francisco | |
| Brockmann et al. | Break-and-Charge: Leveraging EU regulations to enhance electric truck competitiveness | |
| JP7771819B2 (en) | Vehicle allocation planning system | |
| CN119151652B (en) | A car rental management system and method | |
| WO2023145066A1 (en) | Electric vehicle management device, electric vehicle management method, and program | |
| CN120672005A (en) | Battery management method and system for battery replacement electric motorcade | |
| Villa et al. | Generating stochastic mobility and charging profiles with high technological detail for electric vehicle applications | |
| CN118710010A (en) | Intelligent dispatching system for power batteries of urban electric buses |
Legal Events
| Date | Code | Title | Description |
|---|---|---|---|
| PUAI | Public reference made under article 153(3) epc to a published international application that has entered the european phase |
Free format text: ORIGINAL CODE: 0009012 |
|
| STAA | Information on the status of an ep patent application or granted ep patent |
Free format text: STATUS: THE APPLICATION HAS BEEN PUBLISHED |
|
| AK | Designated contracting states |
Kind code of ref document: A1 Designated state(s): AL AT BE BG CH CY CZ DE DK EE ES FI FR GB GR HR HU IE IS IT LI LT LU LV MC ME MK MT NL NO PL PT RO RS SE SI SK SM TR |
|
| STAA | Information on the status of an ep patent application or granted ep patent |
Free format text: STATUS: REQUEST FOR EXAMINATION WAS MADE |
|
| 17P | Request for examination filed |
Effective date: 20250102 |