EP4386664A1 - A method of identifying non-conformance of a component - Google Patents
A method of identifying non-conformance of a component Download PDFInfo
- Publication number
- EP4386664A1 EP4386664A1 EP23211548.5A EP23211548A EP4386664A1 EP 4386664 A1 EP4386664 A1 EP 4386664A1 EP 23211548 A EP23211548 A EP 23211548A EP 4386664 A1 EP4386664 A1 EP 4386664A1
- Authority
- EP
- European Patent Office
- Prior art keywords
- component
- histogram
- volume
- template
- voxel value
- Prior art date
- Legal status (The legal status is an assumption and is not a legal conclusion. Google has not performed a legal analysis and makes no representation as to the accuracy of the status listed.)
- Pending
Links
Images



Classifications
-
- G—PHYSICS
- G06—COMPUTING OR CALCULATING; COUNTING
- G06T—IMAGE DATA PROCESSING OR GENERATION, IN GENERAL
- G06T7/00—Image analysis
- G06T7/0002—Inspection of images, e.g. flaw detection
- G06T7/0004—Industrial image inspection
- G06T7/001—Industrial image inspection using an image reference approach
-
- G—PHYSICS
- G06—COMPUTING OR CALCULATING; COUNTING
- G06T—IMAGE DATA PROCESSING OR GENERATION, IN GENERAL
- G06T7/00—Image analysis
- G06T7/10—Segmentation; Edge detection
- G06T7/136—Segmentation; Edge detection involving thresholding
-
- G—PHYSICS
- G06—COMPUTING OR CALCULATING; COUNTING
- G06T—IMAGE DATA PROCESSING OR GENERATION, IN GENERAL
- G06T7/00—Image analysis
- G06T7/10—Segmentation; Edge detection
- G06T7/194—Segmentation; Edge detection involving foreground-background segmentation
-
- G—PHYSICS
- G06—COMPUTING OR CALCULATING; COUNTING
- G06T—IMAGE DATA PROCESSING OR GENERATION, IN GENERAL
- G06T2200/00—Indexing scheme for image data processing or generation, in general
- G06T2200/04—Indexing scheme for image data processing or generation, in general involving 3D image data
-
- G—PHYSICS
- G06—COMPUTING OR CALCULATING; COUNTING
- G06T—IMAGE DATA PROCESSING OR GENERATION, IN GENERAL
- G06T2207/00—Indexing scheme for image analysis or image enhancement
- G06T2207/10—Image acquisition modality
- G06T2207/10072—Tomographic images
- G06T2207/10081—Computed x-ray tomography [CT]
-
- G—PHYSICS
- G06—COMPUTING OR CALCULATING; COUNTING
- G06T—IMAGE DATA PROCESSING OR GENERATION, IN GENERAL
- G06T2207/00—Indexing scheme for image analysis or image enhancement
- G06T2207/20—Special algorithmic details
- G06T2207/20021—Dividing image into blocks, subimages or windows
-
- G—PHYSICS
- G06—COMPUTING OR CALCULATING; COUNTING
- G06T—IMAGE DATA PROCESSING OR GENERATION, IN GENERAL
- G06T2207/00—Indexing scheme for image analysis or image enhancement
- G06T2207/20—Special algorithmic details
- G06T2207/20072—Graph-based image processing
-
- G—PHYSICS
- G06—COMPUTING OR CALCULATING; COUNTING
- G06T—IMAGE DATA PROCESSING OR GENERATION, IN GENERAL
- G06T2207/00—Indexing scheme for image analysis or image enhancement
- G06T2207/30—Subject of image; Context of image processing
- G06T2207/30108—Industrial image inspection
- G06T2207/30164—Workpiece; Machine component
Definitions
- the present disclosure concerns a method of identifying non-conformance of a manufactured component.
- Safety critical components or components which have complex manufacturing method may require individual testing or analysis to ensure that they meet desired manufacturing tolerances. Identifying internal defects in a component is complex and computationally inefficient, even when there are large defects.
- a method of identifying non-conformance of a manufactured component comprising:
- the voxel value relates to the properties of the material within the respective sub-volume, as detected from how incident electromagnetic waves interacted with that sub-volume of space.
- the volumetric scan may comprise computational tomography (i.e., CT scan) using x-rays or gamma rays.
- the comparison comprises comparing a characteristic of the component histogram and the template histogram, wherein the characteristic comprises any of;
- the onset of the curve up to a peak may require identification of a peak voxel value by finding the voxel value at which the gradient of a curve joining points on the histogram is zero, and determining the onset of a curve at a voxel value above or below the peak voxel value at which the gradient is above or below a threshold gradient. It may be that the identification of differences comprises using machine learning or artificial intelligence.
- the characteristic which is compared between the component histogram and the template histogram may comprise multiple characteristics which are combined in a pre-determined equation or based on training data for machine learning.
- determining that there is a defect is based on the comparison of the characteristic of the component histogram to the template histogram showing a difference beyond a threshold. It may be that the threshold is determined dependent on the geometry of the component and/or the materials within the component.
- the defect is a gross defect which requires scrapping or remaking of the component.
- the template histogram is derived by performing a volumetric scan on one or more components known to have few or no defects.
- the template histogram is derived by performing CT on one or more components known to have a common defect, where the defect may be expected.
- the method further comprises: performing thresholding to separate the component from a background within the volume of space, generating the component histogram based on the voxels from the component only, by removing the voxels from the background.
- the method comprises: splitting the volume of space into separate smaller secondary-volumes; and generating separate component histograms for each secondary-volume and comparing against a respective histogram template.
- volume of space is split into expected materials of a multi-material component, such that a component histogram may be generated for each material and compared against a respective template histogram. This may help to identify the location of a defect if found.
- the method comprises performing x-ray computational tomography.
- a non-transitory computer readable medium comprising computer-readable instructions that, when read by a computer, causes the performance of a method in accordance with the first aspect.
- a computer program that, when read by a computer causes the performance of a method in accordance with the first aspect.
- a gas turbine engine is generally indicated at 10, having a principal and rotational axis 11.
- the engine 10 comprises, in axial flow series, an air intake 12, a propulsive fan 13, an intermediate pressure compressor 14, a high-pressure compressor 15, combustion equipment 16, a high-pressure turbine 17, an intermediate pressure turbine 18, a low-pressure turbine 19 and an exhaust nozzle 20.
- a nacelle 21 generally surrounds the engine 10 and defines both the intake 12 and the exhaust nozzle 20.
- the gas turbine engine 10 works in the conventional manner so that air entering the intake 12 is accelerated by the fan 13 to produce two air flows: a first air flow into the intermediate pressure compressor 14 and a second air flow which passes through a bypass duct 22 to provide propulsive thrust.
- the intermediate pressure compressor 14 compresses the air flow directed into it before delivering that air to the high pressure compressor 15 where further compression takes place.
- the compressed air exhausted from the high-pressure compressor 15 is directed into the combustion equipment 16 where it is mixed with fuel and the mixture combusted.
- the resultant hot combustion products then expand through, and thereby drive the high, intermediate and low-pressure turbines 17, 18, 19 before being exhausted through the nozzle 20 to provide additional propulsive thrust.
- the high 17, intermediate 18 and low 19 pressure turbines drive respectively the high pressure compressor 15, intermediate pressure compressor 14 and fan 13, each by suitable interconnecting shaft.
- gas turbine engines to which the present disclosure may be applied may have alternative configurations.
- such engines may have an alternative number of interconnecting shafts (e.g. two) and/or an alternative number of compressors and/or turbines.
- the engine may comprise a gearbox provided in the drive train from a turbine to a compressor and/or fan.
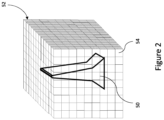
- Figure 2 shows a manufactured component 50, which in this example is a turbine blade.
- the component 50 is shown within a volume of space 52 for imaging, which is divided into a plurality of sub-volumes 54 of equal size.
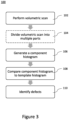
- Figure 3 is a flow chart showing steps of a method 100 of identifying non-conformance of a manufactured component 50, such as the turbine blade 50 shown in Figure 2 .
- the method 100 comprises block 102 in which a volumetric scan is performed.
- the volumetric scan may be any scan which is capable of generating a 3-dimensional (3D) image of the volume of space 52 containing the component 50 by dividing the volume of space 52 into sub-volumes 54 and assigning values to each of the sub-volumes 54.
- the volumetric scan is a computational tomography (CT) scan using x-rays.
- CT scan may be using gamma rays
- the volumetric scan may be any other suitable scanning method which can generate a 3D image.
- a 3D image is generated in block 102 of the volume of space 52 including the component 50.
- the 3D image comprises a plurality of voxels, with each voxel representing a respective sub-volume 54 of the volume of space 52.
- Each voxel is assigned a voxel value relating to properties of the material within the respective sub-volume 54 which the voxel represents.
- Voxel values in CT scans are typically referred to as a Grey-scale value between 0 and a high number, such as 100.
- the voxel value in the x-ray CT scan represents the opacity of the material within the sub-volume to x-rays, with the 3D image being generated based on detection of incident x-rays passing through the volume of space 52. Therefore, the voxel value of each sub-volume 54 indicates how incident electromagnetic waves interact with the respective sub-volume 54.
- the opacity of the material to x-rays relates to the properties of the material, such as the material type and density with a denser material resulting in a higher voxel value than a less dense material.
- the method 100 may comprise dividing the volumetric scan into multiple parts. For example, the entire 3D image generated in the volumetric scan may be separated into different sections in a predefined fashion, such as by separating a plurality of different blades in the same scan.
- the volume of space may be divided into separate smaller secondary volumes, such as by dividing the volume of space into 27 equal sized cubic volumes (i.e., a matrix of 3 x 3 x 3 smaller secondary volumes, which together may the whole volume of space 52).
- the volume of space 52 may be split into no-equal parts, for example, into expected materials of a multi-material component.
- the method 100 may comprise performing thresholding on the data generated by the volumetric scan to separate a shape of the voxels which belong to the component 50 from the voxels which belong to an empty background in the volume of space 52.
- Thresholding may include selecting a voxel value at which an edge or background may be identified, and separating the histogram into parts based on the selected voxel value, or using the voxel value as a starting point at which to review neighbouring voxels to determine where an edge of the component or background starts.
- the method 100 may not include block 104 and/or thresholding, and may simply continue without dividing the volumetric scan into multiple parts and/or without separating the component from the background.
- the thresholding is more computationally intensive than the dividing of the volumetric scan in a predefined manner in block 104.
- the method 100 comprises generating a component histogram 150 in which a chart is made of the frequency of each voxel value within the volume of space 52.
- Figure 5 shows an example component histogram 150, generated from the turbine blade in Figure 2 for example, as a dotted line on a graph mapping voxel value on the x-axis and voxel count on the y-axis. It will be appreciated that, in some examples, when the method 100 includes block 104, multiple component histograms may be generated each based on a respective smaller secondary volume of space.
- the component histogram of only the voxels corresponding to a smaller secondary volume may be generated in block 106, by removing the voxels from the other secondary volumes.
- the example component histogram 150 shown in Figure 5 has two distinct peaks.
- a first peak 152 is close to a voxel value of zero and represents the empty space in the volume of space 52. Th empty space may include the background and internal cavities in the component 50.
- a second peak 154 in this example represents a single material that the component 50 is made from. If there are multiple materials in the component which are not separated into separate component histograms, or a single material with varying densities, there may be more than two peaks in the component histogram. If the component histogram represents only the component 50 due to the background voxels being removed, there may be only a single peak, or no obvious peak in the component histogram.
- the method 100 comprises comparing the component histogram 150 to a template histogram 160 to identify differences between the component histogram 150 and the template histogram 160. If there are multiple component histograms representing different secondary volumes or materials, each separate component histogram may be compared to a respective template histogram.
- the template histogram 160 may be derived by performing a similar volumetric scan, such as an x-ray CT scan, on one or more components known to have few or no defects. Performing the volumetric scan on multiple components known to have no defects, and averaging the voxel counts at each voxel value, to produce the template histogram, can account for allowable tolerances in manufacturing which will produce some variation in the component.
- the template may be derived by performing a volumetric scan on a component known to have a specific defect, which may be a common defect.
- the template histogram may be theoretically derived based on a defect free component, or a component with a known defect.
- defects may be identified in the component 50.
- the template histogram represents a defect free component
- any deviation of the component histogram 150 from the template histogram may indicate a defect.
- the template histogram represents a component with a known defect
- a defect may be identified in the component if the component histogram 150 corresponds with the template histogram.
- the method 100 comprises determining whether there is a defect in the component 50 based on the comparison between the component histogram 150 and the template histogram 160.
- the template histogram 160 represents a component which has no defects. Therefore, differences between the component histogram 150 and the template histogram 160 may indicate the presence of a defect in the component 50. If image scan data is separated into multiple component histograms representing a different material, or smaller secondary volumes of space, if differences between respective component histograms and template histograms are found, this may help to identify the location of a defect.
- Figure 5 shows an example template histogram 160 as a solid line.
- the template histogram in this example also comprises a first peak 162 and a second peak 164 which are in similar locations to the first peak 152 and second peak 154 respectively of the component histogram 150.
- the voxel count of the first peak 152 of the component histogram 150 is higher than the voxel count of the first peak 162 of the template histogram 160.
- the second peak 154 of the component histogram 150 has a lower voxel count than the second peak 164 of the template histogram 160. This could indicate the presence of unexpected cavities in the component 50, where there is supposed to be material.
- Figure 4 is a flow chart showing further steps of blocks 108 and 110 to compare the component histogram 150 to the template histogram 160 and to identify a defect.
- a characteristic of the component histogram 150 is compared against the same characteristic of the template histogram 160.
- the characteristic may comprise any of peak frequencies of voxel value, integrated total area, standard deviation of voxel value, height of peak frequencies, relative height of a peak frequency such as width at mid height of a bell curve, mean voxel value, width of a frequency bell curve of the voxel value, gradient of a frequency bell curve of the voxel value, median voxel value and/or voxel value at an onset of a curve up to a peak.
- the onset of the curve up to a peak may require identification of a peak voxel value by finding the voxel value at which the gradient of a curve joining points on the histogram is zero, and determining the onset of a curve at a voxel value above or below the peak voxel value at which the gradient is above or below a threshold gradient.
- the characteristic which is compared between the component histogram 150 and the template histogram 160 may comprise multiple characteristics which are combined in a pre-determined equation, or may be based on training data for machine learning. Therefore, the identification of differences may comprise using machine learning or artificial intelligence.
- the method comprises identifying whether there is a difference in the characteristic between the component histogram 150 and the template histogram 160.
- the first peak 162 of the template histogram 160 has a voxel value at P1
- the second peak 164 of the template histogram 160 has a voxel value at P2. If the first peak 152 or the second peak 154 of the component histogram 150 are not at the same voxel values as the first peak 162 and second peak 164 respectively of the template histogram 160, then block 114 may determine that there is a difference.
- the method 100 proceeds to block 116.
- the difference in characteristic between the component histogram 150 and the template histogram 160 may be compared against a threshold, so that, if the difference between the characteristic of the component histogram 150 and the template histogram 160 is above the threshold, it is determined that there is a difference in block 114, and the method 100 proceeds to block 116. If the difference is below the threshold, it is determined that there is no difference, and the method 100 returns to block 112 to compare a different characteristic, or proceeds to block 118 to identify the component 50 as defect free.
- the threshold may be determined based on the geometry of the component and/or the materials within the component. For example, the threshold difference in a peak voxel count may be dependent on and relative to the voxel count of the peak in the template histogram, such as 5% difference in the voxel count.
- the method may proceed to block 116 if it is determined that there is no difference in characteristic between the component histogram and the template histogram, and may proceed to block 118 if it is determined that there is a difference in the characteristic between the component histogram and the template histogram.
- This method may be suitable primarily for identifying gross defects which require scrapping or remaking of the component 50. Therefore, an identification that the component is defect free in block 118 may be that the component is free of gross defects which requires scrapping of the component.
- the method may be a computer-implemented method, and may be stored as a computer program with computer-readable instructions on a non- transitory computer readable medium which, when read by a computer, causes the performance of the method 100.
Landscapes
- Engineering & Computer Science (AREA)
- Computer Vision & Pattern Recognition (AREA)
- Physics & Mathematics (AREA)
- General Physics & Mathematics (AREA)
- Theoretical Computer Science (AREA)
- Quality & Reliability (AREA)
- Analysing Materials By The Use Of Radiation (AREA)
Abstract
There is disclosed a method of identifying non-conformance of a manufactured component, the method comprising: performing a volumetric scan to generate a 3-dimensional (3D) image of a volume of space containing the component, the 3D image comprising a plurality of voxels, each voxel representing a sub-volume within the volume of space and assigned a voxel value relating to properties of the material in the sub-volume; generating a component histogram giving the frequency of each voxel value within the volume of space; and comparing the component histogram to a template histogram, and identifying differences between the component histogram and the template histogram, and based on the comparison, determining whether there is a defect in the component.
Description
- The present disclosure concerns a method of identifying non-conformance of a manufactured component.
- Safety critical components or components which have complex manufacturing method may require individual testing or analysis to ensure that they meet desired manufacturing tolerances. Identifying internal defects in a component is complex and computationally inefficient, even when there are large defects.
- According to a first aspect there is provided a method of identifying non-conformance of a manufactured component, the method comprising:
- performing a volumetric scan to generate a 3-dimensional (3D) image of a volume of space containing the component, the 3D image comprising a plurality of voxels, each voxel representing a sub-volume within the volume of space and assigned a voxel value relating to properties of the material in the sub-volume;
- generating a component histogram giving the frequency of each voxel value within the volume of space; and
- comparing the component histogram to a template histogram, and identifying differences between the component histogram and the template histogram, and
- based on the comparison, determining whether there is a defect in the component.
- It may be that the voxel value relates to the properties of the material within the respective sub-volume, as detected from how incident electromagnetic waves interacted with that sub-volume of space. The volumetric scan may comprise computational tomography (i.e., CT scan) using x-rays or gamma rays.
- It may be that the comparison comprises comparing a characteristic of the component histogram and the template histogram, wherein the characteristic comprises any of;
- peak frequencies of voxel value;
- integrated total area;
- standard deviation of voxel value;
- height of peak frequencies;
- mean voxel value;
- width of a frequency bell curve;
- gradient of a frequency bell curve;
- median voxel value; and/or
- onset of a curve up to a peak.
- The onset of the curve up to a peak may require identification of a peak voxel value by finding the voxel value at which the gradient of a curve joining points on the histogram is zero, and determining the onset of a curve at a voxel value above or below the peak voxel value at which the gradient is above or below a threshold gradient. It may be that the identification of differences comprises using machine learning or artificial intelligence.
- The characteristic which is compared between the component histogram and the template histogram may comprise multiple characteristics which are combined in a pre-determined equation or based on training data for machine learning.
- It may be that determining that there is a defect is based on the comparison of the characteristic of the component histogram to the template histogram showing a difference beyond a threshold. It may be that the threshold is determined dependent on the geometry of the component and/or the materials within the component.
- It may be that the defect is a gross defect which requires scrapping or remaking of the component.
- It may be that the template histogram is derived by performing a volumetric scan on one or more components known to have few or no defects.
- It may be that the template histogram is derived by performing CT on one or more components known to have a common defect, where the defect may be expected.
- It may be that the method further comprises: performing thresholding to separate the component from a background within the volume of space, generating the component histogram based on the voxels from the component only, by removing the voxels from the background.
- It may be that the method comprises: splitting the volume of space into separate smaller secondary-volumes; and generating separate component histograms for each secondary-volume and comparing against a respective histogram template.
- It may be that the volume of space is split into expected materials of a multi-material component, such that a component histogram may be generated for each material and compared against a respective template histogram. This may help to identify the location of a defect if found.
- It may be that the method comprises performing x-ray computational tomography.
- According to a second aspect, there is provided a non-transitory computer readable medium comprising computer-readable instructions that, when read by a computer, causes the performance of a method in accordance with the first aspect.
- According to a third aspect, there is provided a computer program that, when read by a computer causes the performance of a method in accordance with the first aspect.
- The skilled person will appreciate that except where mutually exclusive, a feature described in relation to any one of the above aspects may be applied mutatis mutandis to any other aspect. Furthermore except where mutually exclusive any feature described herein may be applied to any aspect and/or combined with any other feature described herein.
- Embodiments will now be described by way of example only, with reference to the Figures, in which:
-
Figure 1 is a sectional side view of a gas turbine engine; -
Figure 2 schematically shows a 3D volumetric scan of a manufactured component; -
Figure 3 is a flow chart showing steps of a method of identifying non-conformance of the component; -
Figure 4 is a flow chart showing steps of a method of comparing histograms; and -
Figure 5 is an example histogram generated in the method ofFigure 3 , for identifying non-conformance. - With reference to
Figure 1 , a gas turbine engine is generally indicated at 10, having a principal androtational axis 11. Theengine 10 comprises, in axial flow series, anair intake 12, apropulsive fan 13, anintermediate pressure compressor 14, a high-pressure compressor 15,combustion equipment 16, a high-pressure turbine 17, anintermediate pressure turbine 18, a low-pressure turbine 19 and anexhaust nozzle 20. Anacelle 21 generally surrounds theengine 10 and defines both theintake 12 and theexhaust nozzle 20. - The
gas turbine engine 10 works in the conventional manner so that air entering theintake 12 is accelerated by thefan 13 to produce two air flows: a first air flow into theintermediate pressure compressor 14 and a second air flow which passes through abypass duct 22 to provide propulsive thrust. Theintermediate pressure compressor 14 compresses the air flow directed into it before delivering that air to thehigh pressure compressor 15 where further compression takes place. - The compressed air exhausted from the high-
pressure compressor 15 is directed into thecombustion equipment 16 where it is mixed with fuel and the mixture combusted. The resultant hot combustion products then expand through, and thereby drive the high, intermediate and low-pressure turbines nozzle 20 to provide additional propulsive thrust. The high 17, intermediate 18 and low 19 pressure turbines drive respectively thehigh pressure compressor 15,intermediate pressure compressor 14 andfan 13, each by suitable interconnecting shaft. - Other gas turbine engines to which the present disclosure may be applied may have alternative configurations. By way of example such engines may have an alternative number of interconnecting shafts (e.g. two) and/or an alternative number of compressors and/or turbines. Further the engine may comprise a gearbox provided in the drive train from a turbine to a compressor and/or fan.
-
Figure 2 shows a manufacturedcomponent 50, which in this example is a turbine blade. Thecomponent 50 is shown within a volume ofspace 52 for imaging, which is divided into a plurality ofsub-volumes 54 of equal size. -
Figure 3 is a flow chart showing steps of amethod 100 of identifying non-conformance of a manufacturedcomponent 50, such as theturbine blade 50 shown inFigure 2 . - The
method 100 comprisesblock 102 in which a volumetric scan is performed. The volumetric scan may be any scan which is capable of generating a 3-dimensional (3D) image of the volume ofspace 52 containing thecomponent 50 by dividing the volume ofspace 52 intosub-volumes 54 and assigning values to each of the sub-volumes 54. In this example, the volumetric scan is a computational tomography (CT) scan using x-rays. In other examples, the CT scan may be using gamma rays, or the volumetric scan may be any other suitable scanning method which can generate a 3D image. - A 3D image is generated in
block 102 of the volume ofspace 52 including thecomponent 50. The 3D image comprises a plurality of voxels, with each voxel representing arespective sub-volume 54 of the volume ofspace 52. Each voxel is assigned a voxel value relating to properties of the material within therespective sub-volume 54 which the voxel represents. Voxel values in CT scans are typically referred to as a Grey-scale value between 0 and a high number, such as 100. The voxel value in the x-ray CT scan represents the opacity of the material within the sub-volume to x-rays, with the 3D image being generated based on detection of incident x-rays passing through the volume ofspace 52. Therefore, the voxel value of each sub-volume 54 indicates how incident electromagnetic waves interact with therespective sub-volume 54. The opacity of the material to x-rays relates to the properties of the material, such as the material type and density with a denser material resulting in a higher voxel value than a less dense material. - In
block 104, themethod 100 may comprise dividing the volumetric scan into multiple parts. For example, the entire 3D image generated in the volumetric scan may be separated into different sections in a predefined fashion, such as by separating a plurality of different blades in the same scan. In some examples, the volume of space may be divided into separate smaller secondary volumes, such as by dividing the volume of space into 27 equal sized cubic volumes (i.e., a matrix of 3 x 3 x 3 smaller secondary volumes, which together may the whole volume of space 52). In other examples, the volume ofspace 52 may be split into no-equal parts, for example, into expected materials of a multi-material component. - The
method 100 may comprise performing thresholding on the data generated by the volumetric scan to separate a shape of the voxels which belong to thecomponent 50 from the voxels which belong to an empty background in the volume ofspace 52. Thresholding may include selecting a voxel value at which an edge or background may be identified, and separating the histogram into parts based on the selected voxel value, or using the voxel value as a starting point at which to review neighbouring voxels to determine where an edge of the component or background starts. - In other examples, the
method 100 may not includeblock 104 and/or thresholding, and may simply continue without dividing the volumetric scan into multiple parts and/or without separating the component from the background. The thresholding is more computationally intensive than the dividing of the volumetric scan in a predefined manner inblock 104. - In
block 106, themethod 100 comprises generating acomponent histogram 150 in which a chart is made of the frequency of each voxel value within the volume ofspace 52.Figure 5 shows anexample component histogram 150, generated from the turbine blade inFigure 2 for example, as a dotted line on a graph mapping voxel value on the x-axis and voxel count on the y-axis. It will be appreciated that, in some examples, when themethod 100 includesblock 104, multiple component histograms may be generated each based on a respective smaller secondary volume of space. For example, in a method in which the volumetric scan is divided into multiple smaller secondary volumes inblock 104, the component histogram of only the voxels corresponding to a smaller secondary volume may be generated inblock 106, by removing the voxels from the other secondary volumes. - The
example component histogram 150 shown inFigure 5 has two distinct peaks. Afirst peak 152 is close to a voxel value of zero and represents the empty space in the volume ofspace 52. Th empty space may include the background and internal cavities in thecomponent 50. Asecond peak 154 in this example represents a single material that thecomponent 50 is made from. If there are multiple materials in the component which are not separated into separate component histograms, or a single material with varying densities, there may be more than two peaks in the component histogram. If the component histogram represents only thecomponent 50 due to the background voxels being removed, there may be only a single peak, or no obvious peak in the component histogram. - In
block 108, themethod 100 comprises comparing thecomponent histogram 150 to atemplate histogram 160 to identify differences between thecomponent histogram 150 and thetemplate histogram 160. If there are multiple component histograms representing different secondary volumes or materials, each separate component histogram may be compared to a respective template histogram. - The
template histogram 160 may be derived by performing a similar volumetric scan, such as an x-ray CT scan, on one or more components known to have few or no defects. Performing the volumetric scan on multiple components known to have no defects, and averaging the voxel counts at each voxel value, to produce the template histogram, can account for allowable tolerances in manufacturing which will produce some variation in the component. In other examples, the template may be derived by performing a volumetric scan on a component known to have a specific defect, which may be a common defect. In yet further examples, the template histogram may be theoretically derived based on a defect free component, or a component with a known defect. By comparing thecomponent histogram 150 to atemplate histogram 160, defects may be identified in thecomponent 50. For example, when the template histogram represents a defect free component, any deviation of thecomponent histogram 150 from the template histogram may indicate a defect. When the template histogram represents a component with a known defect, a defect may be identified in the component if thecomponent histogram 150 corresponds with the template histogram. - In
block 110, themethod 100 comprises determining whether there is a defect in thecomponent 50 based on the comparison between thecomponent histogram 150 and thetemplate histogram 160. In this example, thetemplate histogram 160 represents a component which has no defects. Therefore, differences between thecomponent histogram 150 and thetemplate histogram 160 may indicate the presence of a defect in thecomponent 50. If image scan data is separated into multiple component histograms representing a different material, or smaller secondary volumes of space, if differences between respective component histograms and template histograms are found, this may help to identify the location of a defect. -
Figure 5 shows anexample template histogram 160 as a solid line. The template histogram in this example also comprises a first peak 162 and asecond peak 164 which are in similar locations to thefirst peak 152 andsecond peak 154 respectively of thecomponent histogram 150. It can be readily seen that there are differences between thecomponent histogram 150 and thetemplate histogram 160. For example, the voxel count of thefirst peak 152 of thecomponent histogram 150 is higher than the voxel count of the first peak 162 of thetemplate histogram 160. Thesecond peak 154 of thecomponent histogram 150 has a lower voxel count than thesecond peak 164 of thetemplate histogram 160. This could indicate the presence of unexpected cavities in thecomponent 50, where there is supposed to be material. -
Figure 4 is a flow chart showing further steps ofblocks component histogram 150 to thetemplate histogram 160 and to identify a defect. In this example, in block 112 a characteristic of thecomponent histogram 150 is compared against the same characteristic of thetemplate histogram 160. For example, the characteristic may comprise any of peak frequencies of voxel value, integrated total area, standard deviation of voxel value, height of peak frequencies, relative height of a peak frequency such as width at mid height of a bell curve, mean voxel value, width of a frequency bell curve of the voxel value, gradient of a frequency bell curve of the voxel value, median voxel value and/or voxel value at an onset of a curve up to a peak. The onset of the curve up to a peak may require identification of a peak voxel value by finding the voxel value at which the gradient of a curve joining points on the histogram is zero, and determining the onset of a curve at a voxel value above or below the peak voxel value at which the gradient is above or below a threshold gradient. - The characteristic which is compared between the
component histogram 150 and thetemplate histogram 160 may comprise multiple characteristics which are combined in a pre-determined equation, or may be based on training data for machine learning. Therefore, the identification of differences may comprise using machine learning or artificial intelligence. - In
block 114, the method comprises identifying whether there is a difference in the characteristic between thecomponent histogram 150 and thetemplate histogram 160. For example, the first peak 162 of thetemplate histogram 160 has a voxel value at P1, and thesecond peak 164 of thetemplate histogram 160 has a voxel value at P2. If thefirst peak 152 or thesecond peak 154 of thecomponent histogram 150 are not at the same voxel values as the first peak 162 andsecond peak 164 respectively of thetemplate histogram 160, then block 114 may determine that there is a difference. - If it is determined, in
block 114, that there is a difference, themethod 100 proceeds to block 116. In some examples, inblock 114, the difference in characteristic between thecomponent histogram 150 and thetemplate histogram 160 may be compared against a threshold, so that, if the difference between the characteristic of thecomponent histogram 150 and thetemplate histogram 160 is above the threshold, it is determined that there is a difference inblock 114, and themethod 100 proceeds to block 116. If the difference is below the threshold, it is determined that there is no difference, and themethod 100 returns to block 112 to compare a different characteristic, or proceeds to block 118 to identify thecomponent 50 as defect free. The threshold may be determined based on the geometry of the component and/or the materials within the component. For example, the threshold difference in a peak voxel count may be dependent on and relative to the voxel count of the peak in the template histogram, such as 5% difference in the voxel count. - It will be appreciated that, in an example where the template histogram represents a component with a known defect, from
block 114, the method may proceed to block 116 if it is determined that there is no difference in characteristic between the component histogram and the template histogram, and may proceed to block 118 if it is determined that there is a difference in the characteristic between the component histogram and the template histogram. - This method may be suitable primarily for identifying gross defects which require scrapping or remaking of the
component 50. Therefore, an identification that the component is defect free inblock 118 may be that the component is free of gross defects which requires scrapping of the component. This presents a computationally efficient method of identifying potential defects, particularly large defects. Such identification of defects can result in efficient scrapping of parts without investing further time and resources in the manufactured component. It will be appreciated that themethod 100 can also be made more suitable for identifying smaller defects by dividing the volumetric scan into multiple parts, as this provides more granularity of the data. - The method may be a computer-implemented method, and may be stored as a computer program with computer-readable instructions on a non- transitory computer readable medium which, when read by a computer, causes the performance of the
method 100. - It will be understood that the invention is not limited to the embodiments above-described and various modifications and improvements can be made without departing from the concepts described herein. Except where mutually exclusive, any of the features may be employed separately or in combination with any other features and the disclosure extends to and includes all combinations and sub-combinations of one or more features described herein.
Claims (11)
- A method of identifying non-conformance of a manufactured component, the method comprising:performing a volumetric scan to generate a 3-dimensional (3D) image of a volume of space containing the component, the 3D image comprising a plurality of voxels, each voxel representing a sub-volume within the volume of space and assigned a voxel value relating to properties of the material in the sub-volume;generating a component histogram giving the frequency of each voxel value within the volume of space; andcomparing the component histogram to a template histogram, and identifying differences between the component histogram and the template histogram, andbased on the comparison, determining whether there is a defect in the component.
- A method according to claim 1, wherein the comparison comprises comparing a characteristic of the component histogram and the template histogram, wherein the characteristic comprises any of;peak frequencies of voxel value;integrated total area;standard deviation of voxel value;height of peak frequencies;mean voxel value;width of a frequency bell curve;gradient of a frequency bell curve;median voxel value; and/oronset of a curve up to a peak.
- A method according to claim 1 or 2, wherein determining that there is a defect is based on the comparison of the characteristic of the component histogram to the template histogram showing a difference beyond a threshold.
- A method according to claim 3, wherein the threshold is determined dependent on the geometry of the component and/or the materials within the component.
- A method according to any preceding claim, wherein the defect is a gross defect which requires scrapping or remaking of the component.
- A method according to any preceding claim, wherein the template histogram is derived by performing a volumetric scan on one or more components known to have few or no defects.
- A method according to any preceding claim, further comprising:performing thresholding to separate the component from a background within the volume of space,generating the component histogram based on the voxels from the component only, by removing the voxels from the background.
- A method according to any preceding claim, comprising:splitting the volume of space into separate smaller secondary-volumes; andgenerating separate component histograms for each secondary-volume and comparing against a respective histogram template.
- A method according to any preceding claim, comprising performing x-ray computational tomography.
- A non-transitory computer readable medium comprising computer-readable instructions that, when read by a computer, causes the performance of a method in accordance with any preceding claim.
- A computer program that, when read by a computer causes the performance of a method in accordance with any of claims 1-9.
Applications Claiming Priority (1)
| Application Number | Priority Date | Filing Date | Title |
|---|---|---|---|
| GBGB2218822.1A GB202218822D0 (en) | 2022-12-14 | 2022-12-14 | A method of identifying non-conformance of a component |
Publications (1)
| Publication Number | Publication Date |
|---|---|
| EP4386664A1 true EP4386664A1 (en) | 2024-06-19 |
Family
ID=84974835
Family Applications (1)
| Application Number | Title | Priority Date | Filing Date |
|---|---|---|---|
| EP23211548.5A Pending EP4386664A1 (en) | 2022-12-14 | 2023-11-22 | A method of identifying non-conformance of a component |
Country Status (3)
| Country | Link |
|---|---|
| US (1) | US20240202912A1 (en) |
| EP (1) | EP4386664A1 (en) |
| GB (1) | GB202218822D0 (en) |
Citations (2)
| Publication number | Priority date | Publication date | Assignee | Title |
|---|---|---|---|---|
| US20080226156A1 (en) * | 2007-02-19 | 2008-09-18 | Olympus Corporation | Defect detection apparatus and defect detection method |
| US20220358709A1 (en) * | 2021-05-05 | 2022-11-10 | Faro Technologies, Inc. | Surface determination using three-dimensional voxel data |
-
2022
- 2022-12-14 GB GBGB2218822.1A patent/GB202218822D0/en not_active Ceased
-
2023
- 2023-11-22 EP EP23211548.5A patent/EP4386664A1/en active Pending
- 2023-11-30 US US18/524,040 patent/US20240202912A1/en active Pending
Patent Citations (2)
| Publication number | Priority date | Publication date | Assignee | Title |
|---|---|---|---|---|
| US20080226156A1 (en) * | 2007-02-19 | 2008-09-18 | Olympus Corporation | Defect detection apparatus and defect detection method |
| US20220358709A1 (en) * | 2021-05-05 | 2022-11-10 | Faro Technologies, Inc. | Surface determination using three-dimensional voxel data |
Non-Patent Citations (3)
| Title |
|---|
| HINDELANG FLORINE ET AL: "Micro Computer Tomography for medical device and pharmaceutical packaging analysis", JOURNAL OF PHARMACEUTICAL AND BIOMEDICAL ANALYSIS, ELSEVIER B.V, AMSTERDAM, NL, vol. 108, 9 February 2015 (2015-02-09), pages 38 - 48, XP029202651, ISSN: 0731-7085, DOI: 10.1016/J.JPBA.2015.01.045 * |
| SCHULENBURG LENNART ET AL: "Inspection of Additive Manufactured Parts Using Computed Tomography: Part 2", THE NDT TECHNICIAN, 1 January 2021 (2021-01-01), pages 1 - 16, XP093148528, Retrieved from the Internet <URL:https://asnt.org/-/media/Files/Publications/TNT/TNT_20-1.pdf> [retrieved on 20240405] * |
| TRETIAK IRYNA ET AL: "A parametric study of segmentation thresholds for X-ray CT porosity characterisation in composite materials", COMPOSITES PART A, vol. 123, 1 August 2019 (2019-08-01), AMSTERDAM, NL, pages 10 - 24, XP093148669, ISSN: 1359-835X, Retrieved from the Internet <URL:https://www.sciencedirect.com/science/article/pii/S1359835X19301642?via%3Dihub> DOI: 10.1016/j.compositesa.2019.04.029 * |
Also Published As
| Publication number | Publication date |
|---|---|
| US20240202912A1 (en) | 2024-06-20 |
| GB202218822D0 (en) | 2023-01-25 |
Similar Documents
| Publication | Publication Date | Title |
|---|---|---|
| US20070188490A1 (en) | Apparatus, method and program for segmentation of mesh model data into analytic surfaces based on robust curvature estimation and region growing | |
| Wong et al. | Automatic borescope damage assessments for gas turbine blades via deep learning | |
| EP4386664A1 (en) | A method of identifying non-conformance of a component | |
| US20200103846A1 (en) | Blade sentencing | |
| Reitz et al. | Procedure for analyzing, manipulating and meshing of compressor blades to simulate their flow | |
| KR101811135B1 (en) | Apparatus and method for simplifying model through optimal level-of-detail decision | |
| Aretakis et al. | Classification of radial compressor faults using pattern-recognition techniques | |
| Gambitta et al. | Stator blades manufacturing geometrical variability in axial compressors and impact on the aeroelastic excitation forces | |
| US20250191163A1 (en) | Analysing images of components | |
| US9042634B2 (en) | Method system and computer product for non-destructive object analysis | |
| Guo et al. | Automatic lockbolt detection method for riveting quality evaluation based on specific geometric feature descriptors of 3D point cloud | |
| JP6320806B2 (en) | 3D model search method and 3D model search system | |
| Kaszynski et al. | Automated meshing algorithm for generating as-manufactured finite element models directly from as-measured fan blades and integrally bladed disks | |
| CN114723753B (en) | Rotor blade tip axial displacement calculation method based on tip image | |
| Li et al. | General and partial shape matching approaches on feature-based CAD models to support efficient part retrieval | |
| CN111795981B (en) | Methods of inspecting components using computed tomography | |
| Cuadros-Vargas et al. | Generating segmented tetrahedral meshes from regular volume data for simulation and visualization applications | |
| Andre Sorensen et al. | A RANSAC based CAD mesh reconstruction method using point clustering for mesh connectivity | |
| CN116223541A (en) | A detection method for materials with different densities in cigarette sticks based on industrial CT three-dimensional reconstruction | |
| US20220358714A1 (en) | Method and system for automatically detecting, locating and identifying objects in a 3d volume | |
| US20210164402A1 (en) | Flow machine performance modelling | |
| Aust et al. | Automated Defect Detection and Decision-Support in Gas Turbine Blade Inspection. Aerospace 2021, 8, 30 | |
| Masi et al. | Overview of the best 2020 axial-flow fan data and inclusion in similarity charts for the search of the best design | |
| KR101839687B1 (en) | Apparatus and method for retrieving model considering differences of level-of-detail between query and retrieval target models | |
| US20250189463A1 (en) | Method for scanning a component |
Legal Events
| Date | Code | Title | Description |
|---|---|---|---|
| PUAI | Public reference made under article 153(3) epc to a published international application that has entered the european phase |
Free format text: ORIGINAL CODE: 0009012 |
|
| STAA | Information on the status of an ep patent application or granted ep patent |
Free format text: STATUS: THE APPLICATION HAS BEEN PUBLISHED |
|
| AK | Designated contracting states |
Kind code of ref document: A1 Designated state(s): AL AT BE BG CH CY CZ DE DK EE ES FI FR GB GR HR HU IE IS IT LI LT LU LV MC ME MK MT NL NO PL PT RO RS SE SI SK SM TR |
|
| STAA | Information on the status of an ep patent application or granted ep patent |
Free format text: STATUS: REQUEST FOR EXAMINATION WAS MADE |
|
| 17P | Request for examination filed |
Effective date: 20241219 |