EP4386001A1 - Method for estimating hemoglobin a1c level, information processing apparatus, and computer-readable storage medium - Google Patents
Method for estimating hemoglobin a1c level, information processing apparatus, and computer-readable storage medium Download PDFInfo
- Publication number
- EP4386001A1 EP4386001A1 EP23216444.2A EP23216444A EP4386001A1 EP 4386001 A1 EP4386001 A1 EP 4386001A1 EP 23216444 A EP23216444 A EP 23216444A EP 4386001 A1 EP4386001 A1 EP 4386001A1
- Authority
- EP
- European Patent Office
- Prior art keywords
- hemoglobin
- peak
- level
- mutant
- glycated
- Prior art date
- Legal status (The legal status is an assumption and is not a legal conclusion. Google has not performed a legal analysis and makes no representation as to the accuracy of the status listed.)
- Granted
Links
Images




Classifications
-
- G—PHYSICS
- G01—MEASURING; TESTING
- G01N—INVESTIGATING OR ANALYSING MATERIALS BY DETERMINING THEIR CHEMICAL OR PHYSICAL PROPERTIES
- G01N33/00—Investigating or analysing materials by specific methods not covered by groups G01N1/00 - G01N31/00
- G01N33/48—Biological material, e.g. blood, urine; Haemocytometers
- G01N33/483—Physical analysis of biological material
- G01N33/487—Physical analysis of biological material of liquid biological material
- G01N33/49—Blood
-
- G—PHYSICS
- G01—MEASURING; TESTING
- G01N—INVESTIGATING OR ANALYSING MATERIALS BY DETERMINING THEIR CHEMICAL OR PHYSICAL PROPERTIES
- G01N33/00—Investigating or analysing materials by specific methods not covered by groups G01N1/00 - G01N31/00
- G01N33/48—Biological material, e.g. blood, urine; Haemocytometers
- G01N33/50—Chemical analysis of biological material, e.g. blood, urine; Testing involving biospecific ligand binding methods; Immunological testing
- G01N33/72—Chemical analysis of biological material, e.g. blood, urine; Testing involving biospecific ligand binding methods; Immunological testing involving blood pigments, e.g. haemoglobin, bilirubin or other porphyrins; involving occult blood
- G01N33/721—Haemoglobin
-
- G—PHYSICS
- G01—MEASURING; TESTING
- G01N—INVESTIGATING OR ANALYSING MATERIALS BY DETERMINING THEIR CHEMICAL OR PHYSICAL PROPERTIES
- G01N30/00—Investigating or analysing materials by separation into components using adsorption, absorption or similar phenomena or using ion-exchange, e.g. chromatography or field flow fractionation
- G01N30/02—Column chromatography
- G01N30/86—Signal analysis
- G01N30/8624—Detection of slopes or peaks; baseline correction
- G01N30/8631—Peaks
-
- B—PERFORMING OPERATIONS; TRANSPORTING
- B01—PHYSICAL OR CHEMICAL PROCESSES OR APPARATUS IN GENERAL
- B01D—SEPARATION
- B01D15/00—Separating processes involving the treatment of liquids with solid sorbents; Apparatus therefor
- B01D15/08—Selective adsorption, e.g. chromatography
- B01D15/26—Selective adsorption, e.g. chromatography characterised by the separation mechanism
- B01D15/36—Selective adsorption, e.g. chromatography characterised by the separation mechanism involving ionic interaction, e.g. ion-exchange, ion-pair, ion-suppression or ion-exclusion
- B01D15/361—Ion-exchange
- B01D15/362—Cation-exchange
-
- G—PHYSICS
- G01—MEASURING; TESTING
- G01N—INVESTIGATING OR ANALYSING MATERIALS BY DETERMINING THEIR CHEMICAL OR PHYSICAL PROPERTIES
- G01N30/00—Investigating or analysing materials by separation into components using adsorption, absorption or similar phenomena or using ion-exchange, e.g. chromatography or field flow fractionation
- G01N30/02—Column chromatography
- G01N30/62—Detectors specially adapted therefor
- G01N30/74—Optical detectors
-
- G—PHYSICS
- G01—MEASURING; TESTING
- G01N—INVESTIGATING OR ANALYSING MATERIALS BY DETERMINING THEIR CHEMICAL OR PHYSICAL PROPERTIES
- G01N30/00—Investigating or analysing materials by separation into components using adsorption, absorption or similar phenomena or using ion-exchange, e.g. chromatography or field flow fractionation
- G01N30/02—Column chromatography
- G01N30/86—Signal analysis
- G01N30/8675—Evaluation, i.e. decoding of the signal into analytical information
- G01N30/8679—Target compound analysis, i.e. whereby a limited number of peaks is analysed
-
- G—PHYSICS
- G01—MEASURING; TESTING
- G01N—INVESTIGATING OR ANALYSING MATERIALS BY DETERMINING THEIR CHEMICAL OR PHYSICAL PROPERTIES
- G01N33/00—Investigating or analysing materials by specific methods not covered by groups G01N1/00 - G01N31/00
- G01N33/48—Biological material, e.g. blood, urine; Haemocytometers
- G01N33/50—Chemical analysis of biological material, e.g. blood, urine; Testing involving biospecific ligand binding methods; Immunological testing
- G01N33/72—Chemical analysis of biological material, e.g. blood, urine; Testing involving biospecific ligand binding methods; Immunological testing involving blood pigments, e.g. haemoglobin, bilirubin or other porphyrins; involving occult blood
- G01N33/721—Haemoglobin
- G01N33/723—Glycosylated haemoglobin
-
- G—PHYSICS
- G16—INFORMATION AND COMMUNICATION TECHNOLOGY [ICT] SPECIALLY ADAPTED FOR SPECIFIC APPLICATION FIELDS
- G16B—BIOINFORMATICS, i.e. INFORMATION AND COMMUNICATION TECHNOLOGY [ICT] SPECIALLY ADAPTED FOR GENETIC OR PROTEIN-RELATED DATA PROCESSING IN COMPUTATIONAL MOLECULAR BIOLOGY
- G16B40/00—ICT specially adapted for biostatistics; ICT specially adapted for bioinformatics-related machine learning or data mining, e.g. knowledge discovery or pattern finding
- G16B40/10—Signal processing, e.g. from mass spectrometry [MS] or from PCR
-
- G—PHYSICS
- G16—INFORMATION AND COMMUNICATION TECHNOLOGY [ICT] SPECIALLY ADAPTED FOR SPECIFIC APPLICATION FIELDS
- G16B—BIOINFORMATICS, i.e. INFORMATION AND COMMUNICATION TECHNOLOGY [ICT] SPECIALLY ADAPTED FOR GENETIC OR PROTEIN-RELATED DATA PROCESSING IN COMPUTATIONAL MOLECULAR BIOLOGY
- G16B50/00—ICT programming tools or database systems specially adapted for bioinformatics
- G16B50/30—Data warehousing; Computing architectures
-
- G—PHYSICS
- G01—MEASURING; TESTING
- G01N—INVESTIGATING OR ANALYSING MATERIALS BY DETERMINING THEIR CHEMICAL OR PHYSICAL PROPERTIES
- G01N30/00—Investigating or analysing materials by separation into components using adsorption, absorption or similar phenomena or using ion-exchange, e.g. chromatography or field flow fractionation
- G01N30/02—Column chromatography
- G01N2030/022—Column chromatography characterised by the kind of separation mechanism
- G01N2030/027—Liquid chromatography
-
- G—PHYSICS
- G01—MEASURING; TESTING
- G01N—INVESTIGATING OR ANALYSING MATERIALS BY DETERMINING THEIR CHEMICAL OR PHYSICAL PROPERTIES
- G01N30/00—Investigating or analysing materials by separation into components using adsorption, absorption or similar phenomena or using ion-exchange, e.g. chromatography or field flow fractionation
- G01N30/02—Column chromatography
- G01N30/88—Integrated analysis systems specially adapted therefor, not covered by a single one of the groups G01N30/04 - G01N30/86
- G01N2030/8809—Integrated analysis systems specially adapted therefor, not covered by a single one of the groups G01N30/04 - G01N30/86 analysis specially adapted for the sample
- G01N2030/8813—Integrated analysis systems specially adapted therefor, not covered by a single one of the groups G01N30/04 - G01N30/86 analysis specially adapted for the sample biological materials
- G01N2030/8822—Integrated analysis systems specially adapted therefor, not covered by a single one of the groups G01N30/04 - G01N30/86 analysis specially adapted for the sample biological materials involving blood
-
- G—PHYSICS
- G01—MEASURING; TESTING
- G01N—INVESTIGATING OR ANALYSING MATERIALS BY DETERMINING THEIR CHEMICAL OR PHYSICAL PROPERTIES
- G01N2333/00—Assays involving biological materials from specific organisms or of a specific nature
- G01N2333/795—Porphyrin- or corrin-ring-containing peptides
- G01N2333/805—Haemoglobins; Myoglobins
Definitions
- the present invention relates to a method for estimating a hemoglobin A1c level, an information processing apparatus, and a computer-readable storage medium storing an estimation program.
- Patent Literature 1 describes measuring the percentage (%) of stable hemoglobin A1c in a case where a peak derived from abnormal hemoglobin E is identified by calculating the area of the peak and correcting the peak area of the stable hemoglobin A1c or the peak areas of all hemoglobins using the calculation result.
- mutant Hb also called variant hemoglobin
- HbAlc level a stable hemoglobin A1c level
- glycated mutant Hb may be measured, and, in an affinity method, an immunization method, or an enzyme method, glycated mutant Hb is simultaneously measured with HbA1c.
- the total level of HbA1c and glycated mutant Hb is measured. Furthermore, in a blood specimen which is homozygous for mutant Hb, the percentage of glycated mutant Hb is measured.
- the measured levels of glycated mutant Hb and HbA1c do not necessarily coincide with each other, and thus, the level measured using the blood specimen containing mutant Hb cannot be considered as an indicator of the blood glucose level.
- At least preferred embodiments of the present invention estimate an HbA1c level, which is an indicator of the blood glucose level, even with a blood specimen containing mutant Hb.
- a method for estimating a hemoglobin A1c level includes acquiring in advance a correlation between a hemoglobin A1c level which is a value based on the ratio of the peak value of a hemoglobin A1c peak containing hemoglobin A1c to the total value of the peak values of peaks related to hemoglobin A and a glycated mutant hemoglobin level which is a value based on the ratio of the peak value of a glycated mutant hemoglobin peak to the total value of the peak value of a peak containing mutant hemoglobin and the peak value of the glycated mutant hemoglobin peak containing glycated mutant hemoglobin formed by glycating the mutant hemoglobin, from a chromatogram obtained by subjecting a blood specimen containing the hemoglobin A and the mutant hemoglobin that is collected from each of a plurality of subjects to liquid chromatography, deriving a glycated mutant hemoglobin level from a chromatogram
- an HbA1c level which is an indicator of the blood glucose level, can be estimated even with a blood specimen containing mutant Hb.
- Figs 1 to 9 Embodiments of a method for estimating a hemoglobin A1c level, an information processing apparatus, and an estimation program of the present invention will be described using Figs 1 to 9 .
- the same reference numerals in the drawings indicate the same parts even when a particular description is not provided.
- the "peak value” described herein is the height or area of each peak observed in a chromatogram, and it is possible to use a relative value or an absolute value.
- the relative value may be the ratio of the area of each peak to the entire area of the chromatogram, to the entire area of peaks related to hemoglobin in the chromatogram, or to the area of a specific peak (for example, an HbA0 peak).
- Hemoglobin is a tetramer, with one example being HbA which consists of two ⁇ chains and two ⁇ chains.
- HbA which consists of two ⁇ chains and two ⁇ chains.
- HbA/HbA While the hemoglobin genotype of a healthy individual is HbA/HbA, which is homozygous, the genotype of an individual having a mutant hemoglobin is HbA/HbV, which is heterozygous (HbV is mutant hemoglobin), or HbV/HbV, which is homozygous (in a case where the types of HbV are different from each other, the genotype is heterozygous).
- a blood specimen containing hemoglobin A and hemoglobin C (hereinafter referred to as "HbC") that is collected from each of a plurality of subjects is subjected to liquid chromatography.
- the subjects are those who carry both the hemoglobin A gene and the hemoglobin C gene, a mutant hemoglobin gene.
- chromatograms of hemoglobins shown in Figs. 1A to 1C are obtained.
- HbC is an example of mutant hemoglobin.
- the vertical axis of the chromatogram is absorbance detected from an optical detector which detects the concentration of hemoglobin, and the horizontal axis is time elapsed since the start of the measurement.
- a peak 12 (12a, 12b, and 12c correspond to the peak heights) containing hemoglobin A1a and hemoglobin A1b
- a peak 14 (14a, 14b, and 14c corresponds to the peak heights) containing unstable hemoglobin A1c
- a peak 16 (16a, 16b, and 16c corresponds to the peak heights) containing stable hemoglobin A1c
- a peak 18 (18a, 18b, and 18c correspond to the peak heights) containing hemoglobin A0
- a peak 20 (20a, 20b, and 20c correspond to the peak heights) described later
- a peak 22 (22a, 22b, and 22c correspond to the peak heights) containing HbC are observed in this order.
- hemoglobin A1a is referred to as HbA1a
- hemoglobin A1b is referred to as HbA1b
- unstable hemoglobin A1c is referred to as L-A1c
- stable hemoglobin A1c is referred to as HbA1c
- hemoglobin A0 is referred to as HbA0.
- the peak 20 is observed between the peak 18 of HbA0 and the peak 22 of HbC.
- the peak value of the peak 20 (for example, 20a, 20b, and 20c which are the peak heights) increases or decreases in accordance with the increase or decrease of the peak value of HbA1c (for example, 16a, 16b, and 16c which are the peak heights).
- the peak 20 can be determined as a peak containing a glycated product of HbC.
- the peak 20 is a peak containing glycated HbC.
- the peak 20 is an example of a peak X.
- the peak value of glycated HbC (for example, 20a, 20b, and 20c which are the peak heights) is correlated with the peak value of HbA1c (for example, 16a, 16b, and 16c which are the peak heights).
- HbA1c for example, 16a, 16b, and 16c which are the peak heights.
- glycated HbC level a value based on the ratio of the peak value of the peak containing glycated HbC to the peak value of the total HbC (the total peak value of the peak value of the peak containing HbC and the peak value of the peak containing glycated HbC formed by glycation of HbC) and a value (hereinafter referred to as an "HbA1c level”) based on the ratio of the peak value of the peak containing HbA1c to the peak value of the total HbA (the total peak value of the peak value of the peak containing HbA and the peak value of the peak containing modified HbA formed by modification of HbA).
- HbA1c level a value based on the ratio of the peak value of the peak containing HbA1c to the peak value of the total HbA (the total peak value of the peak value of the peak containing HbA and the peak value of the peak containing modified HbA formed by modification of Hb
- the glycated HbC level is derived as glycated HbC% by the following Formula (1) when, for example, the sum of the peak area of glycated HbC (glycated HbC peak area) and the peak area of HbC (HbC peak area) is assumed to be the total area of HbC.
- Glycated HbC% glycated HbC level glycated HbC peak area / total area of HbC ⁇ 100
- the peak area of glycated HbC is the area within a range R20 in each diagram, and the peak area of HbC is the area within a range R22 in each diagram.
- HbA1c level is derived as HbA1c% by the following Formula (2) when the sum of the peak area of HbA1a and HbA1b, the peak area of L-A1c, the peak area of HbA1c, and the peak area of HbA0 is assumed to be the total area of HbA (total value of the peak values of the peaks related to hemoglobin A).
- HbA1c% HbA1c level HbA1c peak area / total area of HbA ⁇ 100
- the peak area of HbA1a and HbA1b is the area within a range R12 in each diagram
- the peak area of L-A1c is the area within a range R14 in each diagram
- the peak area of HbA1c is the area within a range R16 in each diagram
- the peak area of HbA0 is the area within the range R18 in each diagram.
- the boundary of each range is defined by inflection points obtained by differentiating the curve of the chromatogram twice or points at which the absorbance shows the minimum value between each peak.
- HbA1c level a 1 ⁇ glycated HbC level + b 1
- Correlation Formula (3) between the HbA1c level and the glycated HbC level is derived, which allows the HbA1c level, an indicator of the blood glucose level, to be estimated when the blood specimen is either heterozygous for HbC or homozygous for HbC without HbA, by substituting the glycated HbC level into Formula (3).
- a commercially available cation exchange chromatography column filled with a hydrophilic polymer formed of a methacrylic acid ester copolymer was connected to a commercially available high-performance liquid chromatography apparatus.
- An optical detector (specifically, an absorption spectrometer) for detecting the concentration of hemoglobin flowing through the flow path was attached to the cation exchange chromatography column at a predetermined position of the downstream flow path.
- aqueous solutions having the compositions indicated in the table shown in Fig. 2 were used as eluents A, B, and C.
- the pHs of the eluent A, eluent B, and eluent C were adjusted to pH 5.08, pH 8.0, and pH 6.82, respectively.
- the hemoglobin elution power of the eluent was the lowest in eluent A and the highest in eluent B.
- the column was equilibrated by allowing the eluent A to flow through the liquid chromatography apparatus of (a) above. Then, a predetermined amount of a diluted blood specimen was introduced into the column. Next, the eluent A was allowed to flow for a predetermined amount of time (for example, 13 seconds), whereby HbF or HbA1c was eluted.
- a solution obtained by mixing the eluent A and the eluent C at a predetermined ratio (for example, 1:9) was allowed to flow for a predetermined amount of time (for example, 5 seconds), and then the eluent C was allowed to flow for a predetermined amount of time (for example, 17 seconds), whereby HbA0 was eluted.
- all hemoglobin remaining in the analytical column was eluted by allowing the eluent B to flow for a predetermined amount of time (for example, 2 seconds). Then, the eluent A was allowed to flow for a predetermined amount of time (for example, 5 seconds).
- a chromatogram was created using the absorbance obtained from the optical detector at a detection wavelength of 420 nm. As a result, a total of 10 chromatograms were obtained from 10 blood specimens containing HbA and HbC each collected from the plurality of subjects.
- the peak values of the peaks 20 eluted before the peaks 22 of HbC increased or decreased in accordance with the increase or decrease of the peak values of the peaks 16 of HbA1c.
- the graph in Fig. 4 shows the points obtained by plotting the values of the HbA1c% against the values of the glycated HbC% that are indicated in the table of Fig. 3 and the regression line representing Correlation Formula (4).
- the vertical axis of the graph shown in Fig. 4 is the HbA1c%, and the horizontal axis is the glycated HbC%.
- the coefficient of determination (R 2 ) of the regression line is 0.9096, which is a high value close to 1, and thus, it is understood that there is a strong correlation between the glycated HbC% and the HbA1c%.
- Correlation Formula (4) is validated.
- the validation was performed using 10 new blood specimens containing HbA and HbC, each collected from a plurality of subjects.
- the specimens are different from the 10 blood specimens used for deriving Correlation Formula (4) described above, and the HbA1c levels therein are known.
- the glycated HbC% and the HbA1c% were derived by the same methods as (a), (b), and (c) described above. Furthermore, the derived glycated HbC% was substituted into Correlation Formula (4), thereby deriving the estimated values of the HbA1c%.
- the glycated HbC% obtained from the chromatogram and the HbA1c% (measured values) and the HbA1c% obtained from Correlation Formula (4) (estimated values) are indicated in the table shown in Fig. 5 .
- the graph shown in Fig. 6 shows the regression line representing the correlation between the HbA1c% obtained from the correlation formula (estimated value) and the HbA1c% (measured value) and the points obtained by plotting the measured values of the HbA1c% against the estimated values of the HbA1c% obtained from the correlation formula, which are shown in the table of Fig. 5 .
- HbA1c% (measured values)
- HbA1c% estimatemated values
- the coefficient of determination (R 2 ) of the regression line is 0.8878, which is a high value close to 1, and thus, it is understood that, by using Correlation Formula (4), the HbA1c% can be estimated from the glycated HbC% derived from a chromatogram.
- an information processing apparatus 100 which executes a program for estimating the HbA1c level using the method for estimating an HbA1c level described above.
- the information processing apparatus 100 includes a central processing unit (CPU) 101, a read only memory (ROM) 102, a random access memory (RAM) 103, a storage 104, and a communication interface (I/F) 105.
- the respective components are connected to each other via a bus 109 so as to be able to communicate with each other.
- the CPU 101 is a central processing unit which executes various programs or controls each part.
- the CPU 101 reads a program from the ROM 102 or the storage 104 and executes the program using the RAM 103 as the work area.
- the CPU 101 controls each component and performs various calculation processes according to the program stored in the ROM 102 or the storage 104.
- the ROM 102 stores various programs and various data.
- the RAM 103 is a work area which temporarily stores a program or data.
- the storage 104 is configured of a hard disk drive (HDD) or a solid state drive (SSD) and stores various programs including an operating system and various data.
- the communication interface 105 is an interface for the communication between the information processing apparatus 100 and the liquid chromatography apparatus or the like. For example, standards such as Ethernet (registered trademark), FDDI, Wi-Fi (registered trademark), and the like are used.
- the information processing apparatus 100 uses the above-described hardware resources to realize various functions.
- the information processing apparatus 100 includes a storage unit 120, an acquisition unit 122, a calculation unit 124, and an output unit 126.
- Each functional configuration is realized by the CPU 101 reading and executing the estimation program stored in the ROM 102 or the storage 104.
- the storage unit 120 stores Correlation Formula (3) described above that is a correlation between the HbA1c level, which is the indicator of the blood glucose level, and the glycated HbC level. That is, Correlation Formula (3) is stored in the storage unit 120 of the information processing apparatus 100 in advance.
- the acquisition unit 122 acquires the glycated HbC level obtained from a chromatogram that is obtained by subjecting a blood specimen which is a measurement target collected from a subject having HbC to liquid chromatography.
- a value may be acquired which is based on the ratio of the peak value of a peak X that appears between the peak containing hemoglobin A0 and the hemoglobin C peak containing hemoglobin C to the total value of the peak value of the peak X and the peak value of the hemoglobin C peak, the peaks being obtained in a chromatogram that is obtained by subjecting the blood specimen which is the measurement target collected from the subject having HbC to liquid chromatography.
- the calculation unit 124 calculates the estimated value of the HbA1c level by substituting the glycated HbC level acquired by the acquisition unit 122 into Correlation Formula (3) stored in the storage unit 120.
- the output unit 126 outputs the estimated value of the HbA1c level calculated by the calculation unit 124 to a display (not shown).
- the acquisition unit 122 in the information processing apparatus 100 which stores Correlation Formula (3) in the storage unit 120 in advance acquires the glycated HbC level obtained from a chromatogram that is obtained by subjecting a blood specimen which is a measurement target collected from a subject having HbC to liquid chromatography.
- the calculation unit 124 calculates the estimated value of the HbA1c level by substituting the glycated HbC level acquired by the acquisition unit 122 into Correlation Formula (3) stored in the storage unit 120.
- the output unit 126 outputs the estimated value of the HbA1c level calculated by the calculation unit 124 to a display (not shown).
- a series of steps are completed.
- the HbA1c level which is an indicator of the blood glucose level can be estimated even with a blood specimen containing HbC.
- the HbA1c level which is an indicator of the blood glucose level
- directly measuring the blood glucose level is also considered.
- estimating the HbA1c level suppresses the fluctuation which occurs due to the physical condition.
- the mutant hemoglobin may also be, for example, hemoglobin S, hemoglobin E, or hemoglobin D.
- the HbA1c level which is an indicator of the blood glucose level has been estimated from the glycated mutant hemoglobin level that is derived by analyzing a heterozygote of HbA and the mutant hemoglobin and Correlation Formula (3).
- the HbA1c level which is an indicator of the blood glucose level may also be estimated from a glycated mutant hemoglobin level that is derived by analyzing a homozygote of the mutant hemoglobin and the mutant hemoglobin and Correlation Formula (3).
- the HbA1c level which is an indicator of the blood glucose level may also be estimated with a blood specimen not containing HbA.
- the total area of HbC has been used as the denominator in order to derive the glycated HbC level in the above embodiment, the total peak area of the chromatogram may also be used as the denominator.
Landscapes
- Health & Medical Sciences (AREA)
- Life Sciences & Earth Sciences (AREA)
- Engineering & Computer Science (AREA)
- Physics & Mathematics (AREA)
- Chemical & Material Sciences (AREA)
- General Health & Medical Sciences (AREA)
- Immunology (AREA)
- Analytical Chemistry (AREA)
- Hematology (AREA)
- Biochemistry (AREA)
- General Physics & Mathematics (AREA)
- Pathology (AREA)
- Biomedical Technology (AREA)
- Molecular Biology (AREA)
- Urology & Nephrology (AREA)
- Spectroscopy & Molecular Physics (AREA)
- Biotechnology (AREA)
- Medical Informatics (AREA)
- Theoretical Computer Science (AREA)
- Biophysics (AREA)
- Food Science & Technology (AREA)
- Medicinal Chemistry (AREA)
- Evolutionary Biology (AREA)
- Bioinformatics & Cheminformatics (AREA)
- Bioethics (AREA)
- Databases & Information Systems (AREA)
- Bioinformatics & Computational Biology (AREA)
- Microbiology (AREA)
- Cell Biology (AREA)
- Computer Vision & Pattern Recognition (AREA)
- Data Mining & Analysis (AREA)
- Software Systems (AREA)
- Epidemiology (AREA)
- Artificial Intelligence (AREA)
- Public Health (AREA)
- Evolutionary Computation (AREA)
- Signal Processing (AREA)
- Chemical Kinetics & Catalysis (AREA)
- Library & Information Science (AREA)
- Ecology (AREA)
Abstract
Description
- The present invention relates to a method for estimating a hemoglobin A1c level, an information processing apparatus, and a computer-readable storage medium storing an estimation program.
- Japanese Patent Application Laid-Open (
JP-A) No. 2012-215470 - In blood specimen containing mutant hemoglobin (hereinafter, "mutant Hb", also called variant hemoglobin), it is difficult to measure a stable hemoglobin A1c level (hereinafter, an "HbAlc level"), which is an indicator of the blood glucose level. For example, in a blood specimen containing mutant Hb, glycated mutant Hb may be measured, and, in an affinity method, an immunization method, or an enzyme method, glycated mutant Hb is simultaneously measured with HbA1c.
- Specifically, in a blood specimen from a subject which is heterozygous for mutant Hb, the total level of HbA1c and glycated mutant Hb is measured. Furthermore, in a blood specimen which is homozygous for mutant Hb, the percentage of glycated mutant Hb is measured. However, the measured levels of glycated mutant Hb and HbA1c do not necessarily coincide with each other, and thus, the level measured using the blood specimen containing mutant Hb cannot be considered as an indicator of the blood glucose level.
- At least preferred embodiments of the present invention estimate an HbA1c level, which is an indicator of the blood glucose level, even with a blood specimen containing mutant Hb.
- According to an aspect of the present invention, a method for estimating a hemoglobin A1c level includes acquiring in advance a correlation between a hemoglobin A1c level which is a value based on the ratio of the peak value of a hemoglobin A1c peak containing hemoglobin A1c to the total value of the peak values of peaks related to hemoglobin A and a glycated mutant hemoglobin level which is a value based on the ratio of the peak value of a glycated mutant hemoglobin peak to the total value of the peak value of a peak containing mutant hemoglobin and the peak value of the glycated mutant hemoglobin peak containing glycated mutant hemoglobin formed by glycating the mutant hemoglobin, from a chromatogram obtained by subjecting a blood specimen containing the hemoglobin A and the mutant hemoglobin that is collected from each of a plurality of subjects to liquid chromatography, deriving a glycated mutant hemoglobin level from a chromatogram obtained by subjecting a blood specimen which is a measurement target collected from a subject having the mutant hemoglobin to liquid chromatography, and estimating a hemoglobin A1c level based on the derived glycated mutant hemoglobin level and the correlation.
- According to embodiments of the present invention, an HbA1c level, which is an indicator of the blood glucose level, can be estimated even with a blood specimen containing mutant Hb.
- Certain embodiments of the present invention will now be described by way of example only and with reference to the accompanying drawings, in which:
-
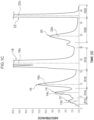
Fig. 1A is a diagram illustrating an example of a chromatogram of hemoglobins obtained by subjecting a blood specimen to liquid chromatography. -
Fig. 1B is a diagram illustrating an example of a chromatogram of hemoglobins obtained by subjecting a blood specimen to liquid chromatography. -
Fig. 1C is a diagram illustrating an example of a chromatogram of hemoglobins obtained by subjecting a blood specimen to liquid chromatography. -
Fig. 2 is a diagram of a table showing components of eluents used when analyzing a blood specimen using liquid chromatography. -
Fig. 3 is a diagram of a table showing glycated HbC levels and HbA1c levels derived from chromatograms of liquid chromatography. -
Fig. 4 is a diagram of a graph showing a correlation between the glycated HbC level and the HbA1c level obtained from blood specimens. -
Fig. 5 is a diagram of a table showing glycated HbC levels derived from chromatograms of liquid chromatography, HbA1c levels derived from a correlation formula, and known HbA1c levels. -
Fig. 6 is a diagram of a graph showing a correlation between the HbA1c level derived from the correlation formula and the known HbA1c level. -
Fig. 7 is a block diagram showing a hardware configuration of an exemplary information processing apparatus. -
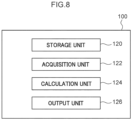
Fig. 8 is a block diagram showing a functional configuration of the exemplary information processing apparatus. -
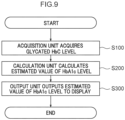
Fig. 9 is a flow diagram showing an exemplary flow of control by the information processing apparatus. - Embodiments of a method for estimating a hemoglobin A1c level, an information processing apparatus, and an estimation program of the present invention will be described using
Figs 1 to 9 . The same reference numerals in the drawings indicate the same parts even when a particular description is not provided. The "peak value" described herein is the height or area of each peak observed in a chromatogram, and it is possible to use a relative value or an absolute value. The relative value may be the ratio of the area of each peak to the entire area of the chromatogram, to the entire area of peaks related to hemoglobin in the chromatogram, or to the area of a specific peak (for example, an HbA0 peak). - A majority of hemoglobins in a healthy adult is HbA, and small amounts thereof are HbF and HbA2. Hemoglobin is a tetramer, with one example being HbA which consists of two α chains and two β chains. When a mutation occurs in the gene sequence that controls the production of the α chain or β chain, a chain of which the amino acid sequence is different from the normal amino acid sequence is produced, or the production of the α chain or β chain is suppressed. As a result, a type of hemoglobin that is different from the normal hemoglobin is generated. Such type of hemoglobin is generally referred to as mutant hemoglobin. While the hemoglobin genotype of a healthy individual is HbA/HbA, which is homozygous, the genotype of an individual having a mutant hemoglobin is HbA/HbV, which is heterozygous (HbV is mutant hemoglobin), or HbV/HbV, which is homozygous (in a case where the types of HbV are different from each other, the genotype is heterozygous).
- First, a blood specimen containing hemoglobin A and hemoglobin C (hereinafter referred to as "HbC") that is collected from each of a plurality of subjects is subjected to liquid chromatography. Note that the subjects are those who carry both the hemoglobin A gene and the hemoglobin C gene, a mutant hemoglobin gene. As a result, chromatograms of hemoglobins shown in
Figs. 1A to 1C are obtained. HbC is an example of mutant hemoglobin. In each diagram, the vertical axis of the chromatogram is absorbance detected from an optical detector which detects the concentration of hemoglobin, and the horizontal axis is time elapsed since the start of the measurement. - In the chromatogram of each diagram, the following peaks are observed in the order of a higher hemoglobin elution rate from the column. Specifically, a peak 12 (12a, 12b, and 12c correspond to the peak heights) containing hemoglobin A1a and hemoglobin A1b, a peak 14 (14a, 14b, and 14c corresponds to the peak heights) containing unstable hemoglobin A1c, a peak 16 (16a, 16b, and 16c corresponds to the peak heights) containing stable hemoglobin A1c, a peak 18 (18a, 18b, and 18c correspond to the peak heights) containing hemoglobin A0, a peak 20 (20a, 20b, and 20c correspond to the peak heights) described later, and a peak 22 (22a, 22b, and 22c correspond to the peak heights) containing HbC are observed in this order. In the following description, hemoglobin A1a is referred to as HbA1a, hemoglobin A1b is referred to as HbA1b, unstable hemoglobin A1c is referred to as L-A1c, stable hemoglobin A1c is referred to as HbA1c, and hemoglobin A0 is referred to as HbA0.
- Here, the
peak 20 is observed between thepeak 18 of HbA0 and thepeak 22 of HbC. The peak value of the peak 20 (for example, 20a, 20b, and 20c which are the peak heights) increases or decreases in accordance with the increase or decrease of the peak value of HbA1c (for example, 16a, 16b, and 16c which are the peak heights). Thus, thepeak 20 can be determined as a peak containing a glycated product of HbC. In other words, thepeak 20 is a peak containing glycated HbC. Thepeak 20 is an example of a peak X. - As described above, the peak value of glycated HbC (for example, 20a, 20b, and 20c which are the peak heights) is correlated with the peak value of HbA1c (for example, 16a, 16b, and 16c which are the peak heights). Note that a, b, and c attached to the end of the reference numerals may be omitted in a case where a, b, and c are not particularly distinguished.
- Then, it is considered that there is a strong correlation between a value (hereinafter, referred to as a "glycated HbC level") based on the ratio of the peak value of the peak containing glycated HbC to the peak value of the total HbC (the total peak value of the peak value of the peak containing HbC and the peak value of the peak containing glycated HbC formed by glycation of HbC) and a value (hereinafter referred to as an "HbA1c level") based on the ratio of the peak value of the peak containing HbA1c to the peak value of the total HbA (the total peak value of the peak value of the peak containing HbA and the peak value of the peak containing modified HbA formed by modification of HbA).
- The glycated HbC level is derived as glycated HbC% by the following Formula (1) when, for example, the sum of the peak area of glycated HbC (glycated HbC peak area) and the peak area of HbC (HbC peak area) is assumed to be the total area of HbC.

- Note that the peak area of glycated HbC is the area within a range R20 in each diagram, and the peak area of HbC is the area within a range R22 in each diagram.
- Meanwhile, the HbA1c level is derived as HbA1c% by the following Formula (2) when the sum of the peak area of HbA1a and HbA1b, the peak area of L-A1c, the peak area of HbA1c, and the peak area of HbA0 is assumed to be the total area of HbA (total value of the peak values of the peaks related to hemoglobin A).

- Note that the peak area of HbA1a and HbA1b (peak area of HbA1a + peak area of HbA1b) is the area within a range R12 in each diagram, the peak area of L-A1c is the area within a range R14 in each diagram, the peak area of HbA1c is the area within a range R16 in each diagram, and the peak area of HbA0 is the area within the range R18 in each diagram. In addition, the boundary of each range is defined by inflection points obtained by differentiating the curve of the chromatogram twice or points at which the absorbance shows the minimum value between each peak.
- Since the
peak 16 of HbA1c (16a, 16b, and 16c correspond to the peak heights) increases or decreases in accordance with the increase or decrease of the peak value of thepeak 20 of glycated HbC, it is considered that there is a proportional relationship between the HbA1c level and the glycated HbC level. Then, it is considered that the following Correlation Formula (3) is established between the HbA1c level, which is an indicator of the blood glucose level, and the glycated HbC level in a blood specimen containing HbC.
- ai: Slope (constant)
- bi: Intercept (constant)
- In this manner, Correlation Formula (3) between the HbA1c level and the glycated HbC level is derived, which allows the HbA1c level, an indicator of the blood glucose level, to be estimated when the blood specimen is either heterozygous for HbC or homozygous for HbC without HbA, by substituting the glycated HbC level into Formula (3).
- Next, an example of the method for estimating an HbA1c level according to an embodiment of the present invention will be described using a total of 20 blood specimens containing HbA and HbC, each collected from a plurality of subjects.
- A commercially available cation exchange chromatography column filled with a hydrophilic polymer formed of a methacrylic acid ester copolymer was connected to a commercially available high-performance liquid chromatography apparatus. An optical detector (specifically, an absorption spectrometer) for detecting the concentration of hemoglobin flowing through the flow path was attached to the cation exchange chromatography column at a predetermined position of the downstream flow path.
- The aqueous solutions having the compositions indicated in the table shown in
Fig. 2 were used as eluents A, B, and C. The pHs of the eluent A, eluent B, and eluent C were adjusted to pH 5.08, pH 8.0, and pH 6.82, respectively. the hemoglobin elution power of the eluent was the lowest in eluent A and the highest in eluent B. - The column was equilibrated by allowing the eluent A to flow through the liquid chromatography apparatus of (a) above. Then, a predetermined amount of a diluted blood specimen was introduced into the column. Next, the eluent A was allowed to flow for a predetermined amount of time (for example, 13 seconds), whereby HbF or HbA1c was eluted. Next, a solution obtained by mixing the eluent A and the eluent C at a predetermined ratio (for example, 1:9) was allowed to flow for a predetermined amount of time (for example, 5 seconds), and then the eluent C was allowed to flow for a predetermined amount of time (for example, 17 seconds), whereby HbA0 was eluted. Next, all hemoglobin remaining in the analytical column was eluted by allowing the eluent B to flow for a predetermined amount of time (for example, 2 seconds). Then, the eluent A was allowed to flow for a predetermined amount of time (for example, 5 seconds). During the elution, a chromatogram was created using the absorbance obtained from the optical detector at a detection wavelength of 420 nm. As a result, a total of 10 chromatograms were obtained from 10 blood specimens containing HbA and HbC each collected from the plurality of subjects.
- In the obtained chromatograms, the peak values of the
peaks 20 eluted before thepeaks 22 of HbC increased or decreased in accordance with the increase or decrease of the peak values of thepeaks 16 of HbA1c. - The glycated HbC% derived from each chromatogram using Formula (1) described above and the HbA1c% derived using Formula (2) are indicated in the table shown in
Fig. 3 . - In addition, for the glycated HbC% and the HbA1c% shown in
Fig. 3 , a1 and b1 of Correlation Formula (3) were obtained. As a result, a1 was 1.2365, and b1 was -4.3522. That is, the following Correlation Formula (4) was obtained using the 10 blood specimens.
- Furthermore, the graph in
Fig. 4 shows the points obtained by plotting the values of the HbA1c% against the values of the glycated HbC% that are indicated in the table ofFig. 3 and the regression line representing Correlation Formula (4). The vertical axis of the graph shown inFig. 4 is the HbA1c%, and the horizontal axis is the glycated HbC%. The coefficient of determination (R2) of the regression line is 0.9096, which is a high value close to 1, and thus, it is understood that there is a strong correlation between the glycated HbC% and the HbA1c%. - Next, Correlation Formula (4) is validated. The validation was performed using 10 new blood specimens containing HbA and HbC, each collected from a plurality of subjects. Regarding the 10 new blood specimens, the specimens are different from the 10 blood specimens used for deriving Correlation Formula (4) described above, and the HbA1c levels therein are known.
- Using these 10 new blood specimens, the glycated HbC% and the HbA1c% (measured values) were derived by the same methods as (a), (b), and (c) described above. Furthermore, the derived glycated HbC% was substituted into Correlation Formula (4), thereby deriving the estimated values of the HbA1c%.
- The glycated HbC% obtained from the chromatogram and the HbA1c% (measured values) and the HbA1c% obtained from Correlation Formula (4) (estimated values) are indicated in the table shown in
Fig. 5 . Furthermore, the graph shown inFig. 6 shows the regression line representing the correlation between the HbA1c% obtained from the correlation formula (estimated value) and the HbA1c% (measured value) and the points obtained by plotting the measured values of the HbA1c% against the estimated values of the HbA1c% obtained from the correlation formula, which are shown in the table ofFig. 5 . The vertical axis of the graph shown inFig. 6 is the HbA1c% (measured values), and the horizontal axis is the HbA1c% (estimated values). The coefficient of determination (R2) of the regression line is 0.8878, which is a high value close to 1, and thus, it is understood that, by using Correlation Formula (4), the HbA1c% can be estimated from the glycated HbC% derived from a chromatogram. - Next, an
information processing apparatus 100 will be described, which executes a program for estimating the HbA1c level using the method for estimating an HbA1c level described above. - As shown in
Fig. 7 , theinformation processing apparatus 100 includes a central processing unit (CPU) 101, a read only memory (ROM) 102, a random access memory (RAM) 103, astorage 104, and a communication interface (I/F) 105. The respective components are connected to each other via abus 109 so as to be able to communicate with each other. - The
CPU 101 is a central processing unit which executes various programs or controls each part. In other words, theCPU 101 reads a program from theROM 102 or thestorage 104 and executes the program using theRAM 103 as the work area. TheCPU 101 controls each component and performs various calculation processes according to the program stored in theROM 102 or thestorage 104. - The
ROM 102 stores various programs and various data. TheRAM 103 is a work area which temporarily stores a program or data. Thestorage 104 is configured of a hard disk drive (HDD) or a solid state drive (SSD) and stores various programs including an operating system and various data. Thecommunication interface 105 is an interface for the communication between theinformation processing apparatus 100 and the liquid chromatography apparatus or the like. For example, standards such as Ethernet (registered trademark), FDDI, Wi-Fi (registered trademark), and the like are used. - When executing the program for estimating the HbA1c level, the
information processing apparatus 100 uses the above-described hardware resources to realize various functions. - As shown in
Fig. 8 , theinformation processing apparatus 100 includes astorage unit 120, anacquisition unit 122, acalculation unit 124, and anoutput unit 126. Each functional configuration is realized by theCPU 101 reading and executing the estimation program stored in theROM 102 or thestorage 104. - The
storage unit 120 stores Correlation Formula (3) described above that is a correlation between the HbA1c level, which is the indicator of the blood glucose level, and the glycated HbC level. That is, Correlation Formula (3) is stored in thestorage unit 120 of theinformation processing apparatus 100 in advance. - The
acquisition unit 122 acquires the glycated HbC level obtained from a chromatogram that is obtained by subjecting a blood specimen which is a measurement target collected from a subject having HbC to liquid chromatography. As the glycated hemoglobin C level, a value may be acquired which is based on the ratio of the peak value of a peak X that appears between the peak containing hemoglobin A0 and the hemoglobin C peak containing hemoglobin C to the total value of the peak value of the peak X and the peak value of the hemoglobin C peak, the peaks being obtained in a chromatogram that is obtained by subjecting the blood specimen which is the measurement target collected from the subject having HbC to liquid chromatography. - The
calculation unit 124 calculates the estimated value of the HbA1c level by substituting the glycated HbC level acquired by theacquisition unit 122 into Correlation Formula (3) stored in thestorage unit 120. - The
output unit 126 outputs the estimated value of the HbA1c level calculated by thecalculation unit 124 to a display (not shown). - Next, the operation of the
information processing apparatus 100 will be described using the flow diagram shown inFig. 9 . - In a step S100 shown in
Fig. 9 , theacquisition unit 122 in theinformation processing apparatus 100 which stores Correlation Formula (3) in thestorage unit 120 in advance acquires the glycated HbC level obtained from a chromatogram that is obtained by subjecting a blood specimen which is a measurement target collected from a subject having HbC to liquid chromatography. - Furthermore, in a step S200, the
calculation unit 124 calculates the estimated value of the HbA1c level by substituting the glycated HbC level acquired by theacquisition unit 122 into Correlation Formula (3) stored in thestorage unit 120. - In addition, in a step S300, the
output unit 126 outputs the estimated value of the HbA1c level calculated by thecalculation unit 124 to a display (not shown). Thus, a series of steps are completed. - As described above, by acquiring in advance Correlation Formula (3) between the HbA1c level and the glycated HbC level from chromatograms that are obtained by subjecting a plurality of blood specimens containing HbA and HbC to liquid chromatography, the HbA1c level which is an indicator of the blood glucose level can be estimated even with a blood specimen containing HbC.
- Although the HbA1c level, which is an indicator of the blood glucose level, has been estimated in the above embodiment, directly measuring the blood glucose level is also considered. However, since the blood glucose level fluctuates according to the physical condition, estimating the HbA1c level suppresses the fluctuation which occurs due to the physical condition.
- Although specific embodiments of the present invention have been described in detail, the present invention is not limited to such embodiments, and various other embodiments can be adopted within the scope of the present invention, which is clear to those skilled in the art. Although description has been made in the above embodiment using HbC as the mutant hemoglobin, the mutant hemoglobin may also be, for example, hemoglobin S, hemoglobin E, or hemoglobin D.
- Furthermore, in the above embodiment, the HbA1c level which is an indicator of the blood glucose level has been estimated from the glycated mutant hemoglobin level that is derived by analyzing a heterozygote of HbA and the mutant hemoglobin and Correlation Formula (3). However, the HbA1c level which is an indicator of the blood glucose level may also be estimated from a glycated mutant hemoglobin level that is derived by analyzing a homozygote of the mutant hemoglobin and the mutant hemoglobin and Correlation Formula (3). In other words, the HbA1c level which is an indicator of the blood glucose level may also be estimated with a blood specimen not containing HbA.
- Moreover, while the total area of HbC has been used as the denominator in order to derive the glycated HbC level in the above embodiment, the total peak area of the chromatogram may also be used as the denominator.
Claims (7)
- A method for estimating a hemoglobin A1c level, the method comprising:acquiring in advance a correlation between a hemoglobin A1c level which is a value based on the ratio of the peak value of a hemoglobin A1c peak containing hemoglobin A1c to the total value of the peak values of peaks related to hemoglobin A and a glycated mutant hemoglobin level which is a value based on the ratio of the peak value of a glycated mutant hemoglobin peak to the total value of the peak value of a peak containing mutant hemoglobin and the peak value of the glycated mutant hemoglobin peak containing glycated mutant hemoglobin formed by glycating the mutant hemoglobin, from a chromatogram obtained by subjecting a blood specimen containing the hemoglobin A and the mutant hemoglobin that is collected from each of a plurality of subjects to liquid chromatography;deriving a glycated mutant hemoglobin level from a chromatogram obtained by subjecting a blood specimen which is a measurement target collected from a subject having the mutant hemoglobin to liquid chromatography; andestimating a hemoglobin A1c level based on the derived glycated mutant hemoglobin level and the correlation.
- The method for estimating a hemoglobin A1c level according to claim 1, wherein the mutant hemoglobin is hemoglobin C.
- The method for estimating a hemoglobin A1c level according to claim 2, wherein
a glycated hemoglobin C level is obtained as a value based on the ratio of the peak value of a peak X, which appears between a peak containing hemoglobin A0 and a hemoglobin C peak containing hemoglobin C in the chromatogram, to the total value of the peak value of the peak X and the peak value of the hemoglobin C peak and used as the glycated mutant hemoglobin level. - The method for estimating a hemoglobin A1c level according to any of claims 1 to 3, wherein
the liquid chromatography is cation exchange chromatography. - An information processing apparatus comprising:a storage unit (120) configured to store a correlation between a hemoglobin A1c level which is a value based on the ratio of the peak value of a hemoglobin A1c peak containing hemoglobin A1c to the total value of the peak values of peaks related to hemoglobin A and a glycated mutant hemoglobin level which is a value based on the ratio of the peak value of a glycated mutant hemoglobin peak to the total value of the peak value of a peak containing mutant hemoglobin and the peak value of the glycated mutant hemoglobin peak containing glycated mutant hemoglobin formed by glycating the mutant hemoglobin, the correlation being obtained from a chromatogram obtained by subjecting a blood specimen containing the hemoglobin A and the mutant hemoglobin that is collected from each of a plurality of subjects to liquid chromatography;an acquisition unit (122) configured to acquire a glycated mutant hemoglobin level obtained from a chromatogram obtained by subjecting a blood specimen which is a measurement target collected from a subject having the mutant hemoglobin to liquid chromatography;a calculation unit (124) configured to calculate an estimated value of a hemoglobin A1c level based on the glycated mutant hemoglobin level acquired by the acquisition unit and the correlation stored in the storage unit; andan output unit (126) configured to output the estimated value.
- An estimation program which causes a computer that stores a correlation between a hemoglobin A1c level which is a value based on the ratio of the peak value of a hemoglobin A1c peak containing hemoglobin A1c to the total value of the peak values of peaks related to hemoglobin A and a glycated mutant hemoglobin level which is a value based on the ratio of the peak value of a glycated mutant hemoglobin peak to the total value of the peak value of a peak containing mutant hemoglobin and the peak value of the glycated mutant hemoglobin peak containing glycated mutant hemoglobin formed by glycating the mutant hemoglobin, the correlation being obtained from a chromatogram obtained by subjecting a blood specimen containing the hemoglobin A and the mutant hemoglobin that is collected from each of a plurality of subjects to liquid chromatography, to execute processing of:acquiring a glycated mutant hemoglobin level obtained from a chromatogram obtained by subjecting a blood specimen which is a measurement target collected from a subject having the mutant hemoglobin to liquid chromatography,calculating an estimated value of a hemoglobin A1c level based on the acquired glycated mutant hemoglobin level and the stored correlation, andoutputting the estimated value.
- A non-transitory computer-readable storage medium storing the estimation program according to claim 6.
Applications Claiming Priority (1)
| Application Number | Priority Date | Filing Date | Title |
|---|---|---|---|
| JP2022201260A JP2024086236A (en) | 2022-12-16 | 2022-12-16 | Method for estimating hemoglobin A1c value, information processing device, and estimation program |
Publications (3)
| Publication Number | Publication Date |
|---|---|
| EP4386001A1 true EP4386001A1 (en) | 2024-06-19 |
| EP4386001B1 EP4386001B1 (en) | 2025-06-04 |
| EP4386001C0 EP4386001C0 (en) | 2025-06-04 |
Family
ID=89222516
Family Applications (1)
| Application Number | Title | Priority Date | Filing Date |
|---|---|---|---|
| EP23216444.2A Active EP4386001B1 (en) | 2022-12-16 | 2023-12-13 | Method for estimating hemoglobin a1c level, information processing apparatus, and computer-readable storage medium |
Country Status (4)
| Country | Link |
|---|---|
| US (1) | US20240201206A1 (en) |
| EP (1) | EP4386001B1 (en) |
| JP (1) | JP2024086236A (en) |
| CN (1) | CN118209673A (en) |
Citations (6)
| Publication number | Priority date | Publication date | Assignee | Title |
|---|---|---|---|---|
| JP2001221788A (en) * | 2000-02-07 | 2001-08-17 | Sekisui Chem Co Ltd | Method for measuring hemoglobins |
| JP2012215470A (en) | 2011-03-31 | 2012-11-08 | Tosoh Corp | Method and device for measuring glycosylated hemoglobin |
| JP2016183871A (en) * | 2015-03-25 | 2016-10-20 | 東ソー株式会社 | QUANTITATIVE METHOD OF STABLE TYPE GLYCOSYLATED HEMOGLOBIN A1c |
| JP2017194349A (en) * | 2016-04-20 | 2017-10-26 | アークレイ株式会社 | Method, device, and program for measuring glycated hemoglobin |
| CN109073616A (en) * | 2016-05-11 | 2018-12-21 | 东曹株式会社 | Method for measuring glycated hemoglobin and device for measuring glycated hemoglobin |
| WO2020067396A1 (en) * | 2018-09-28 | 2020-04-02 | 積水メディカル株式会社 | Glycated hemoglobin (%) assay method |
-
2022
- 2022-12-16 JP JP2022201260A patent/JP2024086236A/en active Pending
-
2023
- 2023-12-13 CN CN202311712924.XA patent/CN118209673A/en active Pending
- 2023-12-13 EP EP23216444.2A patent/EP4386001B1/en active Active
- 2023-12-14 US US18/539,696 patent/US20240201206A1/en active Pending
Patent Citations (6)
| Publication number | Priority date | Publication date | Assignee | Title |
|---|---|---|---|---|
| JP2001221788A (en) * | 2000-02-07 | 2001-08-17 | Sekisui Chem Co Ltd | Method for measuring hemoglobins |
| JP2012215470A (en) | 2011-03-31 | 2012-11-08 | Tosoh Corp | Method and device for measuring glycosylated hemoglobin |
| JP2016183871A (en) * | 2015-03-25 | 2016-10-20 | 東ソー株式会社 | QUANTITATIVE METHOD OF STABLE TYPE GLYCOSYLATED HEMOGLOBIN A1c |
| JP2017194349A (en) * | 2016-04-20 | 2017-10-26 | アークレイ株式会社 | Method, device, and program for measuring glycated hemoglobin |
| CN109073616A (en) * | 2016-05-11 | 2018-12-21 | 东曹株式会社 | Method for measuring glycated hemoglobin and device for measuring glycated hemoglobin |
| WO2020067396A1 (en) * | 2018-09-28 | 2020-04-02 | 積水メディカル株式会社 | Glycated hemoglobin (%) assay method |
Also Published As
| Publication number | Publication date |
|---|---|
| US20240201206A1 (en) | 2024-06-20 |
| EP4386001B1 (en) | 2025-06-04 |
| JP2024086236A (en) | 2024-06-27 |
| CN118209673A (en) | 2024-06-18 |
| EP4386001C0 (en) | 2025-06-04 |
Similar Documents
| Publication | Publication Date | Title |
|---|---|---|
| JP6780290B2 (en) | Measurement method of glycated hemoglobin and glycated hemoglobin measuring device | |
| JP5948727B2 (en) | Method for measuring glycated hemoglobin and apparatus for measuring glycated hemoglobin | |
| Mosca et al. | The relevance of hemoglobin F measurement in the diagnosis of thalassemias and related hemoglobinopathies | |
| JP7081385B2 (en) | How to calculate the similarity of chromatograms | |
| JP7171960B1 (en) | Method for detecting glycated hemoglobin, method for measuring glycated hemoglobin, liquid chromatography device and program | |
| EP2447712A2 (en) | Calibration method in measurement of hemoglobin A1c | |
| JP2016183871A (en) | QUANTITATIVE METHOD OF STABLE TYPE GLYCOSYLATED HEMOGLOBIN A1c | |
| EP4386001B1 (en) | Method for estimating hemoglobin a1c level, information processing apparatus, and computer-readable storage medium | |
| JP3496390B2 (en) | Data processing method for glycated hemoglobin measuring device using liquid chromatography | |
| JP7798677B2 (en) | Control device, separation analysis device, separation analysis method, and separation analysis program | |
| CN116794207A (en) | Method for measuring hemoglobin F | |
| Blakney et al. | Comparison of hemoglobin A1c results by two different methods on patients with structural hemoglobin variants | |
| Lin et al. | Technical performance evaluation of BM/Hitachi 747-200 serum fructosamine assay | |
| JP7171959B1 (en) | Method for calculating stable HbA1c ratio, liquid chromatography device and program | |
| Doggui et al. | Capillarys 2 Flex Piercing: analytical performance assessment according to CLSI protocols for HbA1c quantification | |
| Choi et al. | Performance evaluation of the DxC 700 AU Chemistry analyzer in hemoglobin A1c measurement | |
| EP4722712A1 (en) | Method for analyzing hemoglobin and system for analyzing hemoglobin | |
| JP7070137B2 (en) | How to calculate the similarity of chromatograms | |
| WO1996033400A1 (en) | Method for spectroscopic analysis of inhomogeneous samples | |
| Cheng et al. | HbG-Coushatta: an unexpected discovery during HbA1c measurement | |
| Vivó-Truyols et al. | Towards unsupervised analysis of second-order chromatographic data: Automated selection of number of components in multivariate curve-resolution methods | |
| WO2024242127A1 (en) | Method of analyzing hemoglobin and system for analyzing hemoglobin | |
| JP7517123B2 (en) | Method and apparatus for quantifying glycated hemoglobin using a single calibration curve method in affinity chromatography | |
| Aktas et al. | Unmeasurable HbA1c result due to hemoglobinopathy | |
| Arzuhal et al. | Comparison of HbA1c analysers: Agilent 1100 HPLC using kits produced by Gordion Diagnostic (Turkey) with Premier Hb9210 using kits produced by Trinity Biotech (USA) in different patient groups |
Legal Events
| Date | Code | Title | Description |
|---|---|---|---|
| PUAI | Public reference made under article 153(3) epc to a published international application that has entered the european phase |
Free format text: ORIGINAL CODE: 0009012 |
|
| STAA | Information on the status of an ep patent application or granted ep patent |
Free format text: STATUS: THE APPLICATION HAS BEEN PUBLISHED |
|
| AK | Designated contracting states |
Kind code of ref document: A1 Designated state(s): AL AT BE BG CH CY CZ DE DK EE ES FI FR GB GR HR HU IE IS IT LI LT LU LV MC ME MK MT NL NO PL PT RO RS SE SI SK SM TR |
|
| STAA | Information on the status of an ep patent application or granted ep patent |
Free format text: STATUS: REQUEST FOR EXAMINATION WAS MADE |
|
| 17P | Request for examination filed |
Effective date: 20241018 |
|
| RBV | Designated contracting states (corrected) |
Designated state(s): AL AT BE BG CH CY CZ DE DK EE ES FI FR GB GR HR HU IE IS IT LI LT LU LV MC ME MK MT NL NO PL PT RO RS SE SI SK SM TR |
|
| REG | Reference to a national code |
Ref country code: DE Ref legal event code: R079 Free format text: PREVIOUS MAIN CLASS: C07K0016180000 Ipc: G01N0033490000 Ref country code: DE Ref legal event code: R079 Ref document number: 602023003852 Country of ref document: DE Free format text: PREVIOUS MAIN CLASS: C07K0016180000 Ipc: G01N0033490000 |
|
| GRAP | Despatch of communication of intention to grant a patent |
Free format text: ORIGINAL CODE: EPIDOSNIGR1 |
|
| STAA | Information on the status of an ep patent application or granted ep patent |
Free format text: STATUS: GRANT OF PATENT IS INTENDED |
|
| RIC1 | Information provided on ipc code assigned before grant |
Ipc: G01N 30/88 20060101ALI20241217BHEP Ipc: C07K 16/18 20060101ALI20241217BHEP Ipc: G01N 33/72 20060101ALI20241217BHEP Ipc: G01N 33/49 20060101AFI20241217BHEP |
|
| INTG | Intention to grant announced |
Effective date: 20250110 |
|
| GRAS | Grant fee paid |
Free format text: ORIGINAL CODE: EPIDOSNIGR3 |
|
| GRAA | (expected) grant |
Free format text: ORIGINAL CODE: 0009210 |
|
| STAA | Information on the status of an ep patent application or granted ep patent |
Free format text: STATUS: THE PATENT HAS BEEN GRANTED |
|
| AK | Designated contracting states |
Kind code of ref document: B1 Designated state(s): AL AT BE BG CH CY CZ DE DK EE ES FI FR GB GR HR HU IE IS IT LI LT LU LV MC ME MK MT NL NO PL PT RO RS SE SI SK SM TR |
|
| REG | Reference to a national code |
Ref country code: GB Ref legal event code: FG4D |
|
| REG | Reference to a national code |
Ref country code: CH Ref legal event code: EP |
|
| REG | Reference to a national code |
Ref country code: DE Ref legal event code: R096 Ref document number: 602023003852 Country of ref document: DE |
|
| REG | Reference to a national code |
Ref country code: IE Ref legal event code: FG4D |
|
| U01 | Request for unitary effect filed |
Effective date: 20250604 |
|
| U07 | Unitary effect registered |
Designated state(s): AT BE BG DE DK EE FI FR IT LT LU LV MT NL PT RO SE SI Effective date: 20250612 |
|
| PG25 | Lapsed in a contracting state [announced via postgrant information from national office to epo] |
Ref country code: ES Free format text: LAPSE BECAUSE OF FAILURE TO SUBMIT A TRANSLATION OF THE DESCRIPTION OR TO PAY THE FEE WITHIN THE PRESCRIBED TIME-LIMIT Effective date: 20250604 |
|
| PG25 | Lapsed in a contracting state [announced via postgrant information from national office to epo] |
Ref country code: GR Free format text: LAPSE BECAUSE OF FAILURE TO SUBMIT A TRANSLATION OF THE DESCRIPTION OR TO PAY THE FEE WITHIN THE PRESCRIBED TIME-LIMIT Effective date: 20250905 Ref country code: NO Free format text: LAPSE BECAUSE OF FAILURE TO SUBMIT A TRANSLATION OF THE DESCRIPTION OR TO PAY THE FEE WITHIN THE PRESCRIBED TIME-LIMIT Effective date: 20250904 |
|
| PG25 | Lapsed in a contracting state [announced via postgrant information from national office to epo] |
Ref country code: PL Free format text: LAPSE BECAUSE OF FAILURE TO SUBMIT A TRANSLATION OF THE DESCRIPTION OR TO PAY THE FEE WITHIN THE PRESCRIBED TIME-LIMIT Effective date: 20250604 |
|
| PG25 | Lapsed in a contracting state [announced via postgrant information from national office to epo] |
Ref country code: HR Free format text: LAPSE BECAUSE OF FAILURE TO SUBMIT A TRANSLATION OF THE DESCRIPTION OR TO PAY THE FEE WITHIN THE PRESCRIBED TIME-LIMIT Effective date: 20250604 |
|
| PG25 | Lapsed in a contracting state [announced via postgrant information from national office to epo] |
Ref country code: RS Free format text: LAPSE BECAUSE OF FAILURE TO SUBMIT A TRANSLATION OF THE DESCRIPTION OR TO PAY THE FEE WITHIN THE PRESCRIBED TIME-LIMIT Effective date: 20250904 |
|
| PG25 | Lapsed in a contracting state [announced via postgrant information from national office to epo] |
Ref country code: IS Free format text: LAPSE BECAUSE OF FAILURE TO SUBMIT A TRANSLATION OF THE DESCRIPTION OR TO PAY THE FEE WITHIN THE PRESCRIBED TIME-LIMIT Effective date: 20251004 |
|
| PG25 | Lapsed in a contracting state [announced via postgrant information from national office to epo] |
Ref country code: SM Free format text: LAPSE BECAUSE OF FAILURE TO SUBMIT A TRANSLATION OF THE DESCRIPTION OR TO PAY THE FEE WITHIN THE PRESCRIBED TIME-LIMIT Effective date: 20250604 |
|
| PG25 | Lapsed in a contracting state [announced via postgrant information from national office to epo] |
Ref country code: CZ Free format text: LAPSE BECAUSE OF FAILURE TO SUBMIT A TRANSLATION OF THE DESCRIPTION OR TO PAY THE FEE WITHIN THE PRESCRIBED TIME-LIMIT Effective date: 20250604 |
|
| PG25 | Lapsed in a contracting state [announced via postgrant information from national office to epo] |
Ref country code: SK Free format text: LAPSE BECAUSE OF FAILURE TO SUBMIT A TRANSLATION OF THE DESCRIPTION OR TO PAY THE FEE WITHIN THE PRESCRIBED TIME-LIMIT Effective date: 20250604 |
|
| U20 | Renewal fee for the european patent with unitary effect paid |
Year of fee payment: 3 Effective date: 20251230 |
|
| PLBE | No opposition filed within time limit |
Free format text: ORIGINAL CODE: 0009261 |
|
| STAA | Information on the status of an ep patent application or granted ep patent |
Free format text: STATUS: NO OPPOSITION FILED WITHIN TIME LIMIT |
|
| REG | Reference to a national code |
Ref country code: CH Ref legal event code: L10 Free format text: ST27 STATUS EVENT CODE: U-0-0-L10-L00 (AS PROVIDED BY THE NATIONAL OFFICE) Effective date: 20260416 |
|
| 26N | No opposition filed |
Effective date: 20260305 |