EP4379430A1 - Method for remote sensing of equivalent point turbulence - Google Patents
Method for remote sensing of equivalent point turbulence Download PDFInfo
- Publication number
- EP4379430A1 EP4379430A1 EP22210652.8A EP22210652A EP4379430A1 EP 4379430 A1 EP4379430 A1 EP 4379430A1 EP 22210652 A EP22210652 A EP 22210652A EP 4379430 A1 EP4379430 A1 EP 4379430A1
- Authority
- EP
- European Patent Office
- Prior art keywords
- values
- standard deviation
- equivalent
- wind speed
- point
- Prior art date
- Legal status (The legal status is an assumption and is not a legal conclusion. Google has not performed a legal analysis and makes no representation as to the accuracy of the status listed.)
- Withdrawn
Links
- 238000000034 method Methods 0.000 title claims abstract description 30
- 238000005259 measurement Methods 0.000 claims abstract description 72
- 238000004364 calculation method Methods 0.000 claims description 7
- 238000013507 mapping Methods 0.000 claims description 2
- 238000001228 spectrum Methods 0.000 description 4
- 238000012935 Averaging Methods 0.000 description 2
- 238000012937 correction Methods 0.000 description 2
- 238000012864 cross contamination Methods 0.000 description 2
- 230000000694 effects Effects 0.000 description 2
- 238000012545 processing Methods 0.000 description 2
- 230000001427 coherent effect Effects 0.000 description 1
- 238000010276 construction Methods 0.000 description 1
- 230000001419 dependent effect Effects 0.000 description 1
- 238000011065 in-situ storage Methods 0.000 description 1
- 238000012417 linear regression Methods 0.000 description 1
- 238000000691 measurement method Methods 0.000 description 1
- 238000012549 training Methods 0.000 description 1
Images


Classifications
-
- G—PHYSICS
- G01—MEASURING; TESTING
- G01W—METEOROLOGY
- G01W1/00—Meteorology
-
- G—PHYSICS
- G01—MEASURING; TESTING
- G01W—METEOROLOGY
- G01W1/00—Meteorology
- G01W2001/003—Clear air turbulence detection or forecasting, e.g. for aircrafts
Definitions
- the invention refers to a method for determining values indicative of a distribution of values of turbulence intensity measurements using a remote sensing device, in particular vertical profiling or VAD Lidar-based measurement devices.
- the remote sensing measurement values are processed in a way that produces values equivalent to values of the turbulence intensity determined from wind speed measurements using point measurement devices such as cup anemometers or ultrasonic anemometers.
- WO 2017/106 323 A1 describes systems, devices and methods for improving Lidar-based turbulence intensity (TI) estimates.
- a system includes a Lidar instrument configured to determine, based on reflections of emitted light, a plurality of wind speed values.
- the system also includes a physics-based error correction module configured to determine, based on the wind speed values, at least one Lidar-based meteorological characteristic value.
- the system is configured to determine, based on the Lidar-based meteorological characteristic value and at least one physical characteristic of the Lidar instrument, at least one modified meteorological characteristic value.
- the system further includes a statistical error correction module configured to determine, based on the modified meteorological characteristic value and a meteorological characteristic error module using a collocated Lidar-based meteorological characteristic values and in situ instrument based meteorological characteristic values, at least one corrected turbulence intensity estimate.
- Kelberlau and Mann disclose in "Better Turbulence Spectra from Velocity-Azimuth Display Scanning Wind Lidar” in Atmos. Mech. Tech. 12, 1871 - 1888, 2019 turbulence velocity spectra.
- the turbulence velocity spectra are derived from velocity-azimuth display (VAD) scanning wind Lidars and deviate from spectra derived from one-point measurements due to averaging effects and cross-contaminations among the velocity components.
- VAD velocity-azimuth display
- Two methods are described to minimize these effects through advanced raw data processing. In one method a time delay is introduced into the raw data processing in order to reduce cross-contamination. This method is based on the assumption of frozen turbulence.
- Another method uses only certain laser beams in the reconstruction of wind vector components to overcome averaging along the measurement circle. It is described that the combined use of both methods substantially improves the ability of VAD scanning wind Lidars to measure inwind and vertical fluctuations.
- turbulence intensity is often determined from wind speed measurements at or near hub height using point measurement devices mounted on met masts. Models and calculations are based on data obtained from these point measurements.
- Remote sensing devices can be deployed on the ground without met masts, with more flexibility and at less cost but they measure turbulence intensity and the distribution of turbulence intensity values in a way that is not consistent with the point measurement which is currently required for the load models.
- the problem to be solved by the invention is to provide a method for a remote sensing device to provide values indicative of a distribution of turbulence intensity measurements that adequately correspond to point measurements for the purpose of wind turbine load models.
- the invention provides a method for determining the distribution of the turbulence intensity equivalent to a point measurement for a wind speed and a wind direction.
- the method starts with receiving a plurality of remote sensing measurement values for wind speed and wind direction.
- the plurality of remote sensing measurement values is provided for a plurality of time intervals. For each time interval the values are classified by wind speed and/or by wind direction into wind bins.
- the distribution of measured turbulence intensity values is taken into consideration by calculating the 90 th percentile.
- the received remote sensing measurement values are first converted into standard deviations within a time interval, preferably the standard deviation of approximately 1-second wind speed measurement values within a 10-minute period, wherein the standard deviations ⁇ u , ⁇ v , ⁇ w are determined in a coordinate system in which e. g. positive u- and v-directions correspond to west and south wind, respectively.
- the mean wind direction includes an angle ⁇ with the u-axis.
- the w-direction is a third direction as a vertical direction perpendicular to the x-y-plane and may correspond to the z-axis. While the u,v,w-system represents a local coordinate system the x,y,z-system can be considered as an absolute coordinate system.
- a standard deviation of a horizontal wind speed ⁇ H is determined which refers to the standard deviation in the u-v-plane.
- the standard deviation is calculated for the measurement values falling within the time intervals.
- a standard deviation equivalent to a point measurement is determined.
- a wind bin standard deviation of the standard deviation of the wind speed equivalent to a point measurement is determined from a series of standard deviations of the wind speed equivalent to a point measurement.
- the wind bin standard deviation is calculated as the standard deviation over time intervals classified to have the same wind bin.
- the received remote sensing measurement values are divided into a plurality of wind bins in that one wind bin is assigned to each time interval.
- the wind bin standard deviation calculates the standard deviation of a measuerement value to which the same wind bin was assigned. Based on the 90 th percentile of the standard deviation for each time interval, the 90 th percentile of a turbulence intensity equivalent to a point measurement is determined for each each time interval. The 90 th percentile of the turbulence intensity is used to account for the distribution of the turbulence intensity values derived from the remote measurement of the wind speed. This value, based on the 90 th percentile of the turbulence intensity, is suitable for load models of wind turbines which have been tuned to evaluate a turbulence intensity measured at or near a height using point measurement devices such as cup anemometers or ultrasonic anemometers. For the inventive method it is important to notice that the calculations are carried out over time intervals of standard deviations in combination with the wind bin standard deviation.
- wind speed bins and wind direction bins are assigned to the measurement value for the time interval.
- each wind bin contains the received remote sensing measurement values falling within a time interval of wind speeds and within a predetermined interval of wind directions. For each time interval one or two values of the corresponding wind bin either wind speed bin or wind direction bin are assigned.
- determining the standard deviation values of the wind speed equivalent to values determined based on a point measurement is based on the standard deviations in the local coordinate system, a mean horizontal wind speed and its standard deviation and a mean wind direction. All these values contribute to determine the standard deviation equivalent to a point measurement.
- the coefficient ⁇ corresponds to a value >1, e.g. the 10 % case within the Gaussian distribution.
- ⁇ H is the standard deviation of a horizontal wind speed
- ⁇ u and ⁇ v are the standard deviations of the wind speed in a mean wind direction and perpendicular thereto.
- WS denotes the vertical wind speed
- ⁇ defines the angle of the mean wind direction from the u-axis.
- the remote sensing measurement values are Lidar-based values for a wind speed and a wind direction.
- Figure 1 is taken from the above-mentioned prior art document of Kelberlau et al. It shows the relevant Lidar geometry definitions.
- a mean wind is coming from north-north-east direction which has an angle ⁇ with respect to the u-axis.
- the example shows a mean wind direction in the u-v-plane.
- the absolute x,y,z-coordinate system is indicated at the tip of the cone and represents the orientation of the remote measuring device. Assuming the angular orientation of the absolute x,y,z-coordinate system is known with respect to a north-south orientation and an east-west orientation the measured values of the wind speed can be calculated with respect to the local u,v,w-coordinate system by simple trigonometry. Thereby it may be assumed that the w-axis and the z-axis point in the same direction.
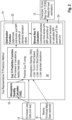
- FIG. 2 shows the method of the point measurement-equivalent representative turbulence intensity prediction.
- the main process steps are carried out in block 10 which delivers as a result the predicted 10 minutes representative point measurement-equivalent turbulence intensity which can be used for load estimations.
- the method works with pre-processed 10 minutes Lidar data 14. These Lidar data are binned into 10-minute intervals and to each interval the average value of the 10-minute interval is assigned.
- an atmospheric stability calculator is used to calculate atmospheric stability based on elements of the coherent turbulence kinetic energy (CTKE).
- CTKE coherent turbulence kinetic energy
- the CTKE value and the other Lidar measured values are applied to a cup prediction turbulence intensity module.
- This step determines the standard deviation of the wind speed equivalent to a point measurement and the standard deviation of the standard deviation of the wind speed equivalent to the point measurement. These calculations of the standard deviations are carried out for a time series. As will be explained below the standard deviation equivalent to a point measurement is also a time series having its own fluctuations and therefore its own standard deviation.
- For calculating the standard deviation of the wind speed equivalent to a point measurement optionally nearby 10-minute point measurement data can be used. This is, they can be used to determine the training of the prediction function. In the present invention a linear regression depending on ⁇ H , WS, ⁇ and ⁇ u , ⁇ v , ⁇ w is used. The point measurement data can be used to fine-tune these parameters. If, however, no point measurement data are available the standard parameters to calculate ⁇ point-equivalent are used.
- step 24 a binned representative TI calculation is carried out.
- the time series with a corrected variance is used to calculate the 90 th percentile of TI for each bin. This leads to the final result in step 12 which can be used for load calculations.
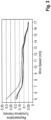
- Figure 3 shows the result of the method where the representative turbulence intensity is plotted over the wind speed.
- the continuous line shows the measured cup representative turbulence intensity starting at a wind speed of 5 m/s.
- the dotted line is the representative turbulence intensity calculated from the raw Lidar data. As clearly can be seen from this data, for wind speeds smaller than 15 m/s the values for the turbulence intensity are too large.
- the dashed line shows the turbulence intensity equivalent to a cup according to the dashed line. It can be seen that for wind speeds above 6 m/s the dashed line and the continuous line match almost.
- FIG. 4 shows a table and a legend to the table to explain the calculation according to the invention. Every line shows the average value within a 10-minute interval.
- the values Lidar _WS , Lidar _SD referring to windspeed (WS) and standard deviation (SD) directly come from the Lidar measuring device. Based on these values the Lidar _USD ( ⁇ u ) and Lidar _VSD ( ⁇ v ) are calculated depending on the wind direction.
- the Lidar device furthermore gives the value Lidar _WWS and Lidar _WSD , wherein Lidar _WWS denotes the wind speed in a vertical direction and Lidar _WSD the standard deviation of the wind speed in the vertical direction.
- ⁇ point-equivalent is called SD predicted and is calculated by using the parameters A to F.
- the value of SD predicted corresponds to ⁇ point-equivalent .
- the wind bin standard deviation of the standard deviation ⁇ point-equivalent is calculated. It is important to notice for the wind bin standard deviation of the standard deviation that the values are evaluated with respect to one wind bin. Looking to lines 1, 2, 3, and 5 of the table we see that wind speed bin 15 was assigned to the time intervals.
- the wind bin standard deviation is calculated as the standard deviation of the wind speeds in the wind bins of the lines 1, 2, 3, and 5, that is 14.65, 15.11, 15.3, and 15.36. In this sense the wind bin standard deviation is an indicator for the fluctuation of the wind speed/wind direct within one single win bin.
- the value TI 90 is obtained by dividing the 90 th percentile of the standard deviation, SD 90 by the wind speed in the time interval.
Landscapes
- Environmental & Geological Engineering (AREA)
- Engineering & Computer Science (AREA)
- Life Sciences & Earth Sciences (AREA)
- Atmospheric Sciences (AREA)
- Biodiversity & Conservation Biology (AREA)
- Ecology (AREA)
- Environmental Sciences (AREA)
- Indicating Or Recording The Presence, Absence, Or Direction Of Movement (AREA)
Abstract
A method for determining values indicative of a distribution of values of the turbulence intensity, wherein the indicative values are equivalent to values determined based on a point measurement comprising:
• Receiving a plurality of remote sensing measurement values of a wind speed and a wind direction,
• Determining standard deviation values of the wind speed within a predetermined time interval for a plurality of time intervals, wherein the standard deviation values are determined from the received remote sensing measurement values of the wind speed and the wind direction, wherein the standard deviation values of the wind speed (σu, σv, σw) are determined with respect to a coordinate system (u, v, w), wherein additionally a standard deviation of a horizontal wind speed (σH) is determined,
• Determining a standard deviation value of the wind speed equivalent to values determined based on the point measurement (σpoint-equivalent) for at least some of the time intervals, wherein the standard deviation values of the wind speed equivalent to values determined based on a point measurement (σpoint-equivalent) is calculated using the standard deviation values as determined from the received remote sensing measurement values,
• Classifying the received remote sensing measurement values for each time interval into at least one wind bin,
• Determining wind bin standard deviation values of the standard deviation values of the wind speed equivalent to values determined based on a point measurement (σbin(σpoint-equivalent)), wherein the wind bin standard deviation is calculated as the standard deviation over time intervals classified to the same wind bin, Determining a 90th percentile (σ 90) of the standard deviation of the wind speed equivalent to values determined based on a point measurement (σpoint-equivalent) for each time intervall, and
• Determining a 90th percentile 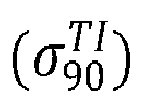
of a turbulence intensity based on the 90th percentile (σ90) of the standard deviation of the wind speed for each time interval, wherein the 90th percentile 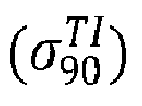
of a turbulence intensity is indicative for the distribution of the values of the turbulence intensity, when measured using a point measurement.
• Receiving a plurality of remote sensing measurement values of a wind speed and a wind direction,
• Determining standard deviation values of the wind speed within a predetermined time interval for a plurality of time intervals, wherein the standard deviation values are determined from the received remote sensing measurement values of the wind speed and the wind direction, wherein the standard deviation values of the wind speed (σu, σv, σw) are determined with respect to a coordinate system (u, v, w), wherein additionally a standard deviation of a horizontal wind speed (σH) is determined,
• Determining a standard deviation value of the wind speed equivalent to values determined based on the point measurement (σpoint-equivalent) for at least some of the time intervals, wherein the standard deviation values of the wind speed equivalent to values determined based on a point measurement (σpoint-equivalent) is calculated using the standard deviation values as determined from the received remote sensing measurement values,
• Classifying the received remote sensing measurement values for each time interval into at least one wind bin,
• Determining wind bin standard deviation values of the standard deviation values of the wind speed equivalent to values determined based on a point measurement (σbin(σpoint-equivalent)), wherein the wind bin standard deviation is calculated as the standard deviation over time intervals classified to the same wind bin, Determining a 90th percentile (σ 90) of the standard deviation of the wind speed equivalent to values determined based on a point measurement (σpoint-equivalent) for each time intervall, and
• Determining a 90th percentile
Description
- The invention refers to a method for determining values indicative of a distribution of values of turbulence intensity measurements using a remote sensing device, in particular vertical profiling or VAD Lidar-based measurement devices. The remote sensing measurement values are processed in a way that produces values equivalent to values of the turbulence intensity determined from wind speed measurements using point measurement devices such as cup anemometers or ultrasonic anemometers.
-
WO 2017/106 323 A1 describes systems, devices and methods for improving Lidar-based turbulence intensity (TI) estimates. A system includes a Lidar instrument configured to determine, based on reflections of emitted light, a plurality of wind speed values. The system also includes a physics-based error correction module configured to determine, based on the wind speed values, at least one Lidar-based meteorological characteristic value. Furthermore, the system is configured to determine, based on the Lidar-based meteorological characteristic value and at least one physical characteristic of the Lidar instrument, at least one modified meteorological characteristic value. The system further includes a statistical error correction module configured to determine, based on the modified meteorological characteristic value and a meteorological characteristic error module using a collocated Lidar-based meteorological characteristic values and in situ instrument based meteorological characteristic values, at least one corrected turbulence intensity estimate. - Kelberlau and Mann disclose in "Better Turbulence Spectra from Velocity-Azimuth Display Scanning Wind Lidar" in Atmos. Mech. Tech. 12, 1871 - 1888, 2019 turbulence velocity spectra. The turbulence velocity spectra are derived from velocity-azimuth display (VAD) scanning wind Lidars and deviate from spectra derived from one-point measurements due to averaging effects and cross-contaminations among the velocity components. Two methods are described to minimize these effects through advanced raw data processing. In one method a time delay is introduced into the raw data processing in order to reduce cross-contamination. This method is based on the assumption of frozen turbulence. Another method uses only certain laser beams in the reconstruction of wind vector components to overcome averaging along the measurement circle. It is described that the combined use of both methods substantially improves the ability of VAD scanning wind Lidars to measure inwind and vertical fluctuations.
- Present measurement techniques deployed prior to construction of wind farms (siting phase) are used to predict loads, lifetime and performance of the wind turbines. The turbulence intensity (TI) is often determined from wind speed measurements at or near hub height using point measurement devices mounted on met masts. Models and calculations are based on data obtained from these point measurements. Remote sensing devices can be deployed on the ground without met masts, with more flexibility and at less cost but they measure turbulence intensity and the distribution of turbulence intensity values in a way that is not consistent with the point measurement which is currently required for the load models.
- The problem to be solved by the invention is to provide a method for a remote sensing device to provide values indicative of a distribution of turbulence intensity measurements that adequately correspond to point measurements for the purpose of wind turbine load models.
- The problem is solved by a method according to claim 1. Preferred embodiments are subject matter of the dependent claims.
- The invention provides a method for determining the distribution of the turbulence intensity equivalent to a point measurement for a wind speed and a wind direction. The method starts with receiving a plurality of remote sensing measurement values for wind speed and wind direction. The plurality of remote sensing measurement values is provided for a plurality of time intervals. For each time interval the values are classified by wind speed and/or by wind direction into wind bins. The distribution of measured turbulence intensity values is taken into consideration by calculating the 90th percentile. The received remote sensing measurement values are first converted into standard deviations within a time interval, preferably the standard deviation of approximately 1-second wind speed measurement values within a 10-minute period, wherein the standard deviations σu, σv, σw are determined in a coordinate system in which e. g. positive u- and v-directions correspond to west and south wind, respectively. The mean wind direction includes an angle θ with the u-axis. The w-direction is a third direction as a vertical direction perpendicular to the x-y-plane and may correspond to the z-axis. While the u,v,w-system represents a local coordinate system the x,y,z-system can be considered as an absolute coordinate system. For all these directions the standard deviation is calculated. Additionally, a standard deviation of a horizontal wind speed σH is determined which refers to the standard deviation in the u-v-plane. The standard deviation is calculated for the measurement values falling within the time intervals. From these pre-processed remote sensing measurement values a standard deviation equivalent to a point measurement is determined. Furthermore, a wind bin standard deviation of the standard deviation of the wind speed equivalent to a point measurement is determined from a series of standard deviations of the wind speed equivalent to a point measurement. The wind bin standard deviation is calculated as the standard deviation over time intervals classified to have the same wind bin. The received remote sensing measurement values are divided into a plurality of wind bins in that one wind bin is assigned to each time interval. The wind bin standard deviation calculates the standard deviation of a measuerement value to which the same wind bin was assigned. Based on the 90th percentile of the standard deviation for each time interval, the 90th percentile of a turbulence intensity equivalent to a point measurement is determined for each each time interval. The 90th percentile of the turbulence intensity is used to account for the distribution of the turbulence intensity values derived from the remote measurement of the wind speed. This value, based on the 90th percentile of the turbulence intensity, is suitable for load models of wind turbines which have been tuned to evaluate a turbulence intensity measured at or near a height using point measurement devices such as cup anemometers or ultrasonic anemometers. For the inventive method it is important to notice that the calculations are carried out over time intervals of standard deviations in combination with the wind bin standard deviation.
- According to a preferred embodiment wind speed bins and wind direction bins are assigned to the measurement value for the time interval. In this embodiment each wind bin contains the received remote sensing measurement values falling within a time interval of wind speeds and within a predetermined interval of wind directions. For each time interval one or two values of the corresponding wind bin either wind speed bin or wind direction bin are assigned.
- In a preferred embodiment determining the standard deviation values of the wind speed equivalent to values determined based on a point measurement is based on the standard deviations in the local coordinate system, a mean horizontal wind speed and its standard deviation and a mean wind direction. All these values contribute to determine the standard deviation equivalent to a point measurement.
- In a further embodiment, the wind bin standard deviation values of the standard deviation values of the wind speed equivalent to values determined based on a point measurement are determined for each time interval. In this step all time intervals belonging to the same wind bin are evaluated, this is done for each wind bin. This is applied to determine the 90th percentile of the standard deviation σ 90 which will adequately match the 90th percentile of the standard deviation of the point measurement. Using the wind bin standard deviation of the standard deviation, it is possible to calculate the 90th percentile of the standard deviation according to:

- The coefficient α corresponds to a value >1, e.g. the 10 % case within the Gaussian distribution.
- Based on the 90th percentile of the standard deviation it is possible to calculate the 90th percentile of the turbulence intensity by dividing through the value of the wind speed within the wind speed bin and within the wind direction bin. This may be the mean value of wind speed within the wind speed bin and the wind direction bin. In order to calculate the standard deviation equivalent to a point measurement it is helpful to look for a linear combination of σH, σu und σv. Furthermore, there is defined a function f( , , ) mapping WS, θ and σw to a real number:

- In the above expression σH is the standard deviation of a horizontal wind speed, σu and σv are the standard deviations of the wind speed in a mean wind direction and perpendicular thereto. WS denotes the vertical wind speed while θ defines the angle of the mean wind direction from the u-axis. It is interesting to notice that the above expression uses four standard deviations of the wind speed with respect to three axes. Even though σH is statistically not independent from σu and σv, better results can be achieved by including σH and using four different standard deviations of the wind speed.
- In a preferred embodiment, the standard deviation values of the wind speed equivalent to values determined based on a point measurement are calculated as a linear combination of these values:

- In a preferred embodiment, the remote sensing measurement values are Lidar-based values for a wind speed and a wind direction.
- The invention is explained with respect to the following embodiment:
- Figure 1
- shows the local u,v,w-coordinate system with respect to the absolute x,y,z-coordinate system of the remote measuring device,
- Figure 2
- shows the cup representative turbulence intensity prediction method,
- Figure 3
- shows a comparison of the accurate prediction of a cup representative turbulence intensity and the 90th percentile turbulence intensity which is used for load estimation using point-equivalent Lidar and measured Lidar data, and
- Figure 4
- shows an example table of measured Lidar values and their representation as well as predicted point-equivalent values.
-
Figure 1 is taken from the above-mentioned prior art document of Kelberlau et al. It shows the relevant Lidar geometry definitions. A mean wind is coming from north-north-east direction which has an angle θ with respect to the u-axis. The example shows a mean wind direction in the u-v-plane. The absolute x,y,z-coordinate system is indicated at the tip of the cone and represents the orientation of the remote measuring device. Assuming the angular orientation of the absolute x,y,z-coordinate system is known with respect to a north-south orientation and an east-west orientation the measured values of the wind speed can be calculated with respect to the local u,v,w-coordinate system by simple trigonometry. Thereby it may be assumed that the w-axis and the z-axis point in the same direction. -
Figure 2 shows the method of the point measurement-equivalent representative turbulence intensity prediction. The main process steps are carried out inblock 10 which delivers as a result the predicted 10 minutes representative point measurement-equivalent turbulence intensity which can be used for load estimations. The method works with pre-processed 10minutes Lidar data 14. These Lidar data are binned into 10-minute intervals and to each interval the average value of the 10-minute interval is assigned. In a first step an atmospheric stability calculator is used to calculate atmospheric stability based on elements of the coherent turbulence kinetic energy (CTKE). The value of CTKE is given as:
- The CTKE value and the other Lidar measured values are applied to a cup prediction turbulence intensity module. This step determines the standard deviation of the wind speed equivalent to a point measurement and the standard deviation of the standard deviation of the wind speed equivalent to the point measurement. These calculations of the standard deviations are carried out for a time series. As will be explained below the standard deviation equivalent to a point measurement is also a time series having its own fluctuations and therefore its own standard deviation. For calculating the standard deviation of the wind speed equivalent to a point measurement optionally nearby 10-minute point measurement data can be used. This is, they can be used to determine the training of the prediction function. In the present invention a linear regression depending on σH, WS, θ and σu, σv, σw is used. The point measurement data can be used to fine-tune these parameters. If, however, no point measurement data are available the standard parameters to calculate σpoint-equivalent are used.
- In the final step 24 a binned representative TI calculation is carried out. Here the time series with a corrected variance is used to calculate the 90th percentile of TI for each bin. This leads to the final result in
step 12 which can be used for load calculations. -
Figure 3 shows the result of the method where the representative turbulence intensity is plotted over the wind speed. The continuous line shows the measured cup representative turbulence intensity starting at a wind speed of 5 m/s. The dotted line is the representative turbulence intensity calculated from the raw Lidar data. As clearly can be seen from this data, for wind speeds smaller than 15 m/s the values for the turbulence intensity are too large. Furthermore, the dashed line shows the turbulence intensity equivalent to a cup according to the dashed line. It can be seen that for wind speeds above 6 m/s the dashed line and the continuous line match almost. -
Figure 4 shows a table and a legend to the table to explain the calculation according to the invention. Every line shows the average value within a 10-minute interval. The values Lidar_WS, Lidar_SD referring to windspeed (WS) and standard deviation (SD) directly come from the Lidar measuring device. Based on these values the Lidar_USD (σu) and Lidar_VSD (σv) are calculated depending on the wind direction. The Lidar device furthermore gives the value Lidar_WWS and Lidar_WSD, wherein Lidar_WWS denotes the wind speed in a vertical direction and Lidar_WSD the standard deviation of the wind speed in the vertical direction. - σpoint-equivalent is called SDpredicted and is calculated by using the parameters A to F. The value of SDpredicted corresponds to σpoint-equivalent. Based on these values the wind bin standard deviation of the standard deviation σpoint-equivalent is calculated. It is important to notice for the wind bin standard deviation of the standard deviation that the values are evaluated with respect to one wind bin. Looking to
lines 1, 2, 3, and 5 of the table we see thatwind speed bin 15 was assigned to the time intervals. The wind bin standard deviation is calculated as the standard deviation of the wind speeds in the wind bins of thelines 1, 2, 3, and 5, that is 14.65, 15.11, 15.3, and 15.36. In this sense the wind bin standard deviation is an indicator for the fluctuation of the wind speed/wind direct within one single win bin. Finally, the value TI90 is obtained by dividing the 90th percentile of the standard deviation, SD90 by the wind speed in the time interval.
Claims (11)
- A method for determining values indicative of a distribution of values of the turbulence intensity, wherein the indicative values are equivalent to values determined based on a point measurement comprising:• Receiving a plurality of remote sensing measurement values of a wind speed and a wind direction,• Determining standard deviation values of the wind speed within a predetermined time interval for a plurality of time intervals, wherein the standard deviation values are determined from the received remote sensing measurement values of the wind speed and the wind direction, wherein the standard deviation values of the wind speed (σu, σv, σw) are determined with respect to a coordinate system (u, v, w), wherein additionally a standard deviation of a horizontal wind speed (σH) is determined,• Determining a standard deviation value of the wind speed equivalent to values determined based on the point measurement (σpoint-equivalent) for at least some of the time intervals, wherein the standard deviation value of the wind speed equivalent to values determined based on a point measurement (σpoint-equivalent) is calculated using the standard deviation values as determined from the received remote sensing measurement values,• Classifying the received remote sensing measurement values for each time interval into at least one wind bin,• Determining wind bin standard deviation values of the standard deviation values of the wind speed equivalent to values determined based on a point measurement (σbin(σpoint-equivalent)), wherein the wind bin standard deviation is calculated as the standard deviation over time intervals classified to the same wind bin, Determining a 90th percentile (σ 90) of the standard deviation of the wind speed equivalent to values determined based on a point measurement (σpoint-equivalent) for each time interval, and• Determining a 90th percentile


- Method of claim 1, wherein the values of the time intervals are classified into a wind speed bin and/or a wind direction bin.
- Method of claim 1 or 2, wherein determining the standard deviation of the wind speed equivalent to values determined based on a point measurement (σpoint-equivalent) is based on at least one of• the standard deviations (σu, σv, σw) in the coordinate system (u, v, w),• a mean horizontal wind speed (WSH),• a standard deviation of a horizontal wind speed (σH), and• a mean horizontal wind direction (WDH) with an angle (θ).
- Method according to one of the claims 1 to 3, wherein the wind bin standard deviation of the standard deviation of the wind speed equivalent to values determined based on a point measurement (σbin (σpoint-equivalent)) is determined for each time interval based a wind speed bin, wherein the wind speed bin is assigned to the values of a time interval based on a mean horizontal wind speed (WSH) within the time interval.
- Method according to one of claims 1 to 4, wherein the 90th percentile (σ 90) of the standard deviation of the wind speed for each wind bin is determined according to:

- Method of one of the preceding claims, wherein the 90th percentile


- Method according to one of the preceding claims, wherein the standard deviation equivalent to a point measurement (σpoint-equivalent) is calculated as follows:

- Method according to claim 7, wherein the standard deviation equivalent to a point measurement (σpoint-equivalent) is calculated as follows:

- Method of one of the claims 1 to 8, wherein the remote sensing measurement values are Lidar-based measurement values for the wind speed and the wind direction.
- Method according to one of the preceding claims, wherein the 90th percentile of the turbulence intensity

- Method according to one of the preceding claims, wherein the plurality of remote sensing measurement values is measured using a remote sensing device, in particular vertical profiling or velocity-azimuth display (VAD) Lidar-based measurement devices.
Priority Applications (1)
| Application Number | Priority Date | Filing Date | Title |
|---|---|---|---|
| EP22210652.8A EP4379430A1 (en) | 2022-11-30 | 2022-11-30 | Method for remote sensing of equivalent point turbulence |
Applications Claiming Priority (1)
| Application Number | Priority Date | Filing Date | Title |
|---|---|---|---|
| EP22210652.8A EP4379430A1 (en) | 2022-11-30 | 2022-11-30 | Method for remote sensing of equivalent point turbulence |
Publications (1)
| Publication Number | Publication Date |
|---|---|
| EP4379430A1 true EP4379430A1 (en) | 2024-06-05 |
Family
ID=84367567
Family Applications (1)
| Application Number | Title | Priority Date | Filing Date |
|---|---|---|---|
| EP22210652.8A Withdrawn EP4379430A1 (en) | 2022-11-30 | 2022-11-30 | Method for remote sensing of equivalent point turbulence |
Country Status (1)
| Country | Link |
|---|---|
| EP (1) | EP4379430A1 (en) |
Cited By (1)
| Publication number | Priority date | Publication date | Assignee | Title |
|---|---|---|---|---|
| CN122049030A (en) * | 2026-04-16 | 2026-05-15 | 青岛华航环境科技有限责任公司 | Low-altitude turbulence mass identification and center point positioning method based on wind-measuring laser radar |
Citations (2)
| Publication number | Priority date | Publication date | Assignee | Title |
|---|---|---|---|---|
| WO2017106323A1 (en) | 2015-12-14 | 2017-06-22 | Alliance For Sustainable Energy, Llc | Lidar-based turbulence intensity error reduction |
| US20220220935A1 (en) * | 2021-01-08 | 2022-07-14 | General Electric Renovables Espana S.L. | Thrust control for wind turbines using active sensing of wind turbulence |
-
2022
- 2022-11-30 EP EP22210652.8A patent/EP4379430A1/en not_active Withdrawn
Patent Citations (3)
| Publication number | Priority date | Publication date | Assignee | Title |
|---|---|---|---|---|
| WO2017106323A1 (en) | 2015-12-14 | 2017-06-22 | Alliance For Sustainable Energy, Llc | Lidar-based turbulence intensity error reduction |
| US20200264313A1 (en) * | 2015-12-14 | 2020-08-20 | Alliance For Sustainable Energy, Llc | Lidar-based turbulence intensity error reduction |
| US20220220935A1 (en) * | 2021-01-08 | 2022-07-14 | General Electric Renovables Espana S.L. | Thrust control for wind turbines using active sensing of wind turbulence |
Non-Patent Citations (1)
| Title |
|---|
| KELBERLAUMANN: "Better Turbulence Spectra from Velocity-Azimuth Display Scanning Wind Lidar", ATMOS. MECH. TECH., vol. 12, 2019, pages 1871 - 1888 |
Cited By (1)
| Publication number | Priority date | Publication date | Assignee | Title |
|---|---|---|---|---|
| CN122049030A (en) * | 2026-04-16 | 2026-05-15 | 青岛华航环境科技有限责任公司 | Low-altitude turbulence mass identification and center point positioning method based on wind-measuring laser radar |
Similar Documents
| Publication | Publication Date | Title |
|---|---|---|
| CN112267980B (en) | Blade clearance monitoring system and method for wind turbines | |
| Verspeek et al. | Validation and calibration of ASCAT using CMOD5. n | |
| Newman et al. | Evaluation of three lidar scanning strategies for turbulence measurements | |
| US8098188B2 (en) | Method of characterizing the convection intensity of a cloud, by a meteorological radar | |
| KR101853122B1 (en) | GROUNDED-BASED LiDAR, APPARATUS AND METHOD FOR CORRECTING MEASUREMENT ERROR FOR LIDAR | |
| Wuertz et al. | Effects of precipitation on UHF wind profiler measurements | |
| US10280897B2 (en) | Methods and systems for controlling a wind turbine | |
| Bradley et al. | Corrections for wind-speed errors from sodar and lidar in complex terrain | |
| CN106845018B (en) | Analysis and Quantitative Evaluation Method of Wind Farm's Impact on Meteorological Radar Rainfall | |
| KR101892502B1 (en) | calculation system for storm relative helicity using wind profiler and calculation method for storm relative helicity using the same | |
| US20200400836A1 (en) | Method of determining the vertical profile of the wind speed upstream from a wind turbine equipped with a lidar sensor | |
| CN113252940B (en) | Method for determining wind direction using LiDAR sensors | |
| US11353624B2 (en) | Calculating a return period wind speed | |
| JP2012021825A (en) | Plan evaluation method for investment in rainfall observation facilities | |
| EP4081837B1 (en) | Method of constructing a wind turbine | |
| Özinan et al. | Power curve measurement of a floating offshore wind turbine with a nacelle-based lidar | |
| CN102426352B (en) | Wind profiling radar based wind calculation method | |
| Wolken-Möhlmann et al. | Analysis of wind speed deviations between floating lidars, fixed lidar and cup anemometry based on experimental data | |
| Duncan Jr et al. | Enhanced estimation of boundary layer advective properties to improve space‐to‐time conversion processes for wind energy applications | |
| CN111832175B (en) | Method and system for measuring sea surface wind speed of scatterometer under rainfall condition | |
| Meyer et al. | Constrained synthetic wind fields from high-resolution 3D WindScanner measurements | |
| KR20170104100A (en) | System and Method For Ground Clutter Removing of WindProfiler | |
| JP2025042877A (en) | Information processing device, weather radar system, information processing method and program | |
| Gutierrez et al. | Performance evaluation of a floating Doppler wind lidar buoy in mediterranean near-shore conditions | |
| CN113719424A (en) | Wind direction correction method and device for wind turbine generator |
Legal Events
| Date | Code | Title | Description |
|---|---|---|---|
| PUAI | Public reference made under article 153(3) epc to a published international application that has entered the european phase |
Free format text: ORIGINAL CODE: 0009012 |
|
| STAA | Information on the status of an ep patent application or granted ep patent |
Free format text: STATUS: THE APPLICATION HAS BEEN PUBLISHED |
|
| AK | Designated contracting states |
Kind code of ref document: A1 Designated state(s): AL AT BE BG CH CY CZ DE DK EE ES FI FR GB GR HR HU IE IS IT LI LT LU LV MC ME MK MT NL NO PL PT RO RS SE SI SK SM TR |
|
| STAA | Information on the status of an ep patent application or granted ep patent |
Free format text: STATUS: THE APPLICATION IS DEEMED TO BE WITHDRAWN |
|
| 18D | Application deemed to be withdrawn |
Effective date: 20241206 |