EP4303548A1 - Dispersion measuring device, and dispersion measuring method - Google Patents
Dispersion measuring device, and dispersion measuring method Download PDFInfo
- Publication number
- EP4303548A1 EP4303548A1 EP22810937.7A EP22810937A EP4303548A1 EP 4303548 A1 EP4303548 A1 EP 4303548A1 EP 22810937 A EP22810937 A EP 22810937A EP 4303548 A1 EP4303548 A1 EP 4303548A1
- Authority
- EP
- European Patent Office
- Prior art keywords
- optical
- dispersion
- optical pulse
- pulse train
- group delay
- Prior art date
- Legal status (The legal status is an assumption and is not a legal conclusion. Google has not performed a legal analysis and makes no representation as to the accuracy of the status listed.)
- Granted
Links
Images













Classifications
-
- G—PHYSICS
- G01—MEASURING; TESTING
- G01M—TESTING STATIC OR DYNAMIC BALANCE OF MACHINES OR STRUCTURES; TESTING OF STRUCTURES OR APPARATUS, NOT OTHERWISE PROVIDED FOR
- G01M11/00—Testing of optical apparatus; Testing structures by optical methods not otherwise provided for
- G01M11/30—Testing of optical devices, constituted by fibre optics or optical waveguides
- G01M11/33—Testing of optical devices, constituted by fibre optics or optical waveguides with a light emitter being disposed at one fibre or waveguide end-face, and a light receiver at the other end-face
- G01M11/338—Testing of optical devices, constituted by fibre optics or optical waveguides with a light emitter being disposed at one fibre or waveguide end-face, and a light receiver at the other end-face by measuring dispersion other than PMD, e.g. chromatic dispersion
-
- G—PHYSICS
- G01—MEASURING; TESTING
- G01J—MEASUREMENT OF INTENSITY, VELOCITY, SPECTRAL CONTENT, POLARISATION, PHASE OR PULSE CHARACTERISTICS OF INFRARED, VISIBLE OR ULTRAVIOLET LIGHT; COLORIMETRY; RADIATION PYROMETRY
- G01J11/00—Measuring the characteristics of individual optical pulses or of optical pulse trains
-
- G—PHYSICS
- G01—MEASURING; TESTING
- G01M—TESTING STATIC OR DYNAMIC BALANCE OF MACHINES OR STRUCTURES; TESTING OF STRUCTURES OR APPARATUS, NOT OTHERWISE PROVIDED FOR
- G01M11/00—Testing of optical apparatus; Testing structures by optical methods not otherwise provided for
- G01M11/02—Testing optical properties
- G01M11/0285—Testing optical properties by measuring material or chromatic transmission properties
-
- G—PHYSICS
- G01—MEASURING; TESTING
- G01M—TESTING STATIC OR DYNAMIC BALANCE OF MACHINES OR STRUCTURES; TESTING OF STRUCTURES OR APPARATUS, NOT OTHERWISE PROVIDED FOR
- G01M11/00—Testing of optical apparatus; Testing structures by optical methods not otherwise provided for
- G01M11/30—Testing of optical devices, constituted by fibre optics or optical waveguides
- G01M11/33—Testing of optical devices, constituted by fibre optics or optical waveguides with a light emitter being disposed at one fibre or waveguide end-face, and a light receiver at the other end-face
- G01M11/333—Testing of optical devices, constituted by fibre optics or optical waveguides with a light emitter being disposed at one fibre or waveguide end-face, and a light receiver at the other end-face using modulated input signals
-
- G—PHYSICS
- G01—MEASURING; TESTING
- G01M—TESTING STATIC OR DYNAMIC BALANCE OF MACHINES OR STRUCTURES; TESTING OF STRUCTURES OR APPARATUS, NOT OTHERWISE PROVIDED FOR
- G01M11/00—Testing of optical apparatus; Testing structures by optical methods not otherwise provided for
- G01M11/30—Testing of optical devices, constituted by fibre optics or optical waveguides
- G01M11/33—Testing of optical devices, constituted by fibre optics or optical waveguides with a light emitter being disposed at one fibre or waveguide end-face, and a light receiver at the other end-face
- G01M11/335—Testing of optical devices, constituted by fibre optics or optical waveguides with a light emitter being disposed at one fibre or waveguide end-face, and a light receiver at the other end-face using two or more input wavelengths
Definitions
- the present disclosure relates to a dispersion measuring device and a dispersion measuring method.
- Patent Literature 1 discloses a dispersion measuring device and a dispersion measuring method capable of measuring a wavelength dispersion amount of a pulsed laser light source.
- an optical pulse train including a plurality of optical pulses having a time difference and having center wavelengths different from each other is formed from an optical pulse to be measured output from the pulsed laser light source.
- the optical pulse train enters into a correlation optical system.
- correlated light including cross-correlation or autocorrelation of the optical pulse train is output from the correlation optical system.
- the temporal waveform of the correlated light is detected, and the wavelength dispersion amount of the pulsed laser light source is estimated from the feature amount of the temporal waveform of the detected correlated light.
- Patent Literature 1 Japanese Unexamined Patent Publication No. 2020-169946
- the wavelength dispersion amount of a measurement object When the wavelength dispersion amount of a measurement object is measured, a plurality of optical pulses having a time difference and having center wavelengths different from each other are transmitted through the measurement object. Thus, it is possible to estimate the wavelength dispersion amount of the measurement object based on the temporal waveforms of the plurality of optical pulses after being transmitted through the measurement object.
- the measurement accuracy of the wavelength dispersion amount may be lowered.
- the measurement object is a non-linear medium such as an optical fiber or an optical waveguide
- a non-linear optical phenomenon occurs when the peak intensity of the optical pulse exceeds a certain threshold value in the measurement object.
- This phenomenon distorts the temporal waveform of the optical pulse.
- the measurement object may be damaged.
- the peak intensity of the optical pulse entering into the measurement object is large, it may not possible to accurately measure the wavelength dispersion amount of the measurement object based on the temporal waveform of the optical pulse transmitted through the measurement object.
- the peak intensity of the optical pulse entering into the measurement object when the peak intensity of the optical pulse entering into the measurement object is small, the peak intensity of the optical pulse may be less than a detection threshold value in a detector that detects the temporal waveform of the optical pulse transmitted through the measurement object. In this case, since the detection accuracy of the temporal waveform of the optical pulse is lowered, it is not possible to accurately measure the wavelength dispersion amount of the measurement object based on the temporal waveform of the optical pulse.
- An object of one aspect of the present disclosure is to provide a dispersion measuring device and a dispersion measuring method capable of more accurately measuring a wavelength dispersion amount of a measurement object.
- a dispersion measuring device includes a light source, a pulse forming unit, a dispersion medium, a correlator, and an arithmetic operation unit.
- the light source outputs a first optical pulse.
- the pulse forming unit includes a spatial light modulator that presents a phase pattern for generating modulated light by applying a predetermined phase shift for each wavelength to the first optical pulse.
- the pulse forming unit forms, from the first optical pulse, an optical pulse train that is modulated light including a plurality of second optical pulses having a time difference from each other and having center wavelengths different from each other.
- the dispersion medium has a positive or negative group delay dispersion and receives an optical pulse train.
- the correlator includes a correlation optical system and a detector.
- the correlation optical system receives an optical pulse train transmitted through the dispersion medium and outputs correlated light including a plurality of third optical pulses that are cross-correlation or autocorrelation of the optical pulse train.
- the detector detects a temporal waveform of the correlated light.
- the correlator detects the temporal waveform of the correlated light formed from the optical pulse train having a peak intensity equal to or greater than a detection threshold value.
- the arithmetic operation unit is electrically connected to the correlator.
- a measurement object is disposed on an optical path between the pulse forming unit and the dispersion medium.
- the arithmetic operation unit estimates a wavelength dispersion amount of the measurement object based on the temporal waveform of the correlated light.
- the dispersion medium gives a group delay dispersion to the plurality of second optical pulses included in the optical pulse train to increase the peak intensity of the second optical pulse to be equal to or greater than the detection threshold value.
- the phase pattern includes a pattern for giving a group delay dispersion having a sign opposite to the group delay dispersion of the dispersion medium to the first pulse.
- a dispersion measuring method includes an output step, a pulse forming step, a dispersion medium transmission step, a detection step, and an arithmetic operation step.
- a first optical pulse is output.
- an optical pulse train is formed from the first optical pulse by using a spatial light modulator that presents a phase pattern for generating modulated light by applying a predetermined phase shift for each wavelength to the first optical pulse, the optical pulse train being modulated light including a plurality of second optical pulses having a time difference from each other and having center wavelengths different from each other.
- the optical pulse train is transmitted through the measurement object, and then is transmitted through a dispersion medium having positive or negative group delay dispersion.
- the detection step the optical pulse train transmitted through the dispersion medium is received, correlated light including a plurality of third optical pulses that are cross-correlation or autocorrelation of the optical pulse train is generated, and a temporal waveform of the correlated light is detected.
- the temporal waveform of the correlated light formed from the optical pulse train having a peak intensity equal to or greater than a detection threshold value is detected.
- a wavelength dispersion amount of the measurement object is estimated based on the temporal waveform of the correlated light.
- the phase pattern includes a phase pattern for giving a group delay dispersion having a sign opposite to the group delay dispersion of the dispersion medium to the first optical pulse.
- a dispersion measuring device includes a light source, a pulse forming unit, a correlation optical system, a dispersion medium, a detector, and an arithmetic operation unit.
- the light source outputs a first optical pulse.
- the pulse forming unit includes a spatial light modulator that presents a phase pattern for generating modulated light by applying a predetermined phase shift for each wavelength to the first optical pulse.
- the pulse forming unit forms, from the first optical pulse, an optical pulse train that is modulated light including a plurality of second optical pulses having a time difference from each other and having center wavelengths different from each other.
- the correlation optical system receives an optical pulse train and outputs correlated light including a plurality of third optical pulses that are cross-correlation or autocorrelation of the optical pulse train.
- the dispersion medium has a positive or negative group delay dispersion and receives the correlated light.
- the detector receives the correlated light transmitted through the dispersion medium and detects a temporal waveform of the correlated light having a peak intensity equal to or greater than a detection threshold value.
- the arithmetic operation unit is electrically connected to the detector.
- a measurement object is disposed on an optical path between the pulse forming unit and the correlation optical system.
- the arithmetic operation unit estimates a wavelength dispersion amount of the measurement object based on the temporal waveform of the correlated light.
- the dispersion medium gives a group delay dispersion to a plurality of third optical pulses included in the correlated light to increase peak intensities of the plurality of third optical pulses to be equal to or greater than the detection threshold value.
- the phase pattern includes a pattern for giving a group delay dispersion having a sign opposite to the group delay dispersion of the dispersion medium to the first pulse.
- a dispersion measuring method includes an output step, a pulse forming step, a correlated-light output step, a dispersion medium transmission step, a detection step, and an arithmetic operation step.
- a first optical pulse is output.
- an optical pulse train is formed from the first optical pulse by using a spatial light modulator that presents a phase pattern for generating modulated light by applying a predetermined phase shift for each wavelength to the first optical pulse, the optical pulse train being modulated light including a plurality of second optical pulses having a time difference from each other and having center wavelengths different from each other.
- correlated light including a plurality of third optical pulses that are cross-correlation or autocorrelation of the optical pulse train is output after the optical pulse train is transmitted through a measurement object.
- the correlated light is transmitted through a dispersion medium having a positive or negative group delay dispersion.
- the detection step a temporal waveform of the correlated light transmitted through the dispersion medium is detected.
- a wavelength dispersion amount of the measurement object is estimated based on the temporal waveform of the correlated light.
- the temporal waveform of the correlated light having a peak intensity equal to or greater than a detection threshold value is detected.
- the phase pattern includes a pattern for giving a group delay dispersion having a sign opposite to the group delay dispersion of the dispersion medium to the first optical pulse.
- a positive or negative group delay dispersion is given to the first optical pulse in the pulse forming unit (pulse forming step).
- the peak intensity of the second optical pulse is suppressed.
- the peak intensity of the second optical pulse propagating in the measurement object can be made equal to or smaller than a threshold value of the non-linear optical phenomenon.
- the peak intensity of the second pulse or the third pulse after being transmitted through the measurement object can be made equal to or greater than the detection threshold value of the correlator or the detector. This makes it possible to accurately detect the temporal waveform of the correlated light. From the above, it is possible to more accurately measure the wavelength dispersion amount of the measurement object.
- the group delay dispersion given from the phase pattern may be a negative group delay dispersion
- the group delay dispersion given from the dispersion medium may be a positive group delay dispersion.
- Many types of dispersion media give the positive group delay dispersion. Therefore, according to the above devices and methods, it is possible to select more types of dispersion media as the dispersion medium in the above-described devices and methods, as compared with a case where the group delay dispersion given from the dispersion medium is the negative group delay dispersion.
- the phase pattern may be a phase pattern for giving the group delay dispersion in which the peak intensities of the plurality of second optical pulses fall below the threshold value of the non-linear optical phenomenon to the first optical pulse in the measurement object. According to the devices and methods, since the occurrence of the non-linear optical phenomenon is suppressed, it is possible to suppress the distortion of the temporal waveforms of the plurality of second optical pulses, and eventually suppress the distortion of the temporal waveform of the correlated light.
- the dispersion medium may be made of a material in which the non-linear optical phenomenon does not occur.
- the dispersion medium may be an optical fiber, an optical waveguide, a semiconductor, a dielectric optical crystal, a grating pair, a prism pair, or a glass body.
- the dispersion medium may be a single mode fiber, a multi-mode fiber, a rare-earth-doped fiber, a photonic crystal fiber, a dispersion shifted fiber, or a double clad fiber.
- the dispersion medium may be a semiconductor waveguide containing SiN or InP.
- the dispersion medium may be diamond, SiO 2 , LiNbO 3 , LiTaO 3 , lanthanum-doped lead zirconate titanate, Si, Ge, fullerene, graphite, graphene, carbon nanotube, GaN, GaAs, a magnetic body, an organic material, or a polymer material.
- the dispersion measuring device and the dispersion measuring method according to the aspect of the present disclosure it is possible to more accurately measure a wavelength dispersion amount of a measurement object.
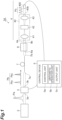
- FIG. 1 is a schematic diagram illustrating a configuration of a dispersion measuring device 1A according to an embodiment of the present disclosure.
- the dispersion measuring device 1A is a device that measures a wavelength dispersion amount of an optical component 7 as a measurement object.
- the dispersion measuring device 1A includes a pulsed laser light source 2 (light source), a pulse forming unit 3, a dispersion medium 8, a correlator 4, and a control device 5.
- a light input end 3a of the pulse forming unit 3 is optically coupled to the pulsed laser light source 2 spatially or via an optical waveguide such as an optical fiber.
- a light input end 7a of the optical component 7 is optically coupled to a light output end 3b of the pulse forming unit 3 spatially or via an optical waveguide such as an optical fiber.
- a light input end 8a of the dispersion medium 8 is optically coupled to a light output end 7b of the optical component 7 spatially or via an optical waveguide such as an optical fiber.
- Alight input end 4a of the correlator 4 is optically coupled to a light output end 8b of the dispersion medium 8 spatially or via an optical waveguide such as an optical fiber.
- the control device 5 is electrically connected to the pulse forming unit 3 and the correlator 4.
- the correlator 4 includes a correlation optical system 40 and a detector 400.
- a light output end 40b of the correlation optical system 40 is optically coupled to the detector 400 spatially or via an optical waveguide such as an optical fiber.
- the control device 5 includes a control unit 5a, an arithmetic operation unit 5b, and an output unit 5c.
- the pulsed laser light source 2 outputs a coherent optical pulse Pa (first optical pulse).
- the pulsed laser light source 2 is, for example, a femtosecond laser, and is a solid-state laser light source such as an LD direct excitation Yb:YAG pulsed laser in an example.
- the temporal waveform of the optical pulse Pa has, for example, a Gaussian function shape.
- the full width at half maximum (FWHM) of the optical pulse Pa is, for example, in the range of 10 fs to 10,000 fs, and is 100 fs in an example.
- the optical pulse Pa is an optical pulse having a certain bandwidth and includes a plurality of continuous wavelength components. In an example, the bandwidth of the optical pulse Pa is 10 nm and the center wavelength of the optical pulse Pa is 1030 nm.
- the pulse forming unit 3 is a part that forms an optical pulse train Pb from the optical pulse Pa.
- the optical pulse train Pb includes a plurality of optical pulses Pb 1 and Pb 2 (plurality of second optical pulses) having a time difference from each other and having different center wavelengths from each other.
- the optical pulse train Pb is a single pulse group generated by dividing a spectrum constituting the optical pulse Pa into a plurality of wavelength bands and using each wavelength band. At boundaries among the plurality of wavelength bands, the plurality of wavelength bands may overlap each other.
- the optical pulse train Pb may be referred to as a "band-controlled multi-pulse".
- FIG. 2 is a diagram illustrating a configuration example of the pulse forming unit 3.
- the pulse forming unit 3 includes a diffraction grating 12, a lens 13, a spatial light modulator (SLM) 14, a lens 15, and a diffraction grating 16.
- the diffraction grating 12 is a spectroscopic element in the present embodiment, and is optically coupled to the pulsed laser light source 2.
- the SLM 14 is optically coupled to the diffraction grating 12 via the lens 13.
- the diffraction grating 12 spatially separates a plurality of wavelength components included in the optical pulse Pa from each other for each wavelength.
- another optical component such as a prism may be used instead of the diffraction grating 12.
- the optical pulse Pa obliquely enters to the diffraction grating 12 and is dispersed into a plurality of wavelength components.
- Light P1 including the plurality of wavelength components is focused by the lens 13 for each wavelength component, and an image is formed on the modulation surface of the SLM 14.
- the lens 13 may be a convex lens made of a light transmitting member or a concave mirror having a concave light reflection surface.
- the SLM 14 applies a predetermined phase shift for each wavelength to the optical pulse Pa in order to convert the optical pulse Pa into the optical pulse train Pb (modulated light). Specifically, the SLM 14 receives a control signal from the control unit 5a (see FIG. 1 ) in order to generate the optical pulse train Pb by applying a phase shift to the optical pulse Pa. The SLM 14 presents a phase pattern by receiving the control signal output from the control unit 5a. The SLM 14 simultaneously performs phase modulation and intensity modulation of the light P1 by using the presented phase pattern. In this manner, the SLM 14 shifts the phases of the plurality of wavelength components output from the diffraction grating 12 from each other. The SLM 14 may perform only phase modulation or only intensity modulation. The SLM 14 is, for example, a phase modulation type. In an example, the SLM 14 is a liquid crystal on silicon (LCOS) type. Although the transmissive SLM 14 is illustrated in the drawings, the SLM 14 may be a reflective type.
- LCOS liquid crystal
- FIG. 3 is a diagram illustrating the modulation surface 17 of the SLM 14. As illustrated in FIG. 3 , on the modulation surface 17, a plurality of modulation regions 17a are arranged along a certain direction A, and each modulation region 17a extends in a direction B intersecting the direction A.
- the direction A is a spectral direction by the diffraction grating 12.
- the modulation surface 17 functions as a Fourier transform surface, and each corresponding wavelength component after being dispersed is incident on each of the plurality of modulation regions 17a.
- the SLM 14 modulates the phase and the intensity of each incident wavelength component independently from the other wavelength components in each modulation region 17a. Since the SLM 14 in the present embodiment is the phase modulation type, the intensity modulation is realized by the phase pattern (phase image) presented on the modulation surface 17.
- Each wavelength component of the modulated light P2 modulated by the SLM 14 is focused at a point on the diffraction grating 16 by the lens 15.
- the lens 15 functions as a focusing optical system for focusing the modulated light P2.
- the lens 15 may be a convex lens made of a light transmitting member or a concave mirror having a concave light reflection surface.
- the diffraction grating 16 functions as a combining optical system and combines the modulated wavelength components. That is, the plurality of wavelength components of the modulated light P2 are focused and combined with each other by the lens 15 and the diffraction grating 16 to obtain a band-controlled multi-pulse (optical pulse train Pb).
- the phase pattern presented on the modulation surface 17 is such that a phase pattern for giving a positive (normal) or negative (anomalous) group delay dispersion (GDD) to the optical pulse Pa, that is, for making the optical pulse train Pb have a positive or negative group delay dispersion, is superimposed on a phase pattern for generating the optical pulse train Pb.
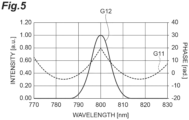
- FIGS. 4 and 5 illustrate examples of a spectral waveform (spectrum phase G11 and spectrum intensity G12) of output light from the pulse forming unit 3.
- the horizontal axis indicates the wavelength (nm)
- the left vertical axis indicates the intensity value (arbitrary unit) of an intensity spectrum
- the right vertical axis indicates the phase value (rad) of a phase spectrum.
- the spectral waveform illustrated in FIG. 4 illustrates a case where a negative group delay dispersion is given.
- the spectral waveform illustrated in FIG. 5 illustrates a case where a positive group delay dispersion is given.
- FIG. 6 is a diagram illustrating an example of a relationship between the group delay dispersion given to the optical pulse Pa by the modulation surface 17 and the peak intensities of the optical pulses Pb 1 and Pb 2 .
- the vertical axis indicates the peak intensities of the optical pulses Pb 1 and Pb 2
- the horizontal axis indicates the group delay dispersion given to the optical pulse Pa by the modulation surface 17.
- the peak intensities of the optical pulses Pb 1 and Pb 2 depend on the group delay dispersion.
- the peak intensities of the optical pulses Pb 1 and Pb 2 are maximized.
- the peak intensities of the optical pulses Pb 1 and Pb 2 decrease as the absolute value of the group delay dispersion increases.
- the "peak intensity of the optical pulse” means the peak intensity of the optical pulse in the time domain unless otherwise specified.
- the peak intensities of the optical pulses Pb 1 and Pb 2 in the time domain are reduced while the intensities of the optical pulses Pb 1 and Pb 2 in the spectrum domain are maintained.
- the phase pattern presented on the modulation surface 17 is a phase pattern for giving, to the optical pulse Pa, the group delay dispersion in which the maximum intensities of the optical pulses Pb 1 and Pb 2 fall below the threshold value of the non-linear optical phenomenon in the optical component 7.
- the phase pattern gives the positive or negative group delay dispersion to the optical pulse Pa
- the peak intensity of the optical pulse train Pb output from the pulse forming unit 3 is reduced.
- the sign of the group delay dispersion is equal to the sign of a group velocity dispersion which is the group delay dispersion per unit length.
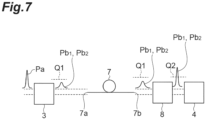
- FIG. 7 is a conceptual diagram illustrating how the peak intensities of the optical pulses Pb 1 and Pb 2 change.
- the peak intensities of the optical pulses Pb 1 and Pb 2 fall below the threshold value Q1 of the non-linear optical phenomenon of the optical component 7.
- the peak intensities of the optical pulses Pb 1 and Pb 2 further change due to the group delay dispersion of the optical component 7.
- the peak intensities of the optical pulses Pb 1 and Pb 2 is preferably lower than the threshold value Q1 of the non-linear optical phenomenon.
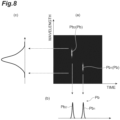
- FIG. 8 is a diagram illustrating an example of a band-controlled multi-pulse.
- the optical pulse train Pb including the optical pulses Pb 1 and Pb 2 is illustrated.
- FIG. 8(a) is a spectrogram, in which the horizontal axis indicates the time and the vertical axis indicates the wavelength, and light intensity is represented by color gradation.
- FIG. 8(b) illustrates the temporal waveform of the optical pulse train Pb.
- the temporal waveform of each of the optical pulses Pb 1 and Pb 2 has, for example, a Gaussian function shape. As illustrated in FIGS.
- peaks of the optical pulses Pb 1 and Pb 2 are temporally separated from each other, and propagation timings of the optical pulses Pb 1 and Pb 2 are shifted from each other.
- another optical pulse Pb 1 has a time delay, and the optical pulses Pb 1 and Pb 2 have a time difference from each other.
- the center wavelengths of the optical pulses Pb 1 and Pb 2 are different from each other.
- the center wavelength of the optical pulse Pb 1 is, for example, 805 nm.
- the center wavelength of the optical pulse Pb 2 is, for example, 795 nm.
- the time interval (peak interval) between the optical pulses Pb 1 and Pb 2 is, for example, in a range of 10 fs to 10,000 fs, and is 2000 fs in an example.
- the FWHM of the optical pulses Pb 1 and Pb 2 is, for example, in a range of 10 fs to 5000 fs, and is 300 fs in an example.
- FIG. 8(c) illustrates a spectrum obtained by combining two optical pulses Pb 1 and Pb 2 .
- the spectrum obtained by combining the two optical pulses Pb 1 and Pb 2 has a single peak.
- the center wavelengths of the two optical pulses Pb 1 and Pb 2 are shifted from each other.
- the single peak illustrated in FIG. 8(c) substantially corresponds to the spectrum of the optical pulse Pa.
- the peak wavelength interval between the adjacent optical pulses Pb 1 and Pb 2 is determined by the spectral bandwidth of the optical pulse Pa and is approximately in a range of twice the full width at half maximum.
- the peak wavelength interval is 10 nm.
- the peak wavelengths of the optical pulses Pb 1 and Pb 2 can be 1555 nm and 1545 nm, respectively.
- FIG. 9 is a diagram illustrating an example of a multi-pulse of which a band is not controlled, as a comparative example.
- an optical pulse train Pd including two optical pulses Pd 1 and Pd 2 is illustrated.
- FIG. 9(a) is a spectrogram, in which the horizontal axis indicates the time and the vertical axis indicates the wavelength, and the light intensity is represented by color gradation.
- FIG. 9(b) illustrates the temporal waveform of the optical pulse train Pd.
- FIG. 9(c) illustrates a spectrum obtained by combining the two optical pulses Pd 1 and Pd 2 . As illustrated in FIGS.
- the peaks of the two optical pulses Pd 1 and Pd 2 are temporally separated from each other, but the center wavelengths of the two optical pulses Pd 1 and Pd 2 coincide with each other.
- the pulse forming unit 3 in the present embodiment does not generate such an optical pulse train Pd, but generates an optical pulse train Pb having different center wavelengths as illustrated in FIG. 8 .
- the dispersion medium 8 receives the optical pulse train Pb output from the pulse forming unit 3.
- the dispersion medium 8 has the positive or negative group delay dispersion.
- the sign of the group delay dispersion of the dispersion medium 8 is opposite to the sign of the group delay dispersion given to the optical pulse Pa in the pulse forming unit 3. That is, in a case where the positive group delay dispersion is given to the optical pulse Pa in the pulse forming unit 3, the dispersion medium 8 has the negative group delay dispersion. In a case where the negative group delay dispersion is given to the optical pulse Pa in the pulse forming unit 3, the dispersion medium 8 has the positive group delay dispersion.
- the dispersion medium 8 gives the group delay dispersion to the optical pulses Pb 1 and Pb 2 included in the optical pulse train Pb.
- the dispersion medium 8 increases the peak intensities of the optical pulses Pb 1 and Pb 2 contrary to the pulse forming unit 3, and makes the peak intensities of the optical pulses Pb 1 and Pb 2 equal to or greater than the detection threshold value of the correlator 4.
- the optical pulse train Pb transmitted through the dispersion medium 8 is output from the light output end 8b.
- the dispersion medium 8 gives, to the optical pulse train Pb, the group delay dispersion having a sign opposite to the group delay dispersion given to the optical pulse Pa in the pulse forming unit 3.
- the peak intensity of the optical pulse train Pb in the dispersion medium 8 is increased.
- the dispersion medium 8 is a medium in which the dispersion is not zero.
- the dispersion medium 8 may be, for example, a light guide member such as an optical fiber or an optical waveguide, or may be a semiconductor or a dielectric optical crystal.
- the optical fiber include a single mode fiber, a multi-mode fiber, a rare-earth-doped fiber, a photonic crystal fiber, a dispersion shifted fiber, and a double clad fiber.
- the optical waveguide include semiconductor micro-waveguides of SiN, InP, and the like.
- Examples of the semiconductor or the dielectric optical crystal include diamond, SiO 2 , LiNbO 3 , LiTaO 3 , lanthanum-doped lead zirconate titanate (PLZT), Si, Ge, fullerene, graphite, graphene, carbon nanotube, GaN, GaAs, a magnetic body, an organic material, and a polymer material.
- the dispersion medium 8 may be, for example, a grating pair, a prism pair, or the like.
- the dispersion medium 8 may be, for example, glass such as BK7. In a case where the dispersion of the optical component 7 is large, the dispersion medium 8 may be, for example, SF11 or the like having large dispersion.
- the dispersion medium 8 is preferably a dispersion medium in which the non-linear optical phenomenon does not occur, and it is sufficient that the dispersion medium is a dispersion medium in which the non-linear optical phenomenon hardly occurs. It is sufficient that the dispersion medium 8 has a sufficiently small non-linear optical effect, for example.
- the correlation optical system 40 receives the optical pulse train Pb output from the dispersion medium 8 via the dispersion medium 8 and outputs the correlated light Pc.
- the correlated light Pc includes a plurality of optical pulses (plurality of third optical pulses) that are cross-correlation or autocorrelation of the optical pulse train Pb.
- the correlation optical system 40 includes a lens 41, an optical element 42, and a lens 43.
- the lens 41 is provided on an optical path between the pulse forming unit 3 and the optical element 42, and focuses the optical pulse train Pb output from the pulse forming unit 3 on the optical element 42.
- the optical element 42 is, for example, a light-emitting object including one or both of a phosphor and a non-linear optical crystal that generates a second harmonic wave (SHG).
- the non-linear optical crystal include a KTP (KTiOPO 4 ) crystal, an LBO (LiB 3 O 5 ) crystal, a BBO ( ⁇ -BaB 2 O 4 ) crystal, and the like.
- the phosphor include coumarin, stilbene, rhodamine, and the like.
- the optical element 42 generates correlated light Pc including cross-correlation or autocorrelation of the optical pulse train Pb by receiving an input of the optical pulse train Pb.
- the lens 43 collimates or focuses the correlated light Pc output from the optical element 42.
- the correlated light Pc is light generated to more accurately calculate the feature amount of the temporal waveform of the optical pulse train Pb.
- FIG. 10 is a schematic diagram illustrating a correlation optical system 40A for generating correlated light Pc including autocorrelation of the optical pulse train Pb, as the configuration example of the correlation optical system 40.
- the correlation optical system 40A includes a beam splitter 44 as an optical branching component that branches the optical pulse train Pb into two pieces.
- the beam splitter 44 is optically coupled to the pulse forming unit 3 via the dispersion medium 8 illustrated in FIG. 1 .
- the beam splitter 44 transmits a part of the optical pulse train Pb input from the pulse forming unit 3 via the dispersion medium 8, and reflects the remaining part.
- the branching ratio of the beam splitter 44 is, for example, 1:1.
- One optical pulse train Pba branched by the beam splitter 44 reaches the lens 41 through an optical path 40c including a plurality of mirrors 45.
- the other optical pulse train Pbb branched by the beam splitter 44 reaches the lens 41 through an optical path 40d including a plurality of mirrors 46.
- the optical length of the optical path 40c is different from the optical length of the optical path 40d. Therefore, the plurality of mirrors 45 and the plurality of mirrors 46 constitute a delay optical system that applies a time difference to one optical pulse train Pba and the other optical pulse train Pbb branched by the beam splitter 44. Further, at least some of the plurality of mirrors 46 are mounted on a moving stage 47, and thus the optical length of the optical path 40d becomes variable. Therefore, in this configuration, it is possible to make the time difference between the optical pulse train Pba and the optical pulse train Pbb variable.
- the optical element 42 includes a non-linear optical crystal.
- the lens 41 focuses each of the optical pulse trains Pba and Pbb toward the optical element 42, and causes the optical axes of the optical pulse trains Pba and Pbb to intersect each other at a predetermined angle in the optical element 42.
- a second harmonic wave is generated starting from the intersection of the optical pulse trains Pba and Pbb.
- the second harmonic wave is the correlated light Pc and includes autocorrelation of the optical pulse train Pb.
- the correlated light Pc is collimated or focused by the lens 43 and then input to the detector 400.
- FIG. 11 is a schematic diagram illustrating a correlation optical system 40B for generating correlated light Pc including cross-correlation of the optical pulse train Pb, as another configuration example of the correlation optical system 40.
- the optical pulse train Pb reaches the lens 41 through an optical path 40e
- a reference optical pulse Pr which is a single pulse
- the optical path 40f includes a plurality of mirrors 48 and is bent in a U shape. Further, at least some of the plurality of mirrors 48 are mounted on a moving stage 49, and thus the optical length of the optical path 40f becomes variable. Therefore, in this configuration, it is possible to make the time difference between the optical pulse train Pb and the reference optical pulse Pr (timing difference to reach the lens 41) variable.
- the optical element 42 includes a non-linear optical crystal.
- the lens 41 focuses the optical pulse train Pb and the reference optical pulse Pr toward the optical element 42, and causes the optical axis of the optical pulse train Pb to intersect the optical axis of the reference optical pulse Pr at a predetermined angle in the optical element 42.
- a second harmonic wave is generated starting from the intersection of the optical pulse train Pb and the reference optical pulse Pr.
- the second harmonic wave is the correlated light Pc and includes cross-correlation of the optical pulse train Pb.
- the correlated light Pc is collimated or focused by the lens 43 and then input to the detector 400.
- FIG. 12 is a schematic diagram illustrating a correlation optical system 40C for generating correlated light Pc including cross-correlation of the optical pulse train Pb, as still another configuration example of the correlation optical system 40.
- the SLM 14 of the pulse forming unit 3 is a polarization-dependent spatial light modulator having a modulation effect in a first polarization direction.
- the deflection plane of the optical pulse Pa input to the pulse forming unit 3 is inclined with respect to the polarization direction in which the SLM 14 has a modulation function.
- the optical pulse Pa includes a polarization component (arrow Dpi in FIG.) in the first polarization direction and a polarization component (symbol Dp 2 in FIG.) in a second polarization direction perpendicular to the first polarization direction.
- the polarization of the optical pulse Pa is not limited to the above-described polarization (inclined linear polarization), and may be elliptically polarized light.
- the polarization component of the optical pulse Pa in the first polarization direction is modulated in the SLM 14 and output from the pulse forming unit 3 as the optical pulse train Pb.
- the polarization component of the optical pulse Pa in the second polarization direction is output from the pulse forming unit 3 as it is without being modulated in the SLM 14.
- the unmodulated polarization component is provided to the correlation optical system 40 coaxially with the optical pulse train Pb as the reference optical pulse Pr that is a single pulse.
- the correlation optical system 40 generates correlated light Pc including cross-correlation of the optical pulse train Pb from the optical pulse train Pb and the reference optical pulse Pr.
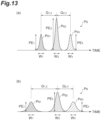
- FIG. 13(a) illustrates the temporal waveform of the correlated light Pc in a case where the wavelength dispersion amount of the optical component 7 is zero.
- FIG. 13(b) illustrates the temporal waveform of the correlated light Pc in a case where the wavelength dispersion amount of the optical component 7 is not zero.
- peak intensities PE 1 to PE 3 of optical pulses Pc 1 to Pc 3 included in the correlated light Pc in FIG. 13(b) are greatly reduced as compared with those of FIG. 13(a) .
- the full widths at half maximum Wi to W 3 of the optical pulses Pc 1 to Pc 3 included in the correlated light Pc in FIG. 13(b) are significantly enlarged as compared with those of FIG. 13(a) .
- a peak time interval G 1,2 of the correlated light Pc in FIG. 13(b) is largely longer than that in FIG. 13(a) .
- the peak intensities PE 1 to PE 3 , the full widths at half maximum Wi to W 3 , and the peak time intervals G 1,2 , and G 2,3 which are the feature amounts of the temporal waveform of the correlated light Pc, greatly change as compared with a case where the wavelength dispersion amount of the optical component 7 is zero.
- the amount of change depends on the wavelength dispersion amount of the optical component 7.
- the wavelength dispersion amount of the optical component 7 may be corrected by using a known wavelength dispersion amount of the pulsed laser light source 2.
- the detector 400 receives the correlated light Pc output from the correlation optical system 40.
- the detector 400 detects the temporal waveform of the correlated light Pc formed from the optical pulse train Pb having a peak intensity equal to or greater than the detection threshold value of the correlator 4.
- the detector 400 is configured to include, for example, a photodetector such as a photodiode.
- the detector 400 detects the temporal waveform of the correlated light Pc by converting the intensity of the correlated light Pc into an electrical signal. The electric signal that is the detection result is provided to the arithmetic operation unit 5b.
- the detection threshold value of the correlator 4 is a value determined based on the characteristics of the correlation optical system 40 and the detector 400. Since the optical pulse train Pb having a peak intensity equal to or greater than the detection threshold value of the correlator 4 enters into the correlation optical system 40, it is possible for the detector 400 to accurately detect the temporal waveform of the optical pulse train Pb.
- the arithmetic operation unit 5b is electrically connected to the detector 400.
- the arithmetic operation unit 5b estimates the wavelength dispersion amount of the optical component 7 based on the feature amount of the temporal waveform provided from the detector 400.
- various feature amounts for example, pulse interval, peak intensity, pulse width, and the like
- the arithmetic operation unit 5b can accurately estimate the wavelength dispersion amount of the optical component 7 as the measurement object by evaluating the feature amount of the temporal waveform of the correlated light Pc.
- the output unit 5c outputs the estimation result of the wavelength dispersion amount obtained by the arithmetic operation unit 5b.
- the output unit 5c is, for example, a display device that displays the estimation result of the wavelength dispersion amount.
- the optical component 7 is disposed on the optical path between the pulse forming unit 3 and the dispersion medium 8.
- the optical component 7 is, for example, a light guide member such as an optical fiber or an optical waveguide.
- the optical fiber include a single mode fiber, a multi-mode fiber, a rare-earth-doped fiber, a photonic crystal fiber, a dispersion shifted fiber, and a double clad fiber.
- the optical waveguide include semiconductor micro-waveguides of SiN, InP, and the like.
- the optical component 7 may be, for example, a semiconductor or a dielectric optical crystal.
- the optical component 7 may be diamond, SiO 2 , LiNbO 3 , LiTaO 3 , PLZT, Si, Ge, fullerene, graphite, graphene, carbon nanotube, GaN, GaAs, a magnetic body, an organic material, a polymer material, or the like.
- the sign of the group delay dispersion given by the phase pattern presented to the SLM 14, the sign of the group delay dispersion of the optical component 7, and the sign of the group delay dispersion of the dispersion medium 8 will be described.
- the peak intensities of the optical pulses Pb 1 and Pb 2 are reduced by the group delay dispersion given to the optical pulse Pa by the phase pattern presented in the SLM 14, and the peak intensities of the optical pulses Pb 1 and Pb 2 are increased by the group delay dispersion of the dispersion medium 8. Therefore, it is sufficient that the sign of the group delay dispersion given by the phase pattern presented to the SLM 14 is opposite to the sign of the group delay dispersion of the dispersion medium 8.
- the sign of the group delay dispersion of the optical component 7 may be either positive or negative. It is more preferable that the group delay dispersion given by the phase pattern presented to the SLM 14 be a negative group delay dispersion, and the group delay dispersion given by the dispersion medium 8 be a positive group delay dispersion.
- the group delay dispersion provided by many types of dispersion media is a positive group delay dispersion. Therefore, in a case where the group delay dispersion given from the dispersion medium 8 is the positive group delay dispersion, it is possible to select more types of dispersion media as the dispersion medium 8 in the present embodiment, as compared with a case where the group delay dispersion given from the dispersion medium 8 is the negative group delay dispersion.
- FIG. 14 is a schematic diagram illustrating a configuration example of hardware of the control device 5.
- the control device 5 may be physically configured as a normal computer including a processor (CPU) 51, a main storage device such as a ROM 52 and a RAM 53, an input device 54 such as a keyboard, a mouse, and a touch screen, an output device 55 such as a display (including a touch screen), a communication module 56 (such as a network card) for transmitting and receiving data to and from other devices, an auxiliary storage device 57 such as a hard disk, and the like.
- a processor CPU
- main storage device such as a ROM 52 and a RAM 53
- an input device 54 such as a keyboard, a mouse, and a touch screen
- an output device 55 such as a display (including a touch screen)
- a communication module 56 such as a network card
- the processor 51 of the computer can realize the function of the arithmetic operation unit 5b by a wavelength dispersion amount calculation program.
- the wavelength dispersion amount calculation program causes the processor 51 of the computer to operate as the arithmetic operation unit 5b.
- the wavelength dispersion amount calculation program is stored in a storage device (storage medium) inside or outside the computer, for example, the auxiliary storage device 57.
- the storage device may be a non-transitory recording medium. Examples of the recording medium include a recording medium such as a flexible disk, a CD, and a DVD, a recording medium such as a ROM, a semiconductor memory, and a cloud server.
- the output device 55 such as a display (including a touch screen) operates as the output unit 5c.
- the auxiliary storage device 57 stores the feature amount of the temporal waveform of the correlated light Pc theoretically calculated in advance (or measured in advance) on the assumption that the wavelength dispersion amount of the optical component 7 is zero. By comparing the stored feature amount with the feature amount of the temporal waveform of the correlated light Pc detected by the detector 400, it can be seen how much the feature amount of the correlated light Pc has changed due to the wavelength dispersion amount of the optical component 7. Therefore, the arithmetic operation unit 5b can estimate the wavelength dispersion amount of the optical component 7 by comparing the feature amount stored in the auxiliary storage device 57 with the feature amount of the temporal waveform of the correlated light Pc detected by the detector 400.
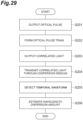
- FIG. 15 is a flowchart illustrating a dispersion measuring method using the dispersion measuring device 1A having the above configuration.
- the pulsed laser light source 2 outputs an optical pulse Pa.
- the pulse forming unit 3 receives the optical pulse Pa and generates an optical pulse train Pb. Specifically, the pulse forming unit 3 forms the optical pulse train Pb from the optical pulse Pa output from the pulsed laser light source 2.
- the optical pulse train Pb is modulated light including a plurality of optical pulses Pb 1 and Pb 2 having a time difference from each other and having different center wavelengths from each other.
- the pulse forming unit 3 spatially separates a plurality of wavelength components included in the optical pulse Pa for each wavelength, and shifts the phases of the plurality of wavelength components from each other by using the SLM 14. Then, the pulse forming unit 3 focuses the plurality of wavelength components.
- a phase pattern presented to the SLM 14 gives a positive or negative group delay dispersion to the optical pulse Pa.
- the optical pulses Pb 1 and Pb 2 to be formed it is possible to reduce the peak intensity in the time domain while maintaining the intensity in the spectrum domain.
- the optical pulse train Pb is transmitted through the dispersion medium 8. Specifically, after the optical pulse train Pb output from the pulse forming unit 3 is transmitted through the optical component 7, the optical pulse train Pb is transmitted through the dispersion medium 8.
- the dispersion medium 8 has a group delay dispersion having a sign opposite to the group delay dispersion given to the optical pulse Pa. When the optical pulse train Pb is transmitted, the dispersion medium 8 gives a group delay dispersion to the optical pulses Pb 1 and Pb 2 included in the optical pulse train Pb.
- the dispersion medium 8 increases the peak intensities of the optical pulses Pb 1 and Pb 2 in the time domain. Therefore, it is possible to make the peak intensities of the optical pulses Pb 1 and Pb 2 be equal to or greater than the detection threshold value of the correlator 4.
- the correlation optical system 40 receives the optical pulse train Pb output from the dispersion medium 8, and outputs correlated light Pc including a plurality of optical pulses Pc 1 to Pc 3 that are cross-correlation or autocorrelation of the optical pulse train Pb. Then, the detector 400 detects the temporal waveform of the correlated light Pc. As an example, after the optical pulse train Pb is transmitted through the dispersion medium 8, the correlation optical system 40 uses the optical element 42 including one or both of the non-linear optical crystal and the phosphor to generate the correlated light Pc including cross-correlation or autocorrelation of the optical pulse train Pb.
- the optical pulse train Pb is branched into two pieces, and one branched optical pulse train Pbb is swept with respect to the other optical pulse train Pba in time. Then, correlated light Pc including autocorrelation of the optical pulse train Pb is generated from one optical pulse train Pbb and the other optical pulse train Pba.
- the reference optical pulse Pr is swept with respect to the optical pulse train Pb in time. Then, correlated light Pc including cross-correlation of the optical pulse train Pb is generated from the reference optical pulse Pr and the optical pulse train Pb.
- FIG. 10 the optical pulse train Pb is branched into two pieces, and one branched optical pulse train Pbb is swept with respect to the other optical pulse train Pba in time. Then, correlated light Pc including autocorrelation of the optical pulse train Pb is generated from one optical pulse train Pbb and the other optical pulse train Pba.
- the reference optical pulse Pr is swept with respect to the optical pulse train Pb in time. Then,
- the optical pulse train Pb is generated by modulating only the polarization component of the optical pulse Pa in the first polarization direction in the SLM 14.
- the polarization component of the optical pulse Pa in the second polarization direction is used as the reference optical pulse Pr.
- the optical pulse train Pb is swept with respect to the reference optical pulse Pr in time.
- correlated light Pc including cross-correlation of the optical pulse train Pb is generated from the optical pulse train Pb and the reference optical pulse Pr.
- the arithmetic operation unit 5b estimates the wavelength dispersion amount of the optical component 7 based on the feature amount of the temporal waveform of the correlated light Pc. Specifically, first, the arithmetic operation unit 5b acquires the feature amount of the temporal waveform of the correlated light Pc theoretically calculated in advance (or measured in advance) on the assumption that the wavelength dispersion of the optical component 7 is zero. Then, the arithmetic operation unit 5b acquires the feature amount of the temporal waveform of the correlated light Pc detected in the detection step S104.
- the feature amount is, for example, at least one feature amount selected from the group consisting of peak intensities E 1 to E 3 , the full widths at half maximum Wi to W 3 , and the peak time intervals G 1,2 , and G 2,3 illustrated in FIG. 13 .
- the arithmetic operation unit 5b estimates the wavelength dispersion amount of the optical component 7 by comparing the acquired feature amounts of the two temporal waveforms.
- phase modulation for generating a band-controlled multi-pulse in the SLM 14 of the pulse forming unit 3 illustrated in FIG. 2 will be described in detail.
- a domain before the lens 15 (spectral domain) and a domain behind the diffraction grating 16 (time domain) are in a Fourier transform relationship with each other.
- the phase modulation in the spectral domain has an influence on a temporal intensity waveform in the time domain. Therefore, the output light from the pulse forming unit 3 can have various temporal intensity waveforms different from the optical pulse Pa, in accordance with a modulation pattern of the SLM 14.
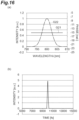
- FIG. 16(a) illustrates a spectral waveform (spectrum phase G21 and spectrum intensity G22) of the single-pulsed optical pulse Pa as an example.
- FIGS. 16(b) illustrates a temporal intensity waveform of the optical pulse Pa.
- FIG. 17(a) illustrates a spectral waveform (spectrum phase G31 and spectrum intensity G32) of the output light from the pulse forming unit 3 when rectangular wave-shaped phase spectrum modulation is applied in the SLM 14, as an example.
- FIG. 17(b) illustrates a temporal intensity waveform of the output light.
- the horizontal axis indicates the wavelength (nm)
- the left vertical axis indicates the intensity value (arbitrary unit) of an intensity spectrum
- the right vertical axis indicates the phase value (rad) of a phase spectrum.
- the horizontal axis indicates the time (femtosecond), and the vertical axis indicates the light intensity (arbitrary unit).
- the single pulse of the optical pulse Pa is converted into a double pulse with high-order light by giving a rectangular wave-shaped phase spectral waveform to the output light.
- the spectrum and the waveform illustrated in FIG. 17 are one example. By combining various phase spectra and intensity spectra, it is possible to shape the temporal intensity waveform of the output light from the pulse forming unit 3 into various shapes.
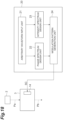
- FIG. 18 is a diagram illustrating a configuration of a modulation pattern calculation apparatus 20 that performs an arithmetic operation of the SLM 14.
- the modulation pattern calculation apparatus 20 is, for example, a personal computer; a smart device such as a smartphone and a tablet terminal; or a computer such as a cloud server, that includes a processor.
- the arithmetic operation unit 5b illustrated in FIG. 1 may also serve as the modulation pattern calculation apparatus 20.
- the modulation pattern calculation apparatus 20 is electrically connected to the SLM 14.
- the modulation pattern calculation apparatus 20 calculates a phase modulation pattern for bringing the temporal intensity waveform of the output light of the pulse forming unit 3 close to a desired waveform, and provides a control signal including the calculated phase modulation pattern to the SLM 14.
- the modulation pattern is data for controlling the SLM 14, and is data including a table of intensity of complex amplitude distribution or intensity of phase distribution.
- the modulation pattern is, for example, a computer-generated hologram (CGH
- the modulation pattern calculation apparatus 20 in the present embodiment causes the control unit 5a to store a phase pattern including a phase pattern for phase modulation and a phase pattern for intensity modulation.
- the phase pattern for phase modulation is a phase pattern that applies a phase spectrum for obtaining a desired waveform to the output light.
- the phase pattern for intensity modulation is a phase pattern that applies an intensity spectrum for obtaining a desired waveform to the output light. Therefore, as illustrated in FIG. 18 , the modulation pattern calculation apparatus 20 includes an arbitrary waveform input unit 21, a phase spectrum design unit 22, an intensity spectrum design unit 23, and a modulation pattern generation unit 24.
- the processor of a computer provided in the modulation pattern calculation apparatus 20 realizes the function of the arbitrary waveform input unit 21, the function of the phase spectrum design unit 22, the function of the intensity spectrum design unit 23, and the function of the modulation pattern generation unit 24.
- the respective functions may be realized by the same processor or may be realized by different processors.
- the processor of the computer can implement the above functions by a modulation pattern calculation program.
- the modulation pattern calculation program causes the processor of the computer to operate as the arbitrary waveform input unit 21, the phase spectrum design unit 22, the intensity spectrum design unit 23, and the modulation pattern generation unit 24 in the modulation pattern calculation apparatus 20.
- the modulation pattern calculation program is stored in a storage device (storage medium) inside or outside the computer.
- the storage device may be a non-transitory recording medium. Examples of the recording medium include a recording medium such as a flexible disk, a CD, and a DVD, a recording medium such as a ROM, a semiconductor memory, a cloud server, and the like.
- the arbitrary waveform input unit 21 receives the desired temporal intensity waveform input from an operator.
- the operator inputs information on the desired temporal intensity waveform (for example, a pulse interval, a pulse width, the number of pulses, and the like) to the arbitrary waveform input unit 21.
- the information on the desired temporal intensity waveform is provided to the phase spectrum design unit 22 and the intensity spectrum design unit 23.
- the phase spectrum design unit 22 calculates a phase spectrum of the output light of the pulse forming unit 3, which is suitable for realizing the given desired temporal intensity waveform.
- the intensity spectrum design unit 23 calculates an intensity spectrum of the output light of the pulse forming unit 3, which is suitable for realizing the given desired temporal intensity waveform.
- the modulation pattern generation unit 24 calculates a phase modulation pattern (for example, a computer-generated hologram) for applying the phase spectrum obtained in the phase spectrum design unit 22 and the intensity spectrum obtained in the intensity spectrum design unit 23 to the output light of the pulse forming unit 3. Then, a control signal SC including the calculated phase modulation pattern is provided to the SLM 14. The SLM 14 is controlled based on the control signal SC.
- a phase modulation pattern for example, a computer-generated hologram
- FIG. 19 is a block diagram illustrating an internal configuration of the phase spectrum design unit 22 and the intensity spectrum design unit 23.
- the phase spectrum design unit 22 and the intensity spectrum design unit 23 include a Fourier transform unit 25, a function replacement unit 26, a waveform function modification unit 27, an inverse Fourier transform unit 28, and a target generation unit 29.
- the target generation unit 29 includes a Fourier transform unit 29a and a spectrogram modification unit 29b. The functions of each of the components will be described in detail later.
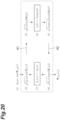
- FIG. 20 is a diagram illustrating a calculation procedure of the phase spectrum using the iterative Fourier transform method.
- an initial intensity spectrum function A 0 ( ⁇ ) and an initial phase spectrum function ⁇ 0 ( ⁇ ), which are functions of the frequency ⁇ are prepared (process number (1) in FIG.).
- the intensity spectrum function A 0 ( ⁇ ) and the phase spectrum function ⁇ 0 ( ⁇ ) represent the spectrum intensity and the spectrum phase of the input light, respectively.
- n indicates after the n-th Fourier transform process.
- the initial phase spectrum function ⁇ 0 ( ⁇ ) described above is used as the phase spectrum function ⁇ n ( ⁇ ).
- i is an imaginary number.
- temporal intensity waveform function b n (t) included in the function (b) is replaced with a temporal intensity waveform function Target 0 (t) based on a desired waveform (process numbers (4) and (5) in FIG.).
- b n t : Target 0 t
- phase spectrum shape represented by the phase spectrum function ⁇ n ( ⁇ ) in the waveform function can be brought close to the phase spectrum shape corresponding to the desired temporal intensity waveform.
- the finally obtained phase spectrum function ⁇ IFTA ( ⁇ ) is the basis of the modulation pattern for obtaining the desired temporal intensity waveform.
- FIG. 21 is a diagram illustrating a calculation procedure of the phase spectrum function in the phase spectrum design unit 22.
- an initial intensity spectrum function A 0 ( ⁇ ) and an initial phase spectrum function ⁇ 0 ( ⁇ ), which are functions of the frequency ⁇ , are prepared (process number (11) in FIG.).
- the intensity spectrum function A 0 ( ⁇ ) and the phase spectrum function ⁇ 0 ( ⁇ ) represent the spectrum intensity and the spectrum phase of input light, respectively.
- a first waveform function (g) in the frequency domain which includes the intensity spectrum function A 0 ( ⁇ ) and the phase spectrum function ⁇ 0 ( ⁇ ) is prepared (process number (12-a)).
- i is an imaginary number.
- the Fourier transform unit 25 of the phase spectrum design unit 22 performs the Fourier transform on the function (g) from the frequency domain to the time domain (arrow A3 in FIG.).
- a second waveform function (h) in the time domain which includes the temporal intensity waveform function a 0 (t) and the time-phase waveform function ⁇ 0 (t), is obtained (Fourier transform step, process number (13)).
- the function replacement unit 26 of the phase spectrum design unit 22 substitutes the temporal intensity waveform function Target 0 (t) based on the desired waveform input by the arbitrary waveform input unit 21 into a temporal intensity waveform function b 0 (t) as illustrated in the following formula (i) (process number (14-a)).
- b 0 t Target 0 t
- the function replacement unit 26 of the phase spectrum design unit 22 substitutes the temporal intensity waveform function a 0 (t) with the temporal intensity waveform function b 0 (t), as represented by the following formula (j). That is, the temporal intensity waveform function a 0 (t) included in the function (h) is replaced with the temporal intensity waveform function Target 0 (t) based on the desired waveform (function replacement step, process number (15)).
- the waveform function modification unit 27 of the phase spectrum design unit 22 corrects the second waveform function such that the spectrogram of the second waveform function (j) after the replacement is close to the target spectrogram generated in advance in accordance with a desired wavelength band.
- the second waveform function (j) is converted into a spectrogram SG 0,k ( ⁇ , t) (process number (15-a) in FIG.).
- the subscript k indicates k-th conversion processing.
- the time-frequency transform refers to performing frequency filter processing or numerical arithmetic operation processing (processing of obtaining a spectrum for each time by performing multiplication while shifting a window function) on a composite signal such as a temporal waveform to convert the composite signal into three-dimensional information including time, frequency, and intensity (spectrum intensity) of a signal component.
- the transform result time, frequency, and spectrum intensity
- spectrogram is defined as a "spectrogram”.
- time-frequency transform examples include short-time Fourier transform (STFT), wavelet transform (Halle wavelet transform, Gabor wavelet transform, Mexican-hat wavelet transform, Morley wavelet transform), and the like.
- STFT short-time Fourier transform
- wavelet transform Haparalle wavelet transform
- Gabor wavelet transform Gabor wavelet transform
- Mexican-hat wavelet transform Mexican-hat wavelet transform
- Morley wavelet transform and the like.
- the target spectrogram TargetSG 0 ( ⁇ , t) generated in advance in accordance with the desired wavelength band is read from the target generation unit 29.
- the target spectrogram TargetSG 0 ( ⁇ , t) has substantially the same value as the target temporal waveform (the temporal intensity waveform and the frequency component constituting the temporal intensity waveform), and is generated in the target spectrogram function of the process number (15-b).
- the waveform function modification unit 27 of the phase spectrum design unit 22 performs pattern matching between the spectrogram SG 0,k ( ⁇ , t) and the target spectrogram TargetSG 0 ( ⁇ , t), and examines the similarity (how much the spectrogram SG 0,k ( ⁇ , t) and the target spectrogram TargetSG 0 ( ⁇ , t) match with each other).
- an evaluation value is calculated as an index representing the similarity.
- the time-phase waveform function ⁇ 0 (t) included in the second waveform function is changed to a certain time-phase waveform function ⁇ 0,k (t).
- the second waveform function after changing the time-phase waveform function is converted into a spectrogram again by time-frequency transform such as STFT.
- the above-described process numbers (15-a) to (15-d) are repeatedly performed.
- the second waveform function is corrected such that the spectrogram SG 0,k ( ⁇ , t) is gradually brought close to the target spectrogram TargetSG 0 ( ⁇ , t) (waveform function correction step).
- the inverse Fourier transform unit 28 of the phase spectrum design unit 22 performs an inverse Fourier transform on the corrected second waveform function (arrow A4 in FIG.) and generates a third waveform function (k) in the frequency domain (inverse Fourier transform step, process number (16)).
- phase spectrum function ⁇ 0,k ( ⁇ ) included in the third waveform function (k) becomes a desired phase spectrum function ⁇ TWC-TFD ( ⁇ ) to be finally obtained.
- the phase spectrum function ⁇ TWC-TFD ( ⁇ ) is provided to the modulation pattern generation unit 24.
- FIG. 22 is a diagram illustrating a calculation procedure of the intensity spectrum function in the intensity spectrum design unit 23. Since the process numbers (11) to (15-c) are similar to the above-described spectrum phase calculation procedure in the phase spectrum design unit 22, the description thereof is omitted.
- the waveform function modification unit 27 of the intensity spectrum design unit 23 changes the temporal intensity waveform function b 0 (t) to a certain temporal intensity waveform function b 0,k (t) while restraining the time-phase waveform function ⁇ 0 (t) included in the second waveform function with the initial value (process number (15-e)).
- the second waveform function after changing the temporal intensity waveform function is converted into a spectrogram again by time-frequency transform such as STFT. Thereafter, the process numbers (15-a) to (15-c) are repeatedly performed. In this manner, the second waveform function is corrected such that the spectrogram SG 0,k ( ⁇ , t), is gradually brought close to the target spectrogram TargetSG 0 ( ⁇ , t) (waveform function correction step).
- the inverse Fourier transform unit 28 of the intensity spectrum design unit 23 performs an inverse Fourier transform on the corrected second waveform function (arrow A4 in FIG.) and generates a third waveform function (m) in the frequency domain (inverse Fourier transform step, process number (16)).
- m waveform function
- a filter processing unit of the intensity spectrum design unit 23 performs filter processing based on the intensity spectrum of the input light, on the intensity spectrum function B 0,k ( ⁇ ) included in the third waveform function (m) (filter processing step). Specifically, in the intensity spectrum obtained by multiplying the intensity spectrum function B 0,k ( ⁇ ) by a coefficient ⁇ , a portion exceeding the cutoff intensity for each wavelength determined based on the intensity spectrum of the input light is cut. This is performed in order to prevent an occurrence of a situation in which an intensity spectrum function ⁇ B 0,k ( ⁇ ) does not exceed the spectrum intensity of the input light in all the wavelength ranges.
- the cutoff intensity for each wavelength is set to coincide with the intensity spectrum of the input light (the initial intensity spectrum function A 0 ( ⁇ ) in the present embodiment).
- the value of the intensity spectrum function A 0 ( ⁇ ) is taken as the value of the intensity spectrum function A TWC-TFD ( ⁇ ).
- the value of the intensity spectrum function ⁇ B 0,k ( ⁇ ) is taken as the value of the intensity spectrum function A TWC-TFD ( ⁇ ) (process number (17-b) in FIG.).
- a TWC ⁇ TFD ⁇ ⁇ A 0 ⁇ A 0 ⁇ ⁇ ⁇ B 0 , k ⁇ ⁇ B 0 , k ⁇ A 0 ⁇ ⁇ ⁇ B 0 , k ⁇
- the intensity spectrum function A TWC-TFD ( ⁇ ) is provided to the modulation pattern generation unit 24 as the desired spectrum intensity to be finally obtained.
- the modulation pattern generation unit 24 calculates a phase modulation pattern (for example, a computer-generated hologram) for giving, to the output light, the spectrum phase represented by the phase spectrum function ⁇ TWC-TFD ( ⁇ ) calculated in the phase spectrum design unit 22 and the spectrum intensity represented by the intensity spectrum function A TWC-TFD ( ⁇ ) calculated in the intensity spectrum design unit 23 (data generation step).
- a phase modulation pattern for example, a computer-generated hologram
- FIG. 23 is a diagram illustrating an example of a generation procedure of the target spectrogram TargetSG 0 ( ⁇ , t) in the target generation unit 29.
- the target spectrogram TargetSG 0 ( ⁇ , t) indicates a target temporal waveform.
- the temporal waveform is a temporal intensity waveform and a frequency component (wavelength band component) constituting the temporal intensity waveform. Therefore, the creation of the target spectrogram is a critical step for controlling the frequency component (wavelength band component).
- the target generation unit 29 first receives inputs of the spectral waveform (initial intensity spectrum function A 0 ( ⁇ ) and initial phase spectrum function ⁇ 0 ( ⁇ ) and the desired temporal intensity waveform function Target (t).
- the target generation unit 29 receives an input of a time function p 0 (t) including desired frequency (wavelength) band information (process number (21)).
- the target generation unit 29 calculates a phase spectrum function ⁇ IFTA ( ⁇ ) for realizing the temporal intensity waveform function Target 0 (t), for example, by using the iterative Fourier transform method illustrated in FIG. 20 (process number (22)).
- FIG. 24 is a diagram illustrating an example of a procedure for calculating the intensity spectrum function A IFTA ( ⁇ ).
- a waveform function (o) in the frequency domain which includes the intensity spectrum function A k ( ⁇ ) and the phase spectrum function ⁇ 0 ( ⁇ ) is prepared (process number (32) in FIG.).
- the subscript k indicates after the k-th Fourier transform processing.
- i is an imaginary number.
- temporal intensity waveform function b k (t) included in the function (p) is replaced with the temporal intensity waveform function Target 0 (t) based on a desired waveform (process numbers (34) and (35) in FIG.).
- b k t : Target 0 t
- phase spectrum function ⁇ k ( ⁇ ) included in the function (s) is replaced with the initial phase spectrum function ⁇ 0 ( ⁇ ) (process number (37-a) in FIG.).
- ⁇ k ⁇ : ⁇ 0 ⁇
- the intensity spectrum function C k ( ⁇ ) included in the function (s) is replaced with the intensity spectrum function A k ( ⁇ ) after the filter processing in accordance with the above formula (u).
- the phase spectrum shape represented by the intensity spectrum function A k ( ⁇ ) in the waveform function can be brought close to the intensity spectrum shape corresponding to the desired temporal intensity waveform. Finally, the intensity spectrum function A IFTA ( ⁇ ) is obtained.
- the Fourier transform unit 29a of the target generation unit 29 performs the Fourier transform on the waveform function (v). As a result, a fourth waveform function (w) in the time domain is obtained (process number (25)).
- the spectrogram modification unit 29b of the target generation unit 29 converts the fourth waveform function (w) into a spectrogram SG IFTA ( ⁇ , t) by time-frequency transform (process number (26)). Then, in the process number (27), the target spectrogram TargetSG 0 ( ⁇ , t) is generated by correcting the spectrogram SG IFTA ( ⁇ , t) based on the time function p 0 (t) including the desired frequency (wavelength) band information (process number (28)). For example, a characteristic pattern appearing in the spectrogram SG IFTA ( ⁇ ,t) configured by two-dimensional data is partially cut out, and a frequency component of this portion is operated based on the time function p 0 (t). Specific examples thereof will be described below in detail.
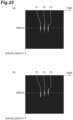
- the spectrogram SG IFTA ( ⁇ , t) has a result as illustrated in FIG. 25(a) .
- the horizontal axis indicates the time (unit: femtosecond), and the vertical axis indicates the wavelength (unit: nm).
- the value of the spectrogram is indicated by the brightness and darkness in FIG. 25(a) , and the higher the brightness, the larger the value of the spectrogram.
- triple pulses appear as domains Di, D 2 , and D 3 separated on the time axis at intervals of 2 picoseconds.
- the center (peak) wavelengths of the domains Di, D 2 , and D 3 are 800 nm.
- the spectrogram SG IFTA ( ⁇ , t) changes to the target spectrogram TargetSG 0 ( ⁇ , t) illustrated in FIG. 25(b) .
- the constituent frequency (wavelength band) of each pulse is freely controlled without changing the shape of the temporal intensity waveform.
- the wavelength dispersion amount of the optical component 7 When the wavelength dispersion amount of the optical component 7 is estimated, a plurality of optical pulses Pb 1 and Pb 2 having a time difference from each other and having center wavelengths different from each other are caused to be transmitted through the optical component 7. Then, the wavelength dispersion amount of the optical component 7 can be estimated based on the temporal waveform of the correlated light Pc obtained from the plurality of optical pulses Pb 1 and Pb 2 .
- the peak intensities of the optical pulses Pb 1 and Pb 2 are large, the measurement accuracy of the wavelength dispersion amount may be lowered. For example, when the peak intensities of the optical pulses Pb 1 and Pb 2 exceed a certain threshold value in the optical component 7, a non-linear optical phenomenon occurs.
- 26 is a conceptual diagram illustrating temporal waveforms of the optical pulses Pb 1 and Pb 2 before and after the optical pulses Pb 1 and Pb 2 having a peak intensity equal to or greater than the threshold value Q1 of the non-linear optical phenomenon are transmitted through the optical component 7.
- the temporal waveforms of the optical pulses Pb 1 and Pb 2 are distorted.
- the peak intensities of the optical pulses Pb 1 and Pb 2 are large, for example, the optical component 7 may be damaged. Also in this case, the temporal waveforms of the optical pulses Pb 1 and Pb 2 are distorted.
- the temporal waveforms of the optical pulses Pb 1 and Pb 2 are distorted, the temporal waveform of the correlated light Pc is also distorted.
- the peak intensities of the optical pulses Pb 1 and Pb 2 are large, it may not be possible to accurately measure the wavelength dispersion amount of the optical component 7 based on the temporal waveform of the correlated light Pc.
- FIG. 27 is a conceptual diagram illustrating temporal waveforms of the optical pulses Pb 1 and Pb 2 before and after the optical pulses Pb 1 and Pb 2 with reduced peak intensity are transmitted through the optical component 7. As illustrated in FIG.
- the peak intensities of the optical pulses Pb 1 and Pb 2 when the peak intensities of the optical pulses Pb 1 and Pb 2 are reduced in the pulse forming unit 3, the peak intensities of the optical pulses Pb 1 and Pb 2 after being transmitted through the optical component 7 may fall below the detection threshold value Q2 of the correlator 4. In this case, it is not possible to accurately measure the wavelength dispersion amount of the optical component 7.
- the positive or negative group delay dispersion is given to the optical pulse Pa in the pulse forming unit 3 (pulse forming step S102).
- the peak intensities of the optical pulses Pb 1 and Pb 2 are suppressed, for example, it is possible to make the peak intensities of the optical pulses Pb 1 and Pb 2 propagating through the optical component 7 be equal to or smaller than the threshold value Q1 of the non-linear optical phenomenon.
- the phase pattern presented to the SLM 14 may be a phase pattern for giving, to the optical pulse Pa, the group delay dispersion in which the peak intensities of the optical pulses Pb 1 and Pb 2 fall below the threshold value Q1 of the non-linear optical phenomenon in the optical component 7.
- the non-linear optical phenomenon since the occurrence of the non-linear optical phenomenon is suppressed, it is possible to suppress the distortion of the temporal waveforms of the optical pulses Pb 1 and Pb 2 and to suppress the distortion of the temporal waveform of the correlated light Pc.
- the correlator 4 including the correlation optical system 40 and the detector 400 may be adopted in order to detect the optical pulse train Pb transmitted through the optical component 7 as the measurement object.
- the correlation optical system 40 is an optical system that spatially and temporally superimposes the optical pulse train Pb with the optical pulse train Pb itself or another pulse train. Specifically, by temporally sweeping one pulse train, a correlation waveform conforming to the temporal waveform shape of the optical pulse train Pb is detected.
- the movement amount of the stage corresponds to the time delay amount of the correlation waveform.
- the time delay amount with respect to the stage movement amount is very small. Therefore, by adopting the correlator 4, in the detector 400, it is possible to observe the pulse shape on a high time-resolved scale reaching the femtosecond order. As a result, it is possible to more accurately measure the wavelength dispersion amount of the optical component 7 as the measurement object.
- FIG. 28 is a diagram illustrating a dispersion measuring device 1B according to a first modification.
- the dispersion medium 8 is disposed not on the optical path between the pulse forming unit 3 and the correlation optical system 40 but on an optical path between the correlation optical system 40 and the detector 400.
- the optical component 7 is disposed on the optical path between the pulse forming unit 3 and the correlation optical system 40.
- the correlation optical system 40 receives the optical pulse train Pb transmitted through the optical component 7 and outputs correlated light Pc including optical pulses Pci to Pc 3 which are cross-correlation or autocorrelation of the optical pulse train Pb.
- the control device 5 is electrically connected to the pulse forming unit 3 and the detector 400.
- the dispersion medium 8 having the positive or negative group delay dispersion receives the correlated light Pc output from the correlation optical system 40. At this time, the dispersion medium 8 gives the group delay dispersion to the optical pulses Pc 1 to Pc 3 included in the correlated light Pc to make the intensities of the optical pulses Pc 1 to Pc 3 equal to or greater than the threshold value (described later) of the detector 400.
- the detector 400 receives the correlated light Pc transmitted through the dispersion medium 8 and detects the temporal waveform of the correlated light Pc having an intensity equal to or greater than the detection threshold value.
- the detection threshold value in the first modification is a value determined based on the characteristics of the detector 400. Since the correlated light Pc having an intensity equal to or greater than the detection threshold value enters to the detector 400, the detector 400 can accurately detect the temporal waveform of the correlated light Pc.
- FIG. 29 is a flowchart illustrating a dispersion measuring method using the dispersion measuring device 1B having the above configuration.
- the pulsed laser light source 2 outputs an optical pulse Pa.
- the pulse forming unit 3 receives the optical pulse Pa and generates an optical pulse train Pb. Specifically, the pulse forming unit 3 forms the optical pulse train Pb from the optical pulse Pa output from the pulsed laser light source 2.
- the optical pulse train Pb is modulated light including a plurality of optical pulses Pb 1 and Pb 2 having a time difference from each other and having different center wavelengths from each other.
- the pulse forming unit 3 gives the positive or negative group delay dispersion to the optical pulse Pa. That is, the phase pattern presented to the SLM 14 gives the positive or negative group delay dispersion to the optical pulse Pa.
- the formed optical pulses Pb 1 and Pb 2 it is possible to reduce the intensity in the time domain while maintaining the intensity in the spectrum domain.
- the correlation optical system 40 outputs the correlated light Pc. Specifically, after the optical pulse train Pb is transmitted through the optical component 7, the correlation optical system 40 outputs the correlated light Pc including the optical pulses Pc 1 to Pc 3 that are cross-correlation or autocorrelation of the optical pulse train Pb. As an example, after the optical pulse train Pb is transmitted through the optical component 7, the correlation optical system 40 uses the optical element 42 including one or both of the non-linear optical crystal and the phosphor to generate the correlated light Pc including cross-correlation or autocorrelation of the optical pulse train Pb.
- a dispersion medium transmission step S204 the correlated light Pc is transmitted through the dispersion medium 8.
- the dispersion medium 8 receives the correlated light Pc output from the correlation optical system 40.
- the correlated light Pc is transmitted through the dispersion medium 8 having a group delay dispersion having a sign opposite to the group delay dispersion given to the optical pulse Pa.
- the detector 400 detects the temporal waveform of the correlated light Pc transmitted through the dispersion medium 8. Specifically, the detector 400 detects the temporal waveform of the correlated light Pc having an intensity equal to or greater than the detection threshold value of the detector 400.
- the arithmetic operation unit 5b estimates the wavelength dispersion amount of the optical component 7 based on the feature amount of the temporal waveform of the correlated light Pc.
- the positive or negative group delay dispersion is given to the optical pulse Pa in the pulse forming unit 3 (pulse forming step S202).
- the intensities of the optical pulses Pb 1 and Pb 2 included in the optical pulse train Pb are suppressed, for example, it is possible to make the maximum intensities of the optical pulses Pb 1 and Pb 2 propagating through the optical component 7 be equal to or smaller than the threshold value Q1 of the non-linear optical phenomenon.
- the group delay dispersion having a sign opposite to the group delay dispersion given to the optical pulse Pa is given. Therefore, it is possible to make the intensities of the optical pulses Pc 1 to Pc 3 be equal to or greater than the detection threshold value of the detector 400. This makes it possible to accurately detect the temporal waveform of the correlated light Pc. From the above, it is possible to accurately measure the wavelength dispersion amount of the optical component 7.
- the embodiment can be used as a dispersion measuring device and a dispersion measuring method capable of more accurately measuring a wavelength dispersion amount of a measurement object.
Landscapes
- Physics & Mathematics (AREA)
- Chemical & Material Sciences (AREA)
- General Physics & Mathematics (AREA)
- Analytical Chemistry (AREA)
- Optics & Photonics (AREA)
- Dispersion Chemistry (AREA)
- Spectroscopy & Molecular Physics (AREA)
- Optical Modulation, Optical Deflection, Nonlinear Optics, Optical Demodulation, Optical Logic Elements (AREA)
- Photometry And Measurement Of Optical Pulse Characteristics (AREA)
Abstract
Description
- The present disclosure relates to a dispersion measuring device and a dispersion measuring method.
-
Patent Literature 1 discloses a dispersion measuring device and a dispersion measuring method capable of measuring a wavelength dispersion amount of a pulsed laser light source. In such device and method, first, an optical pulse train including a plurality of optical pulses having a time difference and having center wavelengths different from each other is formed from an optical pulse to be measured output from the pulsed laser light source. Then, the optical pulse train enters into a correlation optical system. Then, correlated light including cross-correlation or autocorrelation of the optical pulse train is output from the correlation optical system. Finally, the temporal waveform of the correlated light is detected, and the wavelength dispersion amount of the pulsed laser light source is estimated from the feature amount of the temporal waveform of the detected correlated light. By inserting a measurement object such as an optical component into the optical system, it is also possible to measure the wavelength dispersion amount of the measurement object from the temporal waveform of the correlated light. - Patent Literature 1:
Japanese Unexamined Patent Publication No. 2020-169946 - When the wavelength dispersion amount of a measurement object is measured, a plurality of optical pulses having a time difference and having center wavelengths different from each other are transmitted through the measurement object. Thus, it is possible to estimate the wavelength dispersion amount of the measurement object based on the temporal waveforms of the plurality of optical pulses after being transmitted through the measurement object. Here, when the peak intensity of the optical pulse entering into the measurement object is large, the measurement accuracy of the wavelength dispersion amount may be lowered. For example, in a case where the measurement object is a non-linear medium such as an optical fiber or an optical waveguide, a non-linear optical phenomenon occurs when the peak intensity of the optical pulse exceeds a certain threshold value in the measurement object. This phenomenon distorts the temporal waveform of the optical pulse. In addition, for example, when the peak intensity of the optical pulse is excessively large, the measurement object may be damaged. In view of the above, when the peak intensity of the optical pulse entering into the measurement object is large, it may not possible to accurately measure the wavelength dispersion amount of the measurement object based on the temporal waveform of the optical pulse transmitted through the measurement object.
- On the other hand, when the peak intensity of the optical pulse entering into the measurement object is small, the peak intensity of the optical pulse may be less than a detection threshold value in a detector that detects the temporal waveform of the optical pulse transmitted through the measurement object. In this case, since the detection accuracy of the temporal waveform of the optical pulse is lowered, it is not possible to accurately measure the wavelength dispersion amount of the measurement object based on the temporal waveform of the optical pulse.
- An object of one aspect of the present disclosure is to provide a dispersion measuring device and a dispersion measuring method capable of more accurately measuring a wavelength dispersion amount of a measurement object.
- According to an aspect of the present disclosure, a dispersion measuring device includes a light source, a pulse forming unit, a dispersion medium, a correlator, and an arithmetic operation unit. The light source outputs a first optical pulse. The pulse forming unit includes a spatial light modulator that presents a phase pattern for generating modulated light by applying a predetermined phase shift for each wavelength to the first optical pulse. The pulse forming unit forms, from the first optical pulse, an optical pulse train that is modulated light including a plurality of second optical pulses having a time difference from each other and having center wavelengths different from each other. The dispersion medium has a positive or negative group delay dispersion and receives an optical pulse train. The correlator includes a correlation optical system and a detector. The correlation optical system receives an optical pulse train transmitted through the dispersion medium and outputs correlated light including a plurality of third optical pulses that are cross-correlation or autocorrelation of the optical pulse train. The detector detects a temporal waveform of the correlated light. The correlator detects the temporal waveform of the correlated light formed from the optical pulse train having a peak intensity equal to or greater than a detection threshold value. The arithmetic operation unit is electrically connected to the correlator. A measurement object is disposed on an optical path between the pulse forming unit and the dispersion medium. The arithmetic operation unit estimates a wavelength dispersion amount of the measurement object based on the temporal waveform of the correlated light. The dispersion medium gives a group delay dispersion to the plurality of second optical pulses included in the optical pulse train to increase the peak intensity of the second optical pulse to be equal to or greater than the detection threshold value. The phase pattern includes a pattern for giving a group delay dispersion having a sign opposite to the group delay dispersion of the dispersion medium to the first pulse.
- According to another aspect of the present disclosure, a dispersion measuring method includes an output step, a pulse forming step, a dispersion medium transmission step, a detection step, and an arithmetic operation step. In the output step, a first optical pulse is output. In the pulse forming step, an optical pulse train is formed from the first optical pulse by using a spatial light modulator that presents a phase pattern for generating modulated light by applying a predetermined phase shift for each wavelength to the first optical pulse, the optical pulse train being modulated light including a plurality of second optical pulses having a time difference from each other and having center wavelengths different from each other. In the dispersion medium transmission step, the optical pulse train is transmitted through the measurement object, and then is transmitted through a dispersion medium having positive or negative group delay dispersion. In the detection step, the optical pulse train transmitted through the dispersion medium is received, correlated light including a plurality of third optical pulses that are cross-correlation or autocorrelation of the optical pulse train is generated, and a temporal waveform of the correlated light is detected. In the detection step, the temporal waveform of the correlated light formed from the optical pulse train having a peak intensity equal to or greater than a detection threshold value is detected. In the arithmetic operation step, a wavelength dispersion amount of the measurement object is estimated based on the temporal waveform of the correlated light. The phase pattern includes a phase pattern for giving a group delay dispersion having a sign opposite to the group delay dispersion of the dispersion medium to the first optical pulse.
- According to still another aspect of the present disclosure, a dispersion measuring device includes a light source, a pulse forming unit, a correlation optical system, a dispersion medium, a detector, and an arithmetic operation unit. The light source outputs a first optical pulse. The pulse forming unit includes a spatial light modulator that presents a phase pattern for generating modulated light by applying a predetermined phase shift for each wavelength to the first optical pulse. The pulse forming unit forms, from the first optical pulse, an optical pulse train that is modulated light including a plurality of second optical pulses having a time difference from each other and having center wavelengths different from each other. The correlation optical system receives an optical pulse train and outputs correlated light including a plurality of third optical pulses that are cross-correlation or autocorrelation of the optical pulse train. The dispersion medium has a positive or negative group delay dispersion and receives the correlated light. The detector receives the correlated light transmitted through the dispersion medium and detects a temporal waveform of the correlated light having a peak intensity equal to or greater than a detection threshold value. The arithmetic operation unit is electrically connected to the detector. A measurement object is disposed on an optical path between the pulse forming unit and the correlation optical system. The arithmetic operation unit estimates a wavelength dispersion amount of the measurement object based on the temporal waveform of the correlated light. The dispersion medium gives a group delay dispersion to a plurality of third optical pulses included in the correlated light to increase peak intensities of the plurality of third optical pulses to be equal to or greater than the detection threshold value. The phase pattern includes a pattern for giving a group delay dispersion having a sign opposite to the group delay dispersion of the dispersion medium to the first pulse.
- According to still yet another aspect of the present disclosure, a dispersion measuring method includes an output step, a pulse forming step, a correlated-light output step, a dispersion medium transmission step, a detection step, and an arithmetic operation step. In the output step, a first optical pulse is output. In the pulse forming step, an optical pulse train is formed from the first optical pulse by using a spatial light modulator that presents a phase pattern for generating modulated light by applying a predetermined phase shift for each wavelength to the first optical pulse, the optical pulse train being modulated light including a plurality of second optical pulses having a time difference from each other and having center wavelengths different from each other. In the correlated-light output step, correlated light including a plurality of third optical pulses that are cross-correlation or autocorrelation of the optical pulse train is output after the optical pulse train is transmitted through a measurement object. In the dispersion medium transmission step, the correlated light is transmitted through a dispersion medium having a positive or negative group delay dispersion. In the detection step, a temporal waveform of the correlated light transmitted through the dispersion medium is detected. In the arithmetic operation step, a wavelength dispersion amount of the measurement object is estimated based on the temporal waveform of the correlated light. In the detection step, the temporal waveform of the correlated light having a peak intensity equal to or greater than a detection threshold value is detected. In the dispersion medium transmission step, when the correlated light is transmitted through the dispersion medium, a group delay dispersion is given to the plurality of third optical pulses included in the correlated light, so that peak intensities of the plurality of third optical pulses are increased to be equal to or greater than the detection threshold value. The phase pattern includes a pattern for giving a group delay dispersion having a sign opposite to the group delay dispersion of the dispersion medium to the first optical pulse.
- In these devices and methods, a positive or negative group delay dispersion is given to the first optical pulse in the pulse forming unit (pulse forming step). As a result, the peak intensity of the second optical pulse is suppressed. Thus, it is possible to avoid an influence on the second optical pulse in the measurement object in a case where the peak intensity of the second optical pulse is large. For example, the peak intensity of the second optical pulse propagating in the measurement object can be made equal to or smaller than a threshold value of the non-linear optical phenomenon. Then, after the second pulse is transmitted through the measurement object, a group delay dispersion having a sign opposite to the group delay dispersion given to the first optical pulse is given to the second pulse or the third pulse by the dispersion medium. Therefore, the peak intensity of the second pulse or the third pulse after being transmitted through the measurement object can be made equal to or greater than the detection threshold value of the correlator or the detector. This makes it possible to accurately detect the temporal waveform of the correlated light. From the above, it is possible to more accurately measure the wavelength dispersion amount of the measurement object.
- In the above devices and methods, the group delay dispersion given from the phase pattern may be a negative group delay dispersion, and the group delay dispersion given from the dispersion medium may be a positive group delay dispersion. Many types of dispersion media give the positive group delay dispersion. Therefore, according to the above devices and methods, it is possible to select more types of dispersion media as the dispersion medium in the above-described devices and methods, as compared with a case where the group delay dispersion given from the dispersion medium is the negative group delay dispersion.
- In the above devices and methods, the phase pattern may be a phase pattern for giving the group delay dispersion in which the peak intensities of the plurality of second optical pulses fall below the threshold value of the non-linear optical phenomenon to the first optical pulse in the measurement object. According to the devices and methods, since the occurrence of the non-linear optical phenomenon is suppressed, it is possible to suppress the distortion of the temporal waveforms of the plurality of second optical pulses, and eventually suppress the distortion of the temporal waveform of the correlated light.
- In the above devices and methods, the dispersion medium may be made of a material in which the non-linear optical phenomenon does not occur.
- In the above devices and methods, the dispersion medium may be an optical fiber, an optical waveguide, a semiconductor, a dielectric optical crystal, a grating pair, a prism pair, or a glass body.
- In the above devices and methods, the dispersion medium may be a single mode fiber, a multi-mode fiber, a rare-earth-doped fiber, a photonic crystal fiber, a dispersion shifted fiber, or a double clad fiber.
- In the above devices and methods, the dispersion medium may be a semiconductor waveguide containing SiN or InP.
- In the above devices and methods, the dispersion medium may be diamond, SiO2, LiNbO3, LiTaO3, lanthanum-doped lead zirconate titanate, Si, Ge, fullerene, graphite, graphene, carbon nanotube, GaN, GaAs, a magnetic body, an organic material, or a polymer material.
- According to the dispersion measuring device and the dispersion measuring method according to the aspect of the present disclosure, it is possible to more accurately measure a wavelength dispersion amount of a measurement object.
-
-
FIG. 1 is a schematic diagram illustrating a configuration of a dispersion measuring device according to an embodiment of the present disclosure. -
FIG. 2 is a diagram illustrating a configuration example of a pulse forming unit. -
FIG. 3 is a diagram illustrating a modulation surface of an SLM. -
FIG. 4 is a diagram illustrating an example of a phase pattern presented to the SLM. -
FIG. 5 is a diagram illustrating an example of the phase pattern presented to the SLM. -
FIG. 6 is a diagram illustrating an example of a relationship between a group delay dispersion given to an optical pulse and a peak intensity of the optical pulse. -
FIG. 7 is a conceptual diagram illustrating how a peak intensity in a temporal waveform of an optical pulse changes. - (a), (b), and (c) of
FIG. 8 are diagrams illustrating examples of a band-controlled multi-pulse. - (a), (b), and (c) of
FIG. 9 are diagrams illustrating examples of a multi-pulse of which a band is not controlled, as a comparative example. -
FIG. 10 is a schematic diagram illustrating a correlation optical system for generating correlated light including autocorrelation of an optical pulse train, as a configuration example of the correlation optical system. -
FIG. 11 is a schematic diagram illustrating a correlation optical system for generating correlated light including cross-correlation of an optical pulse train, as another configuration example of the correlation optical system. -
FIG. 12 is a schematic diagram illustrating a correlation optical system for generating correlated light including cross-correlation of an optical pulse train, as still another configuration example of the correlation optical system. -
FIG. 13 is a view for conceptually describing a feature amount of the correlated light. (a) ofFIG. 13 illustrates an example of a temporal waveform of the correlated light in a case where a wavelength dispersion of an optical component is zero. (b) ofFIG. 13 illustrates an example of the temporal waveform of the correlated light in a case where the wavelength dispersion of the optical component is not zero. -
FIG. 14 is a schematic diagram illustrating a configuration example of hardware of a control device. -
FIG. 15 is a flowchart illustrating a dispersion measuring method using the dispersion measuring device. - (a) of
FIG. 16 illustrates a spectral waveform of a single-pulsed optical pulse. (b) ofFIG. 16 illustrates a temporal intensity waveform of the optical pulse. - (a) of
FIG. 17 illustrates a spectral waveform of output light from the pulse forming unit when rectangular wave-shaped phase spectrum modulation is applied in the SLM. (b) ofFIG. 17 illustrates a temporal intensity waveform of the output light from the pulse forming unit. -
FIG. 18 is a diagram illustrating a configuration of a device that performs an arithmetic operation of a modulation pattern of the SLM. -
FIG. 19 is a block diagram illustrating internal configurations of a phase spectrum design unit and an intensity spectrum design unit. -
FIG. 20 is a diagram illustrating a calculation procedure of a phase spectrum by an iterative Fourier transform method. -
FIG. 21 is a diagram illustrating a calculation procedure of a phase spectrum function in the phase spectrum design unit. -
FIG. 22 is a diagram illustrating a calculation procedure of an intensity spectrum function in the intensity spectrum design unit. -
FIG. 23 is a diagram illustrating an example of a generation procedure of a target spectrogram in a target generation unit. -
FIG. 24 is a diagram illustrating an example of a procedure of calculating the intensity spectrum function. - (a) of
FIG. 25 is a diagram illustrating a spectrogram, (b) ofFIG. 25 is a diagram illustrating a target spectrogram in which the spectrogram is changed. -
FIG. 26 is a diagram illustrating an example of an intensity change in the temporal waveform of the optical pulse in the dispersion measuring device according to the embodiment of the present disclosure. -
FIG. 27 is a diagram illustrating another example of the intensity change in the temporal waveform of the optical pulse in the dispersion measuring device according to the embodiment of the present disclosure. -
FIG. 28 is a diagram illustrating another configuration of the dispersion measuring device as a first modification. -
FIG. 29 is a flowchart illustrating a dispersion measuring method using the dispersion measuring device in the first modification. - Hereinafter, embodiments of a dispersion measuring device and a dispersion measuring method according to the present disclosure will be described in detail with reference to the accompanying drawings. The same elements are denoted by the same reference signs in description of drawings, and the repetitive descriptions are omitted.
-
FIG. 1 is a schematic diagram illustrating a configuration of adispersion measuring device 1A according to an embodiment of the present disclosure. Thedispersion measuring device 1A is a device that measures a wavelength dispersion amount of anoptical component 7 as a measurement object. Thedispersion measuring device 1A includes a pulsed laser light source 2 (light source), apulse forming unit 3, adispersion medium 8, acorrelator 4, and acontrol device 5. Alight input end 3a of thepulse forming unit 3 is optically coupled to the pulsedlaser light source 2 spatially or via an optical waveguide such as an optical fiber. Alight input end 7a of theoptical component 7 is optically coupled to alight output end 3b of thepulse forming unit 3 spatially or via an optical waveguide such as an optical fiber. Alight input end 8a of thedispersion medium 8 is optically coupled to alight output end 7b of theoptical component 7 spatially or via an optical waveguide such as an optical fiber.Alight input end 4a of thecorrelator 4 is optically coupled to alight output end 8b of thedispersion medium 8 spatially or via an optical waveguide such as an optical fiber. Thecontrol device 5 is electrically connected to thepulse forming unit 3 and thecorrelator 4. Thecorrelator 4 includes a correlationoptical system 40 and adetector 400. Alight output end 40b of the correlationoptical system 40 is optically coupled to thedetector 400 spatially or via an optical waveguide such as an optical fiber. Thecontrol device 5 includes acontrol unit 5a, anarithmetic operation unit 5b, and anoutput unit 5c. - The pulsed
laser light source 2 outputs a coherent optical pulse Pa (first optical pulse). The pulsedlaser light source 2 is, for example, a femtosecond laser, and is a solid-state laser light source such as an LD direct excitation Yb:YAG pulsed laser in an example. The temporal waveform of the optical pulse Pa has, for example, a Gaussian function shape. The full width at half maximum (FWHM) of the optical pulse Pa is, for example, in the range of 10 fs to 10,000 fs, and is 100 fs in an example. The optical pulse Pa is an optical pulse having a certain bandwidth and includes a plurality of continuous wavelength components. In an example, the bandwidth of the optical pulse Pa is 10 nm and the center wavelength of the optical pulse Pa is 1030 nm. - The
pulse forming unit 3 is a part that forms an optical pulse train Pb from the optical pulse Pa. The optical pulse train Pb includes a plurality of optical pulses Pb1 and Pb2 (plurality of second optical pulses) having a time difference from each other and having different center wavelengths from each other. The optical pulse train Pb is a single pulse group generated by dividing a spectrum constituting the optical pulse Pa into a plurality of wavelength bands and using each wavelength band. At boundaries among the plurality of wavelength bands, the plurality of wavelength bands may overlap each other. In the following description, the optical pulse train Pb may be referred to as a "band-controlled multi-pulse". -
FIG. 2 is a diagram illustrating a configuration example of thepulse forming unit 3. Thepulse forming unit 3 includes adiffraction grating 12, alens 13, a spatial light modulator (SLM) 14, alens 15, and adiffraction grating 16. Thediffraction grating 12 is a spectroscopic element in the present embodiment, and is optically coupled to the pulsedlaser light source 2. TheSLM 14 is optically coupled to thediffraction grating 12 via thelens 13. Thediffraction grating 12 spatially separates a plurality of wavelength components included in the optical pulse Pa from each other for each wavelength. As the spectroscopic element, another optical component such as a prism may be used instead of thediffraction grating 12. The optical pulse Pa obliquely enters to thediffraction grating 12 and is dispersed into a plurality of wavelength components. Light P1 including the plurality of wavelength components is focused by thelens 13 for each wavelength component, and an image is formed on the modulation surface of theSLM 14. Thelens 13 may be a convex lens made of a light transmitting member or a concave mirror having a concave light reflection surface. - The
SLM 14 applies a predetermined phase shift for each wavelength to the optical pulse Pa in order to convert the optical pulse Pa into the optical pulse train Pb (modulated light). Specifically, theSLM 14 receives a control signal from thecontrol unit 5a (seeFIG. 1 ) in order to generate the optical pulse train Pb by applying a phase shift to the optical pulse Pa. TheSLM 14 presents a phase pattern by receiving the control signal output from thecontrol unit 5a. TheSLM 14 simultaneously performs phase modulation and intensity modulation of the light P1 by using the presented phase pattern. In this manner, theSLM 14 shifts the phases of the plurality of wavelength components output from thediffraction grating 12 from each other. TheSLM 14 may perform only phase modulation or only intensity modulation. TheSLM 14 is, for example, a phase modulation type. In an example, theSLM 14 is a liquid crystal on silicon (LCOS) type. Although thetransmissive SLM 14 is illustrated in the drawings, theSLM 14 may be a reflective type. -
FIG. 3 is a diagram illustrating themodulation surface 17 of theSLM 14. As illustrated inFIG. 3 , on themodulation surface 17, a plurality ofmodulation regions 17a are arranged along a certain direction A, and eachmodulation region 17a extends in a direction B intersecting the direction A. The direction A is a spectral direction by thediffraction grating 12. Themodulation surface 17 functions as a Fourier transform surface, and each corresponding wavelength component after being dispersed is incident on each of the plurality ofmodulation regions 17a. TheSLM 14 modulates the phase and the intensity of each incident wavelength component independently from the other wavelength components in eachmodulation region 17a. Since theSLM 14 in the present embodiment is the phase modulation type, the intensity modulation is realized by the phase pattern (phase image) presented on themodulation surface 17. - Each wavelength component of the modulated light P2 modulated by the
SLM 14 is focused at a point on thediffraction grating 16 by thelens 15. At this time, thelens 15 functions as a focusing optical system for focusing the modulated light P2. Thelens 15 may be a convex lens made of a light transmitting member or a concave mirror having a concave light reflection surface. Thediffraction grating 16 functions as a combining optical system and combines the modulated wavelength components. That is, the plurality of wavelength components of the modulated light P2 are focused and combined with each other by thelens 15 and thediffraction grating 16 to obtain a band-controlled multi-pulse (optical pulse train Pb). - The phase pattern presented on the
modulation surface 17 is such that a phase pattern for giving a positive (normal) or negative (anomalous) group delay dispersion (GDD) to the optical pulse Pa, that is, for making the optical pulse train Pb have a positive or negative group delay dispersion, is superimposed on a phase pattern for generating the optical pulse train Pb.FIGS. 4 and5 illustrate examples of a spectral waveform (spectrum phase G11 and spectrum intensity G12) of output light from thepulse forming unit 3. InFIGS. 4 and5 , the horizontal axis indicates the wavelength (nm), the left vertical axis indicates the intensity value (arbitrary unit) of an intensity spectrum, and the right vertical axis indicates the phase value (rad) of a phase spectrum. The spectral waveform illustrated inFIG. 4 illustrates a case where a negative group delay dispersion is given. The spectral waveform illustrated inFIG. 5 illustrates a case where a positive group delay dispersion is given. - By giving the positive or negative group delay dispersion to the optical pulse Pa incident on the
modulation surface 17, the peak intensities of the temporal waveform of the optical pulses Pb1 and Pb2 change.FIG. 6 is a diagram illustrating an example of a relationship between the group delay dispersion given to the optical pulse Pa by themodulation surface 17 and the peak intensities of the optical pulses Pb1 and Pb2. InFIG. 6 , the vertical axis indicates the peak intensities of the optical pulses Pb1 and Pb2, and the horizontal axis indicates the group delay dispersion given to the optical pulse Pa by themodulation surface 17. As illustrated inFIG. 6 , the peak intensities of the optical pulses Pb1 and Pb2 depend on the group delay dispersion. That is, in a case where the group delay dispersion is zero, the peak intensities of the optical pulses Pb1 and Pb2 are maximized. The peak intensities of the optical pulses Pb1 and Pb2 decrease as the absolute value of the group delay dispersion increases. Thus, by giving the positive or negative group delay dispersion to the optical pulse Pa on themodulation surface 17, it is possible to reduce the peak intensities of the optical pulses Pb1 and Pb2 as compared with a case where the group delay dispersion is not given. In the description of the present embodiment, the "peak intensity of the optical pulse" means the peak intensity of the optical pulse in the time domain unless otherwise specified. When the group delay dispersion is given to the optical pulse Pa on themodulation surface 17, the peak intensities of the optical pulses Pb1 and Pb2 in the time domain are reduced while the intensities of the optical pulses Pb1 and Pb2 in the spectrum domain are maintained. - The phase pattern presented on the
modulation surface 17 is a phase pattern for giving, to the optical pulse Pa, the group delay dispersion in which the maximum intensities of the optical pulses Pb1 and Pb2 fall below the threshold value of the non-linear optical phenomenon in theoptical component 7. As described above, when the phase pattern gives the positive or negative group delay dispersion to the optical pulse Pa, the peak intensity of the optical pulse train Pb output from thepulse forming unit 3 is reduced. Then, by sufficiently increasing the absolute value of the group delay dispersion given to the optical pulse Pa, the peak intensities of the optical pulses Pb1 and Pb2 propagating through theoptical component 7 can fall below the threshold value of the non-linear optical phenomenon. The sign of the group delay dispersion is equal to the sign of a group velocity dispersion which is the group delay dispersion per unit length. -
FIG. 7 is a conceptual diagram illustrating how the peak intensities of the optical pulses Pb1 and Pb2 change. As illustrated inFIG. 7 , by giving the positive or negative group delay dispersion to the optical pulse Pa in thepulse forming unit 3, the peak intensities of the optical pulses Pb1 and Pb2 fall below the threshold value Q1 of the non-linear optical phenomenon of theoptical component 7. In a case where theoptical component 7 is a long-distance optical waveguide such as an optical fiber, the peak intensities of the optical pulses Pb1 and Pb2 further change due to the group delay dispersion of theoptical component 7. In such a case, in both thelight input end 7a and thelight output end 7b of theoptical component 7, the peak intensities of the optical pulses Pb1 and Pb2 is preferably lower than the threshold value Q1 of the non-linear optical phenomenon. - The
SLM 14 forms the optical pulse train Pb including the optical pulses Pb1 and Pb2 from the optical pulse Pa.FIG. 8 is a diagram illustrating an example of a band-controlled multi-pulse. In this example, the optical pulse train Pb including the optical pulses Pb1 and Pb2 is illustrated.FIG. 8(a) is a spectrogram, in which the horizontal axis indicates the time and the vertical axis indicates the wavelength, and light intensity is represented by color gradation.FIG. 8(b) illustrates the temporal waveform of the optical pulse train Pb. The temporal waveform of each of the optical pulses Pb1 and Pb2 has, for example, a Gaussian function shape. As illustrated inFIGS. 8(a) and 8(b) , peaks of the optical pulses Pb1 and Pb2 are temporally separated from each other, and propagation timings of the optical pulses Pb1 and Pb2 are shifted from each other. In other words, with respect to one optical pulse Pb2, another optical pulse Pb1 has a time delay, and the optical pulses Pb1 and Pb2 have a time difference from each other. The center wavelengths of the optical pulses Pb1 and Pb2 are different from each other. The center wavelength of the optical pulse Pb1 is, for example, 805 nm. The center wavelength of the optical pulse Pb2 is, for example, 795 nm. The time interval (peak interval) between the optical pulses Pb1 and Pb2 is, for example, in a range of 10 fs to 10,000 fs, and is 2000 fs in an example. The FWHM of the optical pulses Pb1 and Pb2 is, for example, in a range of 10 fs to 5000 fs, and is 300 fs in an example. -
FIG. 8(c) illustrates a spectrum obtained by combining two optical pulses Pb1 and Pb2. As illustrated inFIG. 8(c) , the spectrum obtained by combining the two optical pulses Pb1 and Pb2 has a single peak. However, referring toFIG. 8(a) , the center wavelengths of the two optical pulses Pb1 and Pb2 are shifted from each other. The single peak illustrated inFIG. 8(c) substantially corresponds to the spectrum of the optical pulse Pa. The peak wavelength interval between the adjacent optical pulses Pb1 and Pb2 is determined by the spectral bandwidth of the optical pulse Pa and is approximately in a range of twice the full width at half maximum. In an example, in a case where the full width at half maximum (FWHM), which is the spectral bandwidth of the optical pulse Pa, is 10 nm, the peak wavelength interval is 10 nm. As a specific example, in a case where the center wavelength of the optical pulse Pa is 1550 nm, the peak wavelengths of the optical pulses Pb1 and Pb2 can be 1555 nm and 1545 nm, respectively. -
FIG. 9 is a diagram illustrating an example of a multi-pulse of which a band is not controlled, as a comparative example. In this example, an optical pulse train Pd including two optical pulses Pd1 and Pd2 is illustrated. Similarly toFIG. 8(a) ,FIG. 9(a) is a spectrogram, in which the horizontal axis indicates the time and the vertical axis indicates the wavelength, and the light intensity is represented by color gradation.FIG. 9(b) illustrates the temporal waveform of the optical pulse train Pd.FIG. 9(c) illustrates a spectrum obtained by combining the two optical pulses Pd1 and Pd2. As illustrated inFIGS. 9(a) to 9(c) , the peaks of the two optical pulses Pd1 and Pd2 are temporally separated from each other, but the center wavelengths of the two optical pulses Pd1 and Pd2 coincide with each other. Thepulse forming unit 3 in the present embodiment does not generate such an optical pulse train Pd, but generates an optical pulse train Pb having different center wavelengths as illustrated inFIG. 8 . - Refer to
FIG. 1 again. Thedispersion medium 8 receives the optical pulse train Pb output from thepulse forming unit 3. Thedispersion medium 8 has the positive or negative group delay dispersion. The sign of the group delay dispersion of thedispersion medium 8 is opposite to the sign of the group delay dispersion given to the optical pulse Pa in thepulse forming unit 3. That is, in a case where the positive group delay dispersion is given to the optical pulse Pa in thepulse forming unit 3, thedispersion medium 8 has the negative group delay dispersion. In a case where the negative group delay dispersion is given to the optical pulse Pa in thepulse forming unit 3, thedispersion medium 8 has the positive group delay dispersion. Thedispersion medium 8 gives the group delay dispersion to the optical pulses Pb1 and Pb2 included in the optical pulse train Pb. As a result, thedispersion medium 8 increases the peak intensities of the optical pulses Pb1 and Pb2 contrary to thepulse forming unit 3, and makes the peak intensities of the optical pulses Pb1 and Pb2 equal to or greater than the detection threshold value of thecorrelator 4. The optical pulse train Pb transmitted through thedispersion medium 8 is output from thelight output end 8b. - Refer to
FIG. 7 again. As described above, thedispersion medium 8 gives, to the optical pulse train Pb, the group delay dispersion having a sign opposite to the group delay dispersion given to the optical pulse Pa in thepulse forming unit 3. Thus, the peak intensity of the optical pulse train Pb in thedispersion medium 8 is increased. As a result, it is possible to make the intensity of the optical pulse train Pb equal to or greater than a detection threshold value Q2 of thecorrelator 4. - The above operation will be described with reference to
FIG. 6 . For example, when the negative group delay dispersion is given to the optical pulse Pa in thepulse forming unit 3, the peak intensities of the optical pulses Pb1 and Pb2 are reduced as indicated by an arrow B1 in FIG. Then, when the positive group delay dispersion is given to the optical pulses Pb1 and Pb2 in thedispersion medium 8, the peak intensities of the optical pulses Pb1 and Pb2 increase as indicated by an arrow B2 in FIG. For example, when the positive group delay dispersion is given to the optical pulse Pa in thepulse forming unit 3, the peak intensities of the optical pulses Pb1 and Pb2 are reduced as indicated by an arrow B3 in FIG. Then, when the negative group delay dispersion is given to the optical pulses Pb1 and Pb2 in thedispersion medium 8, the peak intensities of the optical pulses Pb1 and Pb2 increase as indicated by an arrow B4 in FIG. - It is sufficient that the
dispersion medium 8 is a medium in which the dispersion is not zero. Thedispersion medium 8 may be, for example, a light guide member such as an optical fiber or an optical waveguide, or may be a semiconductor or a dielectric optical crystal. Examples of the optical fiber include a single mode fiber, a multi-mode fiber, a rare-earth-doped fiber, a photonic crystal fiber, a dispersion shifted fiber, and a double clad fiber. Examples of the optical waveguide include semiconductor micro-waveguides of SiN, InP, and the like. Examples of the semiconductor or the dielectric optical crystal include diamond, SiO2, LiNbO3, LiTaO3, lanthanum-doped lead zirconate titanate (PLZT), Si, Ge, fullerene, graphite, graphene, carbon nanotube, GaN, GaAs, a magnetic body, an organic material, and a polymer material. Thedispersion medium 8 may be, for example, a grating pair, a prism pair, or the like. Thedispersion medium 8 may be, for example, glass such as BK7. In a case where the dispersion of theoptical component 7 is large, thedispersion medium 8 may be, for example, SF11 or the like having large dispersion. Thedispersion medium 8 is preferably a dispersion medium in which the non-linear optical phenomenon does not occur, and it is sufficient that the dispersion medium is a dispersion medium in which the non-linear optical phenomenon hardly occurs. It is sufficient that thedispersion medium 8 has a sufficiently small non-linear optical effect, for example. - Refer to
FIG. 1 again. The correlationoptical system 40 receives the optical pulse train Pb output from thedispersion medium 8 via thedispersion medium 8 and outputs the correlated light Pc. The correlated light Pc includes a plurality of optical pulses (plurality of third optical pulses) that are cross-correlation or autocorrelation of the optical pulse train Pb. In the present embodiment, the correlationoptical system 40 includes alens 41, anoptical element 42, and alens 43. Thelens 41 is provided on an optical path between thepulse forming unit 3 and theoptical element 42, and focuses the optical pulse train Pb output from thepulse forming unit 3 on theoptical element 42. Theoptical element 42 is, for example, a light-emitting object including one or both of a phosphor and a non-linear optical crystal that generates a second harmonic wave (SHG). Examples of the non-linear optical crystal include a KTP (KTiOPO4) crystal, an LBO (LiB3O5) crystal, a BBO (β-BaB2O4) crystal, and the like. Examples of the phosphor include coumarin, stilbene, rhodamine, and the like. Theoptical element 42 generates correlated light Pc including cross-correlation or autocorrelation of the optical pulse train Pb by receiving an input of the optical pulse train Pb. Thelens 43 collimates or focuses the correlated light Pc output from theoptical element 42. The correlated light Pc is light generated to more accurately calculate the feature amount of the temporal waveform of the optical pulse train Pb. - Here, a configuration example of the correlation
optical system 40 will be described in detail.FIG. 10 is a schematic diagram illustrating a correlationoptical system 40A for generating correlated light Pc including autocorrelation of the optical pulse train Pb, as the configuration example of the correlationoptical system 40. The correlationoptical system 40A includes abeam splitter 44 as an optical branching component that branches the optical pulse train Pb into two pieces. Thebeam splitter 44 is optically coupled to thepulse forming unit 3 via thedispersion medium 8 illustrated inFIG. 1 . Thebeam splitter 44 transmits a part of the optical pulse train Pb input from thepulse forming unit 3 via thedispersion medium 8, and reflects the remaining part. The branching ratio of thebeam splitter 44 is, for example, 1:1. One optical pulse train Pba branched by thebeam splitter 44 reaches thelens 41 through anoptical path 40c including a plurality ofmirrors 45. The other optical pulse train Pbb branched by thebeam splitter 44 reaches thelens 41 through anoptical path 40d including a plurality ofmirrors 46. The optical length of theoptical path 40c is different from the optical length of theoptical path 40d. Therefore, the plurality ofmirrors 45 and the plurality ofmirrors 46 constitute a delay optical system that applies a time difference to one optical pulse train Pba and the other optical pulse train Pbb branched by thebeam splitter 44. Further, at least some of the plurality ofmirrors 46 are mounted on a movingstage 47, and thus the optical length of theoptical path 40d becomes variable. Therefore, in this configuration, it is possible to make the time difference between the optical pulse train Pba and the optical pulse train Pbb variable. - In this example, the
optical element 42 includes a non-linear optical crystal. Thelens 41 focuses each of the optical pulse trains Pba and Pbb toward theoptical element 42, and causes the optical axes of the optical pulse trains Pba and Pbb to intersect each other at a predetermined angle in theoptical element 42. As a result, in theoptical element 42 which is a non-linear optical crystal, a second harmonic wave is generated starting from the intersection of the optical pulse trains Pba and Pbb. The second harmonic wave is the correlated light Pc and includes autocorrelation of the optical pulse train Pb. The correlated light Pc is collimated or focused by thelens 43 and then input to thedetector 400. -
FIG. 11 is a schematic diagram illustrating a correlationoptical system 40B for generating correlated light Pc including cross-correlation of the optical pulse train Pb, as another configuration example of the correlationoptical system 40. In the correlationoptical system 40B, the optical pulse train Pb reaches thelens 41 through anoptical path 40e, and a reference optical pulse Pr, which is a single pulse, reaches thelens 41 through anoptical path 40f. Theoptical path 40f includes a plurality ofmirrors 48 and is bent in a U shape. Further, at least some of the plurality ofmirrors 48 are mounted on a movingstage 49, and thus the optical length of theoptical path 40f becomes variable. Therefore, in this configuration, it is possible to make the time difference between the optical pulse train Pb and the reference optical pulse Pr (timing difference to reach the lens 41) variable. - Also in this example, the
optical element 42 includes a non-linear optical crystal. Thelens 41 focuses the optical pulse train Pb and the reference optical pulse Pr toward theoptical element 42, and causes the optical axis of the optical pulse train Pb to intersect the optical axis of the reference optical pulse Pr at a predetermined angle in theoptical element 42. As a result, in theoptical element 42 which is a non-linear optical crystal, a second harmonic wave is generated starting from the intersection of the optical pulse train Pb and the reference optical pulse Pr. The second harmonic wave is the correlated light Pc and includes cross-correlation of the optical pulse train Pb. The correlated light Pc is collimated or focused by thelens 43 and then input to thedetector 400. -
FIG. 12 is a schematic diagram illustrating a correlationoptical system 40C for generating correlated light Pc including cross-correlation of the optical pulse train Pb, as still another configuration example of the correlationoptical system 40. In this example, theSLM 14 of thepulse forming unit 3 is a polarization-dependent spatial light modulator having a modulation effect in a first polarization direction. Regarding this, the deflection plane of the optical pulse Pa input to thepulse forming unit 3 is inclined with respect to the polarization direction in which theSLM 14 has a modulation function. The optical pulse Pa includes a polarization component (arrow Dpi in FIG.) in the first polarization direction and a polarization component (symbol Dp2 in FIG.) in a second polarization direction perpendicular to the first polarization direction. The polarization of the optical pulse Pa is not limited to the above-described polarization (inclined linear polarization), and may be elliptically polarized light. - The polarization component of the optical pulse Pa in the first polarization direction is modulated in the
SLM 14 and output from thepulse forming unit 3 as the optical pulse train Pb. The polarization component of the optical pulse Pa in the second polarization direction is output from thepulse forming unit 3 as it is without being modulated in theSLM 14. The unmodulated polarization component is provided to the correlationoptical system 40 coaxially with the optical pulse train Pb as the reference optical pulse Pr that is a single pulse. The correlationoptical system 40 generates correlated light Pc including cross-correlation of the optical pulse train Pb from the optical pulse train Pb and the reference optical pulse Pr. In this configuration example, since a delay is applied to the optical pulse train Pb in theSLM 14 and a delay time is made variable (arrow E in FIG.), it is possible to make the time difference between the optical pulse train Pb and the reference optical pulse Pr (timing difference to reach the lens 41) variable. Therefore, it is possible to suitably generate the correlated light Pc including the cross-correlation of the optical pulse train Pb in the correlationoptical system 40. -
FIG. 13(a) illustrates the temporal waveform of the correlated light Pc in a case where the wavelength dispersion amount of theoptical component 7 is zero.FIG. 13(b) illustrates the temporal waveform of the correlated light Pc in a case where the wavelength dispersion amount of theoptical component 7 is not zero. In this example, peak intensities PE1 to PE3 of optical pulses Pc1 to Pc3 included in the correlated light Pc inFIG. 13(b) are greatly reduced as compared with those ofFIG. 13(a) . In addition, the full widths at half maximum Wi to W3 of the optical pulses Pc1 to Pc3 included in the correlated light Pc inFIG. 13(b) are significantly enlarged as compared with those ofFIG. 13(a) . Furthermore, a peak time interval G1,2 of the correlated light Pc inFIG. 13(b) is largely longer than that inFIG. 13(a) . - As described above, in a case where the wavelength dispersion of the
optical component 7 is not zero, the peak intensities PE1 to PE3, the full widths at half maximum Wi to W3, and the peak time intervals G1,2, and G2,3, which are the feature amounts of the temporal waveform of the correlated light Pc, greatly change as compared with a case where the wavelength dispersion amount of theoptical component 7 is zero. The amount of change depends on the wavelength dispersion amount of theoptical component 7. Thus, by observing the change in the feature amount of the temporal waveform of the correlated light Pc, it is possible to accurately and easily known the wavelength dispersion amount of theoptical component 7. However, in the above observation, the wavelength dispersion amount of theoptical component 7 may be corrected by using a known wavelength dispersion amount of the pulsedlaser light source 2. - Refer to
FIG. 1 again. Thedetector 400 receives the correlated light Pc output from the correlationoptical system 40. Thedetector 400 detects the temporal waveform of the correlated light Pc formed from the optical pulse train Pb having a peak intensity equal to or greater than the detection threshold value of thecorrelator 4. Thedetector 400 is configured to include, for example, a photodetector such as a photodiode. Thedetector 400 detects the temporal waveform of the correlated light Pc by converting the intensity of the correlated light Pc into an electrical signal. The electric signal that is the detection result is provided to thearithmetic operation unit 5b. In the present embodiment, the detection threshold value of thecorrelator 4 is a value determined based on the characteristics of the correlationoptical system 40 and thedetector 400. Since the optical pulse train Pb having a peak intensity equal to or greater than the detection threshold value of thecorrelator 4 enters into the correlationoptical system 40, it is possible for thedetector 400 to accurately detect the temporal waveform of the optical pulse train Pb. - The
arithmetic operation unit 5b is electrically connected to thedetector 400. Thearithmetic operation unit 5b estimates the wavelength dispersion amount of theoptical component 7 based on the feature amount of the temporal waveform provided from thedetector 400. As described above, according to the knowledge of the present inventor, in a case where the correlated light Pc including the cross-correlation or the autocorrelation of the optical pulse train Pb is generated, various feature amounts (for example, pulse interval, peak intensity, pulse width, and the like) in the temporal waveform of the correlated light Pc have a significant correlation with the wavelength dispersion amount of the measurement object. Therefore, thearithmetic operation unit 5b can accurately estimate the wavelength dispersion amount of theoptical component 7 as the measurement object by evaluating the feature amount of the temporal waveform of the correlated light Pc. - The
output unit 5c outputs the estimation result of the wavelength dispersion amount obtained by thearithmetic operation unit 5b. Theoutput unit 5c is, for example, a display device that displays the estimation result of the wavelength dispersion amount. - The
optical component 7 is disposed on the optical path between thepulse forming unit 3 and thedispersion medium 8. Theoptical component 7 is, for example, a light guide member such as an optical fiber or an optical waveguide. Examples of the optical fiber include a single mode fiber, a multi-mode fiber, a rare-earth-doped fiber, a photonic crystal fiber, a dispersion shifted fiber, and a double clad fiber. Examples of the optical waveguide include semiconductor micro-waveguides of SiN, InP, and the like. Theoptical component 7 may be, for example, a semiconductor or a dielectric optical crystal. In this case, theoptical component 7 may be diamond, SiO2, LiNbO3, LiTaO3, PLZT, Si, Ge, fullerene, graphite, graphene, carbon nanotube, GaN, GaAs, a magnetic body, an organic material, a polymer material, or the like. - Here, a combination of the sign of the group delay dispersion given by the phase pattern presented to the
SLM 14, the sign of the group delay dispersion of theoptical component 7, and the sign of the group delay dispersion of thedispersion medium 8 will be described. In the present embodiment, it is sufficient that the peak intensities of the optical pulses Pb1 and Pb2 are reduced by the group delay dispersion given to the optical pulse Pa by the phase pattern presented in theSLM 14, and the peak intensities of the optical pulses Pb1 and Pb2 are increased by the group delay dispersion of thedispersion medium 8. Therefore, it is sufficient that the sign of the group delay dispersion given by the phase pattern presented to theSLM 14 is opposite to the sign of the group delay dispersion of thedispersion medium 8. The sign of the group delay dispersion of theoptical component 7 may be either positive or negative. It is more preferable that the group delay dispersion given by the phase pattern presented to theSLM 14 be a negative group delay dispersion, and the group delay dispersion given by thedispersion medium 8 be a positive group delay dispersion. The group delay dispersion provided by many types of dispersion media is a positive group delay dispersion. Therefore, in a case where the group delay dispersion given from thedispersion medium 8 is the positive group delay dispersion, it is possible to select more types of dispersion media as thedispersion medium 8 in the present embodiment, as compared with a case where the group delay dispersion given from thedispersion medium 8 is the negative group delay dispersion. -
FIG. 14 is a schematic diagram illustrating a configuration example of hardware of thecontrol device 5. As illustrated inFIG. 14 , thecontrol device 5 may be physically configured as a normal computer including a processor (CPU) 51, a main storage device such as aROM 52 and aRAM 53, aninput device 54 such as a keyboard, a mouse, and a touch screen, anoutput device 55 such as a display (including a touch screen), a communication module 56 (such as a network card) for transmitting and receiving data to and from other devices, anauxiliary storage device 57 such as a hard disk, and the like. - The
processor 51 of the computer can realize the function of thearithmetic operation unit 5b by a wavelength dispersion amount calculation program. In other words, the wavelength dispersion amount calculation program causes theprocessor 51 of the computer to operate as thearithmetic operation unit 5b. The wavelength dispersion amount calculation program is stored in a storage device (storage medium) inside or outside the computer, for example, theauxiliary storage device 57. The storage device may be a non-transitory recording medium. Examples of the recording medium include a recording medium such as a flexible disk, a CD, and a DVD, a recording medium such as a ROM, a semiconductor memory, and a cloud server. Theoutput device 55 such as a display (including a touch screen) operates as theoutput unit 5c. - The
auxiliary storage device 57 stores the feature amount of the temporal waveform of the correlated light Pc theoretically calculated in advance (or measured in advance) on the assumption that the wavelength dispersion amount of theoptical component 7 is zero. By comparing the stored feature amount with the feature amount of the temporal waveform of the correlated light Pc detected by thedetector 400, it can be seen how much the feature amount of the correlated light Pc has changed due to the wavelength dispersion amount of theoptical component 7. Therefore, thearithmetic operation unit 5b can estimate the wavelength dispersion amount of theoptical component 7 by comparing the feature amount stored in theauxiliary storage device 57 with the feature amount of the temporal waveform of the correlated light Pc detected by thedetector 400. -
FIG. 15 is a flowchart illustrating a dispersion measuring method using thedispersion measuring device 1A having the above configuration. First, in an output step S101, the pulsedlaser light source 2 outputs an optical pulse Pa. - Then, in a pulse forming step S102, the
pulse forming unit 3 receives the optical pulse Pa and generates an optical pulse train Pb. Specifically, thepulse forming unit 3 forms the optical pulse train Pb from the optical pulse Pa output from the pulsedlaser light source 2. The optical pulse train Pb is modulated light including a plurality of optical pulses Pb1 and Pb2 having a time difference from each other and having different center wavelengths from each other. For example, thepulse forming unit 3 spatially separates a plurality of wavelength components included in the optical pulse Pa for each wavelength, and shifts the phases of the plurality of wavelength components from each other by using theSLM 14. Then, thepulse forming unit 3 focuses the plurality of wavelength components. Thus, it is possible to easily generate the optical pulse train Pb. In addition, in the pulse forming step S102, a phase pattern presented to theSLM 14 gives a positive or negative group delay dispersion to the optical pulse Pa. As a result, as described in the description of thepulse forming unit 3, in the optical pulses Pb1 and Pb2 to be formed, it is possible to reduce the peak intensity in the time domain while maintaining the intensity in the spectrum domain. - Subsequently, in a dispersion medium transmission step S103, the optical pulse train Pb is transmitted through the
dispersion medium 8. Specifically, after the optical pulse train Pb output from thepulse forming unit 3 is transmitted through theoptical component 7, the optical pulse train Pb is transmitted through thedispersion medium 8. Thedispersion medium 8 has a group delay dispersion having a sign opposite to the group delay dispersion given to the optical pulse Pa. When the optical pulse train Pb is transmitted, thedispersion medium 8 gives a group delay dispersion to the optical pulses Pb1 and Pb2 included in the optical pulse train Pb. As a result, when the optical pulse train Pb is transmitted through thedispersion medium 8, thedispersion medium 8 increases the peak intensities of the optical pulses Pb1 and Pb2 in the time domain. Therefore, it is possible to make the peak intensities of the optical pulses Pb1 and Pb2 be equal to or greater than the detection threshold value of thecorrelator 4. - Subsequently, in a detection step S104, the temporal waveform of the correlated light Pc is detected. Specifically, the correlation
optical system 40 receives the optical pulse train Pb output from thedispersion medium 8, and outputs correlated light Pc including a plurality of optical pulses Pc1 to Pc3 that are cross-correlation or autocorrelation of the optical pulse train Pb. Then, thedetector 400 detects the temporal waveform of the correlated light Pc. As an example, after the optical pulse train Pb is transmitted through thedispersion medium 8, the correlationoptical system 40 uses theoptical element 42 including one or both of the non-linear optical crystal and the phosphor to generate the correlated light Pc including cross-correlation or autocorrelation of the optical pulse train Pb. - For example, as illustrated in
FIG. 10 , the optical pulse train Pb is branched into two pieces, and one branched optical pulse train Pbb is swept with respect to the other optical pulse train Pba in time. Then, correlated light Pc including autocorrelation of the optical pulse train Pb is generated from one optical pulse train Pbb and the other optical pulse train Pba. Alternatively, for example, as illustrated inFIG. 11 , the reference optical pulse Pr is swept with respect to the optical pulse train Pb in time. Then, correlated light Pc including cross-correlation of the optical pulse train Pb is generated from the reference optical pulse Pr and the optical pulse train Pb. Alternatively, for example, as illustrated inFIG. 12 , the optical pulse train Pb is generated by modulating only the polarization component of the optical pulse Pa in the first polarization direction in theSLM 14. The polarization component of the optical pulse Pa in the second polarization direction is used as the reference optical pulse Pr. Then, in theSLM 14, the optical pulse train Pb is swept with respect to the reference optical pulse Pr in time. Then, correlated light Pc including cross-correlation of the optical pulse train Pb is generated from the optical pulse train Pb and the reference optical pulse Pr. - Subsequently, in an arithmetic operation step S105, the
arithmetic operation unit 5b estimates the wavelength dispersion amount of theoptical component 7 based on the feature amount of the temporal waveform of the correlated light Pc. Specifically, first, thearithmetic operation unit 5b acquires the feature amount of the temporal waveform of the correlated light Pc theoretically calculated in advance (or measured in advance) on the assumption that the wavelength dispersion of theoptical component 7 is zero. Then, thearithmetic operation unit 5b acquires the feature amount of the temporal waveform of the correlated light Pc detected in the detection step S104. Here, the feature amount is, for example, at least one feature amount selected from the group consisting of peak intensities E1 to E3, the full widths at half maximum Wi to W3, and the peak time intervals G1,2, and G2,3 illustrated inFIG. 13 . Subsequently, thearithmetic operation unit 5b estimates the wavelength dispersion amount of theoptical component 7 by comparing the acquired feature amounts of the two temporal waveforms. - Here, phase modulation for generating a band-controlled multi-pulse in the
SLM 14 of thepulse forming unit 3 illustrated inFIG. 2 will be described in detail. A domain before the lens 15 (spectral domain) and a domain behind the diffraction grating 16 (time domain) are in a Fourier transform relationship with each other. The phase modulation in the spectral domain has an influence on a temporal intensity waveform in the time domain. Therefore, the output light from thepulse forming unit 3 can have various temporal intensity waveforms different from the optical pulse Pa, in accordance with a modulation pattern of theSLM 14.FIG. 16(a) illustrates a spectral waveform (spectrum phase G21 and spectrum intensity G22) of the single-pulsed optical pulse Pa as an example.FIG. 16(b) illustrates a temporal intensity waveform of the optical pulse Pa.FIG. 17(a) illustrates a spectral waveform (spectrum phase G31 and spectrum intensity G32) of the output light from thepulse forming unit 3 when rectangular wave-shaped phase spectrum modulation is applied in theSLM 14, as an example.FIG. 17(b) illustrates a temporal intensity waveform of the output light. InFIGS. 16(a) and17(a) , the horizontal axis indicates the wavelength (nm), the left vertical axis indicates the intensity value (arbitrary unit) of an intensity spectrum, and the right vertical axis indicates the phase value (rad) of a phase spectrum. InFIGS. 16(b) and17(b) , the horizontal axis indicates the time (femtosecond), and the vertical axis indicates the light intensity (arbitrary unit). In the example illustrated inFIG. 17 , the single pulse of the optical pulse Pa is converted into a double pulse with high-order light by giving a rectangular wave-shaped phase spectral waveform to the output light. The spectrum and the waveform illustrated inFIG. 17 are one example. By combining various phase spectra and intensity spectra, it is possible to shape the temporal intensity waveform of the output light from thepulse forming unit 3 into various shapes. -
FIG. 18 is a diagram illustrating a configuration of a modulationpattern calculation apparatus 20 that performs an arithmetic operation of theSLM 14. The modulationpattern calculation apparatus 20 is, for example, a personal computer; a smart device such as a smartphone and a tablet terminal; or a computer such as a cloud server, that includes a processor. Thearithmetic operation unit 5b illustrated inFIG. 1 may also serve as the modulationpattern calculation apparatus 20. The modulationpattern calculation apparatus 20 is electrically connected to theSLM 14. The modulationpattern calculation apparatus 20 calculates a phase modulation pattern for bringing the temporal intensity waveform of the output light of thepulse forming unit 3 close to a desired waveform, and provides a control signal including the calculated phase modulation pattern to theSLM 14. The modulation pattern is data for controlling theSLM 14, and is data including a table of intensity of complex amplitude distribution or intensity of phase distribution. The modulation pattern is, for example, a computer-generated hologram (CGH). - The modulation
pattern calculation apparatus 20 in the present embodiment causes thecontrol unit 5a to store a phase pattern including a phase pattern for phase modulation and a phase pattern for intensity modulation. The phase pattern for phase modulation is a phase pattern that applies a phase spectrum for obtaining a desired waveform to the output light. The phase pattern for intensity modulation is a phase pattern that applies an intensity spectrum for obtaining a desired waveform to the output light. Therefore, as illustrated inFIG. 18 , the modulationpattern calculation apparatus 20 includes an arbitrarywaveform input unit 21, a phasespectrum design unit 22, an intensityspectrum design unit 23, and a modulationpattern generation unit 24. That is, the processor of a computer provided in the modulationpattern calculation apparatus 20 realizes the function of the arbitrarywaveform input unit 21, the function of the phasespectrum design unit 22, the function of the intensityspectrum design unit 23, and the function of the modulationpattern generation unit 24. The respective functions may be realized by the same processor or may be realized by different processors. - The processor of the computer can implement the above functions by a modulation pattern calculation program. Thus, the modulation pattern calculation program causes the processor of the computer to operate as the arbitrary
waveform input unit 21, the phasespectrum design unit 22, the intensityspectrum design unit 23, and the modulationpattern generation unit 24 in the modulationpattern calculation apparatus 20. The modulation pattern calculation program is stored in a storage device (storage medium) inside or outside the computer. The storage device may be a non-transitory recording medium. Examples of the recording medium include a recording medium such as a flexible disk, a CD, and a DVD, a recording medium such as a ROM, a semiconductor memory, a cloud server, and the like. - The arbitrary
waveform input unit 21 receives the desired temporal intensity waveform input from an operator. The operator inputs information on the desired temporal intensity waveform (for example, a pulse interval, a pulse width, the number of pulses, and the like) to the arbitrarywaveform input unit 21. The information on the desired temporal intensity waveform is provided to the phasespectrum design unit 22 and the intensityspectrum design unit 23. The phasespectrum design unit 22 calculates a phase spectrum of the output light of thepulse forming unit 3, which is suitable for realizing the given desired temporal intensity waveform. The intensityspectrum design unit 23 calculates an intensity spectrum of the output light of thepulse forming unit 3, which is suitable for realizing the given desired temporal intensity waveform. The modulationpattern generation unit 24 calculates a phase modulation pattern (for example, a computer-generated hologram) for applying the phase spectrum obtained in the phasespectrum design unit 22 and the intensity spectrum obtained in the intensityspectrum design unit 23 to the output light of thepulse forming unit 3. Then, a control signal SC including the calculated phase modulation pattern is provided to theSLM 14. TheSLM 14 is controlled based on the control signal SC. -
FIG. 19 is a block diagram illustrating an internal configuration of the phasespectrum design unit 22 and the intensityspectrum design unit 23. As illustrated inFIG. 19 , the phasespectrum design unit 22 and the intensityspectrum design unit 23 include aFourier transform unit 25, afunction replacement unit 26, a waveformfunction modification unit 27, an inverseFourier transform unit 28, and atarget generation unit 29. Thetarget generation unit 29 includes aFourier transform unit 29a and aspectrogram modification unit 29b. The functions of each of the components will be described in detail later. - The desired temporal intensity waveform is expressed as a function in the time domain and the phase spectrum is expressed as a function in the frequency domain. Therefore, the phase spectrum corresponding to the desired temporal intensity waveform is obtained, for example, by an iterative Fourier transform based on the desired temporal intensity waveform.
FIG. 20 is a diagram illustrating a calculation procedure of the phase spectrum using the iterative Fourier transform method. First, an initial intensity spectrum function A0(ω) and an initial phase spectrum function Ψ0(ω), which are functions of the frequency ω, are prepared (process number (1) in FIG.). In an example, the intensity spectrum function A0(ω) and the phase spectrum function Ψ0(ω) represent the spectrum intensity and the spectrum phase of the input light, respectively. Then, a waveform function (a) in the frequency domain, which includes the intensity spectrum function A0(ω) and the phase spectrum function Ψn(ω), is prepared (process number (2) in FIG.).
[Formula. 1]
- The subscript n indicates after the n-th Fourier transform process. Before a first Fourier transform process, the initial phase spectrum function Ψ0(ω) described above is used as the phase spectrum function Ψn(ω). i is an imaginary number.
- Then, Fourier transform from the frequency domain to the time domain is performed on the function (a) (arrow A1 in FIG.). As a result, a waveform function (b) in the time domain, which includes a temporal intensity waveform function bn(t) and a time-phase waveform function Θn(t), is obtained (process number (3) in FIG.).
[Formula. 2]
- Subsequently, the temporal intensity waveform function bn(t) included in the function (b) is replaced with a temporal intensity waveform function Target0(t) based on a desired waveform (process numbers (4) and (5) in FIG.).
[Formula. 3]
[Formula. 4]
- Subsequently, inverse Fourier transform from the time domain to the frequency domain is performed on a function (d) (arrow A2 in FIG.). As a result, a waveform function (e) in the frequency domain, which includes an intensity spectrum function Bn(ω) and the phase spectrum function Ψ0(ω), is obtained (process number (6) in FIG.).
[Formula. 5]
- Subsequently, in order to restrain the intensity spectrum function Bn(ω) included in the function (e), the intensity spectrum function Bn(ω) is replaced with the initial intensity spectrum function A0(ω) (process number (7) in FIG.).
[Formula. 6]
- Thereafter, by repeatedly performing the above processes (2) to (7) a plurality of times, the phase spectrum shape represented by the phase spectrum function Ψn(ω) in the waveform function can be brought close to the phase spectrum shape corresponding to the desired temporal intensity waveform. The finally obtained phase spectrum function ΨIFTA(ω) is the basis of the modulation pattern for obtaining the desired temporal intensity waveform.
- However, the iterative Fourier method as described above has a problem that, although the temporal intensity waveform can be controlled, it is not possible to control the frequency component (band wavelength) constituting the temporal intensity waveform. Therefore, the modulation
pattern calculation apparatus 20 in the present embodiment calculates the phase spectrum function and the intensity spectrum function that are the basis of the modulation pattern, by using a calculation method described below.FIG. 21 is a diagram illustrating a calculation procedure of the phase spectrum function in the phasespectrum design unit 22. First, an initial intensity spectrum function A0(ω) and an initial phase spectrum function Φ0(ω), which are functions of the frequency ω, are prepared (process number (11) in FIG.). In an example, the intensity spectrum function A0(ω) and the phase spectrum function Φ0(ω) represent the spectrum intensity and the spectrum phase of input light, respectively. Then, a first waveform function (g) in the frequency domain, which includes the intensity spectrum function A0(ω) and the phase spectrum function Φ0(ω), is prepared (process number (12-a)). Where i is an imaginary number.
[Formula. 7]
- Subsequently, the
Fourier transform unit 25 of the phasespectrum design unit 22 performs the Fourier transform on the function (g) from the frequency domain to the time domain (arrow A3 in FIG.). As a result, a second waveform function (h) in the time domain, which includes the temporal intensity waveform function a0(t) and the time-phase waveform function ϕ0(t), is obtained (Fourier transform step, process number (13)).
[Formula. 8]
- Subsequently, the
function replacement unit 26 of the phasespectrum design unit 22 substitutes the temporal intensity waveform function Target0(t) based on the desired waveform input by the arbitrarywaveform input unit 21 into a temporal intensity waveform function b0(t) as illustrated in the following formula (i) (process number (14-a)).
[Formula. 9]
- Subsequently, the
function replacement unit 26 of the phasespectrum design unit 22 substitutes the temporal intensity waveform function a0(t) with the temporal intensity waveform function b0(t), as represented by the following formula (j). That is, the temporal intensity waveform function a0(t) included in the function (h) is replaced with the temporal intensity waveform function Target0(t) based on the desired waveform (function replacement step, process number (15)).
[Formula. 10]
- Subsequently, the waveform
function modification unit 27 of the phasespectrum design unit 22 corrects the second waveform function such that the spectrogram of the second waveform function (j) after the replacement is close to the target spectrogram generated in advance in accordance with a desired wavelength band. First, by performing time-frequency transform on the second waveform function (j) after the replacement, the second waveform function (j) is converted into a spectrogram SG0,k(ω, t) (process number (15-a) in FIG.). The subscript k indicates k-th conversion processing. - Here, the time-frequency transform refers to performing frequency filter processing or numerical arithmetic operation processing (processing of obtaining a spectrum for each time by performing multiplication while shifting a window function) on a composite signal such as a temporal waveform to convert the composite signal into three-dimensional information including time, frequency, and intensity (spectrum intensity) of a signal component. Further, in the present embodiment, the transform result (time, frequency, and spectrum intensity) is defined as a "spectrogram".
- Examples of the time-frequency transform include short-time Fourier transform (STFT), wavelet transform (Halle wavelet transform, Gabor wavelet transform, Mexican-hat wavelet transform, Morley wavelet transform), and the like.
- In addition, the target spectrogram TargetSG0(ω, t) generated in advance in accordance with the desired wavelength band is read from the
target generation unit 29. The target spectrogram TargetSG0(ω, t) has substantially the same value as the target temporal waveform (the temporal intensity waveform and the frequency component constituting the temporal intensity waveform), and is generated in the target spectrogram function of the process number (15-b). - Then, the waveform
function modification unit 27 of the phasespectrum design unit 22 performs pattern matching between the spectrogram SG0,k(ω, t) and the target spectrogram TargetSG0(ω, t), and examines the similarity (how much the spectrogram SG0,k(ω, t) and the target spectrogram TargetSG0(ω, t) match with each other). In the present embodiment, an evaluation value is calculated as an index representing the similarity. Then, in the subsequent process number (15-c), it is determined whether or not the obtained evaluation value satisfies a predetermined end condition. When the condition is satisfied, the process proceeds to a process number (16). When the condition is not satisfied, the process proceeds to a process number (15-d). In the process number (15-d), the time-phase waveform function ϕ0(t) included in the second waveform function is changed to a certain time-phase waveform function ϕ0,k(t). The second waveform function after changing the time-phase waveform function is converted into a spectrogram again by time-frequency transform such as STFT. Thereafter, the above-described process numbers (15-a) to (15-d) are repeatedly performed. In this manner, the second waveform function is corrected such that the spectrogram SG0,k(ω, t) is gradually brought close to the target spectrogram TargetSG0(ω, t) (waveform function correction step). - Then, the inverse
Fourier transform unit 28 of the phasespectrum design unit 22 performs an inverse Fourier transform on the corrected second waveform function (arrow A4 in FIG.) and generates a third waveform function (k) in the frequency domain (inverse Fourier transform step, process number (16)).
[Formula. 11]
- The phase spectrum function Φ0,k(ω) included in the third waveform function (k) becomes a desired phase spectrum function ΦTWC-TFD(ω) to be finally obtained. The phase spectrum function ΦTWC-TFD(ω) is provided to the modulation
pattern generation unit 24. -
FIG. 22 is a diagram illustrating a calculation procedure of the intensity spectrum function in the intensityspectrum design unit 23. Since the process numbers (11) to (15-c) are similar to the above-described spectrum phase calculation procedure in the phasespectrum design unit 22, the description thereof is omitted. In a case where the evaluation value indicating the similarity between the spectrogram SG0,k(ω, t) and the target spectrogram TargetSG0(ω, t) does not satisfy the predetermined end condition, the waveformfunction modification unit 27 of the intensityspectrum design unit 23 changes the temporal intensity waveform function b0(t) to a certain temporal intensity waveform function b0,k(t) while restraining the time-phase waveform function ϕ0(t) included in the second waveform function with the initial value (process number (15-e)). The second waveform function after changing the temporal intensity waveform function is converted into a spectrogram again by time-frequency transform such as STFT. Thereafter, the process numbers (15-a) to (15-c) are repeatedly performed. In this manner, the second waveform function is corrected such that the spectrogram SG0,k(ω, t), is gradually brought close to the target spectrogram TargetSG0(ω, t) (waveform function correction step). - Then, the inverse
Fourier transform unit 28 of the intensityspectrum design unit 23 performs an inverse Fourier transform on the corrected second waveform function (arrow A4 in FIG.) and generates a third waveform function (m) in the frequency domain (inverse Fourier transform step, process number (16)).
[Formula. 12]
- Subsequently, in the process number (17-b), a filter processing unit of the intensity
spectrum design unit 23 performs filter processing based on the intensity spectrum of the input light, on the intensity spectrum function B0,k(ω) included in the third waveform function (m) (filter processing step). Specifically, in the intensity spectrum obtained by multiplying the intensity spectrum function B0,k(ω) by a coefficient α, a portion exceeding the cutoff intensity for each wavelength determined based on the intensity spectrum of the input light is cut. This is performed in order to prevent an occurrence of a situation in which an intensity spectrum function αB0,k(ω) does not exceed the spectrum intensity of the input light in all the wavelength ranges. In an example, the cutoff intensity for each wavelength is set to coincide with the intensity spectrum of the input light (the initial intensity spectrum function A0(ω) in the present embodiment). In this case, as represented in the following formula (n), at frequencies where the intensity spectrum function αB0,k(ω) is larger than the intensity spectrum function A0(ω), the value of the intensity spectrum function A0(ω) is taken as the value of the intensity spectrum function ATWC-TFD(ω). At frequencies where the intensity spectrum function αB0,k(ω) is equal to or smaller than the intensity spectrum function A0(ω), the value of the intensity spectrum function αB0,k(ω) is taken as the value of the intensity spectrum function ATWC-TFD(ω) (process number (17-b) in FIG.).
[Formula. 13]
- The intensity spectrum function ATWC-TFD(ω) is provided to the modulation
pattern generation unit 24 as the desired spectrum intensity to be finally obtained. - The modulation
pattern generation unit 24 calculates a phase modulation pattern (for example, a computer-generated hologram) for giving, to the output light, the spectrum phase represented by the phase spectrum function ΦTWC-TFD(ω) calculated in the phasespectrum design unit 22 and the spectrum intensity represented by the intensity spectrum function ATWC-TFD(ω) calculated in the intensity spectrum design unit 23 (data generation step). -
FIG. 23 is a diagram illustrating an example of a generation procedure of the target spectrogram TargetSG0(ω, t) in thetarget generation unit 29. The target spectrogram TargetSG0(ω, t) indicates a target temporal waveform. The temporal waveform is a temporal intensity waveform and a frequency component (wavelength band component) constituting the temporal intensity waveform. Therefore, the creation of the target spectrogram is a critical step for controlling the frequency component (wavelength band component). As illustrated inFIG. 23 , thetarget generation unit 29 first receives inputs of the spectral waveform (initial intensity spectrum function A0(ω) and initial phase spectrum function Φ0(ω) and the desired temporal intensity waveform function Target (t). In addition, thetarget generation unit 29 receives an input of a time function p0(t) including desired frequency (wavelength) band information (process number (21)). - Then, the
target generation unit 29 calculates a phase spectrum function ΦIFTA(ω) for realizing the temporal intensity waveform function Target0(t), for example, by using the iterative Fourier transform method illustrated inFIG. 20 (process number (22)). - Subsequently, the
target generation unit 29 calculates an intensity spectrum function AIFTA(ω) for realizing the temporal intensity waveform function Target0(t) by an iterative Fourier transform method using the previously obtained phase spectrum function ΦIFTA(ω) (process number (23)).FIG. 24 is a diagram illustrating an example of a procedure for calculating the intensity spectrum function AIFTA(ω). - Referring to
FIG. 24 , first, an initial intensity spectrum function Ak=0(ω) and an initial phase spectrum function Ψ0(ω) are prepared (process number (31) in FIG.). Then, a waveform function (o) in the frequency domain, which includes the intensity spectrum function Ak(ω) and the phase spectrum function Ψ0(ω), is prepared (process number (32) in FIG.).
[Formula. 14]
- The subscript k indicates after the k-th Fourier transform processing. Before the first Fourier transform processing, the intensity spectrum function Ak=0(ω) described above is used as the intensity spectrum function Ak(ω). i is an imaginary number.
- Then, Fourier transform from the frequency domain to the time domain is performed on the function (o) (arrow A5 in FIG.). As a result, a waveform function (p) in the time domain, which includes the temporal intensity waveform function bk(t), is obtained (process number (33) in FIG.).
[Formula. 15]
- Subsequently, the temporal intensity waveform function bk(t) included in the function (p) is replaced with the temporal intensity waveform function Target0(t) based on a desired waveform (process numbers (34) and (35) in FIG.).
[Formula. 16]
[Formula. 17]
- Subsequently, inverse Fourier transform from the time domain to the frequency domain is performed on a function (r) (arrow A6 in FIG.). As a result, a waveform function (s) in the frequency domain, which includes an intensity spectrum function Ck(ω) and the phase spectrum function Ψk(ω), is obtained (process number (36) in FIG.).
[Formula. 18]
- Subsequently, in order to restrain the phase spectrum function Ψk(ω) included in the function (s), the phase spectrum function Ψk(ω) is replaced with the initial phase spectrum function Ψ0(ω) (process number (37-a) in FIG.).
[Formula. 19]
- In addition, filter processing based on the intensity spectrum of the input light is performed on the intensity spectrum function Ck(ω) in the frequency domain after the inverse Fourier transform. Specifically, in the intensity spectrum represented by the intensity spectrum function Ck(ω), a portion exceeding a cutoff intensity for each wavelength determined based on the intensity spectrum of the input light is cut. In an example, the cutoff intensity for each wavelength is set to coincide with the intensity spectrum (for example, the initial intensity spectrum function Ak=0(ω)) of the input light. In this case, as represented in the following formula (u), at frequencies where the intensity spectrum function Ck(ω) is larger than the intensity spectrum function Ak=0(ω), the value of the intensity spectrum function Ak=0(ω) is taken as the value of the intensity spectrum function Ak(ω). At frequencies where the intensity spectrum function Ck(ω) is equal to or smaller than the intensity spectrum function Ak=0(ω), the value of the intensity spectrum function Ck(ω) is taken as the value of the intensity spectrum function Ak(ω) (process number (37-b) in FIG.).
[Formula. 20]
- The intensity spectrum function Ck(ω) included in the function (s) is replaced with the intensity spectrum function Ak(ω) after the filter processing in accordance with the above formula (u).
- Thereafter, by repeatedly performing the above processes (32) to (37-b), the phase spectrum shape represented by the intensity spectrum function Ak(ω) in the waveform function can be brought close to the intensity spectrum shape corresponding to the desired temporal intensity waveform. Finally, the intensity spectrum function AIFTA(ω) is obtained.
- Refer to
FIG. 23 again. By calculating the phase spectrum function ΦIFTA(ω) and the intensity spectrum function AIFTA(ω) in the process numbers (22) and (23) described above, a third waveform function (v) in the frequency domain, which includes the above functions, is obtained (process number (24)).
[Formula. 21]
- The
Fourier transform unit 29a of thetarget generation unit 29 performs the Fourier transform on the waveform function (v). As a result, a fourth waveform function (w) in the time domain is obtained (process number (25)).
[Formula. 22]
- The
spectrogram modification unit 29b of thetarget generation unit 29 converts the fourth waveform function (w) into a spectrogram SGIFTA(ω, t) by time-frequency transform (process number (26)). Then, in the process number (27), the target spectrogram TargetSG0(ω, t) is generated by correcting the spectrogram SGIFTA(ω, t) based on the time function p0(t) including the desired frequency (wavelength) band information (process number (28)). For example, a characteristic pattern appearing in the spectrogram SGIFTA(ω,t) configured by two-dimensional data is partially cut out, and a frequency component of this portion is operated based on the time function p0(t). Specific examples thereof will be described below in detail. - For example, consider a case where a triple pulse having a time interval of 2 picoseconds is set as the desired temporal intensity waveform function Target0(t). At this time, the spectrogram SGIFTA(ω, t) has a result as illustrated in
FIG. 25(a) . InFIG. 25(a) , the horizontal axis indicates the time (unit: femtosecond), and the vertical axis indicates the wavelength (unit: nm). The value of the spectrogram is indicated by the brightness and darkness inFIG. 25(a) , and the higher the brightness, the larger the value of the spectrogram. In this spectrogram SGIFTA(ω, t), triple pulses appear as domains Di, D2, and D3 separated on the time axis at intervals of 2 picoseconds. The center (peak) wavelengths of the domains Di, D2, and D3 are 800 nm. - In a case where it is desired to control only the temporal intensity waveform of the output light (to simply obtain a triple pulse), it is not necessary to operate the domains Di, D2, and D3. However, in a case where it is desired to control the frequency (wavelength) band of each pulse, it is necessary to operate the domains D1, D2, and D3. That is, as illustrated in
FIG. 25(b) , moving the domains D1, D2, and D3 independently of each other in a direction along the wavelength axis (vertical axis) means changing the constituent frequency (wavelength band) of each pulse. Such a change in the constituent frequency (wavelength band) of each pulse is performed based on the time function p0(t). - For example, when the time function p0(t) is described such that the peak wavelength of the domain D2 is kept at 800 nm and the peak wavelengths of the domains D1 and D3 are translated by -2 nm and +2 nm, respectively, the spectrogram SGIFTA(ω, t) changes to the target spectrogram TargetSG0(ω, t) illustrated in
FIG. 25(b) . For example, by performing such processing on the spectrogram, it is possible to create the target spectrogram in which the constituent frequency (wavelength band) of each pulse is freely controlled without changing the shape of the temporal intensity waveform. - Effects obtained by the
dispersion measuring device 1A and the dispersion measuring method in the present embodiment described above will be described. - When the wavelength dispersion amount of the
optical component 7 is estimated, a plurality of optical pulses Pb1 and Pb2 having a time difference from each other and having center wavelengths different from each other are caused to be transmitted through theoptical component 7. Then, the wavelength dispersion amount of theoptical component 7 can be estimated based on the temporal waveform of the correlated light Pc obtained from the plurality of optical pulses Pb1 and Pb2. Here, when the peak intensities of the optical pulses Pb1 and Pb2 are large, the measurement accuracy of the wavelength dispersion amount may be lowered. For example, when the peak intensities of the optical pulses Pb1 and Pb2 exceed a certain threshold value in theoptical component 7, a non-linear optical phenomenon occurs.FIG. 26 is a conceptual diagram illustrating temporal waveforms of the optical pulses Pb1 and Pb2 before and after the optical pulses Pb1 and Pb2 having a peak intensity equal to or greater than the threshold value Q1 of the non-linear optical phenomenon are transmitted through theoptical component 7. As illustrated inFIG. 26 , when the non-linear optical phenomenon occurs, the temporal waveforms of the optical pulses Pb1 and Pb2 are distorted. Alternatively, since the peak intensities of the optical pulses Pb1 and Pb2 are large, for example, theoptical component 7 may be damaged. Also in this case, the temporal waveforms of the optical pulses Pb1 and Pb2 are distorted. When the temporal waveforms of the optical pulses Pb1 and Pb2 are distorted, the temporal waveform of the correlated light Pc is also distorted. Thus, when the peak intensities of the optical pulses Pb1 and Pb2 are large, it may not be possible to accurately measure the wavelength dispersion amount of theoptical component 7 based on the temporal waveform of the correlated light Pc. - On the other hand, for example, it is conceivable to reduce the peak intensities of the optical pulses Pb1 and Pb2 when the
pulse forming unit 3 generates the optical pulse train Pb. However, when the peak intensities of the optical pulses Pb1 and Pb2 are simply reduced in thepulse forming unit 3, the detection accuracy of the temporal waveform is lowered, and thus it may not be possible to accurately measure the wavelength dispersion amount of theoptical component 7 based on the temporal waveform of the correlated light Pc.FIG. 27 is a conceptual diagram illustrating temporal waveforms of the optical pulses Pb1 and Pb2 before and after the optical pulses Pb1 and Pb2 with reduced peak intensity are transmitted through theoptical component 7. As illustrated inFIG. 27 , when the peak intensities of the optical pulses Pb1 and Pb2 are reduced in thepulse forming unit 3, the peak intensities of the optical pulses Pb1 and Pb2 after being transmitted through theoptical component 7 may fall below the detection threshold value Q2 of thecorrelator 4. In this case, it is not possible to accurately measure the wavelength dispersion amount of theoptical component 7. - In the
dispersion measuring device 1A and the dispersion measuring method in the present embodiment, the positive or negative group delay dispersion is given to the optical pulse Pa in the pulse forming unit 3 (pulse forming step S102). As a result, since the peak intensities of the optical pulses Pb1 and Pb2 are suppressed, for example, it is possible to make the peak intensities of the optical pulses Pb1 and Pb2 propagating through theoptical component 7 be equal to or smaller than the threshold value Q1 of the non-linear optical phenomenon. Alternatively, it is possible to prevent an occurrence of a situation in which the optical pulses Pb1 and Pb2 having a larger peak intensity enter into theoptical component 7 as theoptical component 7 is deteriorated, and theoptical component 7 is damaged. Then, when the optical pulses Pb1 and Pb2 are transmitted through theoptical component 7, and then is transmitted through thedispersion medium 8, a group delay dispersion having a sign opposite to the group delay dispersion given to the optical pulse Pa is given. As a result, it is possible to make the peak intensities of the optical pulses Pb1 and Pb2 be equal to or greater than the detection threshold value Q2 of thecorrelator 4. As a result, it is possible to accurately detect the temporal waveform of the correlated light Pc. From the above, according to the present embodiment, it is possible to accurately measure the wavelength dispersion amount of theoptical component 7. - As in the present embodiment, the phase pattern presented to the
SLM 14 may be a phase pattern for giving, to the optical pulse Pa, the group delay dispersion in which the peak intensities of the optical pulses Pb1 and Pb2 fall below the threshold value Q1 of the non-linear optical phenomenon in theoptical component 7. In this case, since the occurrence of the non-linear optical phenomenon is suppressed, it is possible to suppress the distortion of the temporal waveforms of the optical pulses Pb1 and Pb2 and to suppress the distortion of the temporal waveform of the correlated light Pc. - As in the present embodiment, the
correlator 4 including the correlationoptical system 40 and thedetector 400 may be adopted in order to detect the optical pulse train Pb transmitted through theoptical component 7 as the measurement object. As illustrated inFIGS. 10 to 12 , the correlationoptical system 40 is an optical system that spatially and temporally superimposes the optical pulse train Pb with the optical pulse train Pb itself or another pulse train. Specifically, by temporally sweeping one pulse train, a correlation waveform conforming to the temporal waveform shape of the optical pulse train Pb is detected. Here, in general, since the pulse is swept by spatially changing the optical path length by a driving stage or the like, the movement amount of the stage corresponds to the time delay amount of the correlation waveform. At this time, the time delay amount with respect to the stage movement amount is very small. Therefore, by adopting thecorrelator 4, in thedetector 400, it is possible to observe the pulse shape on a high time-resolved scale reaching the femtosecond order. As a result, it is possible to more accurately measure the wavelength dispersion amount of theoptical component 7 as the measurement object. -
FIG. 28 is a diagram illustrating adispersion measuring device 1B according to a first modification. As illustrated inFIG. 28 , in the first modification, thedispersion medium 8 is disposed not on the optical path between thepulse forming unit 3 and the correlationoptical system 40 but on an optical path between the correlationoptical system 40 and thedetector 400. Theoptical component 7 is disposed on the optical path between thepulse forming unit 3 and the correlationoptical system 40. The correlationoptical system 40 receives the optical pulse train Pb transmitted through theoptical component 7 and outputs correlated light Pc including optical pulses Pci to Pc3 which are cross-correlation or autocorrelation of the optical pulse train Pb. Thecontrol device 5 is electrically connected to thepulse forming unit 3 and thedetector 400. - The
dispersion medium 8 having the positive or negative group delay dispersion receives the correlated light Pc output from the correlationoptical system 40. At this time, thedispersion medium 8 gives the group delay dispersion to the optical pulses Pc1 to Pc3 included in the correlated light Pc to make the intensities of the optical pulses Pc1 to Pc3 equal to or greater than the threshold value (described later) of thedetector 400. - The
detector 400 receives the correlated light Pc transmitted through thedispersion medium 8 and detects the temporal waveform of the correlated light Pc having an intensity equal to or greater than the detection threshold value. The detection threshold value in the first modification is a value determined based on the characteristics of thedetector 400. Since the correlated light Pc having an intensity equal to or greater than the detection threshold value enters to thedetector 400, thedetector 400 can accurately detect the temporal waveform of the correlated light Pc. -
FIG. 29 is a flowchart illustrating a dispersion measuring method using thedispersion measuring device 1B having the above configuration. First, in an output step S201, the pulsedlaser light source 2 outputs an optical pulse Pa. - Then, in a pulse forming step S202, the
pulse forming unit 3 receives the optical pulse Pa and generates an optical pulse train Pb. Specifically, thepulse forming unit 3 forms the optical pulse train Pb from the optical pulse Pa output from the pulsedlaser light source 2. The optical pulse train Pb is modulated light including a plurality of optical pulses Pb1 and Pb2 having a time difference from each other and having different center wavelengths from each other. At this time, thepulse forming unit 3 gives the positive or negative group delay dispersion to the optical pulse Pa. That is, the phase pattern presented to theSLM 14 gives the positive or negative group delay dispersion to the optical pulse Pa. As a result, in the formed optical pulses Pb1 and Pb2, it is possible to reduce the intensity in the time domain while maintaining the intensity in the spectrum domain. - Subsequently, in a correlated-light output step S203, the correlation
optical system 40 outputs the correlated light Pc. Specifically, after the optical pulse train Pb is transmitted through theoptical component 7, the correlationoptical system 40 outputs the correlated light Pc including the optical pulses Pc1 to Pc3 that are cross-correlation or autocorrelation of the optical pulse train Pb. As an example, after the optical pulse train Pb is transmitted through theoptical component 7, the correlationoptical system 40 uses theoptical element 42 including one or both of the non-linear optical crystal and the phosphor to generate the correlated light Pc including cross-correlation or autocorrelation of the optical pulse train Pb. - Subsequently, in a dispersion medium transmission step S204, the correlated light Pc is transmitted through the
dispersion medium 8. Specifically, thedispersion medium 8 receives the correlated light Pc output from the correlationoptical system 40. The correlated light Pc is transmitted through thedispersion medium 8 having a group delay dispersion having a sign opposite to the group delay dispersion given to the optical pulse Pa. As a result, when the correlated light Pc is transmitted through thedispersion medium 8, it is possible to increase the intensities of the optical pulses Pc1 to Pb3 in the time domain to be equal to or greater than the detection threshold value of thedetector 400. - Subsequently, in a detection step S205, the
detector 400 detects the temporal waveform of the correlated light Pc transmitted through thedispersion medium 8. Specifically, thedetector 400 detects the temporal waveform of the correlated light Pc having an intensity equal to or greater than the detection threshold value of thedetector 400. - Subsequently, in an arithmetic operation step S206, the
arithmetic operation unit 5b estimates the wavelength dispersion amount of theoptical component 7 based on the feature amount of the temporal waveform of the correlated light Pc. - In the
dispersion measuring device 1B and the dispersion measuring method in the first modification, the positive or negative group delay dispersion is given to the optical pulse Pa in the pulse forming unit 3 (pulse forming step S202). As a result, since the intensities of the optical pulses Pb1 and Pb2 included in the optical pulse train Pb are suppressed, for example, it is possible to make the maximum intensities of the optical pulses Pb1 and Pb2 propagating through theoptical component 7 be equal to or smaller than the threshold value Q1 of the non-linear optical phenomenon. Then, when the optical pulses Pb1 and Pb2 are transmitted through theoptical component 7, and then the optical pulses Pc1 to Pc3 are transmitted through thedispersion medium 8, the group delay dispersion having a sign opposite to the group delay dispersion given to the optical pulse Pa is given. Therefore, it is possible to make the intensities of the optical pulses Pc1 to Pc3 be equal to or greater than the detection threshold value of thedetector 400. This makes it possible to accurately detect the temporal waveform of the correlated light Pc. From the above, it is possible to accurately measure the wavelength dispersion amount of theoptical component 7. - The embodiment can be used as a dispersion measuring device and a dispersion measuring method capable of more accurately measuring a wavelength dispersion amount of a measurement object.
-
- 1A, 1B
- dispersion measuring device
- 2
- pulsed laser light source
- 3
- pulse forming unit
- 3a
- light input end
- 3b
- light output end
- 4
- correlator
- 40, 40A, 40B, 40C
- correlation optical system
- 4a
- light input end
- 40b
- light output end
- 40c to 40f
- optical path
- 400
- detector
- 5
- control device
- 5a
- control unit
- 5b
- arithmetic operation unit
- 5c
- output unit
- 7
- optical component (measurement object)
- 8
- dispersion medium
- 8a
- light input end
- 8b
- light output end
- 12
- diffraction grating
- 13, 15
- lens
- 14
- spatial light modulator (SLM)
- 16
- diffraction grating
- 17
- modulation surface
- 17a
- modulation region
- 20
- modulation pattern calculation apparatus
- 21
- arbitrary waveform input unit
- 22
- phase spectrum design unit
- 23
- intensity spectrum design unit
- 24
- modulation pattern generation unit
- 25
- fourier transform unit
- 26
- function replacement unit
- 27
- waveform function modification unit
- 28
- inverse fourier transform unit
- 29
- target generation unit
- 29a
- fourier transform unit
- 29b
- spectrogram modification unit
- 41, 43
- lens
- 42
- optical element
- 44
- beam splitter
- 45, 46, 48
- mirror
- 47, 49
- moving stage
- 51
- processor
- 54
- input device
- 55
- output device
- 56
- communication module
- 57
- auxiliary storage device
- Pa
- optical pulse (first optical pulse)
- Pb, Pd
- optical pulse train
- Pb1, Pb2
- optical pulse (second optical pulse)
- Pd1, Pd2
- optical pulse
- Pba, Pbb
- optical pulse train
- Pc
- correlated light
- Pc1, Pc2, Pc3
- optical pulse
- Pr
- reference optical pulse
- SC
- control signal
- G11, G21
- spectrum phase
- G12, G22
- spectrum intensity
Claims (11)
- A dispersion measuring device comprising:a light source configured to output a first optical pulse;a pulse forming unit including a spatial light modulator configured to present a phase pattern for generating modulated light by applying a predetermined phase shift for each wavelength to the first optical pulse, the pulse forming unit forming an optical pulse train from the first optical pulse, and the optical pulse train being the modulated light including a plurality of second optical pulses having a time difference from each other and having center wavelengths different from each other;a dispersion medium having a positive or negative group delay dispersion and receiving the optical pulse train;a correlator including a correlation optical system configured to receive the optical pulse train transmitted through the dispersion medium and output correlated light including a plurality of third optical pulses that are cross-correlation or autocorrelation of the optical pulse train, and a detector configured to detect a temporal waveform of the correlated light, the correlator detecting the temporal waveform of the correlated light formed from the optical pulse train having an intensity equal to or greater than a detection threshold value; andan arithmetic operation unit electrically connected to the correlator, whereina measurement object is disposed on an optical path between the pulse forming unit and the dispersion medium,the arithmetic operation unit estimates a wavelength dispersion amount of the measurement object based on the temporal waveform of the correlated light,the dispersion medium gives a group delay dispersion to the plurality of second optical pulses included in the optical pulse train to increase peak intensities of the plurality of second optical pulses to be equal to or greater than the detection threshold value, andthe phase pattern includes a pattern for giving a group delay dispersion having a sign opposite to the group delay dispersion of the dispersion medium to the first optical pulse.
- A dispersion measuring device comprising:a light source configured to output a first optical pulse;a pulse forming unit including a spatial light modulator configured to present a phase pattern for generating modulated light by applying a predetermined phase shift for each wavelength to the first optical pulse, the pulse forming unit forming an optical pulse train from the first optical pulse, and the optical pulse train being the modulated light including a plurality of second optical pulses having a time difference from each other and having center wavelengths different from each other;a correlation optical system configured to receive the optical pulse train and output correlated light including a plurality of third optical pulses that are cross-correlation or autocorrelation of the optical pulse train;a dispersion medium having a positive or negative group delay dispersion and receiving the correlated light;a detector configured to receive the correlated light transmitted through the dispersion medium and detect a temporal waveform of the correlated light having a peak intensity equal to or greater than a detection threshold value; andan arithmetic operation unit electrically connected to the detector, whereina measurement object is disposed on an optical path between the pulse forming unit and the correlation optical system,the arithmetic operation unit estimates a wavelength dispersion amount of the measurement object based on the temporal waveform of the correlated light,the dispersion medium gives a group delay dispersion to the plurality of third optical pulses included in the correlated light to increase peak intensities of the plurality of third optical pulses to be equal to or greater than the detection threshold value, andthe phase pattern includes a pattern for giving a group delay dispersion having a sign opposite to the group delay dispersion of the dispersion medium to the first optical pulse.
- The dispersion measuring device according to claim 1 or 2, whereinthe group delay dispersion given from the phase pattern is a negative group delay dispersion, andthe group delay dispersion given from the dispersion medium is a positive group delay dispersion.
- The dispersion measuring device according to any one of claims 1 to 3, wherein the phase pattern is a phase pattern for giving, to the first optical pulse, a group delay dispersion in which peak intensities of the plurality of second optical pulses fall below a threshold value of a non-linear optical phenomenon in the measurement object.
- The dispersion measuring device according to any one of claims 1 to 4, wherein the dispersion medium is made of a material in which a non-linear optical phenomenon does not occur.
- The dispersion measuring device according to any one of claims 1 to 4, wherein the dispersion medium is an optical fiber, an optical waveguide, a semiconductor, a dielectric optical crystal, a grating pair, a prism pair, or a glass body.
- The dispersion measuring device according to claim 6, wherein the dispersion medium is a single mode fiber, a multi-mode fiber, a rare-earth-doped fiber, a photonic crystal fiber, a dispersion shifted fiber, or a double clad fiber.
- The dispersion measuring device according to claim 6, wherein the dispersion medium is a semiconductor waveguide containing SiN or InP.
- The dispersion measuring device according to claim 6, wherein the dispersion medium is diamond, SiO2, LiNbO3, LiTaO3, lanthanum-doped lead zirconate titanate, Si, Ge, fullerene, graphite, graphene, carbon nanotube, GaN, GaAs, a magnetic body, an organic material, or a polymer material.
- A dispersion measuring method comprising:an output step of outputting a first optical pulse;a pulse forming step of forming an optical pulse train from the first optical pulse, the optical pulse train being modulated light including a plurality of second optical pulses having a time difference from each other and having center wavelengths different from each other, by using a spatial light modulator configured to present a phase pattern for generating the modulated light by applying a predetermined phase shift for each wavelength to the first optical pulse;a dispersion medium transmission step transmitting the optical pulse train through a dispersion medium having a positive or negative group delay dispersion after transmitting the optical pulse train through a measurement object;a detection step of receiving the optical pulse train transmitted through the dispersion medium, generating correlated light including a plurality of third optical pulses that are cross-correlation or autocorrelation of the optical pulse train, and detecting a temporal waveform of the correlated light formed from the optical pulse train having a peak intensity equal to or greater than a detection threshold value; andan arithmetic operation step of estimating a wavelength dispersion amount of the measurement object based on the temporal waveform of the correlated light, whereinin the dispersion medium transmission step, when the optical pulse train is transmitted through the dispersion medium, a group delay dispersion is given to the plurality of second optical pulses included in the optical pulse train so that peak intensities of the plurality of second optical pulses are increased to be equal to or greater than the detection threshold value, andthe phase pattern includes a pattern for giving a group delay dispersion having a sign opposite to the group delay dispersion of the dispersion medium to the first optical pulse.
- A dispersion measuring method comprising:an output step of outputting a first optical pulse;a pulse forming step of forming an optical pulse train from the first optical pulse, the optical pulse train being modulated light including a plurality of second optical pulses having a time difference from each other and having center wavelengths different from each other, by using a spatial light modulator configured to present a phase pattern for generating the modulated light by applying a predetermined phase shift for each wavelength to the first optical pulse;a correlated-light output step of outputting correlated light including a plurality of third optical pulses that are cross-correlation or autocorrelation of the optical pulse train after the optical pulse train is transmitted through a measurement object;a dispersion medium transmission step transmitting the correlated light through a dispersion medium having a positive or negative group delay dispersion;a detection step of detecting a temporal waveform of the correlated light transmitted through the dispersion medium; andan arithmetic operation step of estimating a wavelength dispersion amount of the measurement object based on the temporal waveform of the correlated light, whereinin the detection step, the temporal waveform of the correlated light having an intensity equal to or greater than a detection threshold value is detected,in the dispersion medium transmission step, when the correlated light is transmitted through the dispersion medium, a group delay dispersion is given to the plurality of third optical pulses included in the correlated light so that intensities of the plurality of third optical pulses are increased to be equal to or greater than the detection threshold value, andthe phase pattern includes a pattern for giving a group delay dispersion having a sign opposite to the group delay dispersion of the dispersion medium to the first optical pulse.
Applications Claiming Priority (2)
| Application Number | Priority Date | Filing Date | Title |
|---|---|---|---|
| JP2021087088A JP7727413B2 (en) | 2021-05-24 | 2021-05-24 | Dispersion measurement device and dispersion measurement method |
| PCT/JP2022/011385 WO2022249659A1 (en) | 2021-05-24 | 2022-03-14 | Dispersion measuring device, and dispersion measuring method |
Publications (3)
| Publication Number | Publication Date |
|---|---|
| EP4303548A1 true EP4303548A1 (en) | 2024-01-10 |
| EP4303548A4 EP4303548A4 (en) | 2025-03-19 |
| EP4303548B1 EP4303548B1 (en) | 2026-01-21 |
Family
ID=84228580
Family Applications (1)
| Application Number | Title | Priority Date | Filing Date |
|---|---|---|---|
| EP22810937.7A Active EP4303548B1 (en) | 2021-05-24 | 2022-03-14 | Dispersion measuring device, and dispersion measuring method |
Country Status (4)
| Country | Link |
|---|---|
| US (1) | US12674720B2 (en) |
| EP (1) | EP4303548B1 (en) |
| JP (1) | JP7727413B2 (en) |
| WO (1) | WO2022249659A1 (en) |
Families Citing this family (2)
| Publication number | Priority date | Publication date | Assignee | Title |
|---|---|---|---|---|
| JP7727412B2 (en) | 2021-05-24 | 2025-08-21 | 浜松ホトニクス株式会社 | Dispersion measurement device and dispersion measurement method |
| WO2025243616A1 (en) * | 2024-05-24 | 2025-11-27 | 浜松ホトニクス株式会社 | Optical information acquisition device and optical information acquisition method |
Family Cites Families (10)
| Publication number | Priority date | Publication date | Assignee | Title |
|---|---|---|---|---|
| JP3221422B2 (en) * | 1998-12-28 | 2001-10-22 | 日本電気株式会社 | Chromatic dispersion measurement device |
| JP3379473B2 (en) * | 1999-05-10 | 2003-02-24 | 日本電気株式会社 | Dispersion measuring device |
| US7020360B2 (en) * | 2001-11-13 | 2006-03-28 | Advantest Corporation | Wavelength dispersion probing system |
| JP5605643B2 (en) * | 2010-12-17 | 2014-10-15 | アイシン精機株式会社 | Chromatic dispersion measuring apparatus and chromatic dispersion measuring method |
| JP2013096765A (en) * | 2011-10-31 | 2013-05-20 | Optohub:Kk | Optical pulse monitor device |
| WO2013086047A1 (en) * | 2011-12-06 | 2013-06-13 | Cornell University | Integrated multi-chip module optical interconnect platform |
| US10260990B2 (en) * | 2013-06-12 | 2019-04-16 | Corning Incorporated | Multi-wavelength DMD measurement apparatus and methods |
| US10389514B2 (en) * | 2017-04-06 | 2019-08-20 | Government Of The United States Of America, As Represented By The Secretary Of Commerce | Optical time distributor and process for optical two-way time-frequency transfer |
| JP7184700B2 (en) * | 2019-04-05 | 2022-12-06 | 浜松ホトニクス株式会社 | Dispersion measurement device, pulse light source, dispersion measurement method, and dispersion compensation method |
| JP7727412B2 (en) * | 2021-05-24 | 2025-08-21 | 浜松ホトニクス株式会社 | Dispersion measurement device and dispersion measurement method |
-
2021
- 2021-05-24 JP JP2021087088A patent/JP7727413B2/en active Active
-
2022
- 2022-03-14 EP EP22810937.7A patent/EP4303548B1/en active Active
- 2022-03-14 US US18/286,272 patent/US12674720B2/en active Active
- 2022-03-14 WO PCT/JP2022/011385 patent/WO2022249659A1/en not_active Ceased
Also Published As
| Publication number | Publication date |
|---|---|
| EP4303548B1 (en) | 2026-01-21 |
| US12674720B2 (en) | 2026-07-07 |
| WO2022249659A1 (en) | 2022-12-01 |
| JP7727413B2 (en) | 2025-08-21 |
| US20240201046A1 (en) | 2024-06-20 |
| EP4303548A4 (en) | 2025-03-19 |
| JP2022180151A (en) | 2022-12-06 |
Similar Documents
| Publication | Publication Date | Title |
|---|---|---|
| US12339167B2 (en) | Dispersion measuring device, pulse light source, dispersion measuring method, and dispersion compensating method | |
| EP4325193A1 (en) | Dispersion measurement device and dispersion measurement method | |
| US12366480B2 (en) | Dispersion measurement apparatus and dispersion measurement method | |
| EP3438625B1 (en) | Pulsed light waveform measurement method and waveform measurement device | |
| EP4325194A1 (en) | Dispersion measurement device and dispersion measurement method | |
| EP4194840A1 (en) | Dispersion measurement device and dispersion measurement method | |
| EP4303548B1 (en) | Dispersion measuring device, and dispersion measuring method | |
| JP5994285B2 (en) | Optical pulse compression apparatus and optical pulse compression method | |
| US12372458B2 (en) | Optical property measurement apparatus and optical property measurement method | |
| AU2018350865A1 (en) | Apparatus and method for reducing distortion of an optical signal | |
| EP4249895B1 (en) | Time response measurement apparatus and time response measurement method | |
| US20250264738A1 (en) | Data creation device, optical control device, target intensity spectrogram creation device, data creation method, target intensity spectrogram creation method, data creation program, and target intensity spectrogram creation program |
Legal Events
| Date | Code | Title | Description |
|---|---|---|---|
| STAA | Information on the status of an ep patent application or granted ep patent |
Free format text: STATUS: THE INTERNATIONAL PUBLICATION HAS BEEN MADE |
|
| PUAI | Public reference made under article 153(3) epc to a published international application that has entered the european phase |
Free format text: ORIGINAL CODE: 0009012 |
|
| STAA | Information on the status of an ep patent application or granted ep patent |
Free format text: STATUS: REQUEST FOR EXAMINATION WAS MADE |
|
| 17P | Request for examination filed |
Effective date: 20231005 |
|
| AK | Designated contracting states |
Kind code of ref document: A1 Designated state(s): AL AT BE BG CH CY CZ DE DK EE ES FI FR GB GR HR HU IE IS IT LI LT LU LV MC MK MT NL NO PL PT RO RS SE SI SK SM TR |
|
| DAV | Request for validation of the european patent (deleted) | ||
| DAX | Request for extension of the european patent (deleted) | ||
| A4 | Supplementary search report drawn up and despatched |
Effective date: 20250218 |
|
| RIC1 | Information provided on ipc code assigned before grant |
Ipc: G01M 11/00 20060101ALI20250212BHEP Ipc: G02F 1/01 20060101ALI20250212BHEP Ipc: G01N 21/41 20060101ALI20250212BHEP Ipc: G01M 11/02 20060101ALI20250212BHEP Ipc: G01J 11/00 20060101ALI20250212BHEP Ipc: G01J 9/00 20060101AFI20250212BHEP |
|
| GRAP | Despatch of communication of intention to grant a patent |
Free format text: ORIGINAL CODE: EPIDOSNIGR1 |
|
| STAA | Information on the status of an ep patent application or granted ep patent |
Free format text: STATUS: GRANT OF PATENT IS INTENDED |
|
| INTG | Intention to grant announced |
Effective date: 20251006 |
|
| GRAS | Grant fee paid |
Free format text: ORIGINAL CODE: EPIDOSNIGR3 |
|
| GRAA | (expected) grant |
Free format text: ORIGINAL CODE: 0009210 |
|
| STAA | Information on the status of an ep patent application or granted ep patent |
Free format text: STATUS: THE PATENT HAS BEEN GRANTED |
|
| AK | Designated contracting states |
Kind code of ref document: B1 Designated state(s): AL AT BE BG CH CY CZ DE DK EE ES FI FR GB GR HR HU IE IS IT LI LT LU LV MC MK MT NL NO PL PT RO RS SE SI SK SM TR |
|
| REG | Reference to a national code |
Ref country code: CH Ref legal event code: F10 Free format text: ST27 STATUS EVENT CODE: U-0-0-F10-F00 (AS PROVIDED BY THE NATIONAL OFFICE) Effective date: 20260121 |
|
| REG | Reference to a national code |
Ref country code: DE Ref legal event code: R096 Ref document number: 602022028946 Country of ref document: DE |
|
| REG | Reference to a national code |
Ref country code: IE Ref legal event code: FG4D |
|
| P01 | Opt-out of the competence of the unified patent court (upc) registered |
Free format text: CASE NUMBER: UPC_APP_0003401_4303548/2026 Effective date: 20260130 |
|
| PGFP | Annual fee paid to national office [announced via postgrant information from national office to epo] |
Ref country code: DE Payment date: 20260218 Year of fee payment: 5 |
|
| PGFP | Annual fee paid to national office [announced via postgrant information from national office to epo] |
Ref country code: AT Payment date: 20260301 Year of fee payment: 5 |
|
| PGFP | Annual fee paid to national office [announced via postgrant information from national office to epo] |
Ref country code: FR Payment date: 20260223 Year of fee payment: 5 |
|
| REG | Reference to a national code |
Ref country code: NL Ref legal event code: MP Effective date: 20260121 |
|
| PG25 | Lapsed in a contracting state [announced via postgrant information from national office to epo] |
Ref country code: NL Free format text: LAPSE BECAUSE OF FAILURE TO SUBMIT A TRANSLATION OF THE DESCRIPTION OR TO PAY THE FEE WITHIN THE PRESCRIBED TIME-LIMIT Effective date: 20260121 |
|
| REG | Reference to a national code |
Ref country code: AT Ref legal event code: MK05 Ref document number: 1879067 Country of ref document: AT Kind code of ref document: T Effective date: 20260121 |
|
| PG25 | Lapsed in a contracting state [announced via postgrant information from national office to epo] |
Ref country code: RS Free format text: LAPSE BECAUSE OF FAILURE TO SUBMIT A TRANSLATION OF THE DESCRIPTION OR TO PAY THE FEE WITHIN THE PRESCRIBED TIME-LIMIT Effective date: 20260421 |
|
| PG25 | Lapsed in a contracting state [announced via postgrant information from national office to epo] |
Ref country code: ES Free format text: LAPSE BECAUSE OF FAILURE TO SUBMIT A TRANSLATION OF THE DESCRIPTION OR TO PAY THE FEE WITHIN THE PRESCRIBED TIME-LIMIT Effective date: 20260121 |
|
| PG25 | Lapsed in a contracting state [announced via postgrant information from national office to epo] |
Ref country code: PL Free format text: LAPSE BECAUSE OF FAILURE TO SUBMIT A TRANSLATION OF THE DESCRIPTION OR TO PAY THE FEE WITHIN THE PRESCRIBED TIME-LIMIT Effective date: 20260121 |
|
| PG25 | Lapsed in a contracting state [announced via postgrant information from national office to epo] |
Ref country code: GR Free format text: LAPSE BECAUSE OF FAILURE TO SUBMIT A TRANSLATION OF THE DESCRIPTION OR TO PAY THE FEE WITHIN THE PRESCRIBED TIME-LIMIT Effective date: 20260422 |
|
| REG | Reference to a national code |
Ref country code: LT Ref legal event code: MG9D |
|
| PG25 | Lapsed in a contracting state [announced via postgrant information from national office to epo] |
Ref country code: LT Free format text: LAPSE BECAUSE OF FAILURE TO SUBMIT A TRANSLATION OF THE DESCRIPTION OR TO PAY THE FEE WITHIN THE PRESCRIBED TIME-LIMIT Effective date: 20260121 |
|
| PG25 | Lapsed in a contracting state [announced via postgrant information from national office to epo] |
Ref country code: NO Free format text: LAPSE BECAUSE OF FAILURE TO SUBMIT A TRANSLATION OF THE DESCRIPTION OR TO PAY THE FEE WITHIN THE PRESCRIBED TIME-LIMIT Effective date: 20260421 |
|
| PG25 | Lapsed in a contracting state [announced via postgrant information from national office to epo] |
Ref country code: FI Free format text: LAPSE BECAUSE OF FAILURE TO SUBMIT A TRANSLATION OF THE DESCRIPTION OR TO PAY THE FEE WITHIN THE PRESCRIBED TIME-LIMIT Effective date: 20260121 Ref country code: SE Free format text: LAPSE BECAUSE OF FAILURE TO SUBMIT A TRANSLATION OF THE DESCRIPTION OR TO PAY THE FEE WITHIN THE PRESCRIBED TIME-LIMIT Effective date: 20260121 Ref country code: AT Free format text: LAPSE BECAUSE OF FAILURE TO SUBMIT A TRANSLATION OF THE DESCRIPTION OR TO PAY THE FEE WITHIN THE PRESCRIBED TIME-LIMIT Effective date: 20260121 |
|
| PG25 | Lapsed in a contracting state [announced via postgrant information from national office to epo] |
Ref country code: HR Free format text: LAPSE BECAUSE OF FAILURE TO SUBMIT A TRANSLATION OF THE DESCRIPTION OR TO PAY THE FEE WITHIN THE PRESCRIBED TIME-LIMIT Effective date: 20260121 |
|
| PG25 | Lapsed in a contracting state [announced via postgrant information from national office to epo] |
Ref country code: PT Free format text: LAPSE BECAUSE OF FAILURE TO SUBMIT A TRANSLATION OF THE DESCRIPTION OR TO PAY THE FEE WITHIN THE PRESCRIBED TIME-LIMIT Effective date: 20260521 Ref country code: IS Free format text: LAPSE BECAUSE OF FAILURE TO SUBMIT A TRANSLATION OF THE DESCRIPTION OR TO PAY THE FEE WITHIN THE PRESCRIBED TIME-LIMIT Effective date: 20260521 |
|
| PG25 | Lapsed in a contracting state [announced via postgrant information from national office to epo] |
Ref country code: LV Free format text: LAPSE BECAUSE OF FAILURE TO SUBMIT A TRANSLATION OF THE DESCRIPTION OR TO PAY THE FEE WITHIN THE PRESCRIBED TIME-LIMIT Effective date: 20260121 |
|
| PG25 | Lapsed in a contracting state [announced via postgrant information from national office to epo] |
Ref country code: BG Free format text: LAPSE BECAUSE OF FAILURE TO SUBMIT A TRANSLATION OF THE DESCRIPTION OR TO PAY THE FEE WITHIN THE PRESCRIBED TIME-LIMIT Effective date: 20260121 |