EP4286837A1 - X-ray fluorescence analysis device - Google Patents
X-ray fluorescence analysis device Download PDFInfo
- Publication number
- EP4286837A1 EP4286837A1 EP21922983.8A EP21922983A EP4286837A1 EP 4286837 A1 EP4286837 A1 EP 4286837A1 EP 21922983 A EP21922983 A EP 21922983A EP 4286837 A1 EP4286837 A1 EP 4286837A1
- Authority
- EP
- European Patent Office
- Prior art keywords
- signal
- energy
- rays
- ray
- fluorescent
- Prior art date
- Legal status (The legal status is an assumption and is not a legal conclusion. Google has not performed a legal analysis and makes no representation as to the accuracy of the status listed.)
- Granted
Links
Images



Classifications
-
- G—PHYSICS
- G01—MEASURING; TESTING
- G01N—INVESTIGATING OR ANALYSING MATERIALS BY DETERMINING THEIR CHEMICAL OR PHYSICAL PROPERTIES
- G01N23/00—Investigating or analysing materials by the use of wave or particle radiation, e.g. X-rays or neutrons, not covered by groups G01N3/00 – G01N17/00, G01N21/00 or G01N22/00
- G01N23/22—Investigating or analysing materials by the use of wave or particle radiation, e.g. X-rays or neutrons, not covered by groups G01N3/00 – G01N17/00, G01N21/00 or G01N22/00 by measuring secondary emission from the material
- G01N23/223—Investigating or analysing materials by the use of wave or particle radiation, e.g. X-rays or neutrons, not covered by groups G01N3/00 – G01N17/00, G01N21/00 or G01N22/00 by measuring secondary emission from the material by irradiating the sample with X-rays or gamma-rays and by measuring X-ray fluorescence
-
- G—PHYSICS
- G01—MEASURING; TESTING
- G01T—MEASUREMENT OF NUCLEAR OR X-RADIATION
- G01T1/00—Measuring X-radiation, gamma radiation, corpuscular radiation, or cosmic radiation
- G01T1/16—Measuring radiation intensity
- G01T1/17—Circuit arrangements not adapted to a particular type of detector
-
- G—PHYSICS
- G01—MEASURING; TESTING
- G01N—INVESTIGATING OR ANALYSING MATERIALS BY DETERMINING THEIR CHEMICAL OR PHYSICAL PROPERTIES
- G01N2223/00—Investigating materials by wave or particle radiation
- G01N2223/07—Investigating materials by wave or particle radiation secondary emission
- G01N2223/076—X-ray fluorescence
-
- G—PHYSICS
- G01—MEASURING; TESTING
- G01N—INVESTIGATING OR ANALYSING MATERIALS BY DETERMINING THEIR CHEMICAL OR PHYSICAL PROPERTIES
- G01N2223/00—Investigating materials by wave or particle radiation
- G01N2223/10—Different kinds of radiation or particles
- G01N2223/101—Different kinds of radiation or particles electromagnetic radiation
- G01N2223/1016—X-ray
-
- G—PHYSICS
- G01—MEASURING; TESTING
- G01N—INVESTIGATING OR ANALYSING MATERIALS BY DETERMINING THEIR CHEMICAL OR PHYSICAL PROPERTIES
- G01N2223/00—Investigating materials by wave or particle radiation
- G01N2223/30—Accessories, mechanical or electrical features
- G01N2223/304—Accessories, mechanical or electrical features electric circuits, signal processing
-
- G—PHYSICS
- G01—MEASURING; TESTING
- G01T—MEASUREMENT OF NUCLEAR OR X-RADIATION
- G01T1/00—Measuring X-radiation, gamma radiation, corpuscular radiation, or cosmic radiation
- G01T1/16—Measuring radiation intensity
- G01T1/24—Measuring radiation intensity with semiconductor detectors
- G01T1/247—Detector read-out circuitry
-
- G—PHYSICS
- G01—MEASURING; TESTING
- G01T—MEASUREMENT OF NUCLEAR OR X-RADIATION
- G01T1/00—Measuring X-radiation, gamma radiation, corpuscular radiation, or cosmic radiation
- G01T1/36—Measuring spectral distribution of X-rays or of nuclear radiation spectrometry
- G01T1/366—Measuring spectral distribution of X-rays or of nuclear radiation spectrometry with semi-conductor detectors
Definitions
- the present invention relates to an energy dispersive type X-ray fluorescence analyzer, and more particularly to a fluorescence X-ray device capable of setting an energy range of fluorescent X-rays to be analyzed.
- An X-ray fluorescence analyzer irradiates a solid sample, a powder sample, or a liquid sample with excitation X-rays (primary X-rays) and detects fluorescent X-rays emitted by being excited by irradiated primary X-rays with a spectrometer to perform a qualitative or quantitative analysis of the element contained in the sample.
- X-ray fluorescence analyzers There are two types of X-ray fluorescence analyzers with different measurement principles, i.e., a wavelength-dispersive type X-ray fluorescence analyzer and an energy-dispersive type X-ray fluorescence analyzer.
- the energy-dispersive type X-ray fluorescence analyzer has a configuration in which fluorescent X-rays are directly detected by a semiconductor detector or the like, and the output signal is subsequently processed to separate each X-ray energy E (wavelength ⁇ ) (see, for example, Patent Documents 1 and 2).
- FIG. 4 is a schematic configuration diagram showing a configuration of a conventional energy-dispersive type X-ray fluorescence analyzer.
- the X-ray fluorescence analyzer 101 is provided with an X-ray tube 10, an energy dispersive type spectrometer 30 (also referred to as "detector 30"), a preamplifier 41, a differentiating circuit 42 composed of a capacitor C and a resistor R, an A/D converter 43, a signal processing unit 160 for performing digital signal processing, the signal processing unit being composed of a waveform conversion digital filter 61, a peak detection unit 62, and a histogram memory 63, and a CPU 150 for controlling the X-ray tube 10, the energy dispersive type spectrometer 30, the signal processing unit 160, and the like.
- the CPU 150 is connected to an input unit 151 for inputting settings, commands, etc., necessary for an analysis.
- the X-ray tube 10 is configured to emit primary X-rays generated at an end surface of a target to a sample S by applying a high voltage to the target and a low voltage to a filament to cause hot electrons emitted from the filament to collide with the end surface of the target.
- the detector 30 has a detection element (e.g., lithium drift type Si semiconductor detector) inside the housing, the detection element being configured to detect fluorescent X-rays.
- the detection element e.g., lithium drift type Si semiconductor detector
- the detection element being configured to detect fluorescent X-rays.
- the detection element When fluorescent X-rays emitted from the sample S by being irradiated with primary X-rays are incident on the detection element, the fluorescent X-rays are converted into an amount of charge proportional to the energy of the fluorescent X-rays and then detected.
- the amount of charge detected by the detector 30 is sent to the preamplifier 41, amplified, converted into a voltage signal, and output.
- the output voltage signal is in the form of a staircase wave in which each step of the staircase wave detects one fluorescent X-ray (quantum), and the height (wave height) of each step represents the X-ray energy E (wavelength ⁇ ).
- the output signal amplified by the preamplifier 41 is sent to the differentiating circuit 42.
- the differentiating circuit 42 converts the staircase wave into a differential wave represented by the following Formula (1).
- the A/D converter 43 converts the differential wave input as an analog signal into a differential wave digital signal and inputs it to the waveform conversion digital filter 61 in the signal processing unit 160.
- the waveform conversion digital filter 61 converts the input differential wave digital signal into a trapezoidal wave digital signal by processing it using the transfer function shown in the following Formula (2), as shown in FIG. 5 .
- the peak value (peak top value) of the peak can be accurately calculated.
- h z 1 ⁇ az ⁇ 1 1 ⁇ 2 z ⁇ 1 + z ⁇ 2 1 ⁇ z ⁇ N ⁇ z ⁇ N + M + z ⁇ 2 ⁇ N + M N
- M is a trapezoidal wave top time (time of the upper segment)
- N is a trapezoidal wave rise/fall time
- FIG. 6 is a schematic waveform diagram showing the differential wave digital signal input to the waveform conversion digital filter 61 and the trapezoidal waveform digital signal output after being waveform-converted by the waveform conversion digital filter 61.
- signals of various sizes are detected at irregular time intervals by the detector 30, differential wave digital signals of various sizes are input one after another at irregular time intervals to the waveform conversion digital filter 61 via the preamplifier 41, the differentiating circuit 42, and the A/D converter 43, and are processed with digital signals to produce a trapezoidal waveform digital signal with a peak value corresponding to each differential digital signal.
- the peak detection unit 62 detects the peak of the trapezoidal wave digital signal to obtain the peak value of the peak (peak top value), and increments the count value of the X-ray energy E corresponding to the peak top value each time one peak is detected, and stores it in the histogram memory 63.
- the energy range of the fluorescent X-rays to be analyzed is set in advance from the input unit 151.
- the CPU 150 Based on the data stored in the histogram memory 63, the CPU 150 generates a wave height distribution diagram (energy spectrum histogram) with the horizontal axis as the energy range of fluorescent X-rays set from the input unit 151 and the vertical axis as the content (intensity) of elements obtained from the counts, and displays it on the display screen (not shown).
- the energy dispersive type X-ray fluorescence analyzer 101 is configured such that the energy range (measurement range) in which the analysis is performed can be set during the analysis. Specifically, it is configured to set such that either the energy range of 0-20 eV or the energy range of 0-40 eV can be selected by the switching operation of the measurement range by the input unit 151 (e.g., the input screen displaying switch buttons).
- the same configuration is used for each part from the preamplifier 41 to the signal processing unit 160, which processes the signal detected by the detector 30 regardless of the X-ray energy range to be analyzed.
- the signal amplification factor G (gain G) of the preamplifier 41 is always set to the same value regardless of the X-ray energy range to be analyzed, specifically, the signal amplification factor G is set to "1x.”
- the voltage signal amplified by the preamplifier 41 at the signal amplification factor G is converted into a differential wave by the differentiating circuit 42 and input to the A/D converter 43.
- the signal amplification factor G of the preamplifier 41 is set to a large value (e.g., "2x"), the amount of change in the voltage signal input to the A/D converter 43 will become larger, which will improve the measurement sensitivity.
- the input voltage of the A/D converter 43 has an upper limit voltage value that can be taken in, when a voltage signal exceeding the maximum input voltage is input, the signal cannot be taken in due to saturation.
- FIG. 7 is a waveform diagram schematically showing the output voltage signal (staircase wave) of the preamplifier 41 when fluorescent X-rays are incident on the detector 30 one after the another and the voltage signal (differential wave) input to the A/D converter 43.
- the signal amplification factor G of the preamplifier 41 is set to the larger value "x2.”
- (a) of FIG. 7 shows the case when many fluorescent X-rays with small X-ray energy are incident
- (b) of FIG. 7 shows the case when many fluorescent X-rays with large X-ray energy are incident and saturated.
- the signal amplification factor G is set to a smaller signal amplification factor G value ("1x") such that the A/D converter 43 does not saturate even when performing an X-ray fluorescence analysis with large X-ray energy. Therefore, in an analysis within a smaller X-ray energy range, the S/N ratio cannot be increased, therefore it was difficult to perform an analysis with sufficient resolution.
- the purpose of the present invention is to provide an X-ray fluorescence analyzer capable of performing an analysis under more favorable conditions depending on an analysis target.
- An X-ray fluorescence analyzer made to solve the above-described problems, includes:
- the maximum energy in the set energy range of the fluorescent X-rays may include 40 KeV and 20 KeV.
- the energy range of fluorescent X-rays to be analyzed is set by the input unit.
- the energy of the X-rays incident one after another is about several KeV, and even if the signal amplification factor (gain) of the preamplifier is set to a large value, the differential wave signal sent to the A/D converter will not exceed the maximum input voltage of the A/D converter, allowing stable measurement.
- the energy of the X-rays incident one after another may be large (e.g., K ⁇ ray of Rh, K ⁇ ray of Sn, etc.), and when the signal amplification factor of the preamplifier is set to a large value, the differential wave signal exceeds the maximum input voltage of the A/D converter and becomes a saturate state, which may result in a case in which the signal cannot be analyzed.
- a plurality of preamplifiers with different signal amplification factors is provided in a switchable manner, and the maximum energy included in the set energy range of fluorescent X-rays is read out according to the energy range of the input setting when conducting an analysis, and based on this value, the preamplifier with a larger signal amplification factor between the preamplifiers with the signal amplifiation factor capable of being used within the range not exceeding the maximum input voltage of the A/D converter is automatically selected.
- the A/D converter when an analysis involving fluorescent X-rays with larger X-ray energy is performed, the A/D converter can be prevented from being saturated, and when an analysis involving fluorescent X-rays with low X-ray energy is performed, it is possible to perform the analysis under conditions where the resolution is improved by setting a large signal amplification factor to improve the S/N ratio.
- the measurer by simply setting the energy range of the fluorescent X-rays to be analyzed, it is automatically switched to a preamplifier with a signal amplification factor suitable for the analysis, eliminating an additional setup operation.
- the maximum energy of the fluorescence X-ray energy range to be set may include 40 KeV and 20 KeV.
- the input unit may set to 0-20 eV and 0-40 eV as the X-ray energy range to be analyzed.
- FIG. 1 is a diagram showing a schematic configuration of an energy-dispersive type X-ray fluorescence analyzer which is one embodiment of the present invention.
- the X-ray fluorescence analyzer 1 is provided with an X-ray tube 10, an energy dispersive type spectrometer 30 (also referred to as "detector 30"), a switch 35, preamplifiers 41A and 41B, a differentiating circuit 42 composed of a capacitor C and a resistor R, an A/D converter 43, a signal processing unit 160 for performing digital signal processing, the signal processing unit being composed of a waveform conversion digital filter 61, a peak detection unit 62, and a histogram memory 63, and a CPU 50 for controlling the X-ray tube 10, the energy dispersive type spectrometer 30, the signal processing unit 160, and the like.
- the CPU 50 is connected to an input unit 51 for inputting settings, commands, etc., necessary for analysis.
- two preamplifiers 41A and 41B with different signal amplification factors (gains) are connected in parallel across a switch 35 on the output side of the detector 30.
- the signal amplification factor G A of the preamplifier 41A is set to a signal amplification factor that will not cause the A/D converter 43 to saturate even when analyzing up to the maximum energy that can be measured by the X-ray fluorescence analyzer 1 (e.g., 40 KeV).
- This signal amplification factor is the same value as the signal amplification factor set in the preamplifier 41 of the conventional X-ray fluorescence analyzer 101 ( FIG. 4 ), and therefore, when an analysis is performed using the preamplifier 41A, the measurement can be performed with the same resolution within the same X-ray energy range as with the conventional device 101.
- the signal amplification factor G B of the preamplifier 41B is set to a larger signal amplification factor than G A , which improves the S/N ratio but may cause the A/D converter 43 to saturate when the preamplifier 41B is selected for an X-ray fluorescence analysis within a large X-ray energy range (e.g., 20 KeV or higher).
- the specific signal amplification factor in this example is set to "x1" for the signal amplification factor G A of the preamplifier 41A and "x2" for the signal amplification factor G B of the preamplifier 41B.
- the energy range of the fluorescent X-rays to be analyzed is set from the input unit 51. Specifically, it is configured such that either "0-20 eV" or "0-40 eV” can be selectively set as the energy range. Note that it is also configured such that an arbitrary energy range can be set.
- the CPU 50 is similar to the CPU 150 of the conventional device in that it controls the X-ray tube 10, the detector 30, the signal processing unit 160, etc., but is configured to read the maximum energy from the set fluorescence X-ray energy range set from the input unit 51 and select either one of the preamplifiers 41A or 41B based on this value.
- the preamplifier 41B when the maximum energy to be analyzed is 20 KeV or less, the preamplifier 41B is selected, and when the maximum energy is 40 KeV or greater than 20 KeV, the preamplifier 41A is selected.
- the CPU 50 performs the switching of the switch 35 so that the signal from the detector 30 is sent to the selected preamplifier 41A or 41B.
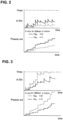
- FIG. 2 is a waveform diagram showing the staircase wave signals obtained when amplified by two preamplifiers with different signal amplification factors G A ( X 1) and G B (x2) and the differential signal to be input to the A/D converter in a fluorescence X-ray analysis for small X-ray energy.
- the thin single-dotted chain line shows the staircase wave signal and the differential wave signal amplified by the preamplifier 41A whose signal amplification factor G A is "x1,"
- the thick solid line shows the staircase wave signal and the differential wave signal amplified by the preamplifier 41B whose signal amplification factor G A is "x2.”
- the differential wave signal (A/Din) input to the A/D converter 43 during the analysis will not exceed the maximum input voltage (Vmax) of the A/D converter 43 regardless of whether the preamplifier 41A with the signal amplification factor G A (x1) or the preamplifier 41B with the signal amplification factor G A (x2) is used to amplitude the signal.
- the preamplifier 41B can obtain a differential wave signal with a larger amplitude, the S/N ratio can be improved and the energy resolution can be improved by performing the switching operation of the switch 35 so that the signal from the detector 30 is sent to the preamplifier 41B (signal amplification factor G B is "x2.")
- FIG. 3 is a waveform diagram showing the staircase wave signals obtained when amplified by two preamplifiers with different signal amplification factors G A ( X 1) and Gs(x2) in a fluorescence X-ray analysis for large X-ray energy and the differential signal to be input to the A/D converter.
- the thick single-dotted chain line shows the staircase wave signal and the differential wave signal amplified by the preamplifier 41A whose signal amplification factor G A is "x1,"
- the thin solid line shows the staircase wave signal and the differential wave signal amplified by the preamplifier 41B whose signal amplification factor G A is "x2.”
- the analysis can be performed in such a way that the A/D converter 43 is less likely to be saturated.
- preamplifiers with two different signal amplification factors are switched are described above, three or more preamplifiers with different signal amplification factors may be switched based on the maximum energy of the fluorescent X-rays to be analyzed.
- the differential wave digital signal sent from the A/D converter 43 may be digitally converting into other waveforms, such as, e.g., a triangular waveform, to perform the peak detection.
- the present invention can be applied to an energy dispersive type of fluorescence X-ray analyzer.
Landscapes
- Physics & Mathematics (AREA)
- Health & Medical Sciences (AREA)
- Life Sciences & Earth Sciences (AREA)
- General Physics & Mathematics (AREA)
- Biochemistry (AREA)
- Chemical & Material Sciences (AREA)
- Analytical Chemistry (AREA)
- General Health & Medical Sciences (AREA)
- Immunology (AREA)
- Pathology (AREA)
- Molecular Biology (AREA)
- Spectroscopy & Molecular Physics (AREA)
- High Energy & Nuclear Physics (AREA)
- Analysing Materials By The Use Of Radiation (AREA)
- Measurement Of Radiation (AREA)
Abstract
Description
- The present invention relates to an energy dispersive type X-ray fluorescence analyzer, and more particularly to a fluorescence X-ray device capable of setting an energy range of fluorescent X-rays to be analyzed.
- An X-ray fluorescence analyzer irradiates a solid sample, a powder sample, or a liquid sample with excitation X-rays (primary X-rays) and detects fluorescent X-rays emitted by being excited by irradiated primary X-rays with a spectrometer to perform a qualitative or quantitative analysis of the element contained in the sample. There are two types of X-ray fluorescence analyzers with different measurement principles, i.e., a wavelength-dispersive type X-ray fluorescence analyzer and an energy-dispersive type X-ray fluorescence analyzer.
- Among them, the energy-dispersive type X-ray fluorescence analyzer has a configuration in which fluorescent X-rays are directly detected by a semiconductor detector or the like, and the output signal is subsequently processed to separate each X-ray energy E (wavelength λ) (see, for example,
Patent Documents 1 and 2). -
FIG. 4 is a schematic configuration diagram showing a configuration of a conventional energy-dispersive type X-ray fluorescence analyzer. TheX-ray fluorescence analyzer 101 is provided with anX-ray tube 10, an energy dispersive type spectrometer 30 (also referred to as "detector 30"), apreamplifier 41, a differentiatingcircuit 42 composed of a capacitor C and a resistor R, an A/D converter 43, asignal processing unit 160 for performing digital signal processing, the signal processing unit being composed of a waveform conversiondigital filter 61, apeak detection unit 62, and ahistogram memory 63, and aCPU 150 for controlling theX-ray tube 10, the energydispersive type spectrometer 30, thesignal processing unit 160, and the like. TheCPU 150 is connected to aninput unit 151 for inputting settings, commands, etc., necessary for an analysis. - The
X-ray tube 10 is configured to emit primary X-rays generated at an end surface of a target to a sample S by applying a high voltage to the target and a low voltage to a filament to cause hot electrons emitted from the filament to collide with the end surface of the target. - The
detector 30 has a detection element (e.g., lithium drift type Si semiconductor detector) inside the housing, the detection element being configured to detect fluorescent X-rays. When fluorescent X-rays emitted from the sample S by being irradiated with primary X-rays are incident on the detection element, the fluorescent X-rays are converted into an amount of charge proportional to the energy of the fluorescent X-rays and then detected. The amount of charge detected by thedetector 30 is sent to thepreamplifier 41, amplified, converted into a voltage signal, and output. The output voltage signal is in the form of a staircase wave in which each step of the staircase wave detects one fluorescent X-ray (quantum), and the height (wave height) of each step represents the X-ray energy E (wavelength λ). - The output signal amplified by the
preamplifier 41 is sent to the differentiatingcircuit 42. The differentiatingcircuit 42 converts the staircase wave into a differential wave represented by the following Formula (1). By converting from the staircase wave to the differential wave as described above, a wider dynamic range can be ensured as compared with with the staircase wave, and higher resolution can be achieved.
- The A/
D converter 43 converts the differential wave input as an analog signal into a differential wave digital signal and inputs it to the waveform conversiondigital filter 61 in thesignal processing unit 160. - The waveform conversion
digital filter 61 converts the input differential wave digital signal into a trapezoidal wave digital signal by processing it using the transfer function shown in the following Formula (2), as shown inFIG. 5 . By converting the differential wave digital signal into the trapezoidal wave digital signal as described above, the peak value (peak top value) of the peak can be accurately calculated.
- In the above-described Formula, "M" is a trapezoidal wave top time (time of the upper segment), and "N" is a trapezoidal wave rise/fall time.
- In the above-described Formula,
FIG. 6 is a schematic waveform diagram showing the differential wave digital signal input to the waveform conversiondigital filter 61 and the trapezoidal waveform digital signal output after being waveform-converted by the waveform conversiondigital filter 61. When signals of various sizes are detected at irregular time intervals by thedetector 30, differential wave digital signals of various sizes are input one after another at irregular time intervals to the waveform conversiondigital filter 61 via thepreamplifier 41, the differentiatingcircuit 42, and the A/D converter 43, and are processed with digital signals to produce a trapezoidal waveform digital signal with a peak value corresponding to each differential digital signal. - The
peak detection unit 62 detects the peak of the trapezoidal wave digital signal to obtain the peak value of the peak (peak top value), and increments the count value of the X-ray energy E corresponding to the peak top value each time one peak is detected, and stores it in thehistogram memory 63. - On the other hand, the energy range of the fluorescent X-rays to be analyzed is set in advance from the
input unit 151. Based on the data stored in thehistogram memory 63, theCPU 150 generates a wave height distribution diagram (energy spectrum histogram) with the horizontal axis as the energy range of fluorescent X-rays set from theinput unit 151 and the vertical axis as the content (intensity) of elements obtained from the counts, and displays it on the display screen (not shown). -
- Patent Document 1:
Japanese Unexamined Patent Application Publication No. 2015-21957 - Patent Document 2:
Japanese Unexamined Patent Application Publication No. 2020-51900 - In a fluorescent X-ray analysis, depending on the analysis target, there is a case in which fluorescent X-rays with a small energy range are analyzed, or a case in which fluorescent X-rays with a large energy range are analyzed. For this reason, the energy dispersive type
X-ray fluorescence analyzer 101 is configured such that the energy range (measurement range) in which the analysis is performed can be set during the analysis. Specifically, it is configured to set such that either the energy range of 0-20 eV or the energy range of 0-40 eV can be selected by the switching operation of the measurement range by the input unit 151 (e.g., the input screen displaying switch buttons). - On the other hand, the same configuration is used for each part from the
preamplifier 41 to thesignal processing unit 160, which processes the signal detected by thedetector 30 regardless of the X-ray energy range to be analyzed. The signal amplification factor G (gain G) of thepreamplifier 41 is always set to the same value regardless of the X-ray energy range to be analyzed, specifically, the signal amplification factor G is set to "1x." - The voltage signal amplified by the
preamplifier 41 at the signal amplification factor G is converted into a differential wave by the differentiatingcircuit 42 and input to the A/D converter 43. When the signal amplification factor G of thepreamplifier 41 is set to a large value (e.g., "2x"), the amount of change in the voltage signal input to the A/D converter 43 will become larger, which will improve the measurement sensitivity. - However, since the input voltage of the A/
D converter 43 has an upper limit voltage value that can be taken in, when a voltage signal exceeding the maximum input voltage is input, the signal cannot be taken in due to saturation. -
FIG. 7 is a waveform diagram schematically showing the output voltage signal (staircase wave) of thepreamplifier 41 when fluorescent X-rays are incident on thedetector 30 one after the another and the voltage signal (differential wave) input to the A/D converter 43. For the purpose of improving the measurement sensitivity, the signal amplification factor G of thepreamplifier 41 is set to the larger value "x2." (a) ofFIG. 7 shows the case when many fluorescent X-rays with small X-ray energy are incident, and (b) ofFIG. 7 shows the case when many fluorescent X-rays with large X-ray energy are incident and saturated. - In a case where fluorescent X-rays with small X-ray energy are incident, the wave height of each individual staircase wave is small and the voltage change across the staircase wave is also small, so the differential wave signal input to the A/
D converter 43 does saturate by exceeding the maximum input voltage (see (a) ofFIG. 7 ). - On the other hand, in a case where fluorescent X-rays with high X-ray energy are incident, staircase waves with large wave heights are generated one after another, resulting in large changes in the overall staircase wave voltage, which increases the differential wave signal corresponding thereto. For this reason, when the signal amplification factor G of the
preamplifier 41 is set to a large value, the A/D converter 43 will eventually saturate by exceeding the maximum input voltage ((b) ofFIG. 7 ). - For this reason, the signal amplification factor G is set to a smaller signal amplification factor G value ("1x") such that the A/
D converter 43 does not saturate even when performing an X-ray fluorescence analysis with large X-ray energy. Therefore, in an analysis within a smaller X-ray energy range, the S/N ratio cannot be increased, therefore it was difficult to perform an analysis with sufficient resolution. - Therefore, the purpose of the present invention is to provide an X-ray fluorescence analyzer capable of performing an analysis under more favorable conditions depending on an analysis target.
- An X-ray fluorescence analyzer according to the present invention made to solve the above-described problems, includes:
- a detector configured to detect fluorescent X-rays emitted from a sample irradiated with excitation X-rays;
- preamplifiers each configured to amplify a detection signal from the detector into a staircase wave signal; and
- a differentiating circuit configured to convert the staircase wave signal into a differential wave signal;
- an A/D converter configured to convert the differential wave signal into a digital signal;
- a signal processing unit configured to detect a peak value from the digital signal, discriminate and count the peak value, and generate a histogram; and
- an input unit configured to set an energy range of fluorescent X-rays to be analyzed,
- wherein an energy spectrum in the set energy range is generated based on the histogram,
- wherein the preamplifiers are different in an amplification factor and arranged in a switchable manner, and
- wherein any one of the preamplifiers is automatically selected based on maximum energy in the set energy range.
- Here, the maximum energy in the set energy range of the fluorescent X-rays may include 40 KeV and 20 KeV.
- According to the X-ray fluorescence analyzer of the present invention, the energy range of fluorescent X-rays to be analyzed is set by the input unit. When the energy range of fluorescent X-rays to be analyzed is small, the energy of the X-rays incident one after another is about several KeV, and even if the signal amplification factor (gain) of the preamplifier is set to a large value, the differential wave signal sent to the A/D converter will not exceed the maximum input voltage of the A/D converter, allowing stable measurement.
- On the other hand, when the energy range of fluorescent X-rays to be analyzed is large, the energy of the X-rays incident one after another may be large (e.g., Kα ray of Rh, Kα ray of Sn, etc.), and when the signal amplification factor of the preamplifier is set to a large value, the differential wave signal exceeds the maximum input voltage of the A/D converter and becomes a saturate state, which may result in a case in which the signal cannot be analyzed.
- Therefore, a plurality of preamplifiers with different signal amplification factors is provided in a switchable manner, and the maximum energy included in the set energy range of fluorescent X-rays is read out according to the energy range of the input setting when conducting an analysis, and based on this value, the preamplifier with a larger signal amplification factor between the preamplifiers with the signal amplifiation factor capable of being used within the range not exceeding the maximum input voltage of the A/D converter is automatically selected.
- With this, when an analysis involving fluorescent X-rays with larger X-ray energy is performed, the A/D converter can be prevented from being saturated, and when an analysis involving fluorescent X-rays with low X-ray energy is performed, it is possible to perform the analysis under conditions where the resolution is improved by setting a large signal amplification factor to improve the S/N ratio. For the measurer, by simply setting the energy range of the fluorescent X-rays to be analyzed, it is automatically switched to a preamplifier with a signal amplification factor suitable for the analysis, eliminating an additional setup operation.
- Here, the maximum energy of the fluorescence X-ray energy range to be set may include 40 KeV and 20 KeV. Specifically, for example, the input unit may set to 0-20 eV and 0-40 eV as the X-ray energy range to be analyzed.
-
-
FIG. 1 is a schematic configuration diagram showing a conventional energy-dispersive type X-ray fluorescence analyzer according to one embodiment of the present invention. -
FIG. 2 is a waveform diagram showing the staircase wave signals obtained when amplified by two preamplifiers with different signal amplification factors GA(X1) and GB(x2) in a fluorescence X-ray analysis with small X-ray energy, and the differential signals to be input to the A/D converter. -
FIG. 3 is a waveform diagram showing the staircase wave signals obtained when amplified by two preamplifiers with different signal amplification factors GA(X1) and GB(x2) in a fluorescence X-ray analysis with large X-ray energy, and the differential signals to be input to the A/D converter. -
FIG. 4 is a schematic configuration diagram showing a conventional energy-dispersive type X-ray fluorescence analyzer. -
FIG. 5 is a diagram explaining the relation between a differential wave and a trapezoidal wave converted from the differential wave. -
FIG. 6 is a waveform diagram schematically showing a differential wave digital signals input to the digital filter one after another and the trapezoidal waveform digital signals output after waveform conversion (digital processing). -
FIG. 7 is a waveform diagram schematically showing an output voltage signal (staircase wave) of the preamplifier (signal amplification factor G is "x2") and a voltage signal (differential wave) input to the A/D converter. (a) shows a case in which a number of fluorescent X-rays with small X-ray energy is incident, and (b) shows a case in which a number of fluorescent X-rays with large X-ray energy is incident and saturated. - Hereinafter, embodiments of the present invention will be described with reference to the drawings. Note that the present invention is not limited to the embodiments described below but includes various embodiments to the extent that they do not depart from the gist of the present invention.
-
FIG. 1 is a diagram showing a schematic configuration of an energy-dispersive type X-ray fluorescence analyzer which is one embodiment of the present invention. - The
X-ray fluorescence analyzer 1 is provided with anX-ray tube 10, an energy dispersive type spectrometer 30 (also referred to as "detector 30"), aswitch 35,preamplifiers circuit 42 composed of a capacitor C and a resistor R, an A/D converter 43, asignal processing unit 160 for performing digital signal processing, the signal processing unit being composed of a waveform conversiondigital filter 61, apeak detection unit 62, and ahistogram memory 63, and aCPU 50 for controlling theX-ray tube 10, the energy dispersivetype spectrometer 30, thesignal processing unit 160, and the like. TheCPU 50 is connected to aninput unit 51 for inputting settings, commands, etc., necessary for analysis. - In this
X-ray fluorescence analyzer 1, some of explanations will be omitted by adding the same reference symbol for the same configuration as in the conventional energy-dispersive typeX-ray fluorescence analyzer 101 described with reference toFIG. 4 . - In the
X-ray fluorescence analyzer 1, twopreamplifiers switch 35 on the output side of thedetector 30. - The signal amplification factor GA of the
preamplifier 41A is set to a signal amplification factor that will not cause the A/D converter 43 to saturate even when analyzing up to the maximum energy that can be measured by the X-ray fluorescence analyzer 1 (e.g., 40 KeV). This signal amplification factor is the same value as the signal amplification factor set in thepreamplifier 41 of the conventional X-ray fluorescence analyzer 101 (FIG. 4 ), and therefore, when an analysis is performed using thepreamplifier 41A, the measurement can be performed with the same resolution within the same X-ray energy range as with theconventional device 101. - On the other hand, the signal amplification factor GB of the
preamplifier 41B is set to a larger signal amplification factor than GA, which improves the S/N ratio but may cause the A/D converter 43 to saturate when thepreamplifier 41B is selected for an X-ray fluorescence analysis within a large X-ray energy range (e.g., 20 KeV or higher). - Note that the specific signal amplification factor in this example is set to "x1" for the signal amplification factor GA of the
preamplifier 41A and "x2" for the signal amplification factor GB of thepreamplifier 41B. - Before starting the analysis, the energy range of the fluorescent X-rays to be analyzed is set from the
input unit 51. Specifically, it is configured such that either "0-20 eV" or "0-40 eV" can be selectively set as the energy range. Note that it is also configured such that an arbitrary energy range can be set. - The
CPU 50 is similar to theCPU 150 of the conventional device in that it controls theX-ray tube 10, thedetector 30, thesignal processing unit 160, etc., but is configured to read the maximum energy from the set fluorescence X-ray energy range set from theinput unit 51 and select either one of thepreamplifiers - That is, when the maximum energy to be analyzed is 20 KeV or less, the
preamplifier 41B is selected, and when the maximum energy is 40 KeV or greater than 20 KeV, thepreamplifier 41A is selected. TheCPU 50 performs the switching of theswitch 35 so that the signal from thedetector 30 is sent to the selectedpreamplifier -
FIG. 2 is a waveform diagram showing the staircase wave signals obtained when amplified by two preamplifiers with different signal amplification factors GA(X1) and GB(x2) and the differential signal to be input to the A/D converter in a fluorescence X-ray analysis for small X-ray energy. In the figure, the thin single-dotted chain line shows the staircase wave signal and the differential wave signal amplified by thepreamplifier 41A whose signal amplification factor GA is "x1," and the thick solid line shows the staircase wave signal and the differential wave signal amplified by thepreamplifier 41B whose signal amplification factor GA is "x2." - When performing a fluorescence X-ray analysis in the 0-20 KeV range, the energy of each individual incident X-ray is small. In this case, the differential wave signal (A/Din) input to the A/
D converter 43 during the analysis will not exceed the maximum input voltage (Vmax) of the A/D converter 43 regardless of whether thepreamplifier 41A with the signal amplification factor GA (x1) or thepreamplifier 41B with the signal amplification factor GA (x2) is used to amplitude the signal. And since thepreamplifier 41B can obtain a differential wave signal with a larger amplitude, the S/N ratio can be improved and the energy resolution can be improved by performing the switching operation of theswitch 35 so that the signal from thedetector 30 is sent to thepreamplifier 41B (signal amplification factor GB is "x2.") -
FIG. 3 is a waveform diagram showing the staircase wave signals obtained when amplified by two preamplifiers with different signal amplification factors GA(X1) and Gs(x2) in a fluorescence X-ray analysis for large X-ray energy and the differential signal to be input to the A/D converter. In the figure, the thick single-dotted chain line shows the staircase wave signal and the differential wave signal amplified by thepreamplifier 41A whose signal amplification factor GA is "x1," and the thin solid line shows the staircase wave signal and the differential wave signal amplified by thepreamplifier 41B whose signal amplification factor GA is "x2." - When conducting a fluorescent X-ray analysis from 0-40 KeV, i.e., when performing an analysis in which the maximum energy exceeds 20 KeV, there is a case in which the energy of each individual incident X-ray is large, and when amplified by the
preamplifier 41B with a large signal amplification factor, there is a case in which the differential wave signal input to the A/D converter 43 during the analysis (A/Din) exceeds the maximum input voltage (Vmax) of the A/D converter. Therefore, by performing the switching operation of theswitch 35 so that the signal from thedetector 30 is sent to thepreamplifier 41A (with a signal amplification factor of "x1"), the analysis can be performed in such a way that the A/D converter 43 is less likely to be saturated. - Although the embodiments in which the preamplifiers with two different signal amplification factors are switched are described above, three or more preamplifiers with different signal amplification factors may be switched based on the maximum energy of the fluorescent X-rays to be analyzed.
- Further, in this embodiment, although the peak detection was performed by converting the signal into a trapezoidal waveform digital signal by the signal processing unit, the differential wave digital signal sent from the A/
D converter 43 may be digitally converting into other waveforms, such as, e.g., a triangular waveform, to perform the peak detection. - The present invention can be applied to an energy dispersive type of fluorescence X-ray analyzer.
-
- 10:
- X-ray tube
- 30:
- Energy dispersive type spectrometer (detector)
- 35:
- Switch
- 41A, 41B:
- Preamplifier
- 42:
- Differentiating circuit
- 43:
- A/D converter
- 50:
- CPU
- 51:
- Input unit
- 61:
- Waveform conversion digital filter
- 62:
- Peak detection unit
- 63:
- Histogram memory
- 160:
- Signal processing unit
Claims (2)
- An X-ray fluorescence analyzer comprising:a detector configured to detect fluorescent X-rays emitted from a sample irradiated with excitation X-rays;preamplifiers each configured to amplify a detection signal from the detector into a staircase wave signal; anda differentiating circuit configured to convert the staircase wave signal into a differential wave signal;an A/D converter configured to convert the differential wave signal into a digital signal;a signal processing unit configured to detect a peak value from the digital signal, discriminate and count the peak value, and generate a histogram; andan input unit configured to set an energy range of fluorescent X-rays to be analyzed,wherein an energy spectrum in the set energy range is generated based on the histogram,wherein the preamplifiers are different in an amplification factor and arranged in a switchable manner, andwherein any one of the preamplifiers is automatically selected based on maximum energy in the set energy range.
- The X-ray fluorescence analyzer as recited in claim 1,
wherein the maximum energy in the set energy range of the fluorescent X-rays includes 40 KeV and 20 KeV.
Applications Claiming Priority (2)
| Application Number | Priority Date | Filing Date | Title |
|---|---|---|---|
| JP2021010813 | 2021-01-27 | ||
| PCT/JP2021/028103 WO2022162975A1 (en) | 2021-01-27 | 2021-07-29 | X-ray fluorescence analysis device |
Publications (3)
| Publication Number | Publication Date |
|---|---|
| EP4286837A1 true EP4286837A1 (en) | 2023-12-06 |
| EP4286837A4 EP4286837A4 (en) | 2024-12-04 |
| EP4286837B1 EP4286837B1 (en) | 2026-03-11 |
Family
ID=82653078
Family Applications (1)
| Application Number | Title | Priority Date | Filing Date |
|---|---|---|---|
| EP21922983.8A Active EP4286837B1 (en) | 2021-01-27 | 2021-07-29 | X-ray fluorescence analysis device |
Country Status (5)
| Country | Link |
|---|---|
| US (1) | US12436121B2 (en) |
| EP (1) | EP4286837B1 (en) |
| JP (1) | JP7444294B2 (en) |
| CN (1) | CN116802485A (en) |
| WO (1) | WO2022162975A1 (en) |
Families Citing this family (1)
| Publication number | Priority date | Publication date | Assignee | Title |
|---|---|---|---|---|
| CN116802485A (en) * | 2021-01-27 | 2023-09-22 | 株式会社岛津制作所 | Fluorescence X-ray analysis device |
Family Cites Families (23)
| Publication number | Priority date | Publication date | Assignee | Title |
|---|---|---|---|---|
| JP2001099794A (en) * | 1999-09-28 | 2001-04-13 | Jeol Ltd | Sample analyzer |
| JP2002022846A (en) * | 2000-07-05 | 2002-01-23 | Seiko Instruments Inc | Energy dispersive X-ray analyzer |
| JP3832331B2 (en) * | 2001-12-20 | 2006-10-11 | 株式会社島津製作所 | Electron beam analyzer |
| JP2003215072A (en) * | 2002-01-24 | 2003-07-30 | Rigaku Industrial Co | X-ray fluorescence analyzer |
| JP2004205488A (en) * | 2002-11-08 | 2004-07-22 | Denso Corp | Gas concentration detector |
| JP2005009861A (en) * | 2003-04-23 | 2005-01-13 | Rigaku Industrial Co | Wavelength dispersive X-ray fluorescence analyzer |
| GB0525593D0 (en) * | 2005-12-16 | 2006-01-25 | Cxr Ltd | X-ray tomography inspection systems |
| EP2076791B1 (en) * | 2006-10-25 | 2015-04-22 | Koninklijke Philips N.V. | Apparatus, imaging device and method for detecting x-ray radiation |
| JP2011164008A (en) * | 2010-02-12 | 2011-08-25 | Denso Corp | Current detector |
| JP5875790B2 (en) * | 2011-07-07 | 2016-03-02 | 株式会社東芝 | Photon counting type image detector, X-ray diagnostic apparatus, and X-ray computed tomography apparatus |
| US9128195B2 (en) * | 2012-03-28 | 2015-09-08 | Luxen Technologies, Inc. | Increasing dynamic range for x-ray image sensor |
| JP6003836B2 (en) | 2013-07-24 | 2016-10-05 | 株式会社島津製作所 | X-ray analysis signal processor |
| JP6002890B2 (en) * | 2014-09-18 | 2016-10-05 | 株式会社リガク | X-ray analyzer |
| US10267932B2 (en) * | 2016-02-05 | 2019-04-23 | Olympus Scientific Solutions Americas Inc. | Method and apparatus for X-ray detection system gain calibration using a pulser |
| US11415710B2 (en) | 2016-03-28 | 2022-08-16 | Olympus America Inc. | XRF analyzer with improved resolution by using micro-reset |
| JP6574957B2 (en) * | 2017-09-29 | 2019-09-18 | 株式会社リガク | X-ray analysis signal processing apparatus and method for adjusting X-ray analysis signal processing apparatus |
| CN108562603B (en) * | 2017-10-27 | 2023-08-15 | 钢研纳克检测技术股份有限公司 | X-ray detection system for spectrum energy spectrum composite type X-ray fluorescence spectrometer |
| JP6939701B2 (en) * | 2018-05-22 | 2021-09-22 | 株式会社島津製作所 | Energy dispersive X-ray fluorescence analyzer |
| JP7020357B2 (en) | 2018-09-27 | 2022-02-16 | 株式会社島津製作所 | Signal processing device for X-ray analysis |
| JP2021004779A (en) * | 2019-06-26 | 2021-01-14 | 株式会社島津製作所 | X-ray analysis device, x-ray analysis signal processing device and x-ray analysis method |
| CN110609050B (en) * | 2019-09-25 | 2021-05-25 | 成都理工大学 | Method and system for eliminating peak tailing of X-ray fluorescence spectrum |
| CN116802485A (en) * | 2021-01-27 | 2023-09-22 | 株式会社岛津制作所 | Fluorescence X-ray analysis device |
| JP7844903B2 (en) * | 2022-02-07 | 2026-04-14 | 株式会社島津製作所 | X-ray fluorescence analyzer, data processing method, and program |
-
2021
- 2021-07-29 CN CN202180091983.2A patent/CN116802485A/en active Pending
- 2021-07-29 WO PCT/JP2021/028103 patent/WO2022162975A1/en not_active Ceased
- 2021-07-29 EP EP21922983.8A patent/EP4286837B1/en active Active
- 2021-07-29 JP JP2022578024A patent/JP7444294B2/en active Active
- 2021-07-29 US US18/274,617 patent/US12436121B2/en active Active
Also Published As
| Publication number | Publication date |
|---|---|
| JP7444294B2 (en) | 2024-03-06 |
| JPWO2022162975A1 (en) | 2022-08-04 |
| CN116802485A (en) | 2023-09-22 |
| US12436121B2 (en) | 2025-10-07 |
| WO2022162975A1 (en) | 2022-08-04 |
| US20240085353A1 (en) | 2024-03-14 |
| EP4286837A4 (en) | 2024-12-04 |
| EP4286837B1 (en) | 2026-03-11 |
Similar Documents
| Publication | Publication Date | Title |
|---|---|---|
| CN101566591B (en) | Wavelength dispersion type x ray spectrometer | |
| Németh et al. | Laboratory von Hámos X-ray spectroscopy for routine sample characterization | |
| JP6769402B2 (en) | Electron microanalyzer and data processing program | |
| CN110873725B (en) | X-ray analysis apparatus | |
| JP6003836B2 (en) | X-ray analysis signal processor | |
| US4885465A (en) | Spectrum display device for x-ray microanalyzer or the like | |
| US11585769B2 (en) | Quantitative analysis method, quantitative analysis program, and X-ray fluorescence spectrometer | |
| EP4286837B1 (en) | X-ray fluorescence analysis device | |
| US9188552B2 (en) | X-ray spectrometer and sample analyzer | |
| JP4499125B2 (en) | Quantitative analysis method in sample analyzer | |
| JP2007285786A (en) | X-ray analyzer using electron beam | |
| JP7020357B2 (en) | Signal processing device for X-ray analysis | |
| CN101101269B (en) | Energy dispersion type radiation detecting system and method of measuring content of object element | |
| JP7400643B2 (en) | X-ray analysis device, signal processing device for X-ray analysis, and X-ray analysis method | |
| EP3770589B1 (en) | Analyzer | |
| US12429442B2 (en) | Scanning electron microscope and map display method for absorption edge structure | |
| EP3611543B1 (en) | X-ray analyzer and method for correcting counting rate | |
| JPH0247542A (en) | Quantitative analysis using x-ray spectroscope | |
| Attaelmanan | Reliability of a new X-ray analytical microscope in archaeological research | |
| JP4486438B2 (en) | X-ray analyzer with wave height distribution display function | |
| KR101169502B1 (en) | Wave dispersive x-ray spectrometer | |
| JP7501680B2 (en) | X-ray analysis signal processing device | |
| JPH09178680A (en) | Spectrum display device for X-ray microanalyzer etc. | |
| Newbury et al. | Comprehensive quantitative elemental microanalysis with electron-excited energy dispersive x-ray spectrometry (EDS): 50 years young and getting better every day! | |
| JP4891363B2 (en) | Fluorescence detection method and fluorescence detection apparatus |
Legal Events
| Date | Code | Title | Description |
|---|---|---|---|
| STAA | Information on the status of an ep patent application or granted ep patent |
Free format text: STATUS: THE INTERNATIONAL PUBLICATION HAS BEEN MADE |
|
| PUAI | Public reference made under article 153(3) epc to a published international application that has entered the european phase |
Free format text: ORIGINAL CODE: 0009012 |
|
| STAA | Information on the status of an ep patent application or granted ep patent |
Free format text: STATUS: REQUEST FOR EXAMINATION WAS MADE |
|
| 17P | Request for examination filed |
Effective date: 20230803 |
|
| AK | Designated contracting states |
Kind code of ref document: A1 Designated state(s): AL AT BE BG CH CY CZ DE DK EE ES FI FR GB GR HR HU IE IS IT LI LT LU LV MC MK MT NL NO PL PT RO RS SE SI SK SM TR |
|
| DAV | Request for validation of the european patent (deleted) | ||
| DAX | Request for extension of the european patent (deleted) | ||
| A4 | Supplementary search report drawn up and despatched |
Effective date: 20241106 |
|
| RIC1 | Information provided on ipc code assigned before grant |
Ipc: G01T 1/17 20060101ALI20241030BHEP Ipc: G01N 23/223 20060101AFI20241030BHEP |
|
| GRAP | Despatch of communication of intention to grant a patent |
Free format text: ORIGINAL CODE: EPIDOSNIGR1 |
|
| STAA | Information on the status of an ep patent application or granted ep patent |
Free format text: STATUS: GRANT OF PATENT IS INTENDED |
|
| RIC1 | Information provided on ipc code assigned before grant |
Ipc: G01N 23/223 20060101AFI20251003BHEP Ipc: G01T 1/17 20060101ALI20251003BHEP |
|
| INTG | Intention to grant announced |
Effective date: 20251023 |
|
| GRAS | Grant fee paid |
Free format text: ORIGINAL CODE: EPIDOSNIGR3 |
|
| GRAA | (expected) grant |
Free format text: ORIGINAL CODE: 0009210 |
|
| STAA | Information on the status of an ep patent application or granted ep patent |
Free format text: STATUS: THE PATENT HAS BEEN GRANTED |
|
| AK | Designated contracting states |
Kind code of ref document: B1 Designated state(s): AL AT BE BG CH CY CZ DE DK EE ES FI FR GB GR HR HU IE IS IT LI LT LU LV MC MK MT NL NO PL PT RO RS SE SI SK SM TR |
|
| REG | Reference to a national code |
Ref country code: CH Ref legal event code: F10 Free format text: ST27 STATUS EVENT CODE: U-0-0-F10-F00 (AS PROVIDED BY THE NATIONAL OFFICE) Effective date: 20260311 Ref country code: GB Ref legal event code: FG4D |
|
| REG | Reference to a national code |
Ref country code: DE Ref legal event code: R096 Ref document number: 602021049961 Country of ref document: DE |
|
| REG | Reference to a national code |
Ref country code: IE Ref legal event code: FG4D |
|
| PG25 | Lapsed in a contracting state [announced via postgrant information from national office to epo] |
Ref country code: RS Free format text: LAPSE BECAUSE OF FAILURE TO SUBMIT A TRANSLATION OF THE DESCRIPTION OR TO PAY THE FEE WITHIN THE PRESCRIBED TIME-LIMIT Effective date: 20260611 |
|
| PG25 | Lapsed in a contracting state [announced via postgrant information from national office to epo] |
Ref country code: ES Free format text: LAPSE BECAUSE OF FAILURE TO SUBMIT A TRANSLATION OF THE DESCRIPTION OR TO PAY THE FEE WITHIN THE PRESCRIBED TIME-LIMIT Effective date: 20260311 |
|
| PGFP | Annual fee paid to national office [announced via postgrant information from national office to epo] |
Ref country code: GB Payment date: 20260608 Year of fee payment: 6 |
|
| PG25 | Lapsed in a contracting state [announced via postgrant information from national office to epo] |
Ref country code: GR Free format text: LAPSE BECAUSE OF FAILURE TO SUBMIT A TRANSLATION OF THE DESCRIPTION OR TO PAY THE FEE WITHIN THE PRESCRIBED TIME-LIMIT Effective date: 20260612 |
|
| REG | Reference to a national code |
Ref country code: LT Ref legal event code: MG9D |
|
| PG25 | Lapsed in a contracting state [announced via postgrant information from national office to epo] |
Ref country code: LT Free format text: LAPSE BECAUSE OF FAILURE TO SUBMIT A TRANSLATION OF THE DESCRIPTION OR TO PAY THE FEE WITHIN THE PRESCRIBED TIME-LIMIT Effective date: 20260311 |
|
| PG25 | Lapsed in a contracting state [announced via postgrant information from national office to epo] |
Ref country code: NO Free format text: LAPSE BECAUSE OF FAILURE TO SUBMIT A TRANSLATION OF THE DESCRIPTION OR TO PAY THE FEE WITHIN THE PRESCRIBED TIME-LIMIT Effective date: 20260611 |
|
| PG25 | Lapsed in a contracting state [announced via postgrant information from national office to epo] |
Ref country code: SE Free format text: LAPSE BECAUSE OF FAILURE TO SUBMIT A TRANSLATION OF THE DESCRIPTION OR TO PAY THE FEE WITHIN THE PRESCRIBED TIME-LIMIT Effective date: 20260311 Ref country code: FI Free format text: LAPSE BECAUSE OF FAILURE TO SUBMIT A TRANSLATION OF THE DESCRIPTION OR TO PAY THE FEE WITHIN THE PRESCRIBED TIME-LIMIT Effective date: 20260311 |
|
| REG | Reference to a national code |
Ref country code: NL Ref legal event code: MP Effective date: 20260311 |
|
| PG25 | Lapsed in a contracting state [announced via postgrant information from national office to epo] |
Ref country code: HR Free format text: LAPSE BECAUSE OF FAILURE TO SUBMIT A TRANSLATION OF THE DESCRIPTION OR TO PAY THE FEE WITHIN THE PRESCRIBED TIME-LIMIT Effective date: 20260311 |
|
| PGFP | Annual fee paid to national office [announced via postgrant information from national office to epo] |
Ref country code: FR Payment date: 20260608 Year of fee payment: 6 |
|
| PG25 | Lapsed in a contracting state [announced via postgrant information from national office to epo] |
Ref country code: LV Free format text: LAPSE BECAUSE OF FAILURE TO SUBMIT A TRANSLATION OF THE DESCRIPTION OR TO PAY THE FEE WITHIN THE PRESCRIBED TIME-LIMIT Effective date: 20260311 |
|
| PG25 | Lapsed in a contracting state [announced via postgrant information from national office to epo] |
Ref country code: BG Free format text: LAPSE BECAUSE OF FAILURE TO SUBMIT A TRANSLATION OF THE DESCRIPTION OR TO PAY THE FEE WITHIN THE PRESCRIBED TIME-LIMIT Effective date: 20260311 |