EP4266083A1 - Distribution fitting constant false alarm rate (cfar) detection - Google Patents
Distribution fitting constant false alarm rate (cfar) detection Download PDFInfo
- Publication number
- EP4266083A1 EP4266083A1 EP23159571.1A EP23159571A EP4266083A1 EP 4266083 A1 EP4266083 A1 EP 4266083A1 EP 23159571 A EP23159571 A EP 23159571A EP 4266083 A1 EP4266083 A1 EP 4266083A1
- Authority
- EP
- European Patent Office
- Prior art keywords
- noise
- cfar
- cells
- samples
- corresponding cell
- Prior art date
- Legal status (The legal status is an assumption and is not a legal conclusion. Google has not performed a legal analysis and makes no representation as to the accuracy of the status listed.)
- Pending
Links
Images


Classifications
-
- G—PHYSICS
- G01—MEASURING; TESTING
- G01S—RADIO DIRECTION-FINDING; RADIO NAVIGATION; DETERMINING DISTANCE OR VELOCITY BY USE OF RADIO WAVES; LOCATING OR PRESENCE-DETECTING BY USE OF THE REFLECTION OR RERADIATION OF RADIO WAVES; ANALOGOUS ARRANGEMENTS USING OTHER WAVES
- G01S7/00—Details of systems according to groups G01S13/00, G01S15/00, G01S17/00
- G01S7/02—Details of systems according to groups G01S13/00, G01S15/00, G01S17/00 of systems according to group G01S13/00
- G01S7/28—Details of pulse systems
- G01S7/285—Receivers
- G01S7/292—Extracting wanted echo-signals
- G01S7/2923—Extracting wanted echo-signals based on data belonging to a number of consecutive radar periods
- G01S7/2927—Extracting wanted echo-signals based on data belonging to a number of consecutive radar periods by deriving and controlling a threshold value
-
- G—PHYSICS
- G01—MEASURING; TESTING
- G01S—RADIO DIRECTION-FINDING; RADIO NAVIGATION; DETERMINING DISTANCE OR VELOCITY BY USE OF RADIO WAVES; LOCATING OR PRESENCE-DETECTING BY USE OF THE REFLECTION OR RERADIATION OF RADIO WAVES; ANALOGOUS ARRANGEMENTS USING OTHER WAVES
- G01S13/00—Systems using the reflection or reradiation of radio waves, e.g. radar systems; Analogous systems using reflection or reradiation of waves whose nature or wavelength is irrelevant or unspecified
- G01S13/02—Systems using reflection of radio waves, e.g. primary radar systems; Analogous systems
- G01S13/50—Systems of measurement based on relative movement of target
- G01S13/52—Discriminating between fixed and moving objects or between objects moving at different speeds
- G01S13/522—Discriminating between fixed and moving objects or between objects moving at different speeds using transmissions of interrupted pulse modulated waves
- G01S13/524—Discriminating between fixed and moving objects or between objects moving at different speeds using transmissions of interrupted pulse modulated waves based upon the phase or frequency shift resulting from movement of objects, with reference to the transmitted signals, e.g. coherent MTi
- G01S13/5246—Discriminating between fixed and moving objects or between objects moving at different speeds using transmissions of interrupted pulse modulated waves based upon the phase or frequency shift resulting from movement of objects, with reference to the transmitted signals, e.g. coherent MTi post processors for coherent MTI discriminators, e.g. residue cancellers, CFAR after Doppler filters
-
- G—PHYSICS
- G01—MEASURING; TESTING
- G01S—RADIO DIRECTION-FINDING; RADIO NAVIGATION; DETERMINING DISTANCE OR VELOCITY BY USE OF RADIO WAVES; LOCATING OR PRESENCE-DETECTING BY USE OF THE REFLECTION OR RERADIATION OF RADIO WAVES; ANALOGOUS ARRANGEMENTS USING OTHER WAVES
- G01S7/00—Details of systems according to groups G01S13/00, G01S15/00, G01S17/00
- G01S7/02—Details of systems according to groups G01S13/00, G01S15/00, G01S17/00 of systems according to group G01S13/00
- G01S7/28—Details of pulse systems
- G01S7/285—Receivers
- G01S7/292—Extracting wanted echo-signals
- G01S7/2921—Extracting wanted echo-signals based on data belonging to one radar period
- G01S7/2922—Extracting wanted echo-signals based on data belonging to one radar period by using a controlled threshold
-
- G—PHYSICS
- G01—MEASURING; TESTING
- G01S—RADIO DIRECTION-FINDING; RADIO NAVIGATION; DETERMINING DISTANCE OR VELOCITY BY USE OF RADIO WAVES; LOCATING OR PRESENCE-DETECTING BY USE OF THE REFLECTION OR RERADIATION OF RADIO WAVES; ANALOGOUS ARRANGEMENTS USING OTHER WAVES
- G01S7/00—Details of systems according to groups G01S13/00, G01S15/00, G01S17/00
- G01S7/02—Details of systems according to groups G01S13/00, G01S15/00, G01S17/00 of systems according to group G01S13/00
- G01S7/28—Details of pulse systems
- G01S7/285—Receivers
- G01S7/292—Extracting wanted echo-signals
- G01S7/2923—Extracting wanted echo-signals based on data belonging to a number of consecutive radar periods
-
- G—PHYSICS
- G01—MEASURING; TESTING
- G01S—RADIO DIRECTION-FINDING; RADIO NAVIGATION; DETERMINING DISTANCE OR VELOCITY BY USE OF RADIO WAVES; LOCATING OR PRESENCE-DETECTING BY USE OF THE REFLECTION OR RERADIATION OF RADIO WAVES; ANALOGOUS ARRANGEMENTS USING OTHER WAVES
- G01S7/00—Details of systems according to groups G01S13/00, G01S15/00, G01S17/00
- G01S7/02—Details of systems according to groups G01S13/00, G01S15/00, G01S17/00 of systems according to group G01S13/00
- G01S7/41—Details of systems according to groups G01S13/00, G01S15/00, G01S17/00 of systems according to group G01S13/00 using analysis of echo signal for target characterisation; Target signature; Target cross-section
- G01S7/414—Discriminating targets with respect to background clutter
Definitions
- a perception system for a vehicle may rely on a radar system to detect objects that are present in a driving scene (e.g., on a roadway).
- a radar system may detect objects that are present in a driving scene (e.g., on a roadway).
- a driving scene e.g., on a roadway.
- This noise can manifest as false detections reported by the radar system for targets that do not actually exist or actual detections of targets that go undetected by the radar system.
- One way includes executing Constant False Alarm Rate (CFAR) processing techniques in which a power threshold being applied to radar detections adjusts to be above estimated noise levels for an operating environment.
- CFAR allows returns that probably originate from actual targets to be reported and returns from other sources in the environment to be suppressed.
- noise appears at known inference levels, however, in reality, environmental noise can manifest as highly attenable and unpredictable signals that are nonuniform in time and space, which makes tuning the CFAR
- a system includes a processor configured to obtain multiple samples of radar returns including noise reflecting from an environment outside a vehicle.
- the processor is further configured to maintain an array (e.g., a data cube) of the samples including each of the samples in a different, corresponding cell of the array, and for each of the samples, determine a respective constant false alarm rate (CFAR) threshold for filtering the noise from the corresponding cell of the array.
- an array e.g., a data cube
- CFAR constant false alarm rate
- the processor is configured to determine the CFAR threshold by: determining a group of neighbor cells to the corresponding cell to use as training cells, generating a histogram that organizes the samples of the training cells into columns representing successive ranges of amplitude for the samples of the training cells, fitting the histogram to a noise distribution function, and determining the respective CFAR threshold for the corresponding cell from the noise distribution function that is fitted to the histogram for that corresponding cell.
- the processor is further configured to filter the samples from the array that do not satisfy the respective CFAR threshold for the corresponding cell, and in some examples, responsive to filtering the samples from the array, output the array for use by a vehicle function in detecting objects that appear in the environment.
- a computer-readable media includes instructions that when executed by a processor, configure the processor to perform these methods.
- Systems are also contemplated by this disclosure including means for performing these methods.
- a vehicle may include a multiple-Input-Multiple-Output (MIMO) radar system to generate a three-dimensional data cube of radar results derived from processing multiple samples of individual radar chirps, which are transmitted on multiple channels.
- MIMO multiple-Input-Multiple-Output
- a new data cube can be stored in memory as a one-dimensional array; each cell is individually addressable using a unique combination of parameters that are indicative of range bin, chirp identity, and channel.
- Range processing phase fills the data cube with range Fast Fourier Transform (FFT) results for successive chirps by addressing rows of the cells. By addressing columns of the cells, Doppler processing retrieves the range FFT results for successive ranges.
- FFT range Fast Fourier Transform
- a valid detection in a cell or bin of a data cube may be surrounded by ambient noise.
- the ambient noise in an environment is constantly changing. False alarms or false detections can be reported when the ambient noise (e.g., its power) is at levels that mask valid detections.
- a radar is set to operate with a low false alarm rate.
- a threshold can be used to separate the noise from the valid detection.
- a set of techniques may be used to adaptively set the threshold to maintain a Constant False Alarm Rate (CFAR) for various scenarios.
- CFAR processing techniques can be applied before or after either range processing or Doppler processing occurs.
- CFAR processing techniques include Cell-Averaging CFAR and Ordered Statistic CFAR.
- Cell-Averaging CFAR and Ordered-Statistic CFAR a radar system checks for the presence of actual targets based on noise power estimates taken from neighboring (e.g., leading and lagging) cells or range-bins.
- Cell-Averaging CFAR sets a detection threshold to an average (e.g., mean) of power estimates (or a factor thereof) of neighboring cells. If a cell exceeds an average power detection threshold, then that cell records a target detection.
- Cell-Averaging CFAR can have accurate and stable performance when two conditions are met.
- a first condition is that each true target is isolated from the other true targets (e.g., each target is a standalone target) otherwise Cell-Averaging CFAR provides inaccurate results.
- Two targets are not standalone if they are continuously aligned with each other either in range or Doppler domains.
- the neighbor cells sampled to estimate the noise power are assumed to be independently and identically distributed. When neighbor samples are influenced by noise, this influence can inaccurately bias the averaging calculation.
- Ordered-Statistic CFAR improves on Cell-Averaging CFAR to address common, multiple target scenarios.
- Ordered-Statistics CFAR also analyzes the noise power from neighboring bins. However, rather than consider a mean of the noise power, an amplitude of power at each neighboring cell or bin is ranked in order. The cell with the highest power is chosen and a noise threshold set accordingly.
- Ordered-Statistic CFAR is not conditioned on a homogeneous clutter for each standalone target; however, an excessive false alarm rate can arise at the edges of the clutters. Adjusting which cells to includes among neighbors can have varying degrees on performance.
- Choosing a quantity of neighboring cells to rank may depend greatly on driving conditions and sources of noise in an environment. Environments are constantly changing in vehicle applications; it may be challenging to adapt the neighbor sample size for Ordered-Statistics CFAR to accommodate fluctuating conditions. Compared with cell-averaging, improved accuracy of Ordered-Statistics CFAR may be outweighed by its increase in processing complexity (e.g., a sorting function), which requires faster and typically more expensive computing resources, which limits use of Ordered-Statistics CFAR to more costly radar applications.
- processing complexity e.g., a sorting function
- a main drawback of widely used CFAR techniques is that they cannot adapt to estimate noise thresholds for different measurement environments. For example, in automotive radar applications, a host vehicle may drive in an open street at one time, and then quickly switch to driving on a highway with a guardrail on one or both sides. A noise or clutter model used to estimate the noise in these two different scenarios should behave differently to address the presence or absence of the guard rail.
- neither Ordered-Statistics or Cell-Averaging CFAR can provide a noise model that obtains a correct result for both situations; instead, one is handled better than the other.
- this document describes distribution fitting CFAR techniques for radar detections.
- Noise data in cells or bins around a target cell are fit to a noise distribution model, such as a Rayleigh distribution model.
- a noise distribution curve obtained from the distribution model, a CFAR threshold for that cell along the curve can be determined.
- a quantile function of the noise distribution model for a bin or cell provides the CFAR threshold to use for that bin or cell.
- Distribution fitting CFAR enables a more-accurate CFAR threshold to be set for each bin or cell and may use far fewer computing resources than Ordered-Statistics CFAR.
- a radar detector can better prevent false alarm detections across multiple different driving scenarios by adapting to different environments and dynamically changing the noise distribution curve used depending on best-fit analysis by a noise distribution model of noise characteristics of the neighboring bins or cells.
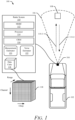
- FIG. 1 illustrates a conceptual diagram of an example environment 100 for performing distribution fitting CFAR detection, in accordance with the described techniques.
- the environment 100 includes a vehicle 102 including a radar system 104.
- the radar system 104 enables other systems of the vehicle 102 (not shown for simplicity in the drawings) to detect an object 108, which can impact how or whether the vehicle 102 can continue to travel.
- the depicted environment 100 includes the vehicle 102 traveling on a roadway.
- the vehicle 102 can represent other types of motorized vehicles (e.g., a car, motorcycle, bus, tractor, semi-trailer truck), non-motorized vehicles (e.g., a bicycle), railed vehicles (e.g., a train), watercraft (e.g., a boat), aircraft (e.g., an airplane), spacecraft (e.g., satellite), and the like.
- motorized vehicles e.g., a car, motorcycle, bus, tractor, semi-trailer truck
- non-motorized vehicles e.g., a bicycle
- railed vehicles e.g., a train
- watercraft e.g., a boat
- aircraft e.g., an airplane
- spacecraft e.g., satellite
- the radar system 104 has a region of interest associated with the radar system 104, which at least partially surrounds the vehicle 102. This region of interest is referred to as a field of view 106 (also referred to as an instrumented field of view).
- the radar system 104 can transmit radar signals 110-1 into the field of view 106 and process radar returns 110-2 that reflect back from the environment 100 to determine the position, angle, range-rate, or other characteristics of the object 108 relative a position and orientation of the vehicle 102. Careful selection and/or positioning of components of the radar system 104 may cause the field of view 106 to have a particular shape or size.
- Components of the radar system 104 can be installed on, mounted to, or integrated with any part of the vehicle 102, such as in a front, back, top, bottom, or side portion of the vehicle 102, a bumper, a side mirror, part of a headlight and/or taillight, or at any other interior or exterior location of the vehicle 102.
- the vehicle 102 includes other vehicle systems that are operatively and/or communicatively coupled to the radar system 104 using wired and/or wireless links that act as interconnections, paths, or busses for vehicle inter-component communications. These other vehicle systems use outputs from the radar system 104 to perform vehicle-based functions, which in addition to other functions may include functions for vehicle control. Any conceivable device, apparatus, assembly, module, component, subsystem, routine, circuit, processor, controller, or the like, can be configured as a vehicle system that uses radar data to act on behalf of the vehicle 102.
- the other vehicle systems may include a system for autonomous control, a system for safety, a system for localization, a system for vehicle-to-vehicle communication, a system for use as an occupant interface, and a system for use as a radar or multi-sensor tracker.
- the radar system 104 includes a monolithic microwave integrated circuit (MMIC) 112, a processor 114, and a computer-readable media (CRM) 116.
- MMIC monolithic microwave integrated circuit
- processor 114 is operatively coupled to an interface of a multiple-input-multiple-output (MIMO) array (not shown).
- MIMO multiple-input-multiple-output
- the MMIC 112, the processor 114, and/or the CRM 116 may be operatively and/or communicatively coupled via wired or wireless links (not shown), and may be part of a radar chip, which may be referred to as a system on chip.
- Other devices, antennas, and other radar components may be used by the radar system 104.
- the radar system 104 includes an antenna array, such as a multiple-input-multiple-output (MIMO) array capable of transmitting multiple chirps across a range of frequencies, on multiple channels.
- MIMO multiple-input-multiple-output
- the MMIC 112 accumulates radar data from the MIMO array on behalf of the processor 114.
- the radar data includes information about the position and movement of objects in the field of view 106, such as positions and range-rates of radar detections that reflect off the object 108.
- the MMIC 112 receives instructions from the processor 114 to indicate characteristics (e.g., timing, phase, frequency range, channels) of the radar signals 110-1 and their corresponding reflections, i.e., the radar returns 110-2.
- the MMIC 112 causes the radar signals 110-1 to be transmitted via the MIMO array and into the environment 100 and then, causes the radar returns 110-2 to be detected and received.
- the processor 114 processes the radar data generated by the MMIC 112, and outputs the processed radar data into a data structure (e.g., one-dimensional array; multiple-dimension array) usable by the other vehicle systems of the vehicle 102.
- a data cube 118 is an example of processed radar data generated by the processor 114 from radar data obtained by the MMIC 112.
- the data cube 118 is generated from performing distribution fitting CFAR detection, in accordance with the techniques of this disclosure. Any single or multiple dimension data structure can be used; the data cube 118 is only one example of a suitable format for conveying information about the radar returns 110-2, for enabling distribution fitting CFAR detection.
- the processor 114 may include a hardware accelerator, a controller, a control circuit, a microprocessor, its own chip, its own system, its own system-on-chip, a device, a processing unit, a digital signal processing unit, a graphics processing unit, or a central processing unit.
- the processor 114 may include multiple processors or cores, embedded memory storing executable software or firmware, internal/dedicated/secure cache or any other computer element that enables the processor 114 to execute machine-readable instructions for generating radar outputs.
- At least the CRM 116 and the processor 114 are a single component, such as an embedded system or system on chip. At least a portion of the CRM 116 is configured as a dedicated storage for the processor 114.
- the CRM 116 may include portions of storage (e.g., memory) reserved by the processor 114 to maintain the data cube 118 before or after performing distribution fitting CFAR. Access to the CRM 116 may be shared by other components of the radar system 104.
- the CRM 116 may also store machine-readable instructions for executing radar operations. As two examples, the CRM 116 stores instructions for executing radar functions performed by a measurement estimator 120 and a noise estimator 122.
- the measurement estimator 120 is configured to estimate and store values for detections, including range, Doppler, and/or angle. It should be understood that distribution fitting CFAR techniques can be applied to the radar system 104 regardless of whether the measurement estimator 120 can estimate just one of range, Doppler, and angle, whether the measurement estimator can determine two of range, Doppler, and angle, or whether all three of range, Doppler, and angle can be estimated. With these measurements, the data cube 118 and information derived therefrom (e.g., radar tracks to objects) can be used to enable advanced safety or autonomous driving functions that avoid obstacles at positions and velocities inferred from the data cube 118.
- information derived therefrom e.g., radar tracks to objects
- Information can be communicated within the radar system 104 to enable other functions of other radar system (e.g., object classifying, object tracking), which for simplicity of the drawings are not shown in FIG. 1 . It is also possible that other systems of the vehicle 102 and/or other vehicles and external systems receive information from the radar system 104 (e.g., using vehicle to everything communication networks), including the data cube 118, to enable safe driving by these other vehicles, as well.
- other systems of the vehicle 102 and/or other vehicles and external systems receive information from the radar system 104 (e.g., using vehicle to everything communication networks), including the data cube 118, to enable safe driving by these other vehicles, as well.
- the noise estimator 122 is configured to filter noise from the data cube 118 to improve its accuracy and eliminate false alarm detections.
- the noise estimator 122 can execute on behalf of the measurement estimator 120, or as a pre-processing or post-processing step. Noise associated with the data cube 118 can be filtered from the data cube 118 at different times in the processing pipeline of the radar system 104.
- the noise estimator 122 can precede or follow execution of the measurement estimator 122.
- the noise estimator 122 can estimate noise at different stages of the measurement estimator 122; this includes determining the noise either before, after, or while the measurement estimator 122 performs range processing, Doppler processing, and/or angle estimating.
- executing the noise estimator 122 earlier may improve throughput of the radar system 104 because the measurement estimator 122 can avoid wasting processing resources (e.g., cycle time of the processor 114, storage capacity of the CRM 116) estimating range, Doppler, or angle for detections that are likely attributed to noise.
- processing resources e.g., cycle time of the processor 114, storage capacity of the CRM 116
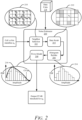
- FIG. 2 illustrates a conceptual diagram of an example noise estimator 200 for a radar system configured to perform distribution fitting CFAR detection, in accordance with the described techniques.
- the noise estimator 200 is an example of the noise estimator 122 and is described in the context of the environment 100 as part of the radar system 104 of the vehicle 102.
- the noise estimator 200 is configured to apply distribution fitting CFAR to each cell or bin of the data cube 118.
- the data cube 118 (or memory location of the data cube 118) is received as input to the noise estimator 200.
- a CFAR threshold for each cell is output for use in filtering noise from the data cube 118. Cells of the data cube 118 that satisfy their respective CFAR thresholds may be processed by the measurement estimator 120, and cells of the data cube 118 that do not can be ignored.
- the noise estimator 200 divides the distribution fitting CFAR check into four stages: calculating noise power, scrubbing potential targets, fitting noise data into distribution models, and determining the CFAR thresholds.
- a neighbor selection component 202 executes the first stage by determining a current cell under test, denoted as x ij , along with its neighboring cells or bins, referred to as training cells 210.
- the training cells 210 are drawn as a two-dimensional matrix, however, the training cells can be organized in a single dimensional array.
- Training cells are chosen by the neighbor selection component 202 to contain noise data with similar statistics as the cell under test x ij .
- a data scrub component 204 performs the next stage of the distribution fitting CFAR check.
- a scrub threshold is computed to remove a first group of the training cells 210 with easily recognizable noise.
- the training cells 210 are subdivided into (e.g., six) equal subgroups containing four different training cells in each.
- a mean of each subgroup is calculated, and a rough noise power, ⁇ r , can be set equal to the smallest mean of all the subgroups.
- ⁇ is a scaling factor that can be chosen by the data scrub component 204 based on experience (e.g., it can change over time to be tuned for a particular application).
- the training cells 210 with amplitude (e.g., power) that is lower than S are saved for further processing, whereas the training cells 210 that do not are immediately treated as noise bins, N bin and may be discarded.
- Training cells 212 are shown including white cells that are saved and shaded cells that are ignored or discarded.
- a histogram builder component 206 generates a histogram graph 214 of the training cells 212 that remain after scrubbing.
- the training cells 212 are grouped into columns N bin of similar amplitude that increases along the x-axis.
- the y-axis of the histogram graph 214 is an estimated Probability Density Function (PDF) for that group.
- PDF Probability Density Function
- their quantity is limited, their existence in the columns N bin may not highly influence the result of the CFAR threshold calculation.
- the noise estimator relies on a fit-to-model component 208 where the histogram graph 214 is fitted to a noise model 216.
- a Rayleigh distribution may be observed when the amplitude of noise is calculated from a complex measurement, which is an uncorrelated, normal distribution with equal variance, and zero mean.
- An offset A may be used to account for non-zero mean noise, as given by Equation 4.
- A ⁇ ⁇ ⁇ ⁇ ⁇ 2
- This offset A is applied to noise samples to account for known sources of noise, such as, DC bias or phase noise, which enables real-world measurements to be taken by accounting for any shift of the PDF of the Rayleigh distribution.
- ⁇ pk ⁇ ⁇ ⁇ ⁇ pk ⁇ 2
- ⁇ is a scaling factor called a threshold factor.
- the threshold factor ⁇ can be used to account for a constant offset from other system parameters, such as for correlation among antenna channels of the radar system 104. With an appropriate value of ⁇ , the CFAR threshold can be output for use in filtering noise from that particular cell of the data cube 118.
- FIG. 3 illustrates a flow diagram of an example process for performing distribution fitting CFAR detection, in accordance with the described techniques.
- the process 300 is described primarily in the context of being performed by the radar systems 104 using the processor 114 with access to the CRM 116.
- the noise estimators 122 and 200 can write to portions of the CRM 116 to write to the data cube 118.
- the noise estimators 122 and 200 can read from portions of the CRM 116 to read from the data cube 118.
- Operations (also referred to as steps) of the process 300 are numbered sequentially. However, this numbering does not necessarily imply a specific order of operations.
- the steps of the process 300 may be rearranged, skipped, repeated, or performed in different ways than the specific way it is shown in the diagram of FIG. 3 .
- multiple samples of radar returns are obtained including noise reflecting from an environment outside a vehicle.
- the radar system 104 obtains the radar returns 110-2 that reflect off the object 108 and other features in the environment 100.
- the radar returns 110-2 include noise among actual target detections.
- an array e.g., a data cube
- an array e.g., a data cube
- the data cube 118 is written to the CRM 116 by the processor 114.
- a respective CFAR threshold for filtering the noise from the corresponding cell of the data cube is determined by executing distribution fitting CFAR techniques (e.g., shown as steps 306-1 to 306-5).
- the noise estimator 122 or the noise estimator 200 reads each cell of the data cube 118 and applies distribution fitting CFAR techniques at each cell to generate the CFAR threshold for that cell.
- a group of neighbor cells to the corresponding cell is determined to use as training cells.
- the noise estimator 200 relies on the neighbor selection component 202 analyzes cells located in nearby range, chirp, or channel domains to identify the training cells 210 that contain noise data with similar statistics as a corresponding cell under test x ij .
- the training cells to the corresponding cell may include cells associated with a same chirp as the corresponding cell and associated with a same range or same channel as the corresponding cell.
- the training cells may be associated with a same channel as the corresponding cell. In other cases, the training cells may be associated with a same range as the corresponding cell.
- the training cells may be scrubbed for high levels of noise prior to the next steps.
- the data scrub component 204 may enable the noise estimator 200 to reduce the quantity of the training cells 210 identified by the neighbor selection component 202 to remove cells with high levels of noise that are not likely to be representative of actual target.
- a histogram is generated that organizes the samples of the training cells into columns representing successive ranges of amplitude for the samples of the training cells.
- the noise estimator 200 uses the histogram builder component 206, which generates the histogram graph 214 of the training cells 212 that remain after scrubbing the training cells 210 originally selected by the neighbor selection component 202.
- the histogram builder component 206 can organize, based on respective amplitudes of the samples of the training cells 212, the samples of the training cells 212 into the columns representing successive ranges of amplitude.
- An amplitude of the columns in the histogram graph 214 corresponds to a PDF of the samples of the training cells 212 that are associated with an amplitude range for that column.
- the histogram is fitted to a noise distribution function.
- the noise distribution function can be a Rayleigh distribution.
- the noise distribution function can be a normal distribution, or other distribution function.
- the noise estimator 200 executes the fit-to-model component 208, which fits the histogram graph 214 to the noise model 216 suited for the environment 100.
- Noise in the environment 100 often changes.
- the noise model 216 used by the noise estimator 200 may also change from one cell under test to a next cell under test (e.g., different noise models may be used for different cells within the data cube 118).
- the Rayleigh distribution function may be chosen for fitting noise for a first cell of the data cube 118 and the normal distribution function may be chosen for a second cell of the data cube 118.
- the noise estimator 200 can fit a first histogram for a first cell of the data cube 118 to a first noise distribution function (e.g., normal) and fit a second histogram for a second cell of the data cube 118 to a second noise distribution function (e.g., Rayleigh, other) that is different than the first noise distribution function.
- a first noise distribution function e.g., normal
- a second histogram for a second cell of the data cube 118 e.g., Rayleigh, other
- the respective CFAR threshold for the corresponding cell is determined from the noise distribution function that is fitted to the histogram for that corresponding cell.
- the CFAR threshold for that cell under test can be determined by the noise estimator 200 from correlating a value on a curve defined by the noise model 216 fitted to the cell under test.
- the samples are filtered from the data cube that do not satisfy the respective CFAR threshold for the corresponding cell.
- each of the cells of the data cube 118 is filtered by the processor 114 using its respective CFAR threshold to eliminate false detections that appear because of noise in the environment 100, which changes (e.g., unpredictably).
- the data cube is output for use by a vehicle function in detecting objects that appear in the environment.
- the processor 114 outputs an indication of the data cube 118 for enabling other systems of the vehicle 102, or systems external to the vehicle 102, to track objects in the field of view 106 of the radar system 104.
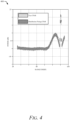
- FIG. 4 illustrates a line graph 400 comparing performance of distribution fitting CFAR detection compared to ground truth.
- the line graph 400 shows results collected from a test chamber in which a single target is located at range bin one hundred forty. Because the power of the return signal is so high, the phase noise creates a hump in the graph 400 between range indices one hundred and one hundred forty. Hundreds of frames are recorded for each range index during the measurement, and each frame contains hundreds of samples. In total, hundreds of thousands of samples are collected in each index, from which an actual CFAR threshold level can be estimated for a given range index. Unlike true CFAR thresholding, distribution fitting CFAR is calculated based on data from a single frame of each range index, which leads to a cloud-like appearance in the graph 400. From the graph 400, it can be observed that a center of the distribution fitting CFAR point cloud is aligned with true CFAR with only a small amount of deviation.
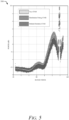
- FIG. 5 illustrates a line graph 500 comparing performance of distribution fitting CFAR detection compared to Ordered-Statistics CFAR detection.
- FIG. 6 illustrates a line graph 600 comparing performance of distribution fitting CFAR detection compared to Cell-Averaging CFAR detection.
- distribution fitting CFAR can provide an accurate CFAR threshold even when a noise distribution changes.
- range indices between forty and sixty all the CFAR algorithms can provide a good CFAR threshold estimation.
- "at least one of: a, b, or c” is intended to cover a, b, c, a-b, a-c, b-c, and a-b-c, as well as any combination with multiples of the same element (e.g., a-a, a-a-a, a-a-b, a-a-c, a-b-b, a-c-c, b-b, b-b-b, b-b-c, c-c, and c-c-c or any other ordering of a, b, and c).
Landscapes
- Engineering & Computer Science (AREA)
- Radar, Positioning & Navigation (AREA)
- Remote Sensing (AREA)
- Computer Networks & Wireless Communication (AREA)
- Physics & Mathematics (AREA)
- General Physics & Mathematics (AREA)
- Radar Systems Or Details Thereof (AREA)
- Artificial Intelligence (AREA)
- Evolutionary Computation (AREA)
Abstract
Description
- A perception system for a vehicle (e.g., advanced safety or automated driving system) may rely on a radar system to detect objects that are present in a driving scene (e.g., on a roadway). There can be interference caused by other vehicle systems or unknown sources in the environment; if untreated, this noise can manifest as false detections reported by the radar system for targets that do not actually exist or actual detections of targets that go undetected by the radar system. There are multiple ways to lower a radar false alarm rate. One way includes executing Constant False Alarm Rate (CFAR) processing techniques in which a power threshold being applied to radar detections adjusts to be above estimated noise levels for an operating environment. CFAR allows returns that probably originate from actual targets to be reported and returns from other sources in the environment to be suppressed. In an ideal case, noise appears at known inference levels, however, in reality, environmental noise can manifest as highly attenable and unpredictable signals that are nonuniform in time and space, which makes tuning the CFAR power threshold for changing driving scenarios to be a challenge.
- This document describes techniques and systems for distribution fitting CFAR detection. This Summary is not intended to identify essential features of the claimed subject matter, nor is it intended for use in determining the scope of the claimed subject matter.
- In one example, a system includes a processor configured to obtain multiple samples of radar returns including noise reflecting from an environment outside a vehicle. The processor is further configured to maintain an array (e.g., a data cube) of the samples including each of the samples in a different, corresponding cell of the array, and for each of the samples, determine a respective constant false alarm rate (CFAR) threshold for filtering the noise from the corresponding cell of the array. The processor is configured to determine the CFAR threshold by: determining a group of neighbor cells to the corresponding cell to use as training cells, generating a histogram that organizes the samples of the training cells into columns representing successive ranges of amplitude for the samples of the training cells, fitting the histogram to a noise distribution function, and determining the respective CFAR threshold for the corresponding cell from the noise distribution function that is fitted to the histogram for that corresponding cell. The processor is further configured to filter the samples from the array that do not satisfy the respective CFAR threshold for the corresponding cell, and in some examples, responsive to filtering the samples from the array, output the array for use by a vehicle function in detecting objects that appear in the environment.
- In addition to this and other examples, methods are described for performing distribution fitting CFAR detection. In some cases, a computer-readable media (CRM) includes instructions that when executed by a processor, configure the processor to perform these methods. Systems are also contemplated by this disclosure including means for performing these methods. Through implementation of these and other examples contemplated by this disclosure, distribution fitting CFAR detection can be achieved to discern actual targets from noise in a radar signal more accurately than from using other CFAR detection techniques.
- The details for distribution fitting CFAR detection are described in this document with reference to the Drawings that may use same numbers to reference like features and components, and hyphenated numbers to designate variations of these like features and components. The Drawings are organized as follows:
-
FIG. 1 illustrates a conceptual diagram of an example environment for performing distribution fitting CFAR detection, in accordance with the described techniques; -
FIG. 2 illustrates a conceptual diagram of an example noise estimator for a radar system configured to perform distribution fitting CFAR detection, in accordance with the described techniques; -
FIG. 3 illustrates a flow diagram of an example process for performing distribution fitting CFAR detection, , in accordance with the described techniques; -
FIG. 4 illustrates a line graph comparing performance of distribution fitting CFAR detection compared to ground truth; -
FIG. 5 illustrates a line graph comparing performance of distribution fitting CFAR detection compared to Ordered-Statistics CFAR detection; and -
FIG. 6 illustrates a line graph comparing performance of distribution fitting CFAR detection compared to Cell-Averaging CFAR detection. - A vehicle may include a multiple-Input-Multiple-Output (MIMO) radar system to generate a three-dimensional data cube of radar results derived from processing multiple samples of individual radar chirps, which are transmitted on multiple channels. For each look period, a new data cube can be stored in memory as a one-dimensional array; each cell is individually addressable using a unique combination of parameters that are indicative of range bin, chirp identity, and channel. Range processing phase fills the data cube with range Fast Fourier Transform (FFT) results for successive chirps by addressing rows of the cells. By addressing columns of the cells, Doppler processing retrieves the range FFT results for successive ranges.
- In radar systems, a valid detection in a cell or bin of a data cube may be surrounded by ambient noise. The ambient noise in an environment is constantly changing. False alarms or false detections can be reported when the ambient noise (e.g., its power) is at levels that mask valid detections. To improve the accuracy of target detections and functionality of vehicle systems that rely on radar data, a radar is set to operate with a low false alarm rate. A threshold can be used to separate the noise from the valid detection. A set of techniques may be used to adaptively set the threshold to maintain a Constant False Alarm Rate (CFAR) for various scenarios. CFAR processing techniques can be applied before or after either range processing or Doppler processing occurs. Due to their simplicity and robustness, two of the most common CFAR processing techniques include Cell-Averaging CFAR and Ordered Statistic CFAR. In both Cell-Averaging CFAR and Ordered-Statistic CFAR, a radar system checks for the presence of actual targets based on noise power estimates taken from neighboring (e.g., leading and lagging) cells or range-bins.
- Cell-Averaging CFAR sets a detection threshold to an average (e.g., mean) of power estimates (or a factor thereof) of neighboring cells. If a cell exceeds an average power detection threshold, then that cell records a target detection. Cell-Averaging CFAR can have accurate and stable performance when two conditions are met. A first condition is that each true target is isolated from the other true targets (e.g., each target is a standalone target) otherwise Cell-Averaging CFAR provides inaccurate results. Two targets are not standalone if they are continuously aligned with each other either in range or Doppler domains. Second, the neighbor cells sampled to estimate the noise power are assumed to be independently and identically distributed. When neighbor samples are influenced by noise, this influence can inaccurately bias the averaging calculation.
- Ordered-Statistic CFAR improves on Cell-Averaging CFAR to address common, multiple target scenarios. Ordered-Statistics CFAR also analyzes the noise power from neighboring bins. However, rather than consider a mean of the noise power, an amplitude of power at each neighboring cell or bin is ranked in order. The cell with the highest power is chosen and a noise threshold set accordingly. Unlike Cell-Averaging CFAR, Ordered-Statistic CFAR is not conditioned on a homogeneous clutter for each standalone target; however, an excessive false alarm rate can arise at the edges of the clutters. Adjusting which cells to includes among neighbors can have varying degrees on performance. Choosing a quantity of neighboring cells to rank may depend greatly on driving conditions and sources of noise in an environment. Environments are constantly changing in vehicle applications; it may be challenging to adapt the neighbor sample size for Ordered-Statistics CFAR to accommodate fluctuating conditions. Compared with cell-averaging, improved accuracy of Ordered-Statistics CFAR may be outweighed by its increase in processing complexity (e.g., a sorting function), which requires faster and typically more expensive computing resources, which limits use of Ordered-Statistics CFAR to more costly radar applications.
- A main drawback of widely used CFAR techniques is that they cannot adapt to estimate noise thresholds for different measurement environments. For example, in automotive radar applications, a host vehicle may drive in an open street at one time, and then quickly switch to driving on a highway with a guardrail on one or both sides. A noise or clutter model used to estimate the noise in these two different scenarios should behave differently to address the presence or absence of the guard rail. However, neither Ordered-Statistics or Cell-Averaging CFAR can provide a noise model that obtains a correct result for both situations; instead, one is handled better than the other.
- In contrast to existing CFAR techniques, this document describes distribution fitting CFAR techniques for radar detections. Noise data in cells or bins around a target cell are fit to a noise distribution model, such as a Rayleigh distribution model. With a suitable noise distribution curve obtained from the distribution model, a CFAR threshold for that cell along the curve can be determined. A quantile function of the noise distribution model for a bin or cell provides the CFAR threshold to use for that bin or cell. Distribution fitting CFAR enables a more-accurate CFAR threshold to be set for each bin or cell and may use far fewer computing resources than Ordered-Statistics CFAR. A radar detector can better prevent false alarm detections across multiple different driving scenarios by adapting to different environments and dynamically changing the noise distribution curve used depending on best-fit analysis by a noise distribution model of noise characteristics of the neighboring bins or cells.
-
FIG. 1 illustrates a conceptual diagram of anexample environment 100 for performing distribution fitting CFAR detection, in accordance with the described techniques. Theenvironment 100 includes avehicle 102 including aradar system 104. Theradar system 104 enables other systems of the vehicle 102 (not shown for simplicity in the drawings) to detect anobject 108, which can impact how or whether thevehicle 102 can continue to travel. - The depicted
environment 100 includes thevehicle 102 traveling on a roadway. Although illustrated as a passenger truck, thevehicle 102 can represent other types of motorized vehicles (e.g., a car, motorcycle, bus, tractor, semi-trailer truck), non-motorized vehicles (e.g., a bicycle), railed vehicles (e.g., a train), watercraft (e.g., a boat), aircraft (e.g., an airplane), spacecraft (e.g., satellite), and the like. - The
radar system 104 has a region of interest associated with theradar system 104, which at least partially surrounds thevehicle 102. This region of interest is referred to as a field of view 106 (also referred to as an instrumented field of view). Theradar system 104 can transmit radar signals 110-1 into the field ofview 106 and process radar returns 110-2 that reflect back from theenvironment 100 to determine the position, angle, range-rate, or other characteristics of theobject 108 relative a position and orientation of thevehicle 102. Careful selection and/or positioning of components of theradar system 104 may cause the field ofview 106 to have a particular shape or size. Components of theradar system 104 can be installed on, mounted to, or integrated with any part of thevehicle 102, such as in a front, back, top, bottom, or side portion of thevehicle 102, a bumper, a side mirror, part of a headlight and/or taillight, or at any other interior or exterior location of thevehicle 102. - As previously suggested, the
vehicle 102 includes other vehicle systems that are operatively and/or communicatively coupled to theradar system 104 using wired and/or wireless links that act as interconnections, paths, or busses for vehicle inter-component communications. These other vehicle systems use outputs from theradar system 104 to perform vehicle-based functions, which in addition to other functions may include functions for vehicle control. Any conceivable device, apparatus, assembly, module, component, subsystem, routine, circuit, processor, controller, or the like, can be configured as a vehicle system that uses radar data to act on behalf of thevehicle 102. As some nonlimiting examples, the other vehicle systems may include a system for autonomous control, a system for safety, a system for localization, a system for vehicle-to-vehicle communication, a system for use as an occupant interface, and a system for use as a radar or multi-sensor tracker. - The
radar system 104 includes a monolithic microwave integrated circuit (MMIC) 112, aprocessor 114, and a computer-readable media (CRM) 116. Through theMMIC 112, theprocessor 114 is operatively coupled to an interface of a multiple-input-multiple-output (MIMO) array (not shown). TheMMIC 112, theprocessor 114, and/or theCRM 116 may be operatively and/or communicatively coupled via wired or wireless links (not shown), and may be part of a radar chip, which may be referred to as a system on chip. Other devices, antennas, and other radar components may be used by theradar system 104. Theradar system 104 includes an antenna array, such as a multiple-input-multiple-output (MIMO) array capable of transmitting multiple chirps across a range of frequencies, on multiple channels. - The
MMIC 112 accumulates radar data from the MIMO array on behalf of theprocessor 114. The radar data includes information about the position and movement of objects in the field ofview 106, such as positions and range-rates of radar detections that reflect off theobject 108. TheMMIC 112 receives instructions from theprocessor 114 to indicate characteristics (e.g., timing, phase, frequency range, channels) of the radar signals 110-1 and their corresponding reflections, i.e., the radar returns 110-2. TheMMIC 112 causes the radar signals 110-1 to be transmitted via the MIMO array and into theenvironment 100 and then, causes the radar returns 110-2 to be detected and received. - The
processor 114 processes the radar data generated by theMMIC 112, and outputs the processed radar data into a data structure (e.g., one-dimensional array; multiple-dimension array) usable by the other vehicle systems of thevehicle 102. Adata cube 118 is an example of processed radar data generated by theprocessor 114 from radar data obtained by theMMIC 112. Thedata cube 118 is generated from performing distribution fitting CFAR detection, in accordance with the techniques of this disclosure. Any single or multiple dimension data structure can be used; thedata cube 118 is only one example of a suitable format for conveying information about the radar returns 110-2, for enabling distribution fitting CFAR detection. Theprocessor 114 may include a hardware accelerator, a controller, a control circuit, a microprocessor, its own chip, its own system, its own system-on-chip, a device, a processing unit, a digital signal processing unit, a graphics processing unit, or a central processing unit. Theprocessor 114 may include multiple processors or cores, embedded memory storing executable software or firmware, internal/dedicated/secure cache or any other computer element that enables theprocessor 114 to execute machine-readable instructions for generating radar outputs. - In some examples, at least the
CRM 116 and theprocessor 114 are a single component, such as an embedded system or system on chip. At least a portion of theCRM 116 is configured as a dedicated storage for theprocessor 114. TheCRM 116 may include portions of storage (e.g., memory) reserved by theprocessor 114 to maintain thedata cube 118 before or after performing distribution fitting CFAR. Access to theCRM 116 may be shared by other components of theradar system 104. TheCRM 116 may also store machine-readable instructions for executing radar operations. As two examples, theCRM 116 stores instructions for executing radar functions performed by ameasurement estimator 120 and anoise estimator 122. - The
measurement estimator 120 is configured to estimate and store values for detections, including range, Doppler, and/or angle. It should be understood that distribution fitting CFAR techniques can be applied to theradar system 104 regardless of whether themeasurement estimator 120 can estimate just one of range, Doppler, and angle, whether the measurement estimator can determine two of range, Doppler, and angle, or whether all three of range, Doppler, and angle can be estimated. With these measurements, thedata cube 118 and information derived therefrom (e.g., radar tracks to objects) can be used to enable advanced safety or autonomous driving functions that avoid obstacles at positions and velocities inferred from thedata cube 118. Information, including thedata cube 118, can be communicated within theradar system 104 to enable other functions of other radar system (e.g., object classifying, object tracking), which for simplicity of the drawings are not shown inFIG. 1 . It is also possible that other systems of thevehicle 102 and/or other vehicles and external systems receive information from the radar system 104 (e.g., using vehicle to everything communication networks), including thedata cube 118, to enable safe driving by these other vehicles, as well. - The
noise estimator 122 is configured to filter noise from thedata cube 118 to improve its accuracy and eliminate false alarm detections. Thenoise estimator 122 can execute on behalf of themeasurement estimator 120, or as a pre-processing or post-processing step. Noise associated with thedata cube 118 can be filtered from thedata cube 118 at different times in the processing pipeline of theradar system 104. Thenoise estimator 122 can precede or follow execution of themeasurement estimator 122. Thenoise estimator 122 can estimate noise at different stages of themeasurement estimator 122; this includes determining the noise either before, after, or while themeasurement estimator 122 performs range processing, Doppler processing, and/or angle estimating. Although, executing thenoise estimator 122 earlier may improve throughput of theradar system 104 because themeasurement estimator 122 can avoid wasting processing resources (e.g., cycle time of theprocessor 114, storage capacity of the CRM 116) estimating range, Doppler, or angle for detections that are likely attributed to noise. -
FIG. 2 illustrates a conceptual diagram of anexample noise estimator 200 for a radar system configured to perform distribution fitting CFAR detection, in accordance with the described techniques. Thenoise estimator 200 is an example of thenoise estimator 122 and is described in the context of theenvironment 100 as part of theradar system 104 of thevehicle 102. - The
noise estimator 200 is configured to apply distribution fitting CFAR to each cell or bin of thedata cube 118. The data cube 118 (or memory location of the data cube 118) is received as input to thenoise estimator 200. A CFAR threshold for each cell is output for use in filtering noise from thedata cube 118. Cells of thedata cube 118 that satisfy their respective CFAR thresholds may be processed by themeasurement estimator 120, and cells of thedata cube 118 that do not can be ignored. In the example shown inFIG. 2 , thenoise estimator 200 divides the distribution fitting CFAR check into four stages: calculating noise power, scrubbing potential targets, fitting noise data into distribution models, and determining the CFAR thresholds. - A
neighbor selection component 202 executes the first stage by determining a current cell under test, denoted as xij, along with its neighboring cells or bins, referred to astraining cells 210. In this example, thetraining cells 210 are drawn as a two-dimensional matrix, however, the training cells can be organized in a single dimensional array. Training cells are chosen by theneighbor selection component 202 to contain noise data with similar statistics as the cell under test xij. - A
data scrub component 204 performs the next stage of the distribution fitting CFAR check. A scrub threshold is computed to remove a first group of thetraining cells 210 with easily recognizable noise. For example, thetraining cells 210 are subdivided into (e.g., six) equal subgroups containing four different training cells in each. A mean of each subgroup is calculated, and a rough noise power, σr , can be set equal to the smallest mean of all the subgroups. Then, the scrub-threshold for the cell under test xij may be determined by solving for S using Equation 1:
- In the Equation 1, β is a scaling factor that can be chosen by the
data scrub component 204 based on experience (e.g., it can change over time to be tuned for a particular application). During the scrubbing phase of the distributed fitting CFAR check, thetraining cells 210 with amplitude (e.g., power) that is lower than S are saved for further processing, whereas thetraining cells 210 that do not are immediately treated as noise bins, Nbin and may be discarded.Training cells 212 are shown including white cells that are saved and shaded cells that are ignored or discarded. - A
histogram builder component 206 generates ahistogram graph 214 of thetraining cells 212 that remain after scrubbing. Thetraining cells 212 are grouped into columns Nbin of similar amplitude that increases along the x-axis. The y-axis of thehistogram graph 214 is an estimated Probability Density Function (PDF) for that group. In some cases, there may be trainingcells 212 with amplitude lower than S that are saved in the columns Nbin. However, because their quantity is limited, their existence in the columns Nbin may not highly influence the result of the CFAR threshold calculation. - At the fourth stage, the noise estimator relies on a fit-to-
model component 208 where thehistogram graph 214 is fitted to anoise model 216. For example, a Rayleigh distribution may be observed when the amplitude of noise is calculated from a complex measurement, which is an uncorrelated, normal distribution with equal variance, and zero mean. - As a practical example, to determine the CFAR threshold efficiently, a mean of a Rayleigh random variable can be determined from Equation 2:


- An offset A may be used to account for non-zero mean noise, as given by Equation 4.

- Another way to account for this shifting is to use a peak of a Rayleigh distribution scale parameter σpk can be calculated from determining a peak of the
histogram graph 214, which is a maximum PDF of a Rayleigh distribution ƒmax, as provided by Equation 5:
Equation 5, fmax is the peak of thehistogram graph 214. Then, a second scale parameter, a peak Rayleigh distribution scale parameter σpk , can be calculated from Equation 6:


- Finally, the fit-to-
model component 208 can generate the CFAR threshold Tij for the current cell under test xij using Equation 9:
- In Equation 9, α is a scaling factor called a threshold factor. The threshold factor α can be used to account for a constant offset from other system parameters, such as for correlation among antenna channels of the
radar system 104. With an appropriate value of α, the CFAR threshold can be output for use in filtering noise from that particular cell of thedata cube 118. - In the above example, ambient noise is assumed to follows a Rayleigh distribution. Distribution fitting CFAR can be applied to cases where the noise follows other distributions, besides just the Rayleigh distribution. Where another distribution better models variable noise, such as a normal distribution, distribution fitting CFAR can be used too. The peak of the
histogram graph 214 and its mean can be used to find all parameters for the distribution quantile function. For example, the quantile function of the normal distribution is provided by Equation 10:
- In
Equation 10, the mean µ can be directly calculated from the noise samples, and the standard deviation σ can be calculated based on Equation 11:

-
FIG. 3 illustrates a flow diagram of an example process for performing distribution fitting CFAR detection, in accordance with the described techniques. For ease of description, theprocess 300 is described primarily in the context of being performed by theradar systems 104 using theprocessor 114 with access to theCRM 116. For example, thenoise estimators CRM 116 to write to thedata cube 118. Thenoise estimators CRM 116 to read from thedata cube 118. Operations (also referred to as steps) of theprocess 300 are numbered sequentially. However, this numbering does not necessarily imply a specific order of operations. The steps of theprocess 300 may be rearranged, skipped, repeated, or performed in different ways than the specific way it is shown in the diagram ofFIG. 3 . - At
step 302, multiple samples of radar returns are obtained including noise reflecting from an environment outside a vehicle. For example, theradar system 104 obtains the radar returns 110-2 that reflect off theobject 108 and other features in theenvironment 100. The radar returns 110-2 include noise among actual target detections. - At
step 304, an array (e.g., a data cube) of the samples is maintained including each of the samples in a different, corresponding cell of the array. For example, thedata cube 118 is written to theCRM 116 by theprocessor 114. - At
step 306, for each of the samples, a respective CFAR threshold for filtering the noise from the corresponding cell of the data cube is determined by executing distribution fitting CFAR techniques (e.g., shown as steps 306-1 to 306-5). For example, thenoise estimator 122 or thenoise estimator 200 reads each cell of thedata cube 118 and applies distribution fitting CFAR techniques at each cell to generate the CFAR threshold for that cell. - At step 306-1, a group of neighbor cells to the corresponding cell is determined to use as training cells. For example, the
noise estimator 200 relies on theneighbor selection component 202 analyzes cells located in nearby range, chirp, or channel domains to identify thetraining cells 210 that contain noise data with similar statistics as a corresponding cell under test xij. The training cells to the corresponding cell may include cells associated with a same chirp as the corresponding cell and associated with a same range or same channel as the corresponding cell. The training cells may be associated with a same channel as the corresponding cell. In other cases, the training cells may be associated with a same range as the corresponding cell. - At step 306-2, the training cells may be scrubbed for high levels of noise prior to the next steps. For example, the
data scrub component 204 may enable thenoise estimator 200 to reduce the quantity of thetraining cells 210 identified by theneighbor selection component 202 to remove cells with high levels of noise that are not likely to be representative of actual target. - At step 306-3, a histogram is generated that organizes the samples of the training cells into columns representing successive ranges of amplitude for the samples of the training cells. For instance, the
noise estimator 200 uses thehistogram builder component 206, which generates thehistogram graph 214 of thetraining cells 212 that remain after scrubbing thetraining cells 210 originally selected by theneighbor selection component 202. Thehistogram builder component 206 can organize, based on respective amplitudes of the samples of thetraining cells 212, the samples of thetraining cells 212 into the columns representing successive ranges of amplitude. An amplitude of the columns in thehistogram graph 214 corresponds to a PDF of the samples of thetraining cells 212 that are associated with an amplitude range for that column. - At step 306-4, the histogram is fitted to a noise distribution function. For example, the noise distribution function can be a Rayleigh distribution. The noise distribution function can be a normal distribution, or other distribution function. The
noise estimator 200 executes the fit-to-model component 208, which fits thehistogram graph 214 to thenoise model 216 suited for theenvironment 100. - Noise in the
environment 100 often changes. To adapt to the changing noise in theenvironment 100, thenoise model 216 used by thenoise estimator 200 may also change from one cell under test to a next cell under test (e.g., different noise models may be used for different cells within the data cube 118). For example, the Rayleigh distribution function may be chosen for fitting noise for a first cell of thedata cube 118 and the normal distribution function may be chosen for a second cell of thedata cube 118. Said differently, thenoise estimator 200 can fit a first histogram for a first cell of thedata cube 118 to a first noise distribution function (e.g., normal) and fit a second histogram for a second cell of thedata cube 118 to a second noise distribution function (e.g., Rayleigh, other) that is different than the first noise distribution function. - At step 306-5, the respective CFAR threshold for the corresponding cell is determined from the noise distribution function that is fitted to the histogram for that corresponding cell. For example, with the
noise model 216 fit to thehistogram graph 214, the CFAR threshold for that cell under test can be determined by thenoise estimator 200 from correlating a value on a curve defined by thenoise model 216 fitted to the cell under test. - At
step 308, the samples are filtered from the data cube that do not satisfy the respective CFAR threshold for the corresponding cell. For example, each of the cells of thedata cube 118 is filtered by theprocessor 114 using its respective CFAR threshold to eliminate false detections that appear because of noise in theenvironment 100, which changes (e.g., unpredictably). - At
step 310, responsive to filtering the samples from the data cube, the data cube is output for use by a vehicle function in detecting objects that appear in the environment. For example, theprocessor 114 outputs an indication of thedata cube 118 for enabling other systems of thevehicle 102, or systems external to thevehicle 102, to track objects in the field ofview 106 of theradar system 104. -
FIG. 4 illustrates aline graph 400 comparing performance of distribution fitting CFAR detection compared to ground truth. Theline graph 400 shows results collected from a test chamber in which a single target is located at range bin one hundred forty. Because the power of the return signal is so high, the phase noise creates a hump in thegraph 400 between range indices one hundred and one hundred forty. Hundreds of frames are recorded for each range index during the measurement, and each frame contains hundreds of samples. In total, hundreds of thousands of samples are collected in each index, from which an actual CFAR threshold level can be estimated for a given range index. Unlike true CFAR thresholding, distribution fitting CFAR is calculated based on data from a single frame of each range index, which leads to a cloud-like appearance in thegraph 400. From thegraph 400, it can be observed that a center of the distribution fitting CFAR point cloud is aligned with true CFAR with only a small amount of deviation. -
FIG. 5 illustrates aline graph 500 comparing performance of distribution fitting CFAR detection compared to Ordered-Statistics CFAR detection.FIG. 6 illustrates aline graph 600 comparing performance of distribution fitting CFAR detection compared to Cell-Averaging CFAR detection. Unlike other CFAR algorithms, such as Cell-Averaging CFAR and Ordered-Statistics CFAR, distribution fitting CFAR can provide an accurate CFAR threshold even when a noise distribution changes. As observed from thegraphs - Some further examples in view of the techniques described above include:
- Example 1: A method, comprising: obtaining, by a processor of a system, multiple samples of radar returns including noise reflecting from an environment outside a vehicle; maintaining, by the processor, an array of the samples including each of the samples in a different, corresponding cell of the array; for each of the samples, determining, by the processor, a respective constant false alarm rate (CFAR) threshold for filtering the noise from the corresponding cell of the array by: determining a group of neighbor cells to the corresponding cell to use as training cells; generating a histogram that organizes the samples of the training cells into columns representing successive ranges of amplitude for the samples of the training cells; fitting the histogram to a noise distribution function; and determining the respective CFAR threshold for the corresponding cell from the noise distribution function that is fitted to the histogram for that corresponding cell; and filtering, by the processor, the samples from the array that do not satisfy the respective CFAR threshold for the corresponding cell; and responsive to filtering the samples from the array, outputting, by the processor, the array for use by a vehicle function in detecting objects that appear in the environment.
- Example 2: The method of example 1, wherein determining the respective CFAR threshold for filtering the noise from the corresponding cell of the array comprises scrubbing the training cells for high levels of noise prior to generating the histogram.
- Example 3: The method of any example above, wherein the training cells to the corresponding cell comprise cells associated with a same chirp as the corresponding cell and associated with a same range or same channel as the corresponding cell.
- Example 4: The method of any example above, wherein the training cells to the corresponding cell comprise cells associated with a same channel as the corresponding cell.
- Example 5: The method of any example above, wherein the training cells to the corresponding cell comprise cells associated with a same range as the corresponding cell.
- Example 6: The method of any example above, wherein generating the histogram comprises: organizing, based on respective amplitudes of the samples of the training cells, the samples of the training cells into the columns representing successive ranges of amplitude, an amplitude of the columns corresponding to a probability density function of the samples of the training cells that are associated with an amplitude range for that column.
- Example 7: The method of any example above, wherein the noise distribution function comprises a Rayleigh distribution.
- Example 8: The method of any example above, wherein the noise distribution function comprises a normal distribution.
- Example 9: The method of any example above, wherein fitting the histogram to the noise distribution function comprises: fitting a first histogram for a first cell to a first noise distribution function; and fitting a second histogram for a second cell to a second noise distribution function that is different than the first noise distribution function.
- Example 10: The method of any example above, wherein the array comprises a data cube.
- Example 11: A system comprising means for performing the method of any example above.
- Example 12: A system comprising a processor configured to perform the method of any example above.
- Example 13: A computer readable media including instructions that, when executed, cause a processor to perform the method of any example above.
- While various embodiments of the disclosure are described in the foregoing description and shown in the drawings, it is to be understood that this disclosure is not limited thereto but may be variously embodied to practice within the scope of the following claims. From the foregoing description, it will be apparent that various changes may be made without departing from the scope of the disclosure as defined by the following claims. In addition to radar systems, problems associated with CFAR threshold setting can occur in other systems (e.g., lidar systems) that process sensor point cloud detections in noisy environments, including driving situations. Therefore, although described to improve radar detecting, the techniques of the foregoing description can be adapted and applied to other problems to effectively detect objects in a scene using other types of sensors.
- The use of "or" and grammatically related terms indicates non-exclusive alternatives without limitation unless the context clearly dictates otherwise. As used herein, a phrase referring to "at least one of" a list of items refers to any combination of those items, including single members. As an example, "at least one of: a, b, or c" is intended to cover a, b, c, a-b, a-c, b-c, and a-b-c, as well as any combination with multiples of the same element (e.g., a-a, a-a-a, a-a-b, a-a-c, a-b-b, a-c-c, b-b, b-b-b, b-b-c, c-c, and c-c-c or any other ordering of a, b, and c).
Claims (15)
- A method, comprising:obtaining, by a processor of a system, multiple samples of radar returns including noise reflecting from an environment outside a vehicle;maintaining, by the processor, a array of the samples including each of the samples in a different, corresponding cell of the array;for each of the samples, determining, by the processor, a respective constant false alarm rate (CFAR) threshold for filtering the noise from the corresponding cell of the array by:determining a group of neighbor cells to the corresponding cell to use as training cells;generating a histogram that organizes the samples of the training cells into columns representing successive ranges of amplitude for the samples of the training cells;fitting the histogram to a noise distribution function; anddetermining the respective CFAR threshold for the corresponding cell from the noise distribution function that is fitted to the histogram for that corresponding cell;andfiltering, by the processor, the samples from the array that do not satisfy the respective CFAR threshold for the corresponding cell; andresponsive to filtering the samples from the array, outputting, by the processor, the array for use by a vehicle function in detecting objects that appear in the environment.
- The method of claim 1, wherein determining the respective CFAR threshold for filtering the noise from the corresponding cell of the array comprises scrubbing the training cells for high levels of noise prior to generating the histogram.
- The method of claim 1 or 2, wherein the training cells to the corresponding cell comprise cells associated with a same chirp as the corresponding cell and associated with a same range or same channel as the corresponding cell.
- The method of any of claims 1-3, wherein the training cells to the corresponding cell comprise cells associated with a same channel as the corresponding cell.
- The method of any of claims 1-4, wherein the training cells to the corresponding cell comprise cells associated with a same range as the corresponding cell.
- The method of any of claims 1-5, wherein generating the histogram comprises:organizing, based on respective amplitudes of the samples of the training cells, the samples of the training cells into the columns representing successive ranges of amplitude,an amplitude of the columns corresponding to a probability density function of the samples of the training cells that are associated with an amplitude range for that column.
- The method of any of claims 1-6, wherein the noise distribution function comprises a Rayleigh distribution.
- The method of any of claims 1-6, wherein the noise distribution function comprises a normal distribution.
- The method of any of claims 1-8, wherein fitting the histogram to the noise distribution function comprises:fitting a first histogram for a first cell to a first noise distribution function; andfitting a second histogram for a second cell to a second noise distribution function that is different than the first noise distribution function.
- A computer-readable media comprising instructions that, when executed, cause a processor to perform the method of any of claims 1-9.
- A system comprising means for performing the method of any of claims 1-9.
- A system comprising a processor configured to perform the method of any of claims 1-9.
- The system of claim 12, wherein the array comprises a data cube.
- The system of claim 12 or 13, wherein the system comprises a radar system.
- The system of any of claims 12-14, wherein the system comprises a system of a vehicle.
Applications Claiming Priority (2)
| Application Number | Priority Date | Filing Date | Title |
|---|---|---|---|
| US202263363230P | 2022-04-19 | 2022-04-19 | |
| US17/664,943 US12332374B2 (en) | 2022-04-19 | 2022-05-25 | Distribution fitting constant false alarm rate (CFAR) detection |
Publications (1)
| Publication Number | Publication Date |
|---|---|
| EP4266083A1 true EP4266083A1 (en) | 2023-10-25 |
Family
ID=85415471
Family Applications (1)
| Application Number | Title | Priority Date | Filing Date |
|---|---|---|---|
| EP23159571.1A Pending EP4266083A1 (en) | 2022-04-19 | 2023-03-02 | Distribution fitting constant false alarm rate (cfar) detection |
Country Status (2)
| Country | Link |
|---|---|
| US (1) | US12332374B2 (en) |
| EP (1) | EP4266083A1 (en) |
Families Citing this family (1)
| Publication number | Priority date | Publication date | Assignee | Title |
|---|---|---|---|---|
| US12399271B2 (en) * | 2022-07-20 | 2025-08-26 | Infineon Technologies Ag | Radar-based target tracker |
Family Cites Families (3)
| Publication number | Priority date | Publication date | Assignee | Title |
|---|---|---|---|---|
| FR2696011B1 (en) * | 1992-09-18 | 1994-11-04 | Thomson Csf | Method and device for adjusting the detection threshold of a radar. |
| CN108919247A (en) | 2018-03-30 | 2018-11-30 | 中国科学院电子学研究所 | A kind of multiple target physical examination survey and localization method based on constant false alarm rate detection |
| WO2022056638A1 (en) * | 2020-09-16 | 2022-03-24 | Mda Systems Ltd. | System, method, and satellites for surveillance imaging and earth observation using synthetic aperture radar imaging |
-
2022
- 2022-05-25 US US17/664,943 patent/US12332374B2/en active Active
-
2023
- 2023-03-02 EP EP23159571.1A patent/EP4266083A1/en active Pending
Non-Patent Citations (4)
| Title |
|---|
| LAURA ANITORI ET AL: "Design and Analysis of Compressed Sensing Radar Detectors", IEEE TRANSACTIONS ON SIGNAL PROCESSING, IEEE, USA, vol. 61, no. 4, 1 February 2013 (2013-02-01), pages 813 - 827, XP011489530, ISSN: 1053-587X, DOI: 10.1109/TSP.2012.2225057 * |
| LUHR DANIEL ET AL: "Radar Noise Reduction Based on Binary Integration", IEEE SENSORS JOURNAL, IEEE, USA, vol. 15, no. 2, 1 February 2015 (2015-02-01), pages 766 - 777, XP011564775, ISSN: 1530-437X, [retrieved on 20141119], DOI: 10.1109/JSEN.2014.2352295 * |
| ROSENBERG LUKE ET AL: "Target Detection in Medium Grazing Angle Sea Clutter Using Scan to Scan Processing", 2019 INTERNATIONAL RADAR CONFERENCE (RADAR), IEEE, 23 September 2019 (2019-09-23), pages 1 - 5, XP033764158, DOI: 10.1109/RADAR41533.2019.171341 * |
| TAO DING ET AL: "A Segmentation-Based CFAR Detection Algorithm Using Truncated Statistics", IEEE TRANSACTIONS ON GEOSCIENCE AND REMOTE SENSING, IEEE, USA, vol. 54, no. 5, 1 May 2016 (2016-05-01), pages 2887 - 2898, XP011604344, ISSN: 0196-2892, [retrieved on 20160325], DOI: 10.1109/TGRS.2015.2506822 * |
Also Published As
| Publication number | Publication date |
|---|---|
| US12332374B2 (en) | 2025-06-17 |
| US20230333207A1 (en) | 2023-10-19 |
Similar Documents
| Publication | Publication Date | Title |
|---|---|---|
| US10317522B2 (en) | Detecting long objects by sensor fusion | |
| US11618480B2 (en) | Kurtosis based pruning for sensor-fusion systems | |
| US12174312B2 (en) | Ordered-statistics ratio (OSR) constant false alarm rate (CFAR) detection with empirical data fitting | |
| US11360207B2 (en) | Apparatus and method for tracking object based on radar image reconstruction | |
| US11585895B2 (en) | Detection of parking slot configuration based on repetitive patterns | |
| CN107103275B (en) | Wheel-based vehicle detection and tracking using radar and vision | |
| US11378674B2 (en) | Object position and movement estimation using radar | |
| US20190346548A1 (en) | Filtering to address range walk effect in range-doppler map | |
| US12092733B2 (en) | Radar anti-spoofing system for identifying ghost objects created by reciprocity-based sensor spoofing | |
| US11300655B2 (en) | Object detection using radar | |
| US20200333436A1 (en) | Trailer detection and estimation system and related techniques | |
| US12332374B2 (en) | Distribution fitting constant false alarm rate (CFAR) detection | |
| CN116908794A (en) | Distributed fitting Constant False Alarm Rate (CFAR) detection | |
| US11119187B2 (en) | Resolution of doppler ambiguity in a radar system through tracking | |
| CN118226429A (en) | Method for processing radar data of a vehicle, data processing device and vehicle | |
| CN116736243B (en) | Stable radar tracking speed initialization using multiple hypotheses | |
| US20250020768A1 (en) | Interference mitigation by dynamic false rate model | |
| CN116224242A (en) | Multi-Channel Joint Interference Mitigation | |
| CN111091148B (en) | Vehicle-mounted radar target tracking method and device based on target prior information | |
| US20230243960A1 (en) | Ghost Object Detection | |
| CN116893391A (en) | Trace correlation based at least in part on low-confidence detections | |
| KR20230127667A (en) | Method and Apparatus for Estimating Speed Using RADAR | |
| CN111665481A (en) | Removing interference from signals received by detectors supported on a vehicle | |
| CN114924273B (en) | A linear prediction-based dual static detector for automotive radar | |
| Yoo et al. | Performance Analysis of IMM-PDAF Method for Multiple Target Tracking in Autonomous Emergency Braking Scenario |
Legal Events
| Date | Code | Title | Description |
|---|---|---|---|
| STAA | Information on the status of an ep patent application or granted ep patent |
Free format text: STATUS: THE APPLICATION HAS BEEN PUBLISHED |
|
| PUAI | Public reference made under article 153(3) epc to a published international application that has entered the european phase |
Free format text: ORIGINAL CODE: 0009012 |
|
| AK | Designated contracting states |
Kind code of ref document: A1 Designated state(s): AL AT BE BG CH CY CZ DE DK EE ES FI FR GB GR HR HU IE IS IT LI LT LU LV MC ME MK MT NL NO PL PT RO RS SE SI SK SM TR |
|
| STAA | Information on the status of an ep patent application or granted ep patent |
Free format text: STATUS: REQUEST FOR EXAMINATION WAS MADE |
|
| 17P | Request for examination filed |
Effective date: 20240328 |
|
| RAP1 | Party data changed (applicant data changed or rights of an application transferred) |
Owner name: APTIV TECHNOLOGIES AG |
|
| RBV | Designated contracting states (corrected) |
Designated state(s): AL AT BE BG CH CY CZ DE DK EE ES FI FR GB GR HR HU IE IS IT LI LT LU LV MC ME MK MT NL NO PL PT RO RS SE SI SK SM TR |
|
| STAA | Information on the status of an ep patent application or granted ep patent |
Free format text: STATUS: EXAMINATION IS IN PROGRESS |
|
| RAP3 | Party data changed (applicant data changed or rights of an application transferred) |
Owner name: APTIV TECHNOLOGIES AG |
|
| 17Q | First examination report despatched |
Effective date: 20240903 |