EP4254182A1 - Method and apparatus of detecting running state of a virtual machine based on kernel density estimation - Google Patents
Method and apparatus of detecting running state of a virtual machine based on kernel density estimation Download PDFInfo
- Publication number
- EP4254182A1 EP4254182A1 EP23164526.8A EP23164526A EP4254182A1 EP 4254182 A1 EP4254182 A1 EP 4254182A1 EP 23164526 A EP23164526 A EP 23164526A EP 4254182 A1 EP4254182 A1 EP 4254182A1
- Authority
- EP
- European Patent Office
- Prior art keywords
- probability density
- data set
- feature
- density distribution
- training data
- Prior art date
- Legal status (The legal status is an assumption and is not a legal conclusion. Google has not performed a legal analysis and makes no representation as to the accuracy of the status listed.)
- Granted
Links
Images


Classifications
-
- G—PHYSICS
- G06—COMPUTING OR CALCULATING; COUNTING
- G06F—ELECTRIC DIGITAL DATA PROCESSING
- G06F9/00—Arrangements for program control, e.g. control units
- G06F9/06—Arrangements for program control, e.g. control units using stored programs, i.e. using an internal store of processing equipment to receive or retain programs
- G06F9/44—Arrangements for executing specific programs
- G06F9/455—Emulation; Interpretation; Software simulation, e.g. virtualisation or emulation of application or operating system execution engines
- G06F9/45533—Hypervisors; Virtual machine monitors
- G06F9/45558—Hypervisor-specific management and integration aspects
-
- G—PHYSICS
- G06—COMPUTING OR CALCULATING; COUNTING
- G06F—ELECTRIC DIGITAL DATA PROCESSING
- G06F11/00—Error detection; Error correction; Monitoring
- G06F11/07—Responding to the occurrence of a fault, e.g. fault tolerance
- G06F11/0703—Error or fault processing not based on redundancy, i.e. by taking additional measures to deal with the error or fault not making use of redundancy in operation, in hardware, or in data representation
- G06F11/0706—Error or fault processing not based on redundancy, i.e. by taking additional measures to deal with the error or fault not making use of redundancy in operation, in hardware, or in data representation the processing taking place on a specific hardware platform or in a specific software environment
- G06F11/0712—Error or fault processing not based on redundancy, i.e. by taking additional measures to deal with the error or fault not making use of redundancy in operation, in hardware, or in data representation the processing taking place on a specific hardware platform or in a specific software environment in a virtual computing platform, e.g. logically partitioned systems
-
- G—PHYSICS
- G06—COMPUTING OR CALCULATING; COUNTING
- G06F—ELECTRIC DIGITAL DATA PROCESSING
- G06F11/00—Error detection; Error correction; Monitoring
- G06F11/07—Responding to the occurrence of a fault, e.g. fault tolerance
- G06F11/0703—Error or fault processing not based on redundancy, i.e. by taking additional measures to deal with the error or fault not making use of redundancy in operation, in hardware, or in data representation
- G06F11/0751—Error or fault detection not based on redundancy
- G06F11/0754—Error or fault detection not based on redundancy by exceeding limits
-
- G—PHYSICS
- G06—COMPUTING OR CALCULATING; COUNTING
- G06F—ELECTRIC DIGITAL DATA PROCESSING
- G06F9/00—Arrangements for program control, e.g. control units
- G06F9/06—Arrangements for program control, e.g. control units using stored programs, i.e. using an internal store of processing equipment to receive or retain programs
- G06F9/44—Arrangements for executing specific programs
- G06F9/455—Emulation; Interpretation; Software simulation, e.g. virtualisation or emulation of application or operating system execution engines
- G06F9/45533—Hypervisors; Virtual machine monitors
- G06F9/45558—Hypervisor-specific management and integration aspects
- G06F2009/45591—Monitoring or debugging support
-
- G—PHYSICS
- G06—COMPUTING OR CALCULATING; COUNTING
- G06F—ELECTRIC DIGITAL DATA PROCESSING
- G06F2201/00—Indexing scheme relating to error detection, to error correction, and to monitoring
- G06F2201/81—Threshold
Definitions
- the present disclosure relates to a field of a cloud computing technology, and in particular, to a method and an apparatus of detecting a running state of a virtual machine based on a kernel density estimation, an electronic device, a computer-readable storage medium and a program product.
- a conventional virtual machine abnormal alarm is manually provided with a fixed threshold value based on experience. Once virtual machine operation data exceeds the threshold value, an alarm may be triggered, which may not have a flexibility to change with time and business. At the same time, the determination method relies too much on professionals, and requires professional operation and maintenance personnel to check each indicator of the virtual machine one by one, which may be inefficient and unreliable.
- the above-mentioned information disclosed in the section is only used to understand the background of the inventive concept of the present disclosure. Therefore, the above-mentioned information may include an information that does not constitute the prior art.
- a method and an apparatus of detecting a running state of a virtual machine based on a kernel density estimation an electronic device, a computer-readable storage medium and a program product are provided.
- a method of detecting a running state of a virtual machine based on a kernel density estimation including:
- the at least one feature includes a first feature, a second feature and a third feature, and the first feature, the second feature and the third feature are configured to characterize different running states of the virtual machine respectively; and the acquiring a training data set of at least one feature includes: simultaneously acquiring a first training data set of the first feature, a second training data set of the second feature, and a third training data of the third feature.
- the building a probability density model for the training data set of the at least one feature by using a kernel density estimation algorithm so as to obtain a probability density distribution curve of the training data set of the at least one feature includes: building probability density models respectively for the first training data set of the first feature, the second training data set of the second feature and the third training data set of the third feature by using the kernel density estimation algorithm, so as to obtain a first probability density distribution curve of the first training data set, a second probability density distribution curve of the second training data set and a third probability density distribution curve of the third training data set.
- the determining a probability density threshold value of the training data set of the at least one feature according to the probability density model includes: determining a first probability density threshold value of the first training data set, a second probability density threshold value of the second training data set and a third probability density threshold value of the third training data set according to the probability density distribution curve.
- the acquiring a test data set of the at least one feature includes: simultaneously acquiring a first test data set of the first feature, a second test data set of the second feature and a third test data set of the third feature.
- the acquiring a probability density distribution curve of the test data set of the at least one feature according to the built probability density model includes: respectively acquiring a first probability density distribution curve of the first test data set, a second probability density distribution curve of the second test data set and a third probability density distribution curve of the third test data set according to the built probability density model.
- the comparing the probability density distribution curve of the training data set of the at least one feature with the probability density distribution curve of the test data set of the at least one feature to determine a probability density distribution measurement total score includes:
- the comparing a plurality of probability density values of the test data set of the at least one feature with the probability density threshold value to determine an abnormal value ratio measurement total score includes:
- the comparing the first probability density distribution curve of the first training data set with the first probability density distribution curve of the first test data set to determine a first probability density distribution measurement score includes: calculating a Wasserstein distance between the first probability density distribution curve of the first training data set and the first probability density distribution curve of the first test data set, and mapping the Wasserstein distance into a centesimal system to acquire the first probability density distribution measurement score; and/or,
- the comparing a plurality of probability density values of the first test data set with the first probability density threshold value to determine a first abnormal value ratio measurement score includes: calculating a proportion of a number of probability density values less than the first probability density threshold value among the plurality of probability density values of the first test data set to a total number of the plurality of probability density values of the first test data set; and mapping the proportion into a centesimal system to acquire the first abnormal value ratio measurement score; and/or,
- the determining the running state of the virtual machine according to the virtual machine state total score includes:
- the first feature is a CPU utilization
- the second feature is a network receiving traffic
- the third feature is a network sending traffic.
- At least one of the acquiring a training data set of at least one feature and the acquiring a test data set of the at least one feature includes:
- the method further includes:
- a correlation between the second training data set of the second feature and the third training data set of the third feature is greater than a correlation between the first training data set of the first feature and the second training data set of the second feature, and the correlation between the second training data set of the second feature and the third training data set of the third feature is greater than a correlation between the first training data set of the first feature and the third training data set of the third feature; and the weight coefficient wm1 is greater than any one of the weight coefficients wm2 and wm3, and the weight coefficient wt1 is greater than any one of the weight coefficients wt2 and wt3.
- the weight coefficient wm2 is greater than the weight coefficient wm3, and the weight coefficient wt2 is greater than the weight coefficient wt3.
- the determining the running state of the virtual machine according to the virtual machine state total score includes:
- an apparatus of detecting a running state of a virtual machine based on a kernel density estimation including:
- an electronic device including:
- a computer-readable storage medium having executable instructions thereon is provided, and the instructions, when executed by a processor, are configured to cause the processor to implement the method as described above.
- a computer program product including a computer program is provided, and the computer program, when executed by a processor, is configured to cause the processor to implement the method as described above.
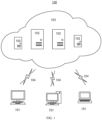
- FIG. 1 schematically shows an application scenario diagram of a method of detecting a running state of a virtual machine based on a kernel density estimation according to embodiments of the present disclosure.
- an application scenario 100 may include a terminal device 101, a server 102, a cloud 103 and a network 104.
- Cloud computing is a kind of distributed computing, which means that a huge data computing processing program is decomposed into numerous small programs through a network "cloud", and then the small programs are processed and analyzed through a system composed of a plurality of servers to obtain a result and return the result to a user.
- the cloud computing mainly performs a simple distributed computing to solve a task distribution, and consolidates computing results.
- the cloud computing is also called a grid computing.
- a processing of tens of thousands of data may be completed in a very short time (such as a few seconds) through the technology, so that a powerful network service may be achieved.
- a cloud service at this stage is not only a kind of distributed computing, but also a result of a mixed evolution and leap of computer technologies such as distributed computing, utility computing, load balancing, parallel computing, network storage, hot backup redundancy, virtualization, etc.
- the cloud computing may be classified according to a service type.
- the cloud computing may be classified into three categories from bottom to top according to the service type: (1) an Infrastructure as a Service (IaaS for short), which provides the user with a hardware infrastructure service, that is, computing resources, including a virtual server resource, a storage resource, a network bandwidth resource, etc.; (2) a Platform as a Service (PaaS for short), which provides the user with a platform on which an application and a service are built through the Internet, that is, an on-demand development environment is provided for developing, testing and managing a software application; and (3) a Software as a Service (SaaS for short), which provides the user with an on-demand software paid application, a cloud computing provider host and a manage software application, and allows the user to be connected to the applications and to access the applications through the Internet.
- IaaS Infrastructure as a Service
- PaaS for short Platform as a Service
- SaaS for short Software as a Service
- a plurality of servers 102 may be provided in the cloud 103, and the plurality of servers 102 may provide various services.
- a cloud platform management system is provided in the cloud 103, which is responsible for a rapid scheduling and a centralized management of resources provided by the plurality of servers 102.
- Virtualization is one of basic technologies of the cloud computing.
- a virtualization technology a physical resource is virtualized and thus converted into a virtual resource that is easily managed.
- the virtualization technology includes a hardware virtualization and a software virtualization.
- the cloud computing may encapsulate a hardware resource and a software resource using the virtualization technology, and provide the user with a required service through the Internet.
- main objectives of the virtualization include a CPU resource, a memory resource, a storage resource, a network bandwidth resource, etc.
- the resources are usually provided to the user in a form of the virtual machine, and may be operated by providing a specific interface, which may facilitate use of the resources by the application or the user for a certain application.
- a server 102 may be provided with at least one virtual machine, for example, a plurality of virtual machines.
- the virtual machines are independent servers. However, in fact, the virtual machines share CPU, a memory, a hardware resource, a network resource, etc. of the physical server 102.
- the physical machine 102 may be called "Host”, and the virtual machine may also be called "Guest”.
- the network 104 is a medium for providing a communication link between the terminal device 101 and the cloud 103.
- the network 104 may include various connection types, such as wired or wireless communication links, optical fiber cables, etc.
- the terminal device 101 used by a user may interact with the cloud 103 through the network 104, so that the user may use various applications, data or services in the cloud 103.
- the terminal devices 101 may be various electronic devices having display screens and capable of installing application software, including but not limited to smartphones, tablet computers, laptop computers, desktop computers, etc.
- the method provided by embodiments of the present disclosure may be performed by the server 102. Accordingly, the apparatus provided by embodiments of the present disclosure may be provided in the server 102. The method provided by embodiments of the present disclosure may also be performed by a server or server cluster different from the server 102 and capable of communicating with the terminal device 101 and/or the server 102. Accordingly, the apparatus provided by embodiments of the present disclosure may also be provided in the server or server cluster different from the server 102 and capable of communicating with the terminal device 101 and/or the server 102.
- terminal devices, networks and servers in FIG. 1 are only schematic. According to implementation needs, any number of terminal devices, networks and servers may be provided.
- technologies such as data mining, machine learning, etc. are applied to a virtual machine anomaly detection.
- the inventors have found through research that, due to use of a large number of monitoring information generated in an operation of the virtual machine as training indicators have relatively a high information dimension and frequency, it is difficult to convert the information into labelable data and thus a lot of manpower, time and professional knowledge personnel are required; an abnormal situation of the virtual machine is relatively complex, and due to a limitation of personnel, a label error or a missing label may occur; an abnormal condition of the virtual machine accounts for a small number, and positive and negative samples are seriously unbalanced. Therefore, in embodiments of the present disclosure, it is proposed to apply an unsupervised machine learning algorithm to the virtual machine anomaly detection.
- the unsupervised algorithm may be roughly divided into two categories: one is a clustering algorithm based on similarity measurements such as a distance and a density between samples, and the other is a nonparametric algorithm based on the kernel density estimation.
- the inventors have found through research that the clustering algorithm based on the similarity measurements such as the distance and the density between samples may be applied to the virtual machine anomaly detection.
- an anomaly indicator of the virtual machine may be calculated by weighting results of algorithms such as LOF (Local Abnormal value Factor algorithm), IFOREST (Isolated Forest algorithm), DBSCAN (Density-Based Spatial Clustering of Applications with Noise algorithm), etc.
- the algorithm has a very high time complexity with an increase of training samples, which may not be conducive to an online processing, and a distance measurement method and an initial point of clustering are difficult to be selected, which may have a great impact on a final result.
- a kernel density estimation algorithm is used in embodiments of the present disclosure.
- the algorithm describes characteristics and distribution of data from the data itself without manually selecting the initial point and the distance measurement method, which may reduce an error of human intervention.
- An amount of calculation during a model test is moderate.
- a probability density function obtained by training may be displayed in a form of a curve distribution, which may facilitate a comparison of results and fit the description of relevant resource indicators of the virtual machine.
- an anomaly detection is performed on the virtual machine by using the kernel density estimation algorithm, a warning threshold value may be obtained through a model result, and a health score of the virtual machine within a time window may be calculated in real time through a series of mechanisms, so as to replace a manual threshold value setting and a manual daily operation and maintenance patrol, and clearly display the anomaly indicator of the virtual machine, so that an intelligent operation and maintenance may be provided and manpower may be liberated.
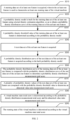
- FIG. 2 schematically shows a flowchart of a method of detecting a running state of a virtual machine based on a kernel density estimation according to embodiments of the present disclosure.
- a method 200 of detecting a running state of a virtual machine based on a kernel density estimation according to embodiments of the present disclosure may include operations S210 to S290, and the method of detecting the running state of the virtual machine based on the kernel density estimation may be performed by the server 102.
- some steps or operations of the method 200 may be performed individually or in combination, and may be performed in parallel or in sequence, which is not limited to a specific operation sequence shown in FIG. 2 .
- at least some operations in operations S210 to S290 may be performed in parallel, in sequence or in a reverse order.
- a training data set of at least one feature is acquired, wherein the at least one feature is used to characterize at least one running state of the virtual machine.
- a probability density model is built for the training data set of the at least one feature by using a kernel density estimation algorithm, so as to obtain a probability density distribution curve of the training data set of the at least one feature.
- a probability density threshold value of the training data set of the at least one feature is determined according to the probability density model.
- a probability density distribution curve of the test data set of the at least one feature is acquired according to the built probability density model.
- the probability density distribution curve of the training data set of the at least one feature is compared with the probability density distribution curve of the test data set of the at least one feature to determine a probability density distribution measurement total score.
- a plurality of probability density values of the test data set of the at least one feature are compared with the probability density threshold value to determine an abnormal value ratio measurement total score.
- a virtual machine state total score is determined according to the probability density distribution measurement total score and the abnormal value ratio measurement total score.
- the running state of the virtual machine is determined according to the virtual machine state total score.
- a virtual machine anomaly detection scoring mechanism may make full use of characteristics of historical data and a probability density function, and design two measurement indicators to quantify a health status of the virtual machine. That is, a health condition of the virtual machine may be qualified by combining the above-mentioned two measurement indicators, so that the running state of the virtual machine may be determined quickly and intuitively.
- the first feature is a CPU utilization
- the second feature is a network receiving traffic
- the third feature is a network sending traffic.
- the technical solution of the present disclosure will be described in detail with by taking the CPU utilization, the network receiving traffic and the network sending traffic as an example.
- embodiments of the present disclosure are not limited to this, that is, the at least one feature may include other features used to characterize the at least one running state of the virtual machine.
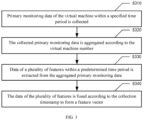
- FIG. 3 schematically shows a flowchart of a step of acquiring a data set in a method of detecting a running state of a virtual machine based on a kernel density estimation according to embodiments of the present disclosure.
- the step of acquiring the data set may be at least one of the above-mentioned operations S210 and S240.
- the acquired data set may include operations S310 to S340.
- primary monitoring data of the virtual machine within a specified time period is collected, wherein the primary monitoring data includes a virtual machine number, a collection timestamp, CPU usage time of the virtual machine, a network receiving traffic and a network sending traffic.
- the collected data set is derived from monitoring data of each virtual machine captured by Prometheus during an actual running on site.
- the CPU utilization rate, the network receiving traffic and the network sending traffic that may reflect the running state of the virtual machine may be selected, and initial monitoring data tables for storing three resource indicators are respectively acquired from a database to complete a data collection.
- Prometheus-Exporter may be deployed on the at least one virtual machine, running monitoring data of the virtual machine may be captured through the Prometheus deployed on the virtual machine, and the captured data may be stored in InfluxDB.
- the primary monitoring data of the virtual machine collected by the Prometheus is extracted from the InfluxDB.
- the primary monitoring data includes: a virtual machine number, a collection timestamp, indicator values (e.g., the CPU usage time of the virtual machine, the network receiving traffic, the network sending traffic, etc.), an indicator working mode, a port, a collection service, etc.
- a timestamp interval may be timed in seconds.
- the data set may be collected within the specified time period (e.g., a week).
- specified time periods of all virtual machines may be from 8 a.m. to 17 p.m.
- the InfluxDB is an open-source database for storing and analyzing time series data.
- Main characteristics of the InfluxDB include: a built-in HTTP interface; data being markable; SQL-like query statements; a simple installation management and a high efficiency in reading and writing data; queryable in real time, and data being easily queried immediately by indexing when being written.
- the collected primary monitoring data is aggregated according to the virtual machine number.
- operations S320 to S340 involve a building of a feature engineering. That is, the above-mentioned collected primary monitoring data may not be directly used to build a model, and secondary performance indicators required for modeling need to be further extracted from the primary monitoring data as model input features, including the CPU utilization, the network receiving traffic, and the network sending traffic as modeling indicators.
- the secondary performance indicators may be further standardized to complete the building of the feature engineering.
- the collected primary monitoring data is aggregated according to the virtual machine number.
- the primary monitoring data may include data of the plurality of virtual machines.
- the primary monitoring data is aggregated according to the virtual machine number in the data, so that the primary monitoring data of a same virtual machine may be aggregated together.
- three secondary performance indicators may be extracted from the aggregated initial monitoring data for each virtual machine within the predetermined time period (e.g., every 20 seconds) according to an equation for computing the CPU utilization and a network traffic in PromQL.
- a feature fusion may be performed on the extracted three secondary performance indicators (i.e., the CPU utilization, the network receiving traffic, and the network sending traffic) according to the time stamp to form the feature vector.
- a feature vector may include three elements, that is, the CPU utilization, the network receiving traffic, and the network sending traffic.
- data cleaning may also be performed to remove an influence of null and extreme values on the modeling and complete the building of the feature engineering.
- the PromQL Prometheus Query Language
- the PromQL is widely used in daily applications of the Prometheus, including data query, visualization and alarm processing. After the Prometheus collects corresponding monitoring indicator sample data through the Exporter, monitoring sample data may be queried through the PromQL.
- the feature vector may be used for the modeling.
- three models are built from three dimensions (that is, the first feature, the second feature, and the third feature), and a final abnormal conclusion is an overall conclusion obtained by summarizing results of the three models.
- a correlation between the dimensions of the built feature engineering may be analyzed. That is, a correlation analysis is performed on the first training data set of the first feature, the second training data set of the second feature and the third training data set of the third feature.
- FIG. 4 schematically shows a correlation between three features used in a method of detecting a running state of a virtual machine based on a kernel density estimation according to embodiments of the present disclosure.
- three indicators are provided in abscissa and ordinate respectively, where cpu_use represents the CPU utilization, receive_net_use represents the network receiving traffic, and sent_net_use represents the network sending traffic.
- Each block represents a pairwise correlation between abscissa indicators and ordinate indicators.
- Color is a measurement of a correlation size. A correlation between the color and a value is shown in a legend on the right. The lighter the color, the higher the correlation, and the darker the color, the lower the correlation.
- the value in the block represents the pairwise correlation between the abscissa indicators and the ordinate indicators.
- a value "-0.023" in a block in the first row and the second column means that the CPU utilization and the network receiving traffic have a low correlation and have a negative correlation therebetween.
- a value "0.59" in a block in the second row and the third column means that the network receiving traffic and the network sending traffic have a high correlation and have a positive correlation therebetween. It can be seen from FIG. 4 that the network receiving traffic and the network sending traffic have a high correlation, and the CPU utilization and other two indicators have a low correlation.
- the probability density model is built using the kernel density estimation algorithm, so as to obtain the probability density distribution curve of the training data set and the probability density distribution curve of the test data set.
- the curve serves as one of scoring indicators for a subsequent measurement of the test data set.
- probability density models are built for three dimensional features respectively to obtain the probability density distribution curve of each dimension in the training data set and the test data set.
- the curve serves as one of scoring indicators for the subsequent measurement of the test data set, and then a reasonable probability density threshold value for each model is calculated as another indicator for the subsequent measurement of the test data set.
- a built single-dimension model may model more accurately for each dimension indicator itself to obtain an accurate detection result.
- a final detection score of the virtual machine is derived from an integration of all single-dimension results, so that an accuracy of the final detection score may be further improved.
- the single-dimension model is more convenient for operation and maintenance personnel to know exactly which indicator causes an abnormality of the virtual machine, and a result obtained is clearer and more interpretable.
- the acquiring a training data set of at least one feature includes: simultaneously acquiring a first training data set of the first feature (e.g., the CPU utilization), a second training data set of the second feature (e.g., the network receiving traffic), and a third training data set of the third feature (e.g., the network sending traffic).
- a first training data set of the first feature e.g., the CPU utilization
- a second training data set of the second feature e.g., the network receiving traffic
- a third training data set of the third feature e.g., the network sending traffic
- the building a probability density model for the training data set of the at least one feature by using a kernel density estimation algorithm so as to obtain a probability density distribution curve of the training data set of the at least one feature includes: building probability density models respectively for the first training data set of the first feature, the second training data set of the second feature and the third training data set of the third feature by using the kernel density estimation algorithm, so as to obtain a first probability density distribution curve of the first training data set, a second probability density distribution curve of the second training data set and a third probability density distribution curve of the third training data set.
- FIG. 5A to FIG. 5C schematically show probability density distribution curves of training data sets of three features. That is, FIG. 5A shows the first probability density distribution curve of the first training data set. In FIG. 5A , the abscissa is a value of the CPU utilization in the first training data set, and the ordinate is a Gaussian kernel density value.
- FIG. 5B shows the second probability density distribution curve of the second training data set. In FIG. 5B , the abscissa is a value (in MB) of the network receiving traffic in the second training data set, and the ordinate is a Gaussian kernel density value.
- FIG. 5C shows the third probability density distribution curve of the third training data set. In FIG. 5C , the abscissa is a value (in MB) of the network sending traffic in the third training data set, and the ordinate is a Gaussian kernel density value.
- the kernel density estimation algorithm is a nonparametric estimation algorithm, which may obtain a better model than a parameter estimation by fitting a distribution from characteristics and properties of the data itself without adding prior knowledge.
- a smooth curve may be obtained using a Gaussian kernel function; h is a bandwidth, which is a size of a selection window. Too small window may cause an overfitting, and too large window may cause the curve to be too smooth to show a fluctuation. Therefore, a grid parameter optimization is used for each dimension to obtain an optimal bandwidth for each dimension.
- the acquiring a test data set of the at least one feature includes: simultaneously acquiring a first test data set of the first feature, a second test data set of the second feature and a third test data set of the third feature.
- the acquiring a probability density distribution curve of the test data set of the at least one feature according to the built probability density model includes: respectively acquiring a first probability density distribution curve of the first test data set, a second probability density distribution curve of the second test data set and a third probability density distribution curve of the third test data set according to the built probability density model.
- the determining a probability density threshold value of the training data set of the at least one feature according to the probability density model includes: determining a first probability density threshold value of the first training data set, a second probability density threshold value of the second training data set and a third probability density threshold value of the third training data set according to the probability density distribution curve.
- a reasonable probability density threshold value is calculated for each feature as another indicator for the subsequent measurement of the test data set.
- a running state score of the virtual machine is determined from two measurement indicators.
- the two measurement indicators include a function distribution measurement and an abnormal value ratio measurement.
- the function distribution measurement means that a distribution difference between the probability density distribution curve obtained from the test data set and the probability density distribution curve obtained from the training data set is calculated to indicate a possibility of abnormality of to-be-tested data.
- the abnormal value ratio measurement means that a proportion of abnormal values within a threshold value range in the test data set is calculated to indicate a probability of abnormality of to-be-tested data.
- Data used in the distribution curve of the training data set is resource use data during most of a normal operation of the virtual machine, which provides a certain reference value. The greater a difference between a distribution of the test data set and a distribution of the training data set, the higher the probability of the abnormality and the lower the score.
- FIG. 6 schematically shows a flowchart of a process of determining a running state score of a virtual machine using a function distribution measurement.
- FIG. 7 schematically shows a flowchart of a process of determining a running state score of a virtual machine by an abnormal value ratio measurement.
- the above-mentioned operations S260 may include sub-operations S2601 to S2604.
- sub-operation S2601 the first probability density distribution curve (as shown in FIG. 5A ) of the first training data set is compared with the first probability density distribution curve of the first test data set to determine a first probability density distribution measurement score.
- a Wasserstein distance between the first probability density distribution curve of the first training data set and the first probability density distribution curve of the first test data set may be calculated, and the Wasserstein distance may be mapped into a centesimal system (e.g., may be mapped according to a mapping relationship in Table 1) to acquire the first probability density distribution measurement score.
- the second probability density distribution curve (as shown in FIG. 5B ) of the second training data set is compared with the second probability density distribution curve of the second test data set to determine a second probability density distribution measurement score.
- a Wasserstein distance between the second probability density distribution curve of the second training data set and the second probability density distribution curve of the second test data set may be calculated, and the Wasserstein distance may be mapped into a centesimal system (e.g., may be mapped according to the mapping relationship in Table 1) to acquire the second probability density distribution measurement score.
- the third probability density distribution curve (as shown in FIG. 5C ) of the third training data set is compared with the third probability density distribution curve of the third test data set to determine a third probability density distribution measurement score.
- a Wasserstein distance between the third probability density distribution curve of the third training data set and the third probability density distribution curve of the third test data set may be calculated, and the Wasserstein distance may be mapped into a centesimal system (e.g., may be mapped according to the mapping relationship in Table 1) to acquire the third probability density distribution metric score.
- the Wasserstein distance measures a distance between two probability distributions.
- the Wesserstein distance is also called an Earth-Mover distance.
- Floor(int(3-dis_was)/3*100) 3 ⁇ dis_was ⁇ 4
- dis_was represents the Wasserstein distance
- an int function and a floor function represent rounding.
- the int function directly truncates a decimal part
- the floor function obtains an integer closest to original number but less than the original number.
- sm is the probability density distribution measurement total score
- smc1 is the first probability density distribution measurement score
- smc2 is the second probability density distribution measurement score
- smc3 is the third probability density distribution measurement score
- wm 1, wm2 and wm3 are weight coefficients of the first probability density distribution measurement score, the second probability density distribution measurement score, and the third probability density distribution measurement score.
- the weight coefficients wm1, wm2 and wm3 are determined according to a result of the correlation analysis. For example, in the above-mentioned correlation analysis, the network receiving traffic and the network sending traffic have a high correlation, and the CPU utilization and other two indicators have a low correlation. Therefore, the weight coefficient wm1 of the first probability density distribution measurement score is greater than any one of the weight coefficient wm2 of the second probability density distribution measurement score and the weight coefficient wm3 of the third probability density distribution measurement score. In addition, in embodiments of the present disclosure, more attention may be paid to the network receiving traffic than the network sending traffic. Therefore, the weight coefficient wm2 of the second probability density distribution measurement score is greater than the weight coefficient wm3 of the third probability density distribution measurement score.
- wm1 may be 0.5
- wm2 may be 0.3
- wm3 may be 0.2.
- samples in a sampling time window (which may be fine-grained one-day data in seconds, or coarse-grained one-day data per hour) are tested.
- a probability density distribution in each dimension is obtained on three probability density models, and a Wasserstein distance between the probability density distribution and a probability density distribution of training samples is calculated.
- the Wasserstein distance is an indicator for measuring a difference between two distributions. The smaller a value of the Wasserstein distance represents that the closer a distribution of test samples and a distribution of the training samples. The value of the Wasserstein distance value is mapped into the centesimal system. The mapping relationship is shown in Table 1.
- a score of the function distribution difference measurement may be obtained in each dimension, and a total score may be obtained by combining three scores.
- a built single-dimension model may model more accurately for each dimension indicator itself to obtain an accurate detection result.
- a final detection score of the virtual machine is derived from an integration of all single-dimension results, so that an accuracy of a final detection score may be further improved.
- the single-dimension model is more convenient for operation and maintenance personnel to know exactly which indicator causes an abnormality of the virtual machine, and a result obtained is clearer and more interpretable.
- the above-mentioned operation S270 may include sub-operations S2701 to S2704.
- sub-operation S270 1 a plurality of probability density values of the first test data set are compared with the first probability density threshold value to determine a first abnormal value ratio measurement score.
- a proportion of a number of probability density values less than the first probability density threshold value among the plurality of probability density values of the first test data set to a total number of the plurality of probability density values of the first test data set is calculated; and the proportion is mapped into a centesimal system (e.g., according to a mapping relationship in Table 2) to acquire the first abnormal value ratio measurement score.
- a plurality of probability density values of the second test data set are compared with the second probability density threshold value to determine a second abnormal value ratio measurement score.
- a proportion of a number of probability density values less than the second probability density threshold value among the plurality of probability density values of the second test data set to a total number of the plurality of probability density values of the second test data set is calculated; and the proportion is mapped into a centesimal system (e.g., according to the mapping relationship in Table 2) to acquire the second abnormal value ratio measurement score.
- a plurality of probability density values of the third test data set are compared with the third probability density threshold value to determine a third abnormal value ratio measurement score.
- a proportion of a number of probability density values less than the third probability density threshold value among the plurality of probability density values of the third test data set to a total number of the plurality of probability density values of the third test data set is calculated; and the proportion is mapped into a centesimal system (e.g., according to the mapping relationship in Table 2) to acquire the third abnormal value ratio measurement score.
- percent represents a proportion of density values below a density threshold value in the test data set
- a floor function represents rounding.
- the floor function obtains an integer closest to original number but less than the original number.
- st is the abnormal value ratio measurement total score
- stc1 is the first abnormal value ratio measurement score
- stc2 is the second abnormal value ratio measurement score
- stc3 is the third abnormal value ratio measurement score
- wt1, wt2 and wt3 are weight coefficients of the first abnormal value ratio measurement score, the second abnormal value ratio measurement score, and the third abnormal value ratio measurement score.
- the weight coefficients wt1, wt2 and wt3 are determined according to the result of the correlation analysis. For example, in the above-mentioned correlation analysis, the network receiving traffic and the network sending traffic have a high correlation, and the CPU utilization and other two indicators have a low correlation. Therefore, the weight coefficient wt1 of the first abnormal value ratio measurement score is greater than any one of the weight coefficient wt2 of the second abnormal value ratio measurement score and the weight coefficient wt3 of the third abnormal value ratio measurement score. In addition, in embodiments of the present disclosure, more attention may be paid to the network receiving traffic than the network sending traffic. Therefore, the weight coefficient wt2 of the second abnormal value ratio measurement score is greater than the weight coefficient wt3 of the third abnormal value ratio measurement score.
- wt1 may be 0.5
- wt2 may be 0.3
- wt3 may be 0.2.
- a small amount of abnormal data may exist, and a proportion of abnormal values in a historical manual statistic evaluated by professionals may be about 10%.
- an assigned weight of results of two measurement indicators may be ws1>ws2.
- ws1 may be 0.6
- ws2 may be 0.4.
- the determining the running state of the virtual machine according to the virtual machine state total score includes: determining that the virtual machine is in an abnormal running state in response to the virtual machine state total score being less than a first scoring threshold value; determining that the virtual machine is in a high potential abnormal state in response to the virtual machine state total score being in a first interval defined by the first scoring threshold value and a second scoring threshold value; and determining that the virtual machine is in a low potential abnormal state in response to the virtual machine state total score being in a second interval defined by the second scoring threshold value and a third scoring threshold value.
- the determining the running state of the virtual machine according to the virtual machine state total score includes: determining that the virtual machine is in a good running state in response to the virtual machine state total score being in a third interval defined by the third scoring threshold value and a fourth scoring threshold value; and determining that the virtual machine is in an excellent running state in response to the virtual machine state total score being greater than the fourth scoring threshold value.
- Table 3 Virtual machine anomaly indicators ss Running state of virtual machine Above 90 Excellent 80 to 90 Good 70 to 80 Low potential abnormality 60 to 70 High potential abnormality Below 60 Abnormal
- the virtual machine state total score when the virtual machine state total score is below 60 points, it is determined that the virtual machine is in the abnormal running state; when the virtual machine state total score is in a range of 60 points to 70 points, it is determined that the virtual machine is in the high potential abnormal state; when the virtual machine state total score is in a range of 70 points to 80 points, it is determined that the virtual machine is in the low potential abnormal state; when the virtual machine state total score is in a range of 80 points to 90 points, it is determined that the virtual machine is in the good running state; and when the virtual machine state total score is above 90 points, it is determined that the virtual machine is in the excellent running state.
- embodiments of the present disclosure further provide an apparatus of detecting a running state of a virtual machine based on a kernel density estimation.
- the apparatus will be described below in detail with reference to FIG. 8 .
- FIG. 8 shows a structural block diagram of an apparatus of detecting a running state of a virtual machine based on a kernel density estimation according to exemplary embodiments of the present disclosure.
- an apparatus 800 of detecting a running state of a virtual machine based on a kernel density estimation includes a training data acquisition module 810, a first probability density model building module 820, a probability density threshold value determination module 830, a test data set acquisition module 840, a second probability density distribution curve acquisition module 850, a probability density distribution measurement total score determination module 860, and an abnormal value ratio measurement total score determination module 870, a virtual machine state total score determination module 880 and a virtual machine running state determination module 890.
- the training data acquisition module 810 is used to acquire a training data set of at least one feature, wherein the at least one feature is used to characterize at least one running state of the virtual machine.
- the training data acquisition module 810 may be used to perform the above-mentioned operation S210 and a sub-operation thereof, which will not be repeated here.
- the first probability density model building module 820 is used to build a probability density model for the training data set of the at least one feature by using a kernel density estimation algorithm, so as to obtain a probability density distribution curve of the training data set of the at least one feature.
- the first probability density model building module 820 may be used to perform the above-mentioned operation S220 and a sub-operation thereof, which will not be repeated here.
- the probability density threshold value determination module 830 is used to determine a probability density threshold value of the training data set of the at least one feature according to the probability density model. In some exemplary embodiments, the probability density threshold value determination module 830 may be used to perform the above-mentioned operation S230 and a sub-operation thereof, which will not be repeated here.
- the test data set acquisition module 840 is used to acquire a test data set of the at least one feature.
- the test data set acquisition module 840 may be used to perform the above-mentioned operation S240 and a sub-operation thereof, which will not be repeated here.
- the second probability density distribution curve acquisition module 850 is used to acquire a probability density distribution curve of the test data set of the at least one feature according to the constructed probability density model.
- the second probability density distribution curve acquisition module 850 may be used to perform the above-mentioned operation S250 and a sub-operation thereof, which will not be repeated here.
- the probability density distribution measurement total score determination module 860 is used to compare the probability density distribution curve of the training data set of the at least one feature with the probability density distribution curve of the test data set of the at least one feature to determine a probability density distribution measurement total score.
- the probability density distribution measurement total score determination module 860 may be used to perform the above-mentioned operation S260 and a sub-operation thereof, which will not be repeated here.
- the abnormal value ratio measurement total score determination module 870 is used to compare a plurality of probability density values of the test data set of the at least one feature with the probability density threshold value to determine an abnormal value ratio measurement total score.
- the abnormal value ratio measurement total score determination module 870 may be used to perform the above-mentioned operation S270 and a sub-operation thereof, which will not be repeated here.
- the virtual machine state total score determination module 880 is used to determine a virtual machine state total score according to the probability density distribution measurement total score and the abnormal value ratio measurement total score. In some exemplary embodiments, the virtual machine state total score determination module 880 may be used to perform the above-mentioned operation S280 and a sub-operation thereof, which will not be repeated here.
- the virtual machine running state determination module 890 is used to determine the running state of the virtual machine according to the virtual machine state total score. In some exemplary embodiments, the virtual machine running state determination module 890 may be used to perform the above-mentioned operation S290 and a sub-operation thereof, which will not be repeated here.
- any number of modules in the training data acquisition module 810, the first probability density model building module 820, the probability density threshold value determination module 830, the test data set acquisition module 840, the second probability density distribution curve acquisition module 850, the probability density distribution measurement total score determination module 860, the abnormal value ratio measurement total score determination module 870, the virtual machine state total score determination module 880 and the virtual machine running state determination module 890 may be combined into a module to be implemented, or any one of the modules may be divided into a plurality of modules. Alternatively, at least some functions of one or more of the modules may be combined with at least some functions of other modules and implemented in a module.
- At least one of the training data acquisition module 810, the first probability density model building module 820, the probability density threshold value determination module 830, the test data set acquisition module 840, the second probability density distribution curve acquisition module 850, the probability density distribution measurement total score determination module 860, the abnormal value ratio measurement total score determination module 870, the virtual machine state total score determination module 880 and the virtual machine running state determination module 890 may be implemented at least partially as a hardware circuit, such as a field programmable gate array (FPGA), a programmable logic array (PLA), a system on chip, a system on substrate, a system on package, and an application specific integrated circuit (ASIC), or may be implemented by a hardware or firmware such as any other reasonable method of integrating or packaging the circuit, or may be implemented by any one or any combinations of the three implementation methods of software, hardware and firmware.
- FPGA field programmable gate array
- PLA programmable logic array
- ASIC application specific integrated circuit
- At least one of the training data acquisition module 810, the first probability density model building module 820, the probability density threshold value determination module 830, the test data set acquisition module 840, the second probability density distribution curve acquisition module 850, the probability density distribution measurement total score determination module 860, the abnormal value ratio measurement total score determination module 870, the virtual machine state total score determination module 880 and the virtual machine running state determination module 890 may be at least partially implemented as a computer program module.
- the computer program module when run, may perform corresponding functions.
- a virtual machine anomaly detection scoring mechanism which may make full use of characteristics of historical data and a probability density function, and design two measurement indicators to quantify a health status of the virtual machine. That is, a health condition of the virtual machine may be qualified by combining the above-mentioned two measurement indicators, so that the running state of the virtual machine may be determined quickly and intuitively.
- FIG. 9 schematically shows a structural block diagram of an electronic device suitable for implementing the above-mentioned method according to exemplary embodiments of the present disclosure.
- an electronic device 1000 includes a processor 1001, which may perform various appropriate actions and processes according to a program stored in a read-only memory (ROM) 1002 or a program loaded into a random access memory (RAM) 1003 from a storage portion 1008.
- the processor 1001 may include, for example, a general-purpose microprocessor (e.g., a CPU), an instruction provided processor and/or a related chipset and/or a dedicated-purpose microprocessor (e.g., an application specific integrated circuit (ASIC)), etc.
- the processor 1001 may further include an on-board memory for caching purposes.
- the processor 1001 may include a single processing unit or a plurality of processing units for performing different actions of the method flow according to embodiments of the present disclosure.
- the RAM 1003 stores various programs and data required for an operation of electronic device 1000.
- the processor 1001, the ROM 1002 and the RAM 1003 are connected to each other through a bus 1004.
- the processor 1001 performs various operations of the method flow according to embodiments of the present disclosure by executing a program in the ROM 1002 and/or the RAM 1003. It should be noted that the program may also be stored in one or more memories other than the ROM 1002 and the RAM 1003.
- the processor 1001 may also perform various operations of the method flow according to embodiments of the present disclosure by executing programs stored in the one or more memories.
- the electronic device 1000 may further include an input/output (I/O) interface 1005, and the input/output (I/O) interface 1005 is also connected to the bus 1004.
- the electronic device 1000 may further include one or more of following components connected to the I/O interface 1005, including: an input portion 1006 including a keyboard, a mouse, etc.; an output portion 1007 including a cathode ray tube (CRT), a liquid crystal display (LCD), etc., and a speaker, etc.; a storage portion 1008 including a hard disk, etc.; and a communication portion 1009 including a network interface card such as a LAN card, a modem, etc.
- a network interface card such as a LAN card, a modem, etc.
- the communication portion 1009 performs a communication processing via a network such as the Internet.
- a drive 1010 is also connected to the I/O interface 1005 as required.
- a removable medium 1011 such as a magnetic disk, an optical disk, a magneto-optical disk, a semiconductor memory, or the like, is installed on the drive 1010 as required, so that a computer program read therefrom may be installed into the storage portion 1008 as required.
- the present disclosure further provides a computer-readable storage medium.
- the computer-readable storage medium may be included in the device/apparatus/system described in the above-mentioned embodiments; the computer-readable storage medium may also exist alone without being assembled into the device/apparatus/system.
- the above-mentioned computer-readable storage medium carries one or more programs.
- the above-mentioned one or more programs, when executed, may implement the method according to embodiments of the present disclosure.
- the computer-readable storage medium may be a non-volatile computer-readable storage medium.
- the non-volatile computer-readable storage medium includes, but is not limited to: a portable computer disk, a hard disk, a random access memory (RAM), a read-only memory (ROM), an erasable programmable read-only memory (EPROM or a flash memory), a portable compact disk read-only memory (CD-ROM), an optical storage element, a magnetic storage element, or any suitable combination thereof.
- the computer-readable storage medium may be any tangible medium containing or storing a program, and the program may be used by or in combination with an instruction execution system, apparatus or element.
- the computer-readable storage medium may include one or more memories other than the ROM 1002 and/or the RAM 1003 and/or the ROM 1002 and the RAM 1003 described above.
- Embodiments of the present disclosure further provide a computer program product, including a computer program.
- the computer program includes a program code for performing the method shown in the flowchart.
- the program code is used to cause the computer system to implement the method provided by embodiments of the present disclosure.
- the computer program may rely on a tangible storage medium such as an optical storage element, a magnetic memory element, etc.
- the computer program may also be transmitted and distributed in a form of a signal on a network medium, downloaded and installed through the communication portion 1009, and/or installed from the removable medium 1011.
- the program code contained in the computer program may be transmitted by any suitable network medium, including but not limited to: wireless, wired, etc., or any suitable combination thereof.
- the computer program may be downloaded and installed from the network through the communication portion 1009, and/or installed from the removable medium 1011.
- the computer program when executed by the processor 1001, performs the above-mentioned functions defined in the system of embodiments of the present disclosure.
- the system, the apparatuses, devices, the modules, the units, etc. described above may be implemented by the computer program module.
- the program code for executing the computer programs provided by embodiments of the present disclosure may be written in any combination of one or more programming languages.
- the computing programs may be implemented using a high-level procedure and/or an object-oriented programming language, and/or an assembly/machine language.
- the programming language includes, but is not limited to Java, C++, python, "C" language or a similar programming language.
- the program code may be completely executed on a user computing device, partially executed on a user device, partially executed on a remote computing device, or completely executed on the remote computing device or a server.
- the remote computing device may be connected to the user computing device through any kind of network, including a local area network (LAN) or a wide area network (WAN), or may be connected to an external computing device (for example, connected through the Internet using an Internet service provider).
- LAN local area network
- WAN wide area network
- an Internet service provider for example, connected through the Internet using an Internet service provider.
- each block in the flowcharts or block diagrams may represent a module, a program segment, or part of a code.
- the above-mentioned module, program segment, or part of the code contains one or more executable instructions for realizing specified logic functions.
- functions marked in the blocks may also occur in a different order from those marked in the accompanying drawings. For example, two consecutive blocks may actually be performed in parallel, and sometimes they may be performed in a reverse order, which depends on the functions involved.
- each block in the block diagrams or flowcharts and a combination of blocks in the block diagrams or flowcharts may be implemented by a dedicated hardware-based system that performs specified functions or operations, or by a combination of a dedicated hardware and computer instructions.
Landscapes
- Engineering & Computer Science (AREA)
- Theoretical Computer Science (AREA)
- Physics & Mathematics (AREA)
- General Engineering & Computer Science (AREA)
- General Physics & Mathematics (AREA)
- Software Systems (AREA)
- Quality & Reliability (AREA)
- Mathematical Physics (AREA)
- Debugging And Monitoring (AREA)
Abstract
Description
- The present disclosure relates to a field of a cloud computing technology, and in particular, to a method and an apparatus of detecting a running state of a virtual machine based on a kernel density estimation, an electronic device, a computer-readable storage medium and a program product.
- With a continuous expansion of a cloud computing industry application field, more and more enterprises and individual users may migrate business systems thereof to a cloud platform. An expansion of scale may bring a great challenge to a security and a stability of cloud services. As a basic component of cloud computing, a stability and a reliability of a virtual machine may directly affect a normal operation of an online business. Therefore, it is of great significance to design a method capable of quickly and accurately detecting an abnormal state of the virtual machine to timely detect a potential risk and ensure a normal and orderly operation of the online business.
- A conventional virtual machine abnormal alarm is manually provided with a fixed threshold value based on experience. Once virtual machine operation data exceeds the threshold value, an alarm may be triggered, which may not have a flexibility to change with time and business. At the same time, the determination method relies too much on professionals, and requires professional operation and maintenance personnel to check each indicator of the virtual machine one by one, which may be inefficient and unreliable.
- The above-mentioned information disclosed in the section is only used to understand the background of the inventive concept of the present disclosure. Therefore, the above-mentioned information may include an information that does not constitute the prior art.
- In view of at least one aspect of the above-mentioned technical problems, a method and an apparatus of detecting a running state of a virtual machine based on a kernel density estimation, an electronic device, a computer-readable storage medium and a program product are provided.
- In an aspect, a method of detecting a running state of a virtual machine based on a kernel density estimation is provided, including:
- acquiring a training data set of at least one feature, wherein the at least one feature is configured to characterize at least one running state of the virtual machine;
- building a probability density model for the training data set of the at least one feature by using a kernel density estimation algorithm, so as to obtain a probability density distribution curve of the training data set of the at least one feature;
- determining a probability density threshold value of the training data set of the at least one feature according to the probability density model;
- acquiring a test data set of the at least one feature;
- acquiring a probability density distribution curve of the test data set of the at least one feature according to the built probability density model;
- comparing the probability density distribution curve of the training data set of the at least one feature with the probability density distribution curve of the test data set of the at least one feature to determine a probability density distribution measurement total score;
- comparing a plurality of probability density values of the test data set of the at least one feature with the probability density threshold value to determine an abnormal value ratio measurement total score;
- determining a virtual machine state total score according to the probability density distribution measurement total score and the abnormal value ratio measurement total score; and
- determining the running state of the virtual machine according to the virtual machine state total score.
- According to some exemplary embodiments, the determining a virtual machine state total score according to the probability density distribution measurement total score and the abnormal value ratio measurement total score includes:
determining the virtual machine state total score according to the probability density distribution measurement total score and the abnormal value ratio measurement total score by:
ws 1 is a weight coefficient of the probability density distribution measurement total score, and ws2 is a weight coefficient of the abnormal value ratio measurement total score. - According to some exemplary embodiments, ws1>ws2.
- According to some exemplary embodiments, the at least one feature includes a first feature, a second feature and a third feature, and the first feature, the second feature and the third feature are configured to characterize different running states of the virtual machine respectively; and the acquiring a training data set of at least one feature includes: simultaneously acquiring a first training data set of the first feature, a second training data set of the second feature, and a third training data of the third feature.
- According to some exemplary embodiments, the building a probability density model for the training data set of the at least one feature by using a kernel density estimation algorithm so as to obtain a probability density distribution curve of the training data set of the at least one feature includes: building probability density models respectively for the first training data set of the first feature, the second training data set of the second feature and the third training data set of the third feature by using the kernel density estimation algorithm, so as to obtain a first probability density distribution curve of the first training data set, a second probability density distribution curve of the second training data set and a third probability density distribution curve of the third training data set.
- According to some exemplary embodiments, the determining a probability density threshold value of the training data set of the at least one feature according to the probability density model includes: determining a first probability density threshold value of the first training data set, a second probability density threshold value of the second training data set and a third probability density threshold value of the third training data set according to the probability density distribution curve.
- According to some exemplary embodiments, the acquiring a test data set of the at least one feature includes: simultaneously acquiring a first test data set of the first feature, a second test data set of the second feature and a third test data set of the third feature.
- According to some exemplary embodiments, the acquiring a probability density distribution curve of the test data set of the at least one feature according to the built probability density model includes: respectively acquiring a first probability density distribution curve of the first test data set, a second probability density distribution curve of the second test data set and a third probability density distribution curve of the third test data set according to the built probability density model.
- According to some exemplary embodiments, the comparing the probability density distribution curve of the training data set of the at least one feature with the probability density distribution curve of the test data set of the at least one feature to determine a probability density distribution measurement total score includes:
- comparing the first probability density distribution curve of the first training data set with the first probability density distribution curve of the first test data set to determine a first probability density distribution measurement score;
- comparing the second probability density distribution curve of the second training data set with the second probability density distribution curve of the second test data set to determine a second probability density distribution measurement score; and
- comparing the third probability density distribution curve of the third training data set with the third probability density distribution curve of the third test data set to determine a third probability density distribution measurement score.
- According to some exemplary embodiments, the comparing the probability density distribution curve of the training data set of the at least one feature with the probability density distribution curve of the test data set of the at least one feature to determine a probability density distribution measurement total score includes:
determining the probability density distribution measurement total score according to the first probability density distribution measurement score, the second probability density distribution measurement score and the third probability density distribution measurement score by:
wm 1, wm2 and wm3 are weight coefficients of the first probability density distribution measurement score, the second probability density distribution measurement score, and the third probability density distribution measurement score. - According to some exemplary embodiments, the comparing a plurality of probability density values of the test data set of the at least one feature with the probability density threshold value to determine an abnormal value ratio measurement total score includes:
- comparing a plurality of probability density values of the first test data set with the first probability density threshold value to determine a first abnormal value ratio measurement score;
- comparing a plurality of probability density values of the second test data set with the second probability density threshold value to determine a second abnormal value ratio measurement score; and
- comparing a plurality of probability density values of the third test data set with the third probability density threshold value to determine a third abnormal value ratio measurement score.
- According to some exemplary embodiments, the comparing a plurality of probability density values of the test data set of the at least one feature with the probability density threshold value to determine an abnormal value ratio measurement total score includes:
determining the abnormal value ratio measurement total score according to the first abnormal value ratio measurement score, the second abnormal value ratio measurement score and the third abnormal value ratio measurement score by:
- According to some exemplary embodiments, the comparing the first probability density distribution curve of the first training data set with the first probability density distribution curve of the first test data set to determine a first probability density distribution measurement score includes: calculating a Wasserstein distance between the first probability density distribution curve of the first training data set and the first probability density distribution curve of the first test data set, and mapping the Wasserstein distance into a centesimal system to acquire the first probability density distribution measurement score; and/or,
- the comparing the second probability density distribution curve of the second training data set with the second probability density distribution curve of the second test data set to determine a second probability density distribution measurement score includes: calculating a Wasserstein distance between the second probability density distribution curve of the second training data set and the second probability density distribution curve of the second test data set, and mapping the Wasserstein distance into a centesimal system to acquire the second probability density distribution measurement score; and/or,
- the comparing the third probability density distribution curve of the third training data set with the third probability density distribution curve of the third test data set to determine a third probability density distribution measurement score includes: calculating a Wasserstein distance between the third probability density distribution curve of the third training data set and the third probability density distribution curve of the third test data set, and mapping the Wasserstein distance into a centesimal system to acquire the third probability density distribution measurement score.
- According to some exemplary embodiments, the determining a first probability density threshold value of the first training data set includes: ranking a plurality of probability density values of the first training data set of the first feature in an order of small to large; and taking the probability density value ranked at N1th as the first probability density threshold value, wherein N1 = int(10% × N10), N10 is a total number of the plurality of probability density values of the first training data set, and int represents a rounding operation; and/or,
- the determining a second probability density threshold value of the second training data set includes: ranking a plurality of probability density values of the second training data set of the second feature in an order of small to large; and taking the probability density value ranked at N2th as the second probability density threshold value, wherein N2 = int(10% × N20), N20 is a total number of the plurality of probability density values of the second training data set, and int represents a rounding operation; and/or,
- the determining a third probability density threshold value of the third training data set includes: ranking a plurality of probability density values of the third training data set of the third feature in an order of small to large; and taking the probability density value ranked at N3th as the third probability density threshold value, wherein N3 = int(10% × N30), N30 is a total number of the plurality of probability density values of the third training data set, and int represents a rounding operation.
- According to some exemplary embodiments, the comparing a plurality of probability density values of the first test data set with the first probability density threshold value to determine a first abnormal value ratio measurement score includes: calculating a proportion of a number of probability density values less than the first probability density threshold value among the plurality of probability density values of the first test data set to a total number of the plurality of probability density values of the first test data set; and mapping the proportion into a centesimal system to acquire the first abnormal value ratio measurement score; and/or,
- the comparing a plurality of probability density values of the second test data set with the second probability density threshold value to determine a second abnormal value ratio measurement score includes: calculating a proportion of a number of probability density values less than the second probability density threshold value among the plurality of probability density values of the second test data set to a total number of the plurality of probability density values of the second test data set; and mapping the proportion into a centesimal system to acquire the second abnormal value ratio measurement score; and/or,
- the comparing a plurality of probability density values of the third test data set with the third probability density threshold value to determine a third abnormal value ratio measurement score includes: calculating a proportion of a number of probability density values less than the third probability density threshold value among the plurality of probability density values of the third test data set to a total number of the plurality of probability density values of the third test data set; and mapping the proportion into a centesimal system to acquire the third abnormal value ratio measurement score.
- According to some exemplary embodiments, the determining the running state of the virtual machine according to the virtual machine state total score includes:
- determining that the virtual machine is in an abnormal running state in response to the virtual machine state total score being less than a first scoring threshold value;
- determining that the virtual machine is in a high potential abnormal state in response to the virtual machine state total score being in a first interval defined by the first scoring threshold value and a second scoring threshold value; and
- determining that the virtual machine is in a low potential abnormal state in response to the virtual machine state total score being in a second interval defined by the second scoring threshold value and a third scoring threshold value.
- According to some exemplary embodiments, the first feature is a CPU utilization, the second feature is a network receiving traffic, and the third feature is a network sending traffic.
- According to some exemplary embodiments, at least one of the acquiring a training data set of at least one feature and the acquiring a test data set of the at least one feature includes:
- collecting primary monitoring data of the virtual machine within a specified time period, wherein the primary monitoring data includes a virtual machine number, a collection timestamp, CPU usage time of the virtual machine, a network receiving traffic and a network sending traffic;
- aggregating the collected primary monitoring data according to the virtual machine number;
- extracting data of a plurality of features within a predetermined time period from the aggregated primary monitoring data; and
- fusing the data of the plurality of features according to the collection timestamp to form a feature vector.
- According to some exemplary embodiments, the method further includes:
- performing a correlation analysis on the first training data set of the first feature, the second training data set of the second feature and the third training data set of the third feature; and
- determining weight coefficients wm1, wm2 and wm3 and weight coefficients wt1, wt2 and wt3 according to a result of the correlation analysis.
- According to some exemplary embodiments, a correlation between the second training data set of the second feature and the third training data set of the third feature is greater than a correlation between the first training data set of the first feature and the second training data set of the second feature, and the correlation between the second training data set of the second feature and the third training data set of the third feature is greater than a correlation between the first training data set of the first feature and the third training data set of the third feature; and
the weight coefficient wm1 is greater than any one of the weight coefficients wm2 and wm3, and the weight coefficient wt1 is greater than any one of the weight coefficients wt2 and wt3. - According to some exemplary embodiments, the weight coefficient wm2 is greater than the weight coefficient wm3, and the weight coefficient wt2 is greater than the weight coefficient wt3.
- According to some exemplary embodiments, the determining the running state of the virtual machine according to the virtual machine state total score includes:
- determining that the virtual machine is in a good running state in response to the virtual machine state total score being in a third interval defined by the third scoring threshold value and a fourth scoring threshold value; and
- determining that the virtual machine is in an excellent running state in response to the virtual machine state total score being greater than the fourth scoring threshold value.
- In another aspect, an apparatus of detecting a running state of a virtual machine based on a kernel density estimation is provided, including:
- a training data acquisition module configured to acquire a training data set of at least one feature, wherein the at least one feature is configured to characterize at least one running state of the virtual machine;
- a first probability density model building module configured to build a probability density model for the training data set of the at least one feature by using a kernel density estimation algorithm, so as to obtain a probability density distribution curve of the training data set of the at least one feature;
- a probability density threshold value determination module configured to determine a probability density threshold value of the training data set of the at least one feature according to the probability density model;
- a test data set acquisition module configured to acquire a test data set of the at least one feature;
- a second probability density distribution curve acquisition module configured to acquire a probability density distribution curve of the test data set of the at least one feature according to the built probability density model;
- a probability density distribution measurement total score determination module configured to compare the probability density distribution curve of the training data set of the at least one feature with the probability density distribution curve of the test data set of the at least one feature to determine a probability density distribution measurement total score;
- an abnormal value ratio measurement total score determination module configured to compare a plurality of probability density values of the test data set of the at least one feature with the probability density threshold value to determine an abnormal value ratio measurement total score;
- a virtual machine state total score determination module configured to determine a virtual machine state total score according to the probability density distribution measurement total score and the abnormal value ratio measurement total score; and
- a virtual machine running state determination module configured to determine the running state of the virtual machine according to the virtual machine state total score.
- In yet another aspect, an electronic device is provided, including:
- one or more processors; and
- a storage apparatus configured to store one or more programs,
- wherein the one or more programs, when executed by the one or more processors, are configured to cause the one or more processors to implement the method as described above.
- In yet another aspect, a computer-readable storage medium having executable instructions thereon is provided, and the instructions, when executed by a processor, are configured to cause the processor to implement the method as described above.
- In yet another aspect, a computer program product including a computer program is provided, and the computer program, when executed by a processor, is configured to cause the processor to implement the method as described above.
- In order to better understand the present disclosure, the present disclosure will be described in detail according to following accompanying drawings:
-
FIG. 1 schematically shows an application scenario diagram of a method of detecting a running state of a virtual machine based on a kernel density estimation according to embodiments of the present disclosure. -
FIG. 2 schematically shows a flowchart of a method of detecting a running state of a virtual machine based on a kernel density estimation according to embodiments of the present disclosure. -
FIG. 3 schematically shows a flowchart of a step of acquiring a data set in a method of detecting a running state of a virtual machine based on a kernel density estimation according to embodiments of the present disclosure. -
FIG. 4 schematically shows a correlation between three features used in a method of detecting a running state of a virtual machine based on a kernel density estimation according to embodiments of the present disclosure. -
FIG. 5A to FIG. 5C schematically show probability density distribution curves of training data sets of three features. -
FIG. 6 schematically shows a flowchart of a process of determining a running state score of a virtual machine using a function distribution measurement. -
FIG. 7 schematically shows a flowchart of a process of determining a running state score of a virtual machine by an abnormal value ratio measurement. -
FIG. 8 shows a structural block diagram of an apparatus of detecting a running state of a virtual machine based on a kernel density estimation according to exemplary embodiments of the present disclosure. -
FIG. 9 schematically shows a structural block diagram of an electronic device suitable for implementing the above-mentioned method according to exemplary embodiments of the present disclosure. - Specific embodiments of the present disclosure will be described below in detail. It should be noted that embodiments described here are only for illustration and are not intended to limit the present disclosure. In the following descriptions, in order to provide a thorough understanding of the present disclosure, a large number of specific details are described. However, it is obvious to those skilled in the art that it is not necessary to use these specific details to implement the present disclosure. In other examples, in order to avoid confusion of the present disclosure, well-known structures, materials or methods are not specifically described.
- In the entire specification, reference to "an embodiment", "embodiments", "an example" or "examples" means that specific features, structures or characteristics described in combination with the embodiment(s) or example(s) are included in at least one embodiment of the present disclosure. Therefore, terms "in an embodiment", "in embodiments", "an example" or " examples" described in the entire specification do not necessarily refer to the same embodiment or example. In addition, the specific features, structures or characteristics may be combined in one or more embodiments or examples in any suitable combination and/or sub-combination. In addition, those skilled in the art should understand that a term "and/or" used herein includes any and all combinations of one or more related listed items.
- Terms used herein are only intended to describe specific embodiments and are not intended to limit the present disclosure. Terms "include", "comprise", "contain", etc. used herein indicate the presence of the described features, steps, operations and/or components, but do not exclude the presence or addition of one or more other features, steps, operations and/or components.
- All terms (including technical and scientific terms) used herein have meanings generally understood by those of ordinary skilled in the art, unless otherwise defined. It should be noted that the terms used herein should be interpreted as having the meaning consistent with the context of the present disclosure, and should not be interpreted in an idealized or overly rigid manner.
-
FIG. 1 schematically shows an application scenario diagram of a method of detecting a running state of a virtual machine based on a kernel density estimation according to embodiments of the present disclosure. - As shown in
FIG. 1 , anapplication scenario 100 according to embodiments of the present disclosure may include aterminal device 101, aserver 102, acloud 103 and anetwork 104. - Cloud computing is a kind of distributed computing, which means that a huge data computing processing program is decomposed into numerous small programs through a network "cloud", and then the small programs are processed and analyzed through a system composed of a plurality of servers to obtain a result and return the result to a user. In an early stage of the cloud computing, the cloud computing mainly performs a simple distributed computing to solve a task distribution, and consolidates computing results. At this time, the cloud computing is also called a grid computing. A processing of tens of thousands of data may be completed in a very short time (such as a few seconds) through the technology, so that a powerful network service may be achieved. With a development of technology, a cloud service at this stage is not only a kind of distributed computing, but also a result of a mixed evolution and leap of computer technologies such as distributed computing, utility computing, load balancing, parallel computing, network storage, hot backup redundancy, virtualization, etc.
- The cloud computing may be classified according to a service type. At present, in the industry, the cloud computing may be classified into three categories from bottom to top according to the service type: (1) an Infrastructure as a Service (IaaS for short), which provides the user with a hardware infrastructure service, that is, computing resources, including a virtual server resource, a storage resource, a network bandwidth resource, etc.; (2) a Platform as a Service (PaaS for short), which provides the user with a platform on which an application and a service are built through the Internet, that is, an on-demand development environment is provided for developing, testing and managing a software application; and (3) a Software as a Service (SaaS for short), which provides the user with an on-demand software paid application, a cloud computing provider host and a manage software application, and allows the user to be connected to the applications and to access the applications through the Internet. As shown in
FIG. 1 , a plurality ofservers 102 may be provided in thecloud 103, and the plurality ofservers 102 may provide various services. Generally, a cloud platform management system is provided in thecloud 103, which is responsible for a rapid scheduling and a centralized management of resources provided by the plurality ofservers 102. - Virtualization is one of basic technologies of the cloud computing. In a virtualization technology, a physical resource is virtualized and thus converted into a virtual resource that is easily managed. The virtualization technology includes a hardware virtualization and a software virtualization. The cloud computing may encapsulate a hardware resource and a software resource using the virtualization technology, and provide the user with a required service through the Internet. In the cloud computing, main objectives of the virtualization include a CPU resource, a memory resource, a storage resource, a network bandwidth resource, etc. The resources are usually provided to the user in a form of the virtual machine, and may be operated by providing a specific interface, which may facilitate use of the resources by the application or the user for a certain application. A
server 102 may be provided with at least one virtual machine, for example, a plurality of virtual machines. On the surface, the virtual machines are independent servers. However, in fact, the virtual machines share CPU, a memory, a hardware resource, a network resource, etc. of thephysical server 102. In the present disclosure, thephysical machine 102 may be called "Host", and the virtual machine may also be called "Guest". - The
network 104 is a medium for providing a communication link between theterminal device 101 and thecloud 103. Thenetwork 104 may include various connection types, such as wired or wireless communication links, optical fiber cables, etc. - The
terminal device 101 used by a user may interact with thecloud 103 through thenetwork 104, so that the user may use various applications, data or services in thecloud 103. - For example, the
terminal devices 101 may be various electronic devices having display screens and capable of installing application software, including but not limited to smartphones, tablet computers, laptop computers, desktop computers, etc. - It should be noted that the method provided by embodiments of the present disclosure may be performed by the
server 102. Accordingly, the apparatus provided by embodiments of the present disclosure may be provided in theserver 102. The method provided by embodiments of the present disclosure may also be performed by a server or server cluster different from theserver 102 and capable of communicating with theterminal device 101 and/or theserver 102. Accordingly, the apparatus provided by embodiments of the present disclosure may also be provided in the server or server cluster different from theserver 102 and capable of communicating with theterminal device 101 and/or theserver 102. - It should be understood that the numbers of terminal devices, networks and servers in
FIG. 1 are only schematic. According to implementation needs, any number of terminal devices, networks and servers may be provided. - At present, in some related technologies, technologies such as data mining, machine learning, etc. are applied to a virtual machine anomaly detection. The inventors have found through research that, due to use of a large number of monitoring information generated in an operation of the virtual machine as training indicators have relatively a high information dimension and frequency, it is difficult to convert the information into labelable data and thus a lot of manpower, time and professional knowledge personnel are required; an abnormal situation of the virtual machine is relatively complex, and due to a limitation of personnel, a label error or a missing label may occur; an abnormal condition of the virtual machine accounts for a small number, and positive and negative samples are seriously unbalanced. Therefore, in embodiments of the present disclosure, it is proposed to apply an unsupervised machine learning algorithm to the virtual machine anomaly detection.
- Further, the unsupervised algorithm may be roughly divided into two categories: one is a clustering algorithm based on similarity measurements such as a distance and a density between samples, and the other is a nonparametric algorithm based on the kernel density estimation. The inventors have found through research that the clustering algorithm based on the similarity measurements such as the distance and the density between samples may be applied to the virtual machine anomaly detection. For example, an anomaly indicator of the virtual machine may be calculated by weighting results of algorithms such as LOF (Local Abnormal value Factor algorithm), IFOREST (Isolated Forest algorithm), DBSCAN (Density-Based Spatial Clustering of Applications with Noise algorithm), etc. In this case, the algorithm has a very high time complexity with an increase of training samples, which may not be conducive to an online processing, and a distance measurement method and an initial point of clustering are difficult to be selected, which may have a great impact on a final result.
- Through a comparative analysis, another unsupervised machine learning technology - a kernel density estimation algorithm is used in embodiments of the present disclosure. The algorithm describes characteristics and distribution of data from the data itself without manually selecting the initial point and the distance measurement method, which may reduce an error of human intervention. An amount of calculation during a model test is moderate. A probability density function obtained by training may be displayed in a form of a curve distribution, which may facilitate a comparison of results and fit the description of relevant resource indicators of the virtual machine. Therefore, an anomaly detection is performed on the virtual machine by using the kernel density estimation algorithm, a warning threshold value may be obtained through a model result, and a health score of the virtual machine within a time window may be calculated in real time through a series of mechanisms, so as to replace a manual threshold value setting and a manual daily operation and maintenance patrol, and clearly display the anomaly indicator of the virtual machine, so that an intelligent operation and maintenance may be provided and manpower may be liberated.
-
FIG. 2 schematically shows a flowchart of a method of detecting a running state of a virtual machine based on a kernel density estimation according to embodiments of the present disclosure. As shown inFIG. 2 , amethod 200 of detecting a running state of a virtual machine based on a kernel density estimation according to embodiments of the present disclosure may include operations S210 to S290, and the method of detecting the running state of the virtual machine based on the kernel density estimation may be performed by theserver 102. - It should be noted that, according to some embodiments of the present disclosure, some steps or operations of the
method 200 may be performed individually or in combination, and may be performed in parallel or in sequence, which is not limited to a specific operation sequence shown inFIG. 2 . For example, at least some operations in operations S210 to S290 may be performed in parallel, in sequence or in a reverse order. - In operation S210, a training data set of at least one feature is acquired, wherein the at least one feature is used to characterize at least one running state of the virtual machine.
- In operation S220, a probability density model is built for the training data set of the at least one feature by using a kernel density estimation algorithm, so as to obtain a probability density distribution curve of the training data set of the at least one feature.
- In operation S230, a probability density threshold value of the training data set of the at least one feature is determined according to the probability density model.
- In operation S240, a test data set of the at least one feature is acquired.
- In operation S250, a probability density distribution curve of the test data set of the at least one feature is acquired according to the built probability density model.
- In operation S260, the probability density distribution curve of the training data set of the at least one feature is compared with the probability density distribution curve of the test data set of the at least one feature to determine a probability density distribution measurement total score.
- In operation S270, a plurality of probability density values of the test data set of the at least one feature are compared with the probability density threshold value to determine an abnormal value ratio measurement total score.
- In operation S280, a virtual machine state total score is determined according to the probability density distribution measurement total score and the abnormal value ratio measurement total score.
- In operation S290, the running state of the virtual machine is determined according to the virtual machine state total score.
- In embodiments of the present disclosure, a virtual machine anomaly detection scoring mechanism is provided, which may make full use of characteristics of historical data and a probability density function, and design two measurement indicators to quantify a health status of the virtual machine. That is, a health condition of the virtual machine may be qualified by combining the above-mentioned two measurement indicators, so that the running state of the virtual machine may be determined quickly and intuitively.
- In some exemplary embodiments of the present disclosure, the first feature is a CPU utilization, the second feature is a network receiving traffic, and the third feature is a network sending traffic. It should be noted that in following exemplary embodiments, the technical solution of the present disclosure will be described in detail with by taking the CPU utilization, the network receiving traffic and the network sending traffic as an example. However, embodiments of the present disclosure are not limited to this, that is, the at least one feature may include other features used to characterize the at least one running state of the virtual machine.
-
FIG. 3 schematically shows a flowchart of a step of acquiring a data set in a method of detecting a running state of a virtual machine based on a kernel density estimation according to embodiments of the present disclosure. The step of acquiring the data set may be at least one of the above-mentioned operations S210 and S240. Referring toFIG. 3 , in embodiments of the present disclosure, the acquired data set may include operations S310 to S340. - In operation S310, primary monitoring data of the virtual machine within a specified time period is collected, wherein the primary monitoring data includes a virtual machine number, a collection timestamp, CPU usage time of the virtual machine, a network receiving traffic and a network sending traffic.
- In embodiments of the present disclosure, the collected data set is derived from monitoring data of each virtual machine captured by Prometheus during an actual running on site. For example, the CPU utilization rate, the network receiving traffic and the network sending traffic that may reflect the running state of the virtual machine may be selected, and initial monitoring data tables for storing three resource indicators are respectively acquired from a database to complete a data collection. Specifically, Prometheus-Exporter may be deployed on the at least one virtual machine, running monitoring data of the virtual machine may be captured through the Prometheus deployed on the virtual machine, and the captured data may be stored in InfluxDB. The primary monitoring data of the virtual machine collected by the Prometheus is extracted from the InfluxDB. For example, the primary monitoring data includes: a virtual machine number, a collection timestamp, indicator values (e.g., the CPU usage time of the virtual machine, the network receiving traffic, the network sending traffic, etc.), an indicator working mode, a port, a collection service, etc. For example, a timestamp interval may be timed in seconds. The data set may be collected within the specified time period (e.g., a week). For another example, specified time periods of all virtual machines may be from 8 a.m. to 17 p.m.
- It should be noted that, for the Prometheus serving as a new generation of a cloud native monitoring system, more than 650 contributors participate in a research and development of the Prometheus and more than 120 third-party integrations are provided. Exporter may expose endpoints of a monitoring data collection to Prometheus Server in a form of an HTTP service, and the Prometheus Server may obtain monitoring data required to be collected by accessing the endpoints provided by the Exporter. The InfluxDB is an open-source database for storing and analyzing time series data. Main characteristics of the InfluxDB include: a built-in HTTP interface; data being markable; SQL-like query statements; a simple installation management and a high efficiency in reading and writing data; queryable in real time, and data being easily queried immediately by indexing when being written.
- In operation S320, the collected primary monitoring data is aggregated according to the virtual machine number.
- In operation S330, data of a plurality of features within a predetermined time period is extracted from the aggregated primary monitoring data.
- In operation S340, the data of the plurality of features are fused according to the collection timestamp to form a feature vector.
- In embodiments of the present disclosure, operations S320 to S340 involve a building of a feature engineering. That is, the above-mentioned collected primary monitoring data may not be directly used to build a model, and secondary performance indicators required for modeling need to be further extracted from the primary monitoring data as model input features, including the CPU utilization, the network receiving traffic, and the network sending traffic as modeling indicators. The secondary performance indicators may be further standardized to complete the building of the feature engineering.
- Specifically, the collected primary monitoring data is aggregated according to the virtual machine number. For example, the primary monitoring data may include data of the plurality of virtual machines. In the operation, the primary monitoring data is aggregated according to the virtual machine number in the data, so that the primary monitoring data of a same virtual machine may be aggregated together. Then, three secondary performance indicators may be extracted from the aggregated initial monitoring data for each virtual machine within the predetermined time period (e.g., every 20 seconds) according to an equation for computing the CPU utilization and a network traffic in PromQL. Then, a feature fusion may be performed on the extracted three secondary performance indicators (i.e., the CPU utilization, the network receiving traffic, and the network sending traffic) according to the time stamp to form the feature vector. For example, a feature vector may include three elements, that is, the CPU utilization, the network receiving traffic, and the network sending traffic. Optionally, data cleaning may also be performed to remove an influence of null and extreme values on the modeling and complete the building of the feature engineering.
- It should be noted that the PromQL (Prometheus Query Language) is a built-in data query language of the Prometheus, which provides a support for a rich query, an aggregation and a logical operation capability of the time series data. The PromQL is widely used in daily applications of the Prometheus, including data query, visualization and alarm processing. After the Prometheus collects corresponding monitoring indicator sample data through the Exporter, monitoring sample data may be queried through the PromQL.
- After completing the building of the feature engineering, the feature vector may be used for the modeling. In embodiments of the present disclosure, three models are built from three dimensions (that is, the first feature, the second feature, and the third feature), and a final abnormal conclusion is an overall conclusion obtained by summarizing results of the three models. In order to further rationalize a weight distribution of each dimension when the overall conclusion is obtained, a correlation between the dimensions of the built feature engineering may be analyzed. That is, a correlation analysis is performed on the first training data set of the first feature, the second training data set of the second feature and the third training data set of the third feature.
-
FIG. 4 schematically shows a correlation between three features used in a method of detecting a running state of a virtual machine based on a kernel density estimation according to embodiments of the present disclosure. As shown inFIG. 4 , three indicators are provided in abscissa and ordinate respectively, where cpu_use represents the CPU utilization, receive_net_use represents the network receiving traffic, and sent_net_use represents the network sending traffic. Each block represents a pairwise correlation between abscissa indicators and ordinate indicators. Color is a measurement of a correlation size. A correlation between the color and a value is shown in a legend on the right. The lighter the color, the higher the correlation, and the darker the color, the lower the correlation. The value in the block represents the pairwise correlation between the abscissa indicators and the ordinate indicators. For example, a value "-0.023" in a block in the first row and the second column means that the CPU utilization and the network receiving traffic have a low correlation and have a negative correlation therebetween. A value "0.59" in a block in the second row and the third column means that the network receiving traffic and the network sending traffic have a high correlation and have a positive correlation therebetween. It can be seen fromFIG. 4 that the network receiving traffic and the network sending traffic have a high correlation, and the CPU utilization and other two indicators have a low correlation. - In embodiments of the present disclosure, referring to the above-mentioned operations S220 and S250, the probability density model is built using the kernel density estimation algorithm, so as to obtain the probability density distribution curve of the training data set and the probability density distribution curve of the test data set. The curve serves as one of scoring indicators for a subsequent measurement of the test data set. Specifically, in embodiments of the present disclosure, in a process of modeling using the kernel density estimation algorithm, probability density models are built for three dimensional features respectively to obtain the probability density distribution curve of each dimension in the training data set and the test data set. The curve serves as one of scoring indicators for the subsequent measurement of the test data set, and then a reasonable probability density threshold value for each model is calculated as another indicator for the subsequent measurement of the test data set.
- In embodiments of the present disclosure, a built single-dimension model may model more accurately for each dimension indicator itself to obtain an accurate detection result. A final detection score of the virtual machine is derived from an integration of all single-dimension results, so that an accuracy of the final detection score may be further improved. At the same time, the single-dimension model is more convenient for operation and maintenance personnel to know exactly which indicator causes an abnormality of the virtual machine, and a result obtained is clearer and more interpretable.
- For example, in the above-mentioned operation S210, the acquiring a training data set of at least one feature includes: simultaneously acquiring a first training data set of the first feature (e.g., the CPU utilization), a second training data set of the second feature (e.g., the network receiving traffic), and a third training data set of the third feature (e.g., the network sending traffic).
- In the above-mentioned operation S220, the building a probability density model for the training data set of the at least one feature by using a kernel density estimation algorithm so as to obtain a probability density distribution curve of the training data set of the at least one feature includes: building probability density models respectively for the first training data set of the first feature, the second training data set of the second feature and the third training data set of the third feature by using the kernel density estimation algorithm, so as to obtain a first probability density distribution curve of the first training data set, a second probability density distribution curve of the second training data set and a third probability density distribution curve of the third training data set.
-
FIG. 5A to FIG. 5C schematically show probability density distribution curves of training data sets of three features. That is,FIG. 5A shows the first probability density distribution curve of the first training data set. InFIG. 5A , the abscissa is a value of the CPU utilization in the first training data set, and the ordinate is a Gaussian kernel density value.FIG. 5B shows the second probability density distribution curve of the second training data set. InFIG. 5B , the abscissa is a value (in MB) of the network receiving traffic in the second training data set, and the ordinate is a Gaussian kernel density value.FIG. 5C shows the third probability density distribution curve of the third training data set. InFIG. 5C , the abscissa is a value (in MB) of the network sending traffic in the third training data set, and the ordinate is a Gaussian kernel density value. - It should be noted that the kernel density estimation algorithm is a nonparametric estimation algorithm, which may obtain a better model than a parameter estimation by fitting a distribution from characteristics and properties of the data itself without adding prior knowledge. An essence of the kernel density estimation is to generate a density function from discrete data. Taking a given sample xt as a center point, and taking a distance between all points in a window range and the center point as a weight, and a final density function value is a weighted sum by estimated y values of each x in the window. Equation (1) is expressed as:

where K is a kernel function, and the integral is 1 and non-negative. For example, a smooth curve may be obtained using a Gaussian kernel function; h is a bandwidth, which is a size of a selection window. Too small window may cause an overfitting, and too large window may cause the curve to be too smooth to show a fluctuation. Therefore, a grid parameter optimization is used for each dimension to obtain an optimal bandwidth for each dimension. - In the above-mentioned operation S240, the acquiring a test data set of the at least one feature includes: simultaneously acquiring a first test data set of the first feature, a second test data set of the second feature and a third test data set of the third feature.
- In the above-mentioned operation S250, the acquiring a probability density distribution curve of the test data set of the at least one feature according to the built probability density model includes: respectively acquiring a first probability density distribution curve of the first test data set, a second probability density distribution curve of the second test data set and a third probability density distribution curve of the third test data set according to the built probability density model.
- In embodiments of the present disclosure, in the above-mentioned operation S230, the determining a probability density threshold value of the training data set of the at least one feature according to the probability density model includes: determining a first probability density threshold value of the first training data set, a second probability density threshold value of the second training data set and a third probability density threshold value of the third training data set according to the probability density distribution curve. In other words, a reasonable probability density threshold value is calculated for each feature as another indicator for the subsequent measurement of the test data set.
- In embodiments of the present disclosure, a running state score of the virtual machine is determined from two measurement indicators. The two measurement indicators include a function distribution measurement and an abnormal value ratio measurement. The function distribution measurement means that a distribution difference between the probability density distribution curve obtained from the test data set and the probability density distribution curve obtained from the training data set is calculated to indicate a possibility of abnormality of to-be-tested data. The abnormal value ratio measurement means that a proportion of abnormal values within a threshold value range in the test data set is calculated to indicate a probability of abnormality of to-be-tested data. Data used in the distribution curve of the training data set is resource use data during most of a normal operation of the virtual machine, which provides a certain reference value. The greater a difference between a distribution of the test data set and a distribution of the training data set, the higher the probability of the abnormality and the lower the score.
- Next, a process of determining the running state score of the virtual machine will be described in detail in combination with the accompanying drawings and two measurement indicators.
-
FIG. 6 schematically shows a flowchart of a process of determining a running state score of a virtual machine using a function distribution measurement.FIG. 7 schematically shows a flowchart of a process of determining a running state score of a virtual machine by an abnormal value ratio measurement. - Referring to
FIG. 6 , the above-mentioned operations S260 may include sub-operations S2601 to S2604. - In sub-operation S2601, the first probability density distribution curve (as shown in
FIG. 5A ) of the first training data set is compared with the first probability density distribution curve of the first test data set to determine a first probability density distribution measurement score. - For example, in sub-operation S2601, a Wasserstein distance between the first probability density distribution curve of the first training data set and the first probability density distribution curve of the first test data set may be calculated, and the Wasserstein distance may be mapped into a centesimal system (e.g., may be mapped according to a mapping relationship in Table 1) to acquire the first probability density distribution measurement score.
- In sub-operation S2602, the second probability density distribution curve (as shown in
FIG. 5B ) of the second training data set is compared with the second probability density distribution curve of the second test data set to determine a second probability density distribution measurement score. - For example, in sub-operation S2602, a Wasserstein distance between the second probability density distribution curve of the second training data set and the second probability density distribution curve of the second test data set may be calculated, and the Wasserstein distance may be mapped into a centesimal system (e.g., may be mapped according to the mapping relationship in Table 1) to acquire the second probability density distribution measurement score.
- In sub-operation S2603, the third probability density distribution curve (as shown in
FIG. 5C ) of the third training data set is compared with the third probability density distribution curve of the third test data set to determine a third probability density distribution measurement score. - For example, in sub-operation S2603, a Wasserstein distance between the third probability density distribution curve of the third training data set and the third probability density distribution curve of the third test data set may be calculated, and the Wasserstein distance may be mapped into a centesimal system (e.g., may be mapped according to the mapping relationship in Table 1) to acquire the third probability density distribution metric score.
- It should be noted that the Wasserstein distance measures a distance between two probability distributions. The Wesserstein distance is also called an Earth-Mover distance.
Table 1 Mapping relationship between Wasserstein distance and centesimal system Wasserstein distance Score in centesimal system dis_was < 1 Floor(int((1-dis_was)*100) 1=<dis_was< 2 Floor(int((2-dis_was)/2*100) 2=<dis_was< 3 Floor(int((3-dis_was)/3*100) 3=<dis_was< 4 Floor(int((4-dis_was)/4*100) - In the table, dis_was represents the Wasserstein distance, and an int function and a floor function represent rounding. The int function directly truncates a decimal part, and the floor function obtains an integer closest to original number but less than the original number.
- In sub-operation S2604, the probability density distribution measurement total score is determined according to the first probability density distribution measurement score, the second probability density distribution measurement score and the third probability density distribution measurement score by:

wm 1, wm2 and wm3 are weight coefficients of the first probability density distribution measurement score, the second probability density distribution measurement score, and the third probability density distribution measurement score. - In embodiments of the present disclosure, the weight coefficients wm1, wm2 and wm3 are determined according to a result of the correlation analysis. For example, in the above-mentioned correlation analysis, the network receiving traffic and the network sending traffic have a high correlation, and the CPU utilization and other two indicators have a low correlation. Therefore, the weight coefficient wm1 of the first probability density distribution measurement score is greater than any one of the weight coefficient wm2 of the second probability density distribution measurement score and the weight coefficient wm3 of the third probability density distribution measurement score. In addition, in embodiments of the present disclosure, more attention may be paid to the network receiving traffic than the network sending traffic. Therefore, the weight coefficient wm2 of the second probability density distribution measurement score is greater than the weight coefficient wm3 of the third probability density distribution measurement score.
- For example, wm1 may be 0.5, wm2 may be 0.3, and wm3 may be 0.2. In this way, the above-mentioned equation (2) may be changed into:

- In embodiments of the present disclosure, samples in a sampling time window (which may be fine-grained one-day data in seconds, or coarse-grained one-day data per hour) are tested. After the feature engineering is completed, a probability density distribution in each dimension is obtained on three probability density models, and a Wasserstein distance between the probability density distribution and a probability density distribution of training samples is calculated. The Wasserstein distance is an indicator for measuring a difference between two distributions. The smaller a value of the Wasserstein distance represents that the closer a distribution of test samples and a distribution of the training samples. The value of the Wasserstein distance value is mapped into the centesimal system. The mapping relationship is shown in Table 1. Therefore, a score of the function distribution difference measurement may be obtained in each dimension, and a total score may be obtained by combining three scores. In this way, a built single-dimension model may model more accurately for each dimension indicator itself to obtain an accurate detection result. A final detection score of the virtual machine is derived from an integration of all single-dimension results, so that an accuracy of a final detection score may be further improved. At the same time, the single-dimension model is more convenient for operation and maintenance personnel to know exactly which indicator causes an abnormality of the virtual machine, and a result obtained is clearer and more interpretable.
- Referring to
FIG. 7 , the above-mentioned operation S270 may include sub-operations S2701 to S2704. - In
sub-operation S270 1, a plurality of probability density values of the first test data set are compared with the first probability density threshold value to determine a first abnormal value ratio measurement score. - For example, the determining a first probability density threshold value of the first training data set includes: ranking a plurality of probability density values of the first training data set of the first feature in an order of small to large; and taking the probability density value ranked at N1th as the first probability density threshold value, wherein N1 = int(10% × N10), N10 is a total number of the plurality of probability density values of the first training data set, and int represents a rounding operation.
- Specifically, in sub-operation S2701, a proportion of a number of probability density values less than the first probability density threshold value among the plurality of probability density values of the first test data set to a total number of the plurality of probability density values of the first test data set is calculated; and the proportion is mapped into a centesimal system (e.g., according to a mapping relationship in Table 2) to acquire the first abnormal value ratio measurement score.
- In sub-operation S2702, a plurality of probability density values of the second test data set are compared with the second probability density threshold value to determine a second abnormal value ratio measurement score.
- For example, the determining a second probability density threshold value of the second training data set includes: ranking a plurality of probability density values of the second training data set of the second feature in an order of small to large; and taking the probability density value ranked at N2th as the second probability density threshold value, wherein N2 = int(10% × N20), N20 is a total number of the plurality of probability density values of the second training data set, and int represents a rounding operation.
- Specifically, in sub-operation S2702, a proportion of a number of probability density values less than the second probability density threshold value among the plurality of probability density values of the second test data set to a total number of the plurality of probability density values of the second test data set is calculated; and the proportion is mapped into a centesimal system (e.g., according to the mapping relationship in Table 2) to acquire the second abnormal value ratio measurement score.
- In sub-operation S2703, a plurality of probability density values of the third test data set are compared with the third probability density threshold value to determine a third abnormal value ratio measurement score.
- For example, the determining a third probability density threshold value of the third training data set includes: ranking a plurality of probability density values of the third training data set of the third feature in an order of small to large; and taking the probability density value ranked at N3th as the third probability density threshold value, wherein N3 = int(10% × N30), N30 is a total number of the plurality of probability density values of the third training data set, and int represents a rounding operation.
- Specifically, in sub-operation S2703, a proportion of a number of probability density values less than the third probability density threshold value among the plurality of probability density values of the third test data set to a total number of the plurality of probability density values of the third test data set is calculated; and the proportion is mapped into a centesimal system (e.g., according to the mapping relationship in Table 2) to acquire the third abnormal value ratio measurement score.
Table 2 Mapping relationship between threshold value and centesimal system Proportion below density threshold value Score in centesimal system percent < =10% floor((1-percent)*100) 10% <percent < =20% floor((1-percent)*100*0.9) 20% <percent < =30% floor((1-percent)*100*0.8) 30% <percent < =50% floor((1-percent)*100*0.6) 50% <percent < 70% floor((1-percent)*100*0.4) 70% <percent floor((1-percent)*100*0.2) - In the table, percent represents a proportion of density values below a density threshold value in the test data set, and a floor function represents rounding. The floor function obtains an integer closest to original number but less than the original number.
- In sub-operation S2704, the abnormal value ratio measurement total score is determined according to the first abnormal value ratio measurement score, the second abnormal value ratio measurement score and the third abnormal value ratio measurement score by:

- In embodiments of the present disclosure, the weight coefficients wt1, wt2 and wt3 are determined according to the result of the correlation analysis. For example, in the above-mentioned correlation analysis, the network receiving traffic and the network sending traffic have a high correlation, and the CPU utilization and other two indicators have a low correlation. Therefore, the weight coefficient wt1 of the first abnormal value ratio measurement score is greater than any one of the weight coefficient wt2 of the second abnormal value ratio measurement score and the weight coefficient wt3 of the third abnormal value ratio measurement score. In addition, in embodiments of the present disclosure, more attention may be paid to the network receiving traffic than the network sending traffic. Therefore, the weight coefficient wt2 of the second abnormal value ratio measurement score is greater than the weight coefficient wt3 of the third abnormal value ratio measurement score.
- For example, wt1 may be 0.5, wt2 may be 0.3, and wt3 may be 0.2. In this way, the above-mentioned equation (3) may be changed into:

- In embodiments of the present disclosure, since the training data set is not labeled, a small amount of abnormal data may exist, and a proportion of abnormal values in a historical manual statistic evaluated by professionals may be about 10%. In the embodiments, it is determined that the virtual machine is in an abnormal state when a probability density value obtained in a training model is low. The low probability density value means that a value near a resource utilization has a low probability of occurrence, that is, the maximum or minimum value, and has a small frequency of occurrence. Therefore, the probability density values of each dimension obtained by training are ranked in an ascending order, and the probability density value ranked at TOP N=[int (10% * total probability density)] is extracted as a threshold value warning line. The higher a proportion of probability density values of statistical test samples less than a warning interval, the greater a proportion of abnormality of the test sample, and the less a score of the virtual machine.
- In embodiments of the present disclosure, in the above-mentioned operation S280, the determining a virtual machine state total score according to the probability density distribution measurement total score and the abnormal value ratio measurement total score includes: determining the virtual machine state total score according to the probability density distribution measurement total score and the abnormal value ratio measurement total score by:

ws 1 is a weight coefficient of the probability density distribution measurement total score, and ws2 is a weight coefficient of the abnormal value ratio measurement total score. - For example, since a threshold value set for the abnormal value ratio is relatively sensitive, which may have a great impact on a result, in order to reduce an error, an assigned weight of results of two measurement indicators may be ws1>ws2. For example, ws1 may be 0.6, and ws2 may be 0.4. In this way, the above-mentioned equation (4) may be changed into:

- In embodiments of the present disclosure, in the above-mentioned operation S290, the determining the running state of the virtual machine according to the virtual machine state total score includes: determining that the virtual machine is in an abnormal running state in response to the virtual machine state total score being less than a first scoring threshold value; determining that the virtual machine is in a high potential abnormal state in response to the virtual machine state total score being in a first interval defined by the first scoring threshold value and a second scoring threshold value; and determining that the virtual machine is in a low potential abnormal state in response to the virtual machine state total score being in a second interval defined by the second scoring threshold value and a third scoring threshold value.
- Optionally, the determining the running state of the virtual machine according to the virtual machine state total score includes: determining that the virtual machine is in a good running state in response to the virtual machine state total score being in a third interval defined by the third scoring threshold value and a fourth scoring threshold value; and determining that the virtual machine is in an excellent running state in response to the virtual machine state total score being greater than the fourth scoring threshold value.
- For example, the following table 3 may be created:
Table 3 Virtual machine anomaly indicators ss Running state of virtual machine Above 90 Excellent 80 to 90 Good 70 to 80 Low potential abnormality 60 to 70 High potential abnormality Below 60 Abnormal - That is, when the virtual machine state total score is below 60 points, it is determined that the virtual machine is in the abnormal running state; when the virtual machine state total score is in a range of 60 points to 70 points, it is determined that the virtual machine is in the high potential abnormal state; when the virtual machine state total score is in a range of 70 points to 80 points, it is determined that the virtual machine is in the low potential abnormal state; when the virtual machine state total score is in a range of 80 points to 90 points, it is determined that the virtual machine is in the good running state; and when the virtual machine state total score is above 90 points, it is determined that the virtual machine is in the excellent running state.
- Based on the above-mentioned method of detecting the running state of the virtual machine based on the kernel density estimation, embodiments of the present disclosure further provide an apparatus of detecting a running state of a virtual machine based on a kernel density estimation. The apparatus will be described below in detail with reference to
FIG. 8 . -
FIG. 8 shows a structural block diagram of an apparatus of detecting a running state of a virtual machine based on a kernel density estimation according to exemplary embodiments of the present disclosure. - As shown in
FIG. 8 , anapparatus 800 of detecting a running state of a virtual machine based on a kernel density estimation includes a trainingdata acquisition module 810, a first probability densitymodel building module 820, a probability density thresholdvalue determination module 830, a test dataset acquisition module 840, a second probability density distributioncurve acquisition module 850, a probability density distribution measurement totalscore determination module 860, and an abnormal value ratio measurement totalscore determination module 870, a virtual machine state totalscore determination module 880 and a virtual machine runningstate determination module 890. - The training
data acquisition module 810 is used to acquire a training data set of at least one feature, wherein the at least one feature is used to characterize at least one running state of the virtual machine. In some exemplary embodiments, the trainingdata acquisition module 810 may be used to perform the above-mentioned operation S210 and a sub-operation thereof, which will not be repeated here. - The first probability density
model building module 820 is used to build a probability density model for the training data set of the at least one feature by using a kernel density estimation algorithm, so as to obtain a probability density distribution curve of the training data set of the at least one feature. In some exemplary embodiments, the first probability densitymodel building module 820 may be used to perform the above-mentioned operation S220 and a sub-operation thereof, which will not be repeated here. - The probability density threshold
value determination module 830 is used to determine a probability density threshold value of the training data set of the at least one feature according to the probability density model. In some exemplary embodiments, the probability density thresholdvalue determination module 830 may be used to perform the above-mentioned operation S230 and a sub-operation thereof, which will not be repeated here. - The test data set
acquisition module 840 is used to acquire a test data set of the at least one feature. In some exemplary embodiments, the test data setacquisition module 840 may be used to perform the above-mentioned operation S240 and a sub-operation thereof, which will not be repeated here. - The second probability density distribution
curve acquisition module 850 is used to acquire a probability density distribution curve of the test data set of the at least one feature according to the constructed probability density model. In some exemplary embodiments, the second probability density distributioncurve acquisition module 850 may be used to perform the above-mentioned operation S250 and a sub-operation thereof, which will not be repeated here. - The probability density distribution measurement total
score determination module 860 is used to compare the probability density distribution curve of the training data set of the at least one feature with the probability density distribution curve of the test data set of the at least one feature to determine a probability density distribution measurement total score. In some exemplary embodiments, the probability density distribution measurement totalscore determination module 860 may be used to perform the above-mentioned operation S260 and a sub-operation thereof, which will not be repeated here. - The abnormal value ratio measurement total
score determination module 870 is used to compare a plurality of probability density values of the test data set of the at least one feature with the probability density threshold value to determine an abnormal value ratio measurement total score. In some exemplary embodiments, the abnormal value ratio measurement totalscore determination module 870 may be used to perform the above-mentioned operation S270 and a sub-operation thereof, which will not be repeated here. - The virtual machine state total
score determination module 880 is used to determine a virtual machine state total score according to the probability density distribution measurement total score and the abnormal value ratio measurement total score. In some exemplary embodiments, the virtual machine state totalscore determination module 880 may be used to perform the above-mentioned operation S280 and a sub-operation thereof, which will not be repeated here. - The virtual machine running
state determination module 890 is used to determine the running state of the virtual machine according to the virtual machine state total score. In some exemplary embodiments, the virtual machine runningstate determination module 890 may be used to perform the above-mentioned operation S290 and a sub-operation thereof, which will not be repeated here. - According to embodiments of the present disclosure, any number of modules in the training
data acquisition module 810, the first probability densitymodel building module 820, the probability density thresholdvalue determination module 830, the test data setacquisition module 840, the second probability density distributioncurve acquisition module 850, the probability density distribution measurement totalscore determination module 860, the abnormal value ratio measurement totalscore determination module 870, the virtual machine state totalscore determination module 880 and the virtual machine runningstate determination module 890 may be combined into a module to be implemented, or any one of the modules may be divided into a plurality of modules. Alternatively, at least some functions of one or more of the modules may be combined with at least some functions of other modules and implemented in a module. According to embodiments of the present disclosure, at least one of the trainingdata acquisition module 810, the first probability densitymodel building module 820, the probability density thresholdvalue determination module 830, the test data setacquisition module 840, the second probability density distributioncurve acquisition module 850, the probability density distribution measurement totalscore determination module 860, the abnormal value ratio measurement totalscore determination module 870, the virtual machine state totalscore determination module 880 and the virtual machine runningstate determination module 890 may be implemented at least partially as a hardware circuit, such as a field programmable gate array (FPGA), a programmable logic array (PLA), a system on chip, a system on substrate, a system on package, and an application specific integrated circuit (ASIC), or may be implemented by a hardware or firmware such as any other reasonable method of integrating or packaging the circuit, or may be implemented by any one or any combinations of the three implementation methods of software, hardware and firmware. Alternatively, at least one of the trainingdata acquisition module 810, the first probability densitymodel building module 820, the probability density thresholdvalue determination module 830, the test data setacquisition module 840, the second probability density distributioncurve acquisition module 850, the probability density distribution measurement totalscore determination module 860, the abnormal value ratio measurement totalscore determination module 870, the virtual machine state totalscore determination module 880 and the virtual machine runningstate determination module 890 may be at least partially implemented as a computer program module. The computer program module, when run, may perform corresponding functions. - In the method according to embodiments of the present disclosure, a virtual machine anomaly detection scoring mechanism is provided, which may make full use of characteristics of historical data and a probability density function, and design two measurement indicators to quantify a health status of the virtual machine. That is, a health condition of the virtual machine may be qualified by combining the above-mentioned two measurement indicators, so that the running state of the virtual machine may be determined quickly and intuitively.
-
FIG. 9 schematically shows a structural block diagram of an electronic device suitable for implementing the above-mentioned method according to exemplary embodiments of the present disclosure. - As shown in
FIG. 9 , anelectronic device 1000 according to embodiments of the present disclosure includes aprocessor 1001, which may perform various appropriate actions and processes according to a program stored in a read-only memory (ROM) 1002 or a program loaded into a random access memory (RAM) 1003 from astorage portion 1008. Theprocessor 1001 may include, for example, a general-purpose microprocessor (e.g., a CPU), an instruction provided processor and/or a related chipset and/or a dedicated-purpose microprocessor (e.g., an application specific integrated circuit (ASIC)), etc. Theprocessor 1001 may further include an on-board memory for caching purposes. Theprocessor 1001 may include a single processing unit or a plurality of processing units for performing different actions of the method flow according to embodiments of the present disclosure. - The
RAM 1003 stores various programs and data required for an operation ofelectronic device 1000. Theprocessor 1001, theROM 1002 and theRAM 1003 are connected to each other through abus 1004. Theprocessor 1001 performs various operations of the method flow according to embodiments of the present disclosure by executing a program in theROM 1002 and/or theRAM 1003. It should be noted that the program may also be stored in one or more memories other than theROM 1002 and theRAM 1003. Theprocessor 1001 may also perform various operations of the method flow according to embodiments of the present disclosure by executing programs stored in the one or more memories. - According to embodiments of the present disclosure, the
electronic device 1000 may further include an input/output (I/O)interface 1005, and the input/output (I/O)interface 1005 is also connected to thebus 1004. Theelectronic device 1000 may further include one or more of following components connected to the I/O interface 1005, including: aninput portion 1006 including a keyboard, a mouse, etc.; anoutput portion 1007 including a cathode ray tube (CRT), a liquid crystal display (LCD), etc., and a speaker, etc.; astorage portion 1008 including a hard disk, etc.; and acommunication portion 1009 including a network interface card such as a LAN card, a modem, etc. Thecommunication portion 1009 performs a communication processing via a network such as the Internet. Adrive 1010 is also connected to the I/O interface 1005 as required. A removable medium 1011, such as a magnetic disk, an optical disk, a magneto-optical disk, a semiconductor memory, or the like, is installed on thedrive 1010 as required, so that a computer program read therefrom may be installed into thestorage portion 1008 as required. - The present disclosure further provides a computer-readable storage medium. The computer-readable storage medium may be included in the device/apparatus/system described in the above-mentioned embodiments; the computer-readable storage medium may also exist alone without being assembled into the device/apparatus/system. The above-mentioned computer-readable storage medium carries one or more programs. The above-mentioned one or more programs, when executed, may implement the method according to embodiments of the present disclosure.
- According to embodiments of the present disclosure, the computer-readable storage medium may be a non-volatile computer-readable storage medium. For example, the non-volatile computer-readable storage medium includes, but is not limited to: a portable computer disk, a hard disk, a random access memory (RAM), a read-only memory (ROM), an erasable programmable read-only memory (EPROM or a flash memory), a portable compact disk read-only memory (CD-ROM), an optical storage element, a magnetic storage element, or any suitable combination thereof. In the present disclosure, the computer-readable storage medium may be any tangible medium containing or storing a program, and the program may be used by or in combination with an instruction execution system, apparatus or element. For example, according to embodiments of the present disclosure, the computer-readable storage medium may include one or more memories other than the
ROM 1002 and/or theRAM 1003 and/or theROM 1002 and theRAM 1003 described above. - Embodiments of the present disclosure further provide a computer program product, including a computer program. The computer program includes a program code for performing the method shown in the flowchart. When the computer program product runs in a computer system, the program code is used to cause the computer system to implement the method provided by embodiments of the present disclosure.
- The above-mentioned functions defined in the system/apparatus of embodiments of the present disclosure are performed when the computer program is executed by the
processor 1001. According to embodiments of the present disclosure, the system, the apparatuses, the modules, the units, etc. described above may be implemented by the computer program module. - In an embodiment, the computer program may rely on a tangible storage medium such as an optical storage element, a magnetic memory element, etc. In another embodiment, the computer program may also be transmitted and distributed in a form of a signal on a network medium, downloaded and installed through the
communication portion 1009, and/or installed from theremovable medium 1011. The program code contained in the computer program may be transmitted by any suitable network medium, including but not limited to: wireless, wired, etc., or any suitable combination thereof. - In the embodiments, the computer program may be downloaded and installed from the network through the
communication portion 1009, and/or installed from theremovable medium 1011. The computer program, when executed by theprocessor 1001, performs the above-mentioned functions defined in the system of embodiments of the present disclosure. According to embodiments of the present disclosure, the system, the apparatuses, devices, the modules, the units, etc. described above may be implemented by the computer program module. - According to embodiments of the present disclosure, the program code for executing the computer programs provided by embodiments of the present disclosure may be written in any combination of one or more programming languages. Specifically, the computing programs may be implemented using a high-level procedure and/or an object-oriented programming language, and/or an assembly/machine language. The programming language includes, but is not limited to Java, C++, python, "C" language or a similar programming language. The program code may be completely executed on a user computing device, partially executed on a user device, partially executed on a remote computing device, or completely executed on the remote computing device or a server. In a case of involving the remote computing device, the remote computing device may be connected to the user computing device through any kind of network, including a local area network (LAN) or a wide area network (WAN), or may be connected to an external computing device (for example, connected through the Internet using an Internet service provider).
- The flowcharts and block diagrams in the accompanying drawings illustrate possibly implemented architectures, functions and operations of the systems, methods and computer program products according to various embodiments of the present disclosure. In this regard, each block in the flowcharts or block diagrams may represent a module, a program segment, or part of a code. The above-mentioned module, program segment, or part of the code contains one or more executable instructions for realizing specified logic functions. It should also be noted that in some alternative implementations, functions marked in the blocks may also occur in a different order from those marked in the accompanying drawings. For example, two consecutive blocks may actually be performed in parallel, and sometimes they may be performed in a reverse order, which depends on the functions involved. It should also be noted that each block in the block diagrams or flowcharts and a combination of blocks in the block diagrams or flowcharts may be implemented by a dedicated hardware-based system that performs specified functions or operations, or by a combination of a dedicated hardware and computer instructions.
- Those skilled in the art will appreciate that various combinations and/or incorporations of features recited in various embodiments and/or claims of the present disclosure may be made, even if such combinations or incorporations are not explicitly recited in the present disclosure. In particular, without departing from the spirit and principles of the present disclosure, various combinations and/or incorporations of the features recited in the various embodiments and/or claims of the present disclosure may be made. All of the combinations and/or incorporations fall within the scope of the present disclosure.
- Embodiments of the present disclosure have been described above. However, these embodiments are for illustrative purposes only, and are not used to limit the scope of the present disclosure. Although various embodiments have been described separately above, this does not mean that the measures in various embodiments may not be used advantageously in combination. The scope of the present disclosure is defined by the appended claims and their equivalents. Without departing from the spirit and principles of the present disclosure, those skilled in the art may make various alternatives and equivalent substitutions, and these alternatives and modifications should all fall within the scope of the present disclosure.
Claims (15)
- A method of detecting a running state of a virtual machine based on a kernel density estimation, comprising:acquiring (S210) a training data set of at least one feature, wherein the at least one feature is configured to characterize at least one running state of the virtual machine;building (S220) a probability density model for the training data set of the at least one feature by using a kernel density estimation algorithm, so as to obtain a probability density distribution curve of the training data set of the at least one feature;determining (S230) a probability density threshold value of the training data set of the at least one feature according to the probability density model;acquiring (S240) a test data set of the at least one feature;acquiring (S250) a probability density distribution curve of the test data set of the at least one feature according to the built probability density model;comparing (S260) the probability density distribution curve of the training data set of the at least one feature with the probability density distribution curve of the test data set of the at least one feature to determine a probability density distribution measurement total score;comparing (S270) a plurality of probability density values of the test data set of the at least one feature with the probability density threshold value to determine an abnormal value ratio measurement total score;determining (S280) a virtual machine state total score according to the probability density distribution measurement total score and the abnormal value ratio measurement total score; anddetermining (S290) the running state of the virtual machine according to the virtual machine state total score.
- The method according to claim 1, wherein the determining a virtual machine state total score according to the probability density distribution measurement total score and the abnormal value ratio measurement total score comprises:determining the virtual machine state total score according to the probability density distribution measurement total score and the abnormal value ratio measurement total score by:
 where ss is the virtual machine state total score, sm is the probability density distribution measurement total score, st is the abnormal value ratio measurement total score, ws 1 is a weight coefficient of the probability density distribution measurement total score, and ws2 is a weight coefficient of the abnormal value ratio measurement total score,wherein ws1>ws2.
 - The method according to any one of claims 1 to 2, wherein the at least one feature comprises a first feature, a second feature and a third feature, and the first feature, the second feature and the third feature are configured to characterize different running states of the virtual machine respectively; and
the acquiring a training data set of at least one feature comprises: simultaneously acquiring a first training data set of the first feature, a second training data set of the second feature, and a third training data of the third feature. - The method according to claim 3, wherein the building a probability density model for the training data set of the at least one feature by using a kernel density estimation algorithm so as to obtain a probability density distribution curve of the training data set of the at least one feature comprises:building probability density models respectively for the first training data set of the first feature, the second training data set of the second feature and the third training data set of the third feature by using the kernel density estimation algorithm, so as to obtain a first probability density distribution curve of the first training data set, a second probability density distribution curve of the second training data set and a third probability density distribution curve of the third training data set,wherein the determining a probability density threshold value of the training data set of the at least one feature according to the probability density model comprises:determining a first probability density threshold value of the first training data set, a second probability density threshold value of the second training data set and a third probability density threshold value of the third training data set according to the probability density distribution curve,wherein the acquiring a test data set of the at least one feature comprises: simultaneously acquiring a first test data set of the first feature, a second test data set of the second feature and a third test data set of the third feature,wherein the acquiring a probability density distribution curve of the test data set of the at least one feature according to the built probability density model comprises:
respectively acquiring a first probability density distribution curve of the first test data set, a second probability density distribution curve of the second test data set and a third probability density distribution curve of the third test data set according to the built probability density model. - The method according to claim 4, wherein the comparing the probability density distribution curve of the training data set of the at least one feature with the probability density distribution curve of the test data set of the at least one feature to determine a probability density distribution measurement total score comprises:comparing (S2601) the first probability density distribution curve of the first training data set with the first probability density distribution curve of the first test data set to determine a first probability density distribution measurement score;comparing (S2602) the second probability density distribution curve of the second training data set with the second probability density distribution curve of the second test data set to determine a second probability density distribution measurement score; andcomparing (S2603) the third probability density distribution curve of the third training data set with the third probability density distribution curve of the third test data set to determine a third probability density distribution measurement score,wherein the comparing the probability density distribution curve of the training data set of the at least one feature with the probability density distribution curve of the test data set of the at least one feature to determine a probability density distribution measurement total score comprises:determining (S2604) the probability density distribution measurement total score according to the first probability density distribution measurement score, the second probability density distribution measurement score and the third probability density distribution measurement score by:
 where sm is the probability density distribution measurement total score, smc1 is the first probability density distribution measurement score, smc2 is the second probability density distribution measurement score, smc3 is the third probability density distribution measurement score, and wm 1, wm2 and wm3 are weight coefficients of the first probability density distribution measurement score, the second probability density distribution measurement score, and the third probability density distribution measurement score.
 - The method according to claim 4, wherein the comparing a plurality of probability density values of the test data set of the at least one feature with the probability density threshold value to determine an abnormal value ratio measurement total score comprises:comparing (S2701) a plurality of probability density values of the first test data set with the first probability density threshold value to determine a first abnormal value ratio measurement score;comparing (S2702) a plurality of probability density values of the second test data set with the second probability density threshold value to determine a second abnormal value ratio measurement score; andcomparing (S2703) a plurality of probability density values of the third test data set with the third probability density threshold value to determine a third abnormal value ratio measurement score,wherein the comparing a plurality of probability density values of the test data set of the at least one feature with the probability density threshold value to determine an abnormal value ratio measurement total score comprises:determining (S2704) the abnormal value ratio measurement total score according to the first abnormal value ratio measurement score, the second abnormal value ratio measurement score and the third abnormal value ratio measurement score by:
 where st is the abnormal value ratio measurement total score, stc1 is the first abnormal value ratio measurement score, stc2 is the second abnormal value ratio measurement score, stc3 is the third abnormal value ratio measurement score, and wt1, wt2 and wt3 are weight coefficients of the first abnormal value ratio measurement score, the second abnormal value ratio measurement score, and the third abnormal value ratio measurement score.
 - The method according to claim 5, wherein the comparing the first probability density distribution curve of the first training data set with the first probability density distribution curve of the first test data set to determine a first probability density distribution measurement score comprises: calculating a Wasserstein distance between the first probability density distribution curve of the first training data set and the first probability density distribution curve of the first test data set, and mapping the Wasserstein distance into a centesimal system to acquire the first probability density distribution measurement score; and/or,the comparing the second probability density distribution curve of the second training data set with the second probability density distribution curve of the second test data set to determine a second probability density distribution measurement score comprises: calculating a Wasserstein distance between the second probability density distribution curve of the second training data set and the second probability density distribution curve of the second test data set, and mapping the Wasserstein distance into a centesimal system to acquire the second probability density distribution measurement score; and/or,the comparing the third probability density distribution curve of the third training data set with the third probability density distribution curve of the third test data set to determine a third probability density distribution measurement score comprises: calculating a Wasserstein distance between the third probability density distribution curve of the third training data set and the third probability density distribution curve of the third test data set, and mapping the Wasserstein distance into a centesimal system to acquire the third probability density distribution measurement score.
- The method according to claim 6, wherein the determining a first probability density threshold value of the first training data set comprises: ranking a plurality of probability density values of the first training data set of the first feature in an order of small to large; and taking the probability density value ranked at N1th as the first probability density threshold value, wherein N1 = int(10% × N10), N10 is a total number of the plurality of probability density values of the first training data set, and int represents a rounding operation; and/or,the determining a second probability density threshold value of the second training data set comprises: ranking a plurality of probability density values of the second training data set of the second feature in an order of small to large; and taking the probability density value ranked at N2th as the second probability density threshold value, wherein N2 = int(10% × N20), N20 is a total number of the plurality of probability density values of the second training data set, and int represents a rounding operation; and/or,the determining a third probability density threshold value of the third training data set comprises: ranking a plurality of probability density values of the third training data set of the third feature in an order of small to large; and taking the probability density value ranked at N3th as the third probability density threshold value, wherein N3 = int(10% × N30), N30 is a total number of the plurality of probability density values of the third training data set, and int represents a rounding operation,wherein the comparing a plurality of probability density values of the first test data set with the first probability density threshold value to determine a first abnormal value ratio measurement score comprises: calculating a proportion of a number of probability density values less than the first probability density threshold value among the plurality of probability density values of the first test data set to a total number of the plurality of probability density values of the first test data set; and mapping the proportion into a centesimal system to acquire the first abnormal value ratio measurement score; and/or,the comparing a plurality of probability density values of the second test data set with the second probability density threshold value to determine a second abnormal value ratio measurement score comprises: calculating a proportion of a number of probability density values less than the second probability density threshold value among the plurality of probability density values of the second test data set to a total number of the plurality of probability density values of the second test data set; and mapping the proportion into a centesimal system to acquire the second abnormal value ratio measurement score; and/or,the comparing a plurality of probability density values of the third test data set with the third probability density threshold value to determine a third abnormal value ratio measurement score comprises: calculating a proportion of a number of probability density values less than the third probability density threshold value among the plurality of probability density values of the third test data set to a total number of the plurality of probability density values of the third test data set; and mapping the proportion into a centesimal system to acquire the third abnormal value ratio measurement score.
- The method according to claim 2, wherein the determining the running state of the virtual machine according to the virtual machine state total score comprises:determining that the virtual machine is in an abnormal running state in response to the virtual machine state total score being less than a first scoring threshold value;determining that the virtual machine is in a high potential abnormal state in response to the virtual machine state total score being in a first interval defined by the first scoring threshold value and a second scoring threshold value; anddetermining that the virtual machine is in a low potential abnormal state in response to the virtual machine state total score being in a second interval defined by the second scoring threshold value and a third scoring threshold value,wherein the determining the running state of the virtual machine according to the virtual machine state total score comprises:determining that the virtual machine is in a good running state in response to the virtual machine state total score being in a third interval defined by the third scoring threshold value and a fourth scoring threshold value; anddetermining that the virtual machine is in an excellent running state in response to the virtual machine state total score being greater than the fourth scoring threshold value.
- The method according to claim 3, wherein the first feature is a CPU utilization, the second feature is a network receiving traffic, and the third feature is a network sending traffic,
wherein at least one of the acquiring a training data set of at least one feature and the acquiring a test data set of the at least one feature comprises:collecting (S310) primary monitoring data of the virtual machine within a specified time period, wherein the primary monitoring data comprises a virtual machine number, a collection timestamp, CPU usage time of the virtual machine, a network receiving traffic and a network sending traffic;aggregating (S320) the collected primary monitoring data according to the virtual machine number;extracting (S330) data of a plurality of features within a predetermined time period from the aggregated primary monitoring data; andfusing (S340) the data of the plurality of features according to the collection timestamp to form a feature vector. - The method according to claim 5 or 6, wherein the method further comprises:performing a correlation analysis on the first training data set of the first feature, the second training data set of the second feature and the third training data set of the third feature; anddetermining weight coefficients wm1, wm2 and wm3 and weight coefficients wt1, wt2 and wt3 according to a result of the correlation analysis,wherein a correlation between the second training data set of the second feature and the third training data set of the third feature is greater than a correlation between the first training data set of the first feature and the second training data set of the second feature, and the correlation between the second training data set of the second feature and the third training data set of the third feature is greater than a correlation between the first training data set of the first feature and the third training data set of the third feature; andthe weight coefficient wm1 is greater than any one of the weight coefficients wm2 and wm3, and the weight coefficient wt1 is greater than any one of the weight coefficients wt2 and wt3,wherein the weight coefficient wm2 is greater than the weight coefficient wm3, and the weight coefficient wt2 is greater than the weight coefficient wt3.
- An apparatus of detecting a running state of a virtual machine based on a kernel density estimation, comprising:a training data acquisition module configured to acquire a training data set of at least one feature, wherein the at least one feature is configured to characterize at least one running state of the virtual machine;a first probability density model building module configured to build a probability density model for the training data set of the at least one feature by using a kernel density estimation algorithm, so as to obtain a probability density distribution curve of the training data set of the at least one feature;a probability density threshold value determination module configured to determine a probability density threshold value of the training data set of the at least one feature according to the probability density model;a test data set acquisition module configured to acquire a test data set of the at least one feature;a second probability density distribution curve acquisition module configured to acquire a probability density distribution curve of the test data set of the at least one feature according to the built probability density model;a probability density distribution measurement total score determination module configured to compare the probability density distribution curve of the training data set of the at least one feature with the probability density distribution curve of the test data set of the at least one feature to determine a probability density distribution measurement total score;an abnormal value ratio measurement total score determination module configured to compare a plurality of probability density values of the test data set of the at least one feature with the probability density threshold value to determine an abnormal value ratio measurement total score;a virtual machine state total score determination module configured to determine a virtual machine state total score according to the probability density distribution measurement total score and the abnormal value ratio measurement total score; anda virtual machine running state determination module configured to determine the running state of the virtual machine according to the virtual machine state total score.
- An electronic device, comprising:one or more processors; anda storage apparatus configured to store one or more programs,wherein the one or more programs, when executed by the one or more processors, are configured to cause the one or more processors to implement the method according to any one of claims 1 to 11.
- A computer-readable storage medium having executable instructions thereon, wherein the instructions, when executed by a processor, are configured to cause the processor to implement the method according to any one of claims 1 to 11.
- A computer program product comprising a computer program, wherein the computer program, when executed by a processor, is configured to cause the processor to implement the method according to any one of claims 1 to 11.
Applications Claiming Priority (2)
| Application Number | Priority Date | Filing Date | Title |
|---|---|---|---|
| CN202210316127 | 2022-03-28 | ||
| CN202210511420.0A CN114896024B (en) | 2022-03-28 | 2022-05-10 | Virtual machine running state detection method and device based on kernel density estimation |
Publications (2)
| Publication Number | Publication Date |
|---|---|
| EP4254182A1 true EP4254182A1 (en) | 2023-10-04 |
| EP4254182B1 EP4254182B1 (en) | 2025-11-05 |
Family
ID=85781977
Family Applications (1)
| Application Number | Title | Priority Date | Filing Date |
|---|---|---|---|
| EP23164526.8A Active EP4254182B1 (en) | 2022-03-28 | 2023-03-28 | Method and apparatus of detecting running state of a virtual machine based on kernel density estimation |
Country Status (2)
| Country | Link |
|---|---|
| EP (1) | EP4254182B1 (en) |
| WO (1) | WO2023185358A1 (en) |
Cited By (1)
| Publication number | Priority date | Publication date | Assignee | Title |
|---|---|---|---|---|
| CN118798492A (en) * | 2024-09-12 | 2024-10-18 | 国网山东省电力公司经济技术研究院 | Photovoltaic carrying capacity evaluation method, system, computer storage medium and electronic device |
Families Citing this family (2)
| Publication number | Priority date | Publication date | Assignee | Title |
|---|---|---|---|---|
| CN119475180B (en) * | 2024-11-12 | 2026-01-06 | 湖北华中电力科技开发有限责任公司 | A Data Governance Method Based on Deep Learning for Automatic Detection of Outliers |
| CN121119195B (en) * | 2025-11-14 | 2026-03-17 | 北京赋乐科技有限公司 | Multi-mode large model training method, device and equipment for terminal adjustment |
Family Cites Families (5)
| Publication number | Priority date | Publication date | Assignee | Title |
|---|---|---|---|---|
| CN112801434A (en) * | 2019-11-13 | 2021-05-14 | 中兴通讯股份有限公司 | Method, device, equipment and storage medium for monitoring performance index health degree |
| CN112149757B (en) * | 2020-10-23 | 2022-08-19 | 新华三大数据技术有限公司 | Abnormity detection method and device, electronic equipment and storage medium |
| CN112232719A (en) * | 2020-12-11 | 2021-01-15 | 北京基调网络股份有限公司 | Index quantitative scoring method, computer equipment and storage medium |
| CN113112092A (en) * | 2021-05-07 | 2021-07-13 | 国网四川省电力公司经济技术研究院 | Short-term probability density load prediction method, device, equipment and storage medium |
| CN114896024B (en) * | 2022-03-28 | 2022-11-22 | 同方威视技术股份有限公司 | Virtual machine running state detection method and device based on kernel density estimation |
-
2023
- 2023-03-01 WO PCT/CN2023/078972 patent/WO2023185358A1/en not_active Ceased
- 2023-03-28 EP EP23164526.8A patent/EP4254182B1/en active Active
Non-Patent Citations (2)
| Title |
|---|
| IBIDUNMOYE OLUMUYIWA ET AL: "Blackbox Strategies for Detecting Service Performance Anomalies in Virtualized Environments", 1 May 2016 (2016-05-01), pages 1 - 22, XP093070141, Retrieved from the Internet <URL:https://www.diva-portal.org/smash/get/diva2:1060538/FULLTEXT03> [retrieved on 20230803] * |
| LV PENG ET AL: "Layer-constrained variational autoencoding kernel density estimation model for anomaly detection", KNOWLEDGE-BASED SYSTEMS, ELSEVIER, AMSTERDAM, NL, vol. 196, 10 March 2020 (2020-03-10), XP086135939, ISSN: 0950-7051, [retrieved on 20200310], DOI: 10.1016/J.KNOSYS.2020.105753 * |
Cited By (1)
| Publication number | Priority date | Publication date | Assignee | Title |
|---|---|---|---|---|
| CN118798492A (en) * | 2024-09-12 | 2024-10-18 | 国网山东省电力公司经济技术研究院 | Photovoltaic carrying capacity evaluation method, system, computer storage medium and electronic device |
Also Published As
| Publication number | Publication date |
|---|---|
| EP4254182B1 (en) | 2025-11-05 |
| WO2023185358A1 (en) | 2023-10-05 |
Similar Documents
| Publication | Publication Date | Title |
|---|---|---|
| CN113792825B (en) | Fault classification model training method and device for electricity information acquisition equipment | |
| EP4254182B1 (en) | Method and apparatus of detecting running state of a virtual machine based on kernel density estimation | |
| CN116450399B (en) | Fault diagnosis and root cause positioning method for micro service system | |
| CN113592019B (en) | Fault detection methods, devices, equipment and media based on multi-model fusion | |
| CN114298221B (en) | Fault determination method and device, electronic equipment and computer readable storage medium | |
| CN114661571B (en) | Model evaluation method, device, electronic device and storage medium | |
| CN111435463A (en) | Data processing method and related equipment and system | |
| CN113837596B (en) | Fault determination method and device, electronic equipment and storage medium | |
| CN115237724A (en) | AI-based data monitoring method, device, equipment and storage medium | |
| CN116416884B (en) | A testing device and testing method for a display module | |
| WO2025009381A1 (en) | Abnormality detection device, abnormality detection system, and abnormality detection method | |
| CN116306806A (en) | Fault diagnosis model determination method, device and non-volatile storage medium | |
| CN120561646A (en) | Data quality monitoring method, system, electronic device and storage medium | |
| CN120430560A (en) | Real-time data analysis method for enterprise digital operation based on multi-source data fusion | |
| CN115599195B (en) | GPU energy consumption prediction method and system based on CUDA performance counter | |
| CN115453661B (en) | Meteorological forecast method, device, equipment and storage medium | |
| CN114896024B (en) | Virtual machine running state detection method and device based on kernel density estimation | |
| CN121902722A (en) | Verification method, device, equipment and storage medium for chip parameters | |
| CN115829402A (en) | The whole life cycle quality assessment method, system, equipment and medium of power equipment | |
| HK40093156A (en) | Method and apparatus of detecting running state of a virtual machine based on kernel density estimation | |
| US12184527B2 (en) | Health index of a service | |
| WO2025122993A1 (en) | Multivariate time series anomaly detection | |
| CN117408517A (en) | A project cost risk control and management system | |
| US20230133110A1 (en) | Systems and methods for detection of cryptocurrency mining using processor metadata | |
| CN117149565A (en) | Status detection methods, devices, equipment and media for key performance indicators of cloud platforms |
Legal Events
| Date | Code | Title | Description |
|---|---|---|---|
| PUAI | Public reference made under article 153(3) epc to a published international application that has entered the european phase |
Free format text: ORIGINAL CODE: 0009012 |
|
| STAA | Information on the status of an ep patent application or granted ep patent |
Free format text: STATUS: REQUEST FOR EXAMINATION WAS MADE |
|
| 17P | Request for examination filed |
Effective date: 20230328 |
|
| AK | Designated contracting states |
Kind code of ref document: A1 Designated state(s): AL AT BE BG CH CY CZ DE DK EE ES FI FR GB GR HR HU IE IS IT LI LT LU LV MC ME MK MT NL NO PL PT RO RS SE SI SK SM TR |
|
| REG | Reference to a national code |
Ref country code: HK Ref legal event code: DE Ref document number: 40093156 Country of ref document: HK |
|
| STAA | Information on the status of an ep patent application or granted ep patent |
Free format text: STATUS: EXAMINATION IS IN PROGRESS |
|
| 17Q | First examination report despatched |
Effective date: 20240807 |
|
| REG | Reference to a national code |
Ref country code: DE Ref legal event code: R079 Free format text: PREVIOUS MAIN CLASS: G06F0009455000 Ipc: G06F0011070000 Ref document number: 602023008172 Country of ref document: DE |
|
| GRAP | Despatch of communication of intention to grant a patent |
Free format text: ORIGINAL CODE: EPIDOSNIGR1 |
|
| STAA | Information on the status of an ep patent application or granted ep patent |
Free format text: STATUS: GRANT OF PATENT IS INTENDED |
|
| RIC1 | Information provided on ipc code assigned before grant |
Ipc: G06F 11/07 20060101AFI20250704BHEP Ipc: G06F 9/455 20180101ALI20250704BHEP |
|
| INTG | Intention to grant announced |
Effective date: 20250805 |
|
| GRAS | Grant fee paid |
Free format text: ORIGINAL CODE: EPIDOSNIGR3 |
|
| GRAA | (expected) grant |
Free format text: ORIGINAL CODE: 0009210 |
|
| STAA | Information on the status of an ep patent application or granted ep patent |
Free format text: STATUS: THE PATENT HAS BEEN GRANTED |
|
| AK | Designated contracting states |
Kind code of ref document: B1 Designated state(s): AL AT BE BG CH CY CZ DE DK EE ES FI FR GB GR HR HU IE IS IT LI LT LU LV MC ME MK MT NL NO PL PT RO RS SE SI SK SM TR |
|
| REG | Reference to a national code |
Ref country code: CH Ref legal event code: F10 Free format text: ST27 STATUS EVENT CODE: U-0-0-F10-F00 (AS PROVIDED BY THE NATIONAL OFFICE) Effective date: 20251105 Ref country code: GB Ref legal event code: FG4D |
|
| RAP4 | Party data changed (patent owner data changed or rights of a patent transferred) |
Owner name: NUCTECH COMPANY LIMITED |
|
| REG | Reference to a national code |
Ref country code: DE Ref legal event code: R096 Ref document number: 602023008172 Country of ref document: DE |
|
| REG | Reference to a national code |
Ref country code: IE Ref legal event code: FG4D |
|
| REG | Reference to a national code |
Ref country code: NL Ref legal event code: MP Effective date: 20251105 |
|
| PG25 | Lapsed in a contracting state [announced via postgrant information from national office to epo] |
Ref country code: ES Free format text: LAPSE BECAUSE OF FAILURE TO SUBMIT A TRANSLATION OF THE DESCRIPTION OR TO PAY THE FEE WITHIN THE PRESCRIBED TIME-LIMIT Effective date: 20251105 |
|
| REG | Reference to a national code |
Ref country code: LT Ref legal event code: MG9D |
|
| PG25 | Lapsed in a contracting state [announced via postgrant information from national office to epo] |
Ref country code: NO Free format text: LAPSE BECAUSE OF FAILURE TO SUBMIT A TRANSLATION OF THE DESCRIPTION OR TO PAY THE FEE WITHIN THE PRESCRIBED TIME-LIMIT Effective date: 20260205 |
|
| PG25 | Lapsed in a contracting state [announced via postgrant information from national office to epo] |
Ref country code: FI Free format text: LAPSE BECAUSE OF FAILURE TO SUBMIT A TRANSLATION OF THE DESCRIPTION OR TO PAY THE FEE WITHIN THE PRESCRIBED TIME-LIMIT Effective date: 20251105 Ref country code: HR Free format text: LAPSE BECAUSE OF FAILURE TO SUBMIT A TRANSLATION OF THE DESCRIPTION OR TO PAY THE FEE WITHIN THE PRESCRIBED TIME-LIMIT Effective date: 20251105 Ref country code: AT Free format text: LAPSE BECAUSE OF FAILURE TO SUBMIT A TRANSLATION OF THE DESCRIPTION OR TO PAY THE FEE WITHIN THE PRESCRIBED TIME-LIMIT Effective date: 20251105 |
|
| PGFP | Annual fee paid to national office [announced via postgrant information from national office to epo] |
Ref country code: AT Payment date: 20260301 Year of fee payment: 4 |
|
| REG | Reference to a national code |
Ref country code: AT Ref legal event code: MK05 Ref document number: 1855090 Country of ref document: AT Kind code of ref document: T Effective date: 20251105 |
|
| PG25 | Lapsed in a contracting state [announced via postgrant information from national office to epo] |
Ref country code: NL Free format text: LAPSE BECAUSE OF FAILURE TO SUBMIT A TRANSLATION OF THE DESCRIPTION OR TO PAY THE FEE WITHIN THE PRESCRIBED TIME-LIMIT Effective date: 20251105 |
|
| PG25 | Lapsed in a contracting state [announced via postgrant information from national office to epo] |
Ref country code: RS Free format text: LAPSE BECAUSE OF FAILURE TO SUBMIT A TRANSLATION OF THE DESCRIPTION OR TO PAY THE FEE WITHIN THE PRESCRIBED TIME-LIMIT Effective date: 20260205 |
|
| PG25 | Lapsed in a contracting state [announced via postgrant information from national office to epo] |
Ref country code: IS Free format text: LAPSE BECAUSE OF FAILURE TO SUBMIT A TRANSLATION OF THE DESCRIPTION OR TO PAY THE FEE WITHIN THE PRESCRIBED TIME-LIMIT Effective date: 20260305 |
|
| PGFP | Annual fee paid to national office [announced via postgrant information from national office to epo] |
Ref country code: FR Payment date: 20260303 Year of fee payment: 4 |
|
| PG25 | Lapsed in a contracting state [announced via postgrant information from national office to epo] |
Ref country code: PT Free format text: LAPSE BECAUSE OF FAILURE TO SUBMIT A TRANSLATION OF THE DESCRIPTION OR TO PAY THE FEE WITHIN THE PRESCRIBED TIME-LIMIT Effective date: 20260305 |
|
| PG25 | Lapsed in a contracting state [announced via postgrant information from national office to epo] |
Ref country code: PL Free format text: LAPSE BECAUSE OF FAILURE TO SUBMIT A TRANSLATION OF THE DESCRIPTION OR TO PAY THE FEE WITHIN THE PRESCRIBED TIME-LIMIT Effective date: 20251105 |
|
| PG25 | Lapsed in a contracting state [announced via postgrant information from national office to epo] |
Ref country code: LV Free format text: LAPSE BECAUSE OF FAILURE TO SUBMIT A TRANSLATION OF THE DESCRIPTION OR TO PAY THE FEE WITHIN THE PRESCRIBED TIME-LIMIT Effective date: 20251105 |
|
| PG25 | Lapsed in a contracting state [announced via postgrant information from national office to epo] |
Ref country code: BG Free format text: LAPSE BECAUSE OF FAILURE TO SUBMIT A TRANSLATION OF THE DESCRIPTION OR TO PAY THE FEE WITHIN THE PRESCRIBED TIME-LIMIT Effective date: 20251105 |
|
| PG25 | Lapsed in a contracting state [announced via postgrant information from national office to epo] |
Ref country code: LT Free format text: LAPSE BECAUSE OF FAILURE TO SUBMIT A TRANSLATION OF THE DESCRIPTION OR TO PAY THE FEE WITHIN THE PRESCRIBED TIME-LIMIT Effective date: 20251105 |
|
| PG25 | Lapsed in a contracting state [announced via postgrant information from national office to epo] |
Ref country code: SM Free format text: LAPSE BECAUSE OF FAILURE TO SUBMIT A TRANSLATION OF THE DESCRIPTION OR TO PAY THE FEE WITHIN THE PRESCRIBED TIME-LIMIT Effective date: 20251105 |
|
| PG25 | Lapsed in a contracting state [announced via postgrant information from national office to epo] |
Ref country code: DK Free format text: LAPSE BECAUSE OF FAILURE TO SUBMIT A TRANSLATION OF THE DESCRIPTION OR TO PAY THE FEE WITHIN THE PRESCRIBED TIME-LIMIT Effective date: 20251105 |
|
| PGFP | Annual fee paid to national office [announced via postgrant information from national office to epo] |
Ref country code: IT Payment date: 20260331 Year of fee payment: 4 |
|
| PG25 | Lapsed in a contracting state [announced via postgrant information from national office to epo] |
Ref country code: EE Free format text: LAPSE BECAUSE OF FAILURE TO SUBMIT A TRANSLATION OF THE DESCRIPTION OR TO PAY THE FEE WITHIN THE PRESCRIBED TIME-LIMIT Effective date: 20251105 |
|
| PG25 | Lapsed in a contracting state [announced via postgrant information from national office to epo] |
Ref country code: CZ Free format text: LAPSE BECAUSE OF FAILURE TO SUBMIT A TRANSLATION OF THE DESCRIPTION OR TO PAY THE FEE WITHIN THE PRESCRIBED TIME-LIMIT Effective date: 20251105 |
|
| PG25 | Lapsed in a contracting state [announced via postgrant information from national office to epo] |
Ref country code: SK Free format text: LAPSE BECAUSE OF FAILURE TO SUBMIT A TRANSLATION OF THE DESCRIPTION OR TO PAY THE FEE WITHIN THE PRESCRIBED TIME-LIMIT Effective date: 20251105 |
|
| PG25 | Lapsed in a contracting state [announced via postgrant information from national office to epo] |
Ref country code: SE Free format text: LAPSE BECAUSE OF FAILURE TO SUBMIT A TRANSLATION OF THE DESCRIPTION OR TO PAY THE FEE WITHIN THE PRESCRIBED TIME-LIMIT Effective date: 20251105 |