EP4252652A1 - Biological signal analysis system - Google Patents
Biological signal analysis system Download PDFInfo
- Publication number
- EP4252652A1 EP4252652A1 EP21897766.8A EP21897766A EP4252652A1 EP 4252652 A1 EP4252652 A1 EP 4252652A1 EP 21897766 A EP21897766 A EP 21897766A EP 4252652 A1 EP4252652 A1 EP 4252652A1
- Authority
- EP
- European Patent Office
- Prior art keywords
- data
- learning
- determination
- unit
- analysis system
- Prior art date
- Legal status (The legal status is an assumption and is not a legal conclusion. Google has not performed a legal analysis and makes no representation as to the accuracy of the status listed.)
- Granted
Links
Images




Classifications
-
- G—PHYSICS
- G06—COMPUTING OR CALCULATING; COUNTING
- G06N—COMPUTING ARRANGEMENTS BASED ON SPECIFIC COMPUTATIONAL MODELS
- G06N3/00—Computing arrangements based on biological models
- G06N3/02—Neural networks
- G06N3/08—Learning methods
- G06N3/088—Non-supervised learning, e.g. competitive learning
-
- A—HUMAN NECESSITIES
- A61—MEDICAL OR VETERINARY SCIENCE; HYGIENE
- A61B—DIAGNOSIS; SURGERY; IDENTIFICATION
- A61B5/00—Measuring for diagnostic purposes; Identification of persons
- A61B5/24—Detecting, measuring or recording bioelectric or biomagnetic signals of the body or parts thereof
- A61B5/316—Modalities, i.e. specific diagnostic methods
- A61B5/318—Heart-related electrical modalities, e.g. electrocardiography [ECG]
- A61B5/346—Analysis of electrocardiograms
- A61B5/349—Detecting specific parameters of the electrocardiograph cycle
-
- A—HUMAN NECESSITIES
- A61—MEDICAL OR VETERINARY SCIENCE; HYGIENE
- A61B—DIAGNOSIS; SURGERY; IDENTIFICATION
- A61B5/00—Measuring for diagnostic purposes; Identification of persons
- A61B5/24—Detecting, measuring or recording bioelectric or biomagnetic signals of the body or parts thereof
- A61B5/316—Modalities, i.e. specific diagnostic methods
- A61B5/318—Heart-related electrical modalities, e.g. electrocardiography [ECG]
- A61B5/346—Analysis of electrocardiograms
- A61B5/347—Detecting the frequency distribution of signals
-
- A—HUMAN NECESSITIES
- A61—MEDICAL OR VETERINARY SCIENCE; HYGIENE
- A61B—DIAGNOSIS; SURGERY; IDENTIFICATION
- A61B5/00—Measuring for diagnostic purposes; Identification of persons
- A61B5/24—Detecting, measuring or recording bioelectric or biomagnetic signals of the body or parts thereof
- A61B5/316—Modalities, i.e. specific diagnostic methods
- A61B5/318—Heart-related electrical modalities, e.g. electrocardiography [ECG]
- A61B5/346—Analysis of electrocardiograms
- A61B5/349—Detecting specific parameters of the electrocardiograph cycle
- A61B5/361—Detecting fibrillation
-
- A—HUMAN NECESSITIES
- A61—MEDICAL OR VETERINARY SCIENCE; HYGIENE
- A61B—DIAGNOSIS; SURGERY; IDENTIFICATION
- A61B5/00—Measuring for diagnostic purposes; Identification of persons
- A61B5/24—Detecting, measuring or recording bioelectric or biomagnetic signals of the body or parts thereof
- A61B5/316—Modalities, i.e. specific diagnostic methods
- A61B5/318—Heart-related electrical modalities, e.g. electrocardiography [ECG]
- A61B5/346—Analysis of electrocardiograms
- A61B5/349—Detecting specific parameters of the electrocardiograph cycle
- A61B5/363—Detecting tachycardia or bradycardia
-
- A—HUMAN NECESSITIES
- A61—MEDICAL OR VETERINARY SCIENCE; HYGIENE
- A61B—DIAGNOSIS; SURGERY; IDENTIFICATION
- A61B5/00—Measuring for diagnostic purposes; Identification of persons
- A61B5/24—Detecting, measuring or recording bioelectric or biomagnetic signals of the body or parts thereof
- A61B5/316—Modalities, i.e. specific diagnostic methods
- A61B5/318—Heart-related electrical modalities, e.g. electrocardiography [ECG]
- A61B5/346—Analysis of electrocardiograms
- A61B5/349—Detecting specific parameters of the electrocardiograph cycle
- A61B5/364—Detecting abnormal ECG interval, e.g. extrasystoles, ectopic heartbeats
-
- A—HUMAN NECESSITIES
- A61—MEDICAL OR VETERINARY SCIENCE; HYGIENE
- A61B—DIAGNOSIS; SURGERY; IDENTIFICATION
- A61B5/00—Measuring for diagnostic purposes; Identification of persons
- A61B5/72—Signal processing specially adapted for physiological signals or for diagnostic purposes
- A61B5/7235—Details of waveform analysis
- A61B5/7264—Classification of physiological signals or data, e.g. using neural networks, statistical classifiers, expert systems or fuzzy systems
- A61B5/7267—Classification of physiological signals or data, e.g. using neural networks, statistical classifiers, expert systems or fuzzy systems involving training the classification device
-
- G—PHYSICS
- G06—COMPUTING OR CALCULATING; COUNTING
- G06N—COMPUTING ARRANGEMENTS BASED ON SPECIFIC COMPUTATIONAL MODELS
- G06N20/00—Machine learning
-
- G—PHYSICS
- G06—COMPUTING OR CALCULATING; COUNTING
- G06N—COMPUTING ARRANGEMENTS BASED ON SPECIFIC COMPUTATIONAL MODELS
- G06N3/00—Computing arrangements based on biological models
- G06N3/02—Neural networks
- G06N3/04—Architecture, e.g. interconnection topology
- G06N3/045—Combinations of networks
- G06N3/0455—Auto-encoder networks; Encoder-decoder networks
-
- G—PHYSICS
- G06—COMPUTING OR CALCULATING; COUNTING
- G06N—COMPUTING ARRANGEMENTS BASED ON SPECIFIC COMPUTATIONAL MODELS
- G06N3/00—Computing arrangements based on biological models
- G06N3/02—Neural networks
- G06N3/08—Learning methods
- G06N3/084—Backpropagation, e.g. using gradient descent
Definitions
- the present invention relates to an integrated biosignal analysis system determining being normal or arrhythmia based on an electrocardiographic signal (hereinafter, electrocardiographic information), for example.
- arrhythmia The heart repeats contraction and expansion to play a role of a pump sending blood to the whole body. This activity maintains regularity by weak electric stimulation in myocardial cells, but if an abnormality appears in this electric stimulation, an abnormality also occurs in the activity of the heart. This is called arrhythmia.
- arrhythmia There are various types of arrhythmias, and examples thereof include ventricular fibrillation, which causes cardiac arrest and has high fatality, ventricular tachycardia, and atrial fibrillation, which causes cerebral infarction.
- determining arrhythmia is very important, and determining arrhythmia is being performed using electrocardiographic information acquired from an object to be determined with a biosignal measuring device.
- Non Patent Literature 1 The method described in Non Patent Literature 1 is to perform determination limited to atrial fibrillation among arrhythmias.
- Atrial fibrillation is an arrhythmia in which the parts called the atrium trembles due to abnormal electric excitation, and examples of features for determining it from electrocardiographic information include the occurrence of an F wave, which is a trembling component, and the abnormality of a heartbeat cycle (hereinafter, an RR ratio).
- RR ratio the abnormality of a heartbeat cycle
- Non Patent Literature 1 focuses on the latter, in which in a histogram with the RR ratio on the horizontal axis, variations are larger in atrial fibrillation than in normal sinus rhythm (hereafter, a normal waveform), from which atrial fibrillation is determined.
- Non Patent Literature 2 which focuses on atrial fibrillation as in Non Patent Literature 1, performs automatic analysis by machine learning.
- Non Patent Literature 2 segments acquired electrocardiographic information every 15 seconds, which are subjected to time-frequency conversion to reveal waveform features, which are classified into four categories including "normal waveform, noise, atrial fibrillation, and others", which have already been learned, to determine atrial fibrillation.
- Non Patent Literature 1 and Non Patent Literature 2 have the following problems.
- Non Patent Literature 1 can only determine arrhythmias characterized by the abnormality of the RR ratio. As described above, there are various types of arrhythmias, and some arrhythmias, such as ventricular tachycardia, are not characterized by the RR ratio, which causes these arrhythmias to be missed. To evaluate the abnormality of the RR ratio from variations, the arrhythmia (variations) is required to be continuous over a long period of time to determine atrial fibrillation, and it is difficult to determine arrhythmias occurring suddenly.
- Non Patent Literature 2 requires prior learning and thus cannot perform determination of unlearned arrhythmias.
- An object of the present invention is to solve the above problems of conventional technologies and provide an integrated biosignal analysis system capable of determining whether there arises arrhythmia from electrocardiographic information regardless of the type of arrhythmia.
- An integrated biosignal analysis system of the present invention achieving the above object includes the following configurations.
- the present invention can provide an integrated biosignal analysis system capable of determining whether there arises arrhythmia from electrocardiographic information regardless of the type of arrhythmia.
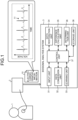
- FIG. 1 is a diagram of a configuration example of an integrated biosignal analysis system according to a first embodiment of the present invention.
- electrocardiographic information 10 to be analyzed is acquired from an object 1 to be determined via a biosignal measuring device 2.
- the object 1 to be determined is a human, an animal, and the like, which is not limited to a particular object.
- Examples of the biosignal measuring device 2 include an electrocardiograph.
- the electrocardiographic information 10 acquired from the object to be determined includes information on the object 1 to be determined, the date, time, and place of acquisition, and a measurement result.
- the measurement result is waveform data 11 obtained by performing plotting with time on the horizontal axis and voltage on the vertical axis (refer to FIG. 1 ).
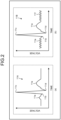
- FIG. 2 is a diagram of a detailed example of the electrocardiographic information 10 for use in analysis.
- (a) of FIG. 2 illustrates waveform data 11A of a normal pulse
- (b) of FIG. 2 is an example of waveform data 11B of atrial fibrillation in which an F wave occurs.
- Each waveform data can contain components called a P wave 11a, a Q wave 11b, an R wave 11c, an S wave 11d, a T wave 11e, and an F wave 11f, and these shapes are used as criteria for arrhythmia.
- the waveform data of the electrocardiographic information 10 may change its shape depending on the object to be determined and/or the biosignal measuring device.
- this biosignal analysis system 3 includes an input unit 31, a data conversion unit 32, a learning unit 33, a data restoration unit 34, a difference calculation unit 35, a determination unit 36, a control unit 37, and a storage unit 38.
- the input unit 31 receives input of the electrocardiographic information output from the biosignal measuring device 2.
- the input unit 31 extracts unit waveform data from the waveform data 11 of the acquired electrocardiographic information.
- the input unit 31 includes a connector electrically connecting to the biosignal measuring device 2, a communication apparatus including means to communicate with the biosignal measuring device 2, or an input port for media in which data is stored and may further include user interfaces such as a keyboard, a mouse, and a microphone.
- the data conversion unit 32 applies conversion processing to the electrocardiographic information 10. Specifically, frequency analysis is applied to waveform data showing the relation between time and intensity (voltage in this case) to generate three-dimensional time-frequency-intensity feature data.
- FIG. 3 is a diagram of a processing example by the input unit 31 for the electrocardiographic information according to the first embodiment.
- the input unit 31 generates unit waveform data 12 extracted for each designated unit for the waveform data 11 illustrated in (a) of FIG. 3 (refer to (b) of FIG. 3 ) and registers it in the storage unit 38.
- Examples of the extraction of the unit waveform data 12 include setting a designated period as a unit based on time axis information and setting a designated number of waveforms as a unit with a peak position of the R wave 11c as an extraction reference position, but this is not limiting. In the example illustrated in FIG.
- the data conversion unit 32 applies processing to generate three-dimensional feature data 13 from the unit waveform data 12 (refer to (c) of FIG. 3 .
- the intervals of the pieces of unit waveform data 12 are not constant due to fluctuations in heartbeat. Segmentation by each unit waveform improves the learning accuracy of an auto-encoder 41 in the learning unit 33 described below and inhibits mixing of noise into difference data and a difference amount in the difference calculation unit 35, and thus the accuracy of determination of arrhythmia improves.
- sections that do not have useful information for determination such as out-of-unit waveform data 11g in (b) of FIG. 3 , are excluded, and thus the amount of processing can be reduced.
- the designated number of seconds before and after the peak position 11cp of the R wave 11c detected from the maximum value of a certain section are set as one unit waveform, but this is not limiting. If the waveform data does not have the R wave 11c and the peak position 11cp of the R wave 11c cannot be detected, the input unit 31 determines the maximum value of the waveform data and extracts a designated number of seconds before and after that time, as a reference position, as one unit.
- the learning unit 33 performs learning optimizing network parameters of a neural network to generate a learned model.
- the learning unit 33 has an auto-encoder and performs learning of the auto-encoder with three-dimensional feature data generated based on the electrocardiographic information as data for learning. Examples of the learning include learning using the error back-propagation method and the stochastic gradient descent method.
- the learning unit 33 causes the storage unit 38 to store therein the learned model after learning (hereinafter, also referred to simply as the learned model).
- FIG. 4 is a flowchart of learning processing by the biosignal analysis system 3.
- the three-dimensional feature data 13 is acquired as the data for learning from the unit waveform data, which has been generated by the data conversion unit 32 applying each processing based on the electrocardiographic information 10 input to the input unit 31 (Step S101).
- the learning unit 33 performs learning of the auto-encoder using the generated data for learning and outputs the learned model after learning.
- a plurality of pieces of data for learning are prepared, and the pieces of data for learning that are known to be normal or arrhythmia, the majority of which are of normal waveform origin, are used.
- the "majority" referred to here is 95% or more.
- Normal to be employed as the data for learning refers to one determined to be “normal” by a physician, a clinical examination technician, and the like.
- the learning unit 33 performs learning using only data for learning based on normal pulse waveform data (normal waveform data). It is preferable for the learning unit 33 to use only the normal waveform data in terms of increasing the accuracy of determination, but this is not limiting.
- the data restoration unit 34 performs restoration processing on the three-dimensional feature data generated by the data conversion unit 32, the three-dimensional feature data obtained from the object 1 to be determined (hereinafter, also referred to as data for determination) using the learned model generated by the learning unit 33.
- the difference calculation unit 35 calculates a difference amount of the data before and after the restoration processing by the data restoration unit 34. Specifically, the difference calculation unit 35 generates difference data between the three-dimensional feature data before restoration and the three-dimensional feature data after restoration and calculates the difference amount based on the difference data.
- the determination unit 36 determines whether the pulse of the object 1 to be determined is the normal waveform data or arrhythmic waveform data based on the difference amount calculated by the difference calculation unit 35.
- the control unit 37 comprehensively controls the operation of the biosignal analysis system 3.
- the control unit 37 causes a display to display determined results by the determination unit 36 or outputs them externally.
- the storage unit 38 stores therein various data including various computer programs for operating the biosignal analysis system 3 and data generated by the units.
- the various computer programs include a determination program to be executed using the learned model.
- the storage unit 38 includes a read only memory (ROM) in which the various computer programs and the like are installed in advance and a random access memory (RAM), a hard disk drive (HDD), and a solid state drive (SSD) storing therein calculation parameters and data for each processing and the like.
- ROM read only memory
- RAM random access memory
- HDD hard disk drive
- SSD solid state drive
- the various computer programs can also be recorded on computer-readable recording media such as an HDD, a flash memory, a compact disc read only memory (CD-ROM), a digital versatile disc read only memory (DVD-ROM), and Blu-ray (registered trademark) to be widely distributed. It is also possible for the input unit 31 to acquire various computer programs via a communication network.
- the communication network referred to here is one including an existing public line network, a local area network (LAN), or a wide area network (WAN), for example, and may be wired or wireless.
- the biosignal analysis system 3 having the above functional configuration is a computer including one or a plurality of pieces of hardware such as a central processing unit (CPU), a graphics processing unit (GPU), an application specific integrated circuit (ASIC), and a field programmable gate array (FPGA).
- CPU central processing unit
- GPU graphics processing unit
- ASIC application specific integrated circuit
- FPGA field programmable gate array
- FIG. 5 is a flowchart of the determination processing according to the first embodiment.
- the input unit 31 acquires the electrocardiographic information 10 obtained from the object 1 to be determined via the biosignal measuring device 2 (Step S201).
- the input unit 31 generates the unit waveform data 12, which is partial extraction of the waveform data 11 of the acquired electrocardiographic information 10.
- the data conversion unit 32 converts the unit waveform data to generate the three-dimensional feature data (Step S202).
- This three-dimensional feature data serves as the data for determination or the data for learning.
- FIG. 6A and FIG. 6B are diagrams of processing examples by the data conversion unit 32 according to the first embodiment.
- FIG. 6A illustrates an example of various data in a normal waveform
- FIG. 6B illustrates an example of various data in an arrhythmic waveform.
- (a) in each drawing illustrates the unit waveform data
- (b) illustrates the data for learning or the data for determination.
- the data conversion unit 32 applies time-frequency conversion to the unit waveform data 12 obtained by the input unit 31.
- known data 14X for learning is obtained as the three-dimensional feature data for the learning processing
- data 14A and 14B for determination are obtained as the three-dimensional feature data for the determination processing.
- the data 14A for determination the normal waveform: FIG.
- the known data 14X for learning and the data 14A and 14B for determination are desirably treated as numerical data, but they can also be treated as another format, such as image data.
- unit waveform data 12A to 12D in FIG. 6A Four pieces of unit waveform data (normal unit waveform data) 12A to 12D in FIG. 6A are acquired from different objects to be determined, and it can be seen that the waveform shape differs from one object to be determined to another. Examples of the differences among individuals include the amount of depression of the S-wave and the height of the T-wave.
- time-frequency conversion by the data conversion unit 32 When the time-frequency conversion by the data conversion unit 32 is applied to these pieces of unit waveform data 12A to 12D, three-dimensional feature data 13A to 13D are obtained.
- These pieces of three-dimensional feature data 13A to 13D are used as the known data 14X for learning and the data 14A for determination of normal waveform origin, reducing the differences among individuals compared to those of the unit waveform data 12A to 12D.
- it is also possible to improve the accuracy of learning by diverting the known data 14X for learning (the three-dimensional feature data 13A to 13D) obtained from different objects in the learning unit 33 described below.
- unit waveform data 12E to 12H in FIG. 6B are each an example of major arrhythmia or its sign.
- the object of the biosignal analysis system 3 is to distinguish between the unit waveform data 12A to 12D and the unit waveform data 12E to 12H.
- three-dimensional feature data 13E to 13H are obtained.
- the data restoration unit 34 acquires the learned model generated by the learning unit 33 (Step S203). In this process, the data restoration unit 34 refers to the storage unit 38 to acquire the learned model or acquires the learned model from the learning unit 33.
- FIG. 7 is a diagram of a configuration of the auto-encoder according to the first embodiment.
- the auto-encoder 41 is a neural network model including an encoder 411 and a decoder 412.
- the encoder 411 weights a feature of each node 45 with a unique weight at each edge 46 and inputs the feature to the node 45 in the next layer while reducing the number of dimensions. This processing enables the feature of input data 43 to be compressed to a lower dimension.
- the decoder 412 performs processing opposite to that by the encoder 411 to generate restored data 44.
- the restored data 44 is a reconstruction of the input data 43 from the feature compressed by the encoder 411.
- the compression of the feature by the encoder 411 is referred to as feature extraction and the reconstruction of the feature by the decoder 412 is referred to as restoration.
- the input data 43 indicates the data 14X for learning, and in the determination processing, the input data 43 indicates the data for determination.
- the number of layers of the auto-encoder 41 and the number of nodes 45 of each layer are not limited in the present first embodiment.
- FIG. 8 is a diagram of a processing example by the learning unit 33 according to the first embodiment.
- the learning unit 33 performs learning of the auto-encoder 41 using the data for learning.
- the auto-encoder performs the restoration to generate restored data based on the feature extraction of the input data 43 input as the data for learning and an extracted feature.
- (a) of FIG. 8 represents an initial stage of learning
- (b) of FIG. 8 represents a stage in which learning has progressed to some extent.
- restored data (in learning) 44A does not restore the input data 343.
- the amount of weighting at each edge 46 is adjusted so that the difference between the input data 43 and the restored data (in learning) 44A is reduced.
- learning progresses in this way, the state changes from (a) of FIG. 8 to (b) of FIG. 8 .
- an auto-encoder 41b which has progressed in learning, has performed the feature extraction for the input data 43 and can thus generate restored data 44B, which is restored with high accuracy.
- the learned model is learned using only the data 14X for learning known to be normal, which enables the feature extraction and the restoration of the normal waveform, in which the known data 14X for learning necessary for learning of the learned model is obtained from the unit waveform data 12A to 12D, which are easily available in large quantities, for example.
- the data for learning is easily available, and thus it is easy to improve the accuracy of learning.
- the data restoration unit 34 Upon acquisition of the learned model, the data restoration unit 34 performs restoration processing using the data for determination generated at Step S202 and the learned model generated by the learning unit 33 (Step S204).
- the restoration processing gives three-dimensional feature data in which the data for determination generated at Step S202 is restored.
- FIG. 9A and FIG. 9B are diagrams of processing examples by the data restoration unit 34 according to the first embodiment.
- the data restoration unit 34 restores the data 131 and 13J for determination generated by the data conversion unit 32 to generate restored data 15A and 15B using a learned model 42 learned by the learning unit 33.
- the learned model 42 performs the feature extraction and the restoration of the normal waveform, and thus when the data 131 for determination of normal waveform origin is input, the learned model 42 can correctly perform the feature extraction and the restoration.
- the learned model 42 cannot extract the feature of arrhythmia, and the restoration accuracy is low.
- the difference calculation unit 35 After the restoration processing, the difference calculation unit 35 generates difference data between the data for determination (the three-dimensional feature data) generated at Step S202 and the three-dimensional feature data restored at Step S204 (Step S205). Subsequently, the difference calculation unit 35 calculates a difference amount from the difference data (Step S206).
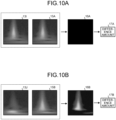
- FIG. 10A and FIG. 10B are diagrams of processing examples by the difference calculation unit 35 according to the first embodiment.
- the difference calculation unit 35 compares the data for determination and the restored data, which are the input and output, respectively, in the data restoration unit 34, generates difference data as the difference therebetween, and calculates a difference amount based on the difference data.
- general methods of difference calculation such as root mean square error (RMSE) and mean absolute error (MAE) can be used, for example, but this is not limiting.
- RMSE root mean square error
- MAE mean absolute error
- the learned model 42 can correctly restore the feature of the normal waveform, and thus difference data 16A is data with flat intensity distribution (black in this case), and the value of a difference amount 17A is small (refer to FIG. 10A ).
- the learned model 42 cannot correctly restore the feature of arrhythmia, and difference data 16B is data with nonuniform intensity distribution, and the value of a difference amount 17B is large (refer to FIG. 10B ).
- the determination unit 36 determines whether the waveform data obtained from the object 1 to be determined is normal or arrhythmia based on the difference amount calculated at Step S206 (Step S207). Subsequently, the determination unit 36 outputs a determined result (Step S208) .
- the determination unit 36 determines being normal or arrhythmia depending on whether the difference amount (e.g., the difference amounts 17A and 17B) calculated by the difference calculation unit 35 is smaller than a preset threshold and outputs a determined result.
- FIG. 11A and FIG. 11B are diagrams of processing examples by the determination unit according to the first embodiment. Let us assume that the difference amount 17A is smaller than the threshold and the difference amount 17B is larger than the threshold. As illustrated in FIG. 11A , the difference amount 17A is small in the difference amount and is thus determined to be "normal” As illustrated in FIG. 11B , on the other hand, the difference amount 17B is large in the difference amount and is thus determined to be "arrhythmia".
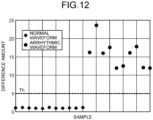
- FIG. 12 is a diagram of an analysis example by processing according to the first embodiment. Specifically, in the determination processing, 10 samples of each of the data 14A for determination and the data 14B for determination (refer to FIG. 6A and FIG. 6B ) are given as the data for determination, and difference amounts calculated by RMSE described above are illustrated. In this process, as described above, the difference amount of arrhythmic waveform origin is larger than the difference amount of normal waveform origin, and setting a threshold Th based on this difference enables determination of arrhythmia.
- the determination processing is executed after the learning processing.
- a learned model has already been output by the learning processing, it is possible to omit the learning processing and determine being normal or arrhythmia by using the existing learned model.
- the determination unit 36 can determine waveform data different from the normal waveform data, that is, arrhythmia.
- the unit for performing determination is shortened, determination is enabled even when a sufficiently continuous amount of data cannot be processed under the influence of noise or the like, and furthermore, determination is enabled even for arrhythmia occurring singly.
- the following describes a second embodiment of the present invention.
- the present second embodiment depends on the first embodiment.
- the configuration of a biosignal analysis system according to the second embodiment is the same as that of the biosignal analysis system 3 according to the first embodiment, and thus a description thereof is omitted.
- the following describes parts different from the first embodiment.
- the learning unit 33 generates a plurality of learned models by classifying the known data 14X for learning for use in learning into data groups for learning based on the feature of the waveform shape of the original unit waveform data and performing learning for each data group for learning of the classified type (feature). Examples of the feature of the waveform shape referred to here include the amount of depression of the S wave and the height of the T wave.
- the learning unit 33 has a plurality of auto-encoders provided for each classification type. Each auto-encoder generates a learned model for each classification type.
- the number of the learned models (auto-encoders) prepared in the learning unit 33 in the present second embodiment can be set freely, but it is preferable that there be four or more.
- the determination processing in the present second embodiment differs only in the learned model acquisition processing (Step S203 illustrated in FIG. 5 ), and the rest follows the flowchart illustrated in FIG. 5 .
- the learned model acquisition processing one data group for learning or one learned model (auto-encoder) is selected from the data groups for learning or the learned models (auto-encoders) of the learning unit 33 based on the feature of the waveform shape of the unit waveform data in the object 1 to be determined.
- the model for learning to be selected is determined in accordance with the purpose, but it is preferably the most appropriate one for the determination processing.
- Examples of a method for selecting the optimum learned model include a method of applying each processing to the learned models and the waveform data obtained from the object 1 to be determined by the data restoration unit 34 and the difference calculation unit 35 and selecting a learned model with the smallest output difference amount, but this is not limiting.
- the unit waveform data is subjected to the time-frequency conversion by the data conversion unit 32, and thereby the differences among individuals can be reduced.
- using the learned model in the present second embodiment can further reduce the differences among individuals and improve the determination accuracy.
- the normal waveform obtained from objects to be determined that have developed cardiac hypertrophy or cardiac enlargement differs in the feature of the waveform shape from that obtained from ordinary persons who have not developed cardiac hypertrophy or cardiac enlargement.
- the learned model learned with the electrocardiographic information 10 obtained from ordinary persons cannot correctly restore the feature of the normal waveform based on cardiac hypertrophy or cardiac enlargement, and the unevenness of the intensity distribution of the difference data and the value of the difference amount increase, which may be falsely determined to be arrhythmia.
- the learning unit 33 in the present second embodiment prepares a learned model for cardiac hypertrophy or a model for cardiac enlargement, and thereby arrhythmia can be determined with high accuracy even for objects to be determined that have developed cardiac hypertrophy or cardiac enlargement.
- the configuration of a biosignal analysis system according to the third embodiment is the same as that of the biosignal analysis system 3 according to the first embodiment, and thus a description thereof is omitted.
- the learning unit 33 performs learning with a combination of known data for learning including an object to be determined other than the object to be determined itself (hereinafter, referred to as the data 14X for learning) and data for learning based on the waveform data of the normal waveform obtained from the object to be determined itself (hereinafter, referred to as data 14Y for learning).
- Examples of the learning with a combination of the data 14X for learning and the data 14Y for learning include a method of performing learning with the data 14X for learning and the data 14Y for learning as one data group, but this is not limiting.
- the unit waveform data is subjected to the time-frequency conversion by the data conversion unit 32, and thereby the differences among individuals can be reduced.
- using the learning processing by the learning unit 33 according to the present third embodiment can further eliminate the differences among individuals by the data for learning obtained from the object to be determined itself and improve the determination accuracy.
- the present fourth embodiment depends on the third embodiment.
- the configuration of a biosignal analysis system according to the fourth embodiment is the same as that of the biosignal analysis system 3 according to the first embodiment, and thus a description thereof is omitted.
- the learning unit 33 has a plurality of learned models obtained by classifying the known data 14X for learning for use in learning into data groups for learning based on the feature of the waveform shape of the original unit waveform data and performing learning based on the classified data groups for learning. Examples of the feature of the waveform shape referred to here include the amount of depression of the S wave and the height of the T wave.
- the learning unit 33 has a plurality of auto-encoders provided for each classification type. Each auto-encoder generates a learned model for each classification type.
- the number of the data groups for learning or the learned models (auto-encoders) prepared by the learning unit 33 in the present embodiment can be set freely, but it is preferable that there be four or more.
- the learning processing or the determination processing in the present fourth embodiment basically follows the flowchart illustrated in FIG. 4 or FIG. 5 , but in the learned model generation processing (Step S102 illustrated in FIG. 4 ) and the learned model acquisition processing (Step S203 illustrated in FIG. 5 ), based on the feature of the waveform shape of the unit waveform data in the object 1 to be determined, one data group for learning or one learned model or preferably the optimum one is selected from the data groups for learning or the learned models of the learning unit 33 and is used for learning or determination.
- Examples of a method for selecting the optimum data group for learning or learned model include a method of applying each processing to a plurality of learned models learned based on the data groups for learning and the normal waveform data obtained from the object 1 to be determined by the data restoration unit 34 and the difference calculation unit 35 and selecting one with the smallest output difference amount, but this is not limiting.
- the differences among individuals can be further eliminated by the data 14Y for learning obtained from the object to be determined itself.
- using the learning processing by the learning unit 33 according to the fourth embodiment can further reduce the differences among individuals and improve the determination accuracy.
- the learning unit 33 in the present embodiment prepares a data group for learning or a learned model for cardiac hypertrophy or cardiac enlargement, and thereby arrhythmia can be determined with high accuracy even for objects to be determined that have developed cardiac hypertrophy or cardiac enlargement.
- the learned model 42 thus learned may be diverted as the learned model in the first to third embodiments.
- the configuration of a biosignal analysis system according to the fifth embodiment is the same as that of the biosignal analysis system 3 according to the first embodiment, and thus a description thereof is omitted.
- the learning processing in the present fifth embodiment basically follows the flowchart illustrated in FIG. 4 , but in the learned model generation processing (Step S102 illustrated in FIG. 4 ), the learning unit 33 performs learning using only the data 14Y for learning obtained from the object to be determined itself.
- the restoration accuracy increases, and the determination accuracy can improve.
- the differences among individuals can be further eliminated by the known data 14X for learning including the object to be determined other than the object to be determined itself and the data 14Y for learning obtained from the object to be determined itself.
- using the learning processing by the learning unit 33 according to the present fifth embodiment can completely eliminate the differences among individuals by using only the data 14Y for learning obtained from the object to be determined itself and improve the determination accuracy. That is also effective when there is no corresponding data group for learning or learned model in the second embodiment and the fourth embodiment.
- the learned model thus learned may be diverted as the learned model in the first to fourth embodiments.
- Learning using the data 14Y for learning obtained from the object to be determined itself by the learning unit 33 in the present fifth embodiment is made possible by the fact that only the normal waveform data of the object to be determined itself, which is easily available in large quantities, is necessary for learning of the learned model, and the degree of difficulty of learning is extremely low.
- the configuration of a biosignal analysis system according to the sixth embodiment is the same as that of the biosignal analysis system 3 according to the first embodiment, and thus a description thereof is omitted.
- FIG. 13A and FIG. 13B are diagrams of weighting examples of an arrhythmia-specific feature in the three-dimensional feature data according to the sixth embodiment.
- the weighting of the feature of atrial fibrillation is performed based on a region R 6 , for which a range is set for time and frequency each, but this is not limiting.
- weighted data 13K' in which the weighting of the region R 6 is performed based on data 13K for determination known to be of normal waveform origin, for example, the effect of weighting is extremely small, and difference data 16K to be obtained has flat intensity distribution as in the example in FIG. 10A (refer to FIG. 13A ).
- weighted data 13L' in which the weighting of the region R 6 is performed based on data 13L for determination known to be of atrial fibrillation origin, on the other hand, a large feature appears in the region R 6 , and thus difference data 16L to be obtained is data with nonuniform intensity distribution (refer to FIG. 13B ) .
- the data conversion unit 32 in the present sixth embodiment performs weighting in advance on the weak arrhythmia-specific features such as the F wave 11f (refer to (b) of FIG. 2 , for example) of atrial fibrillation or atrial flutter and can thereby prevent loss of the features due to restoration. Consequently, separation between the normal waveform data and the arrhythmic waveform data is made easy.
- the weak arrhythmia-specific features such as the F wave 11f (refer to (b) of FIG. 2 , for example) of atrial fibrillation or atrial flutter
- the configuration of a biosignal analysis system according to the seventh embodiment is the same as that of the biosignal analysis system 3 according to the first embodiment, and thus a description thereof is omitted.
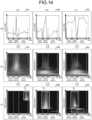
- FIG. 14 is a diagram of identification examples of an arrhythmia factor based on time-frequency coordinates according to the present seventh embodiment.
- (Sa), (Sb), and (Sc) show examples of electrocardiographic information related to atrial fibrillation, ventricular extrasystoles, and ventricular hypertrophy, respectively.
- Pieces of unit waveform data corresponding to the respective cases are the pieces of data illustrated in (a) of FIG. 14 (unit waveform data 18A to 18C), pieces of data for determination obtained by performing frequency conversion on these pieces of unit waveform data are the pieces of data illustrated in (b) of FIG.
- the determination unit 36 only determines being normal or arrhythmia based on the normal waveform and can determine arrhythmia regardless of its type, but it cannot identify an arrhythmia factor. Identification of the arrhythmia factor referred to here means identifying arrhythmia or its disease name or narrowing down the arrhythmia factor with a broad frame such as "caused by R wave" set.
- the determination unit 36 in the present seventh embodiment does not simply determine arrhythmia but identifies the arrhythmia factor by referring to coordinates in which the feature of the arrhythmia factor appears.
- the known data 14X for learning and the pieces of data 19A to 19C for determination can section waveform components (the P wave 11a, the Q wave 11b, the R wave 11c, the S wave 11d, the T wave 11e, and the F wave 11f illustrated in FIG. 2 ) from a time coordinate. It is also possible to read what kind of waveform is being drawn from the transition state of a band. As an example, FIG.
- FIG. 14 illustrates an example of sectioning into a section containing the P wave or the F wave (a PorF wave), a section containing the Q wave, the R wave, and the S wave (a QRS wave), and a section containing the T wave and the F wave (a TorF wave). If a band showing intensity has shifted toward a lower frequency direction in the time coordinate in which the R wave 11c appears as in ventricular extrasystole (Sb), for example, it means that the width of the R wave 11c has increased.
- the difference amount is calculated for each of designated coordinate ranges (e.g., regions R 11 , R 12 , R 13 , and R 14 ), and from their magnitude or their relation, the arrhythmia factor can be identified.
- the designation of the coordinate ranges may be done automatically by image processing such as edge detection, for example, or a user may input designation ranges via the input unit 31.
- Another effect of the determination unit 36 in the present seventh embodiment is that the difference amount is calculated for each designated coordinate range, and thus determination is easy even for weak features such as the occurrence of the F wave of atrial fibrillation.
- the biosignal analysis system 3 is described as including the learning unit 33, for example, but the biosignal analysis system 3 may be configured to acquire a learned model via a communication network without having the learning unit 33.
- the information to be analyzed is not limited to the electrocardiographic information, and any information using the waveform data described above can be used.
- Using the integrated biosignal analysis system according to the present invention enables determination of arrhythmia based on electrocardiographic information.
Landscapes
- Health & Medical Sciences (AREA)
- Life Sciences & Earth Sciences (AREA)
- Engineering & Computer Science (AREA)
- Cardiology (AREA)
- Physics & Mathematics (AREA)
- Medical Informatics (AREA)
- Molecular Biology (AREA)
- Biophysics (AREA)
- Biomedical Technology (AREA)
- General Health & Medical Sciences (AREA)
- Heart & Thoracic Surgery (AREA)
- Surgery (AREA)
- Animal Behavior & Ethology (AREA)
- Public Health (AREA)
- Veterinary Medicine (AREA)
- Pathology (AREA)
- Theoretical Computer Science (AREA)
- Artificial Intelligence (AREA)
- Software Systems (AREA)
- Mathematical Physics (AREA)
- Evolutionary Computation (AREA)
- Computing Systems (AREA)
- General Engineering & Computer Science (AREA)
- General Physics & Mathematics (AREA)
- Data Mining & Analysis (AREA)
- Computer Vision & Pattern Recognition (AREA)
- Computational Linguistics (AREA)
- Fuzzy Systems (AREA)
- Physiology (AREA)
- Psychiatry (AREA)
- Signal Processing (AREA)
- Measurement And Recording Of Electrical Phenomena And Electrical Characteristics Of The Living Body (AREA)
Abstract
Description
- The present invention relates to an integrated biosignal analysis system determining being normal or arrhythmia based on an electrocardiographic signal (hereinafter, electrocardiographic information), for example.
- The heart repeats contraction and expansion to play a role of a pump sending blood to the whole body. This activity maintains regularity by weak electric stimulation in myocardial cells, but if an abnormality appears in this electric stimulation, an abnormality also occurs in the activity of the heart. This is called arrhythmia. There are various types of arrhythmias, and examples thereof include ventricular fibrillation, which causes cardiac arrest and has high fatality, ventricular tachycardia, and atrial fibrillation, which causes cerebral infarction. Thus, determining arrhythmia is very important, and determining arrhythmia is being performed using electrocardiographic information acquired from an object to be determined with a biosignal measuring device.
- However, for determination of arrhythmia, a physician visually examines long-term, continuous electrocardiographic information to perform diagnosis, which places a heavy burden on the physician. Given this situation, apparatuses and methods for biosignal analysis to automatically determine arrhythmia are being used (refer to
Non Patent Literature 1 and 2, for example). - The method described in
Non Patent Literature 1 is to perform determination limited to atrial fibrillation among arrhythmias. Atrial fibrillation is an arrhythmia in which the parts called the atrium trembles due to abnormal electric excitation, and examples of features for determining it from electrocardiographic information include the occurrence of an F wave, which is a trembling component, and the abnormality of a heartbeat cycle (hereinafter, an RR ratio).Non Patent Literature 1 focuses on the latter, in which in a histogram with the RR ratio on the horizontal axis, variations are larger in atrial fibrillation than in normal sinus rhythm (hereafter, a normal waveform), from which atrial fibrillation is determined. - The method described in Non Patent Literature 2, which focuses on atrial fibrillation as in
Non Patent Literature 1, performs automatic analysis by machine learning. Non Patent Literature 2 segments acquired electrocardiographic information every 15 seconds, which are subjected to time-frequency conversion to reveal waveform features, which are classified into four categories including "normal waveform, noise, atrial fibrillation, and others", which have already been learned, to determine atrial fibrillation. -
- Non Patent Literature 1: B. Logan and J. Healey, "Robust detection of atrial fibrillation for a long term telemonitoring system," Computers in Cardiology, 2005, Lyon, 2005, pp. 619-622, doi: 10.1109/CIC.2005.1588177.
- Non Patent Literature 2: A. Qayyum, F. Meriaudeau and G. C. Y. Chan, "Classification of Atrial Fibrillation with Pre-Trained Convolutional Neural Network Models," 2018 IEEE-EMBS Conference on Biomedical Engineering and Sciences (IECBES), Sarawak, Malaysia, 2018, pp. 594-599, doi: 10.1109/IECBES.2018.8626624.
- However,
Non Patent Literature 1 and Non Patent Literature 2 have the following problems. -
Non Patent Literature 1 can only determine arrhythmias characterized by the abnormality of the RR ratio. As described above, there are various types of arrhythmias, and some arrhythmias, such as ventricular tachycardia, are not characterized by the RR ratio, which causes these arrhythmias to be missed. To evaluate the abnormality of the RR ratio from variations, the arrhythmia (variations) is required to be continuous over a long period of time to determine atrial fibrillation, and it is difficult to determine arrhythmias occurring suddenly. - Non Patent Literature 2 requires prior learning and thus cannot perform determination of unlearned arrhythmias.
- An object of the present invention is to solve the above problems of conventional technologies and provide an integrated biosignal analysis system capable of determining whether there arises arrhythmia from electrocardiographic information regardless of the type of arrhythmia.
- An integrated biosignal analysis system of the present invention achieving the above object includes the following configurations.
- (1) Provided is an integrated biosignal analysis system performing determination of arrhythmia based on electrocardiographic information. The biosignal analysis system includes:
- an input unit configured to receive input of the electrocardiographic information;
- a data conversion unit configured to perform time-frequency conversion on the electrocardiographic information to generate data for determination;
- a data restoration unit configured to restore the data for determination using a learned model including an auto-encoder to generate restored data;
- a difference calculation unit configured to calculate a difference amount between the restored data and the data for determination; and
- a determination unit configured to determine whether the data for determination is either of normal waveform data and arrhythmic waveform data based on the difference amount.
- (2) In the biosignal analysis system according to (1), the learned model is a model generated by learning using a plurality of pieces of known data for learning, 95% or more of which are generated based on normal waveform data.
- (3) In the biosignal analysis system according to (1), the learned model is a model generated by learning using a plurality of pieces of known data for learning, 95% or more of which are generated based on normal waveform data, and data for learning acquired from an object for which determination is performed.
- (4) In the biosignal analysis system according to (1), the learned model is a model generated by learning using data for learning acquired from an object to be determined.
- (5) In the biosignal analysis system according to any one of (1) to (4), the input unit is configured to segment waveform data of the electrocardiographic information into unit waveform data in which waveform data in a predetermined time range is extracted, and the data conversion unit is configured to perform time-frequency conversion on the unit waveform data to generate the data for determination.
- (6) In the biosignal analysis system according to any one of (1) to (5), the data conversion unit is configured to generate weighted data in which a time-frequency feature region of arrhythmia in the data for determination is weighted.
- (7) In the biosignal analysis system according to any one of (1) to (6), the difference calculation unit is configured to generate difference data indicating a difference between the restored data and the data for determination and calculate the difference amount based on the difference data, and the determination unit is configured to identify an arrhythmia factor based on a time and frequency feature of the difference data.
- (8) In the biosignal analysis system according to any one of (1) to (7), the learned model is a model generated by learning using data for learning known to be the normal waveform data.
- (9) The biosignal analysis system according to any one of (1) to (8) further includes a learning unit configured to perform learning of the auto-encoder using data for learning to generate the learned model.
- (10) The biosignal analysis system according to (2) further includes a learning unit configured to perform learning of the auto-encoder using the data for learning to generate the learned model. The learning unit includes a plurality of auto-encoders corresponding to features of the known data for learning, and is configured to select one auto-encoder from the auto-encoders based on a feature of normal waveform data of an object to be determined.
- (11) The biosignal analysis system according to (3) further includes a learning unit configured to perform learning of the auto-encoder using the data for learning to generate the learned model. The learning unit includes a plurality of data groups for learning or a plurality of auto-encoders corresponding to features of the pieces of known data for learning and is configured to select one data group for learning or one auto-encoder from the data groups for learning or the auto-encoders based on a feature of normal waveform data of an object to be determined. Advantageous Effects of Invention
- The present invention can provide an integrated biosignal analysis system capable of determining whether there arises arrhythmia from electrocardiographic information regardless of the type of arrhythmia.
-
-
FIG. 1 is a diagram of a configuration example of an integrated biosignal analysis system according to a first embodiment. -
FIG. 2 is a diagram of a detailed example of electrocardiographic information for use in analysis. -
FIG. 3 is a diagram of a processing example by an input unit for the electrocardiographic information according to the first embodiment. -
FIG. 4 is a flowchart of learning processing according to the first embodiment. -
FIG. 5 is a flowchart of determination processing according to the first embodiment. -
FIG. 6A is a diagram (No. 1) of a processing example by a data conversion unit according to the first embodiment. -
FIG. 6B is a diagram (No. 2) of the processing example by the data conversion unit according to the first embodiment. -
FIG. 7 is a diagram of a configuration of an auto-encoder according to the first embodiment. -
FIG. 8 is a diagram of a processing example by a learning unit according to the first embodiment. -
FIG. 9A is a diagram (No. 1) of a processing example by a data restoration unit according to the first embodiment. -
FIG. 9B is a diagram (No. 2) of the processing example by the data restoration unit according to the first embodiment. -
FIG. 10A is a diagram (No. 1) of a processing example by a difference calculation unit according to the first embodiment. -
FIG. 10B is a diagram (No. 2) of the processing example by the difference calculation unit according to the first embodiment. -
FIG. 11A is a diagram (No. 1) of a processing example by a determination unit according to the first embodiment. -
FIG. 11B is a diagram (No. 2) of the processing example by the determination unit according to the first embodiment. -
FIG. 12 is a diagram of an analysis example by processing according to the first embodiment. -
FIG. 13A is a diagram (No. 1) of a weighting example of an arrhythmia-specific feature in three-dimensional feature data according to a sixth embodiment. -
FIG. 13B is a diagram (No. 2) of the weighting example of the arrhythmia-specific feature in the three-dimensional feature data according to the sixth embodiment. -
FIG. 14 is a diagram of identification examples of an arrhythmia factor based on time-frequency coordinates according to a seventh embodiment. - The following describes embodiments of an integrated biosignal analysis system according to the present invention in detail based on the accompanying drawings. The present invention is not limited by these embodiments. The individual embodiments of the present invention are not independent of each other and can be performed as appropriate combined with each other.
-
FIG. 1 is a diagram of a configuration example of an integrated biosignal analysis system according to a first embodiment of the present invention. According toFIG. 1 ,electrocardiographic information 10 to be analyzed is acquired from anobject 1 to be determined via a biosignal measuring device 2. Theobject 1 to be determined is a human, an animal, and the like, which is not limited to a particular object. Examples of the biosignal measuring device 2 include an electrocardiograph. - The
electrocardiographic information 10 acquired from the object to be determined includes information on theobject 1 to be determined, the date, time, and place of acquisition, and a measurement result. The measurement result iswaveform data 11 obtained by performing plotting with time on the horizontal axis and voltage on the vertical axis (refer toFIG. 1 ). -
FIG. 2 is a diagram of a detailed example of theelectrocardiographic information 10 for use in analysis. (a) ofFIG. 2 illustrateswaveform data 11A of a normal pulse, whereas (b) ofFIG. 2 is an example ofwaveform data 11B of atrial fibrillation in which an F wave occurs. Each waveform data can contain components called aP wave 11a, aQ wave 11b, anR wave 11c, anS wave 11d, aT wave 11e, and anF wave 11f, and these shapes are used as criteria for arrhythmia. The waveform data of theelectrocardiographic information 10 may change its shape depending on the object to be determined and/or the biosignal measuring device. - Referring back to
FIG. 1 , thisbiosignal analysis system 3 according to the present invention includes aninput unit 31, adata conversion unit 32, alearning unit 33, adata restoration unit 34, adifference calculation unit 35, adetermination unit 36, acontrol unit 37, and astorage unit 38. - The
input unit 31 receives input of the electrocardiographic information output from the biosignal measuring device 2. Theinput unit 31 extracts unit waveform data from thewaveform data 11 of the acquired electrocardiographic information. Theinput unit 31 includes a connector electrically connecting to the biosignal measuring device 2, a communication apparatus including means to communicate with the biosignal measuring device 2, or an input port for media in which data is stored and may further include user interfaces such as a keyboard, a mouse, and a microphone. - The
data conversion unit 32 applies conversion processing to theelectrocardiographic information 10. Specifically, frequency analysis is applied to waveform data showing the relation between time and intensity (voltage in this case) to generate three-dimensional time-frequency-intensity feature data. -
FIG. 3 is a diagram of a processing example by theinput unit 31 for the electrocardiographic information according to the first embodiment. Theinput unit 31 generatesunit waveform data 12 extracted for each designated unit for thewaveform data 11 illustrated in (a) ofFIG. 3 (refer to (b) ofFIG. 3 ) and registers it in thestorage unit 38. Examples of the extraction of theunit waveform data 12 include setting a designated period as a unit based on time axis information and setting a designated number of waveforms as a unit with a peak position of theR wave 11c as an extraction reference position, but this is not limiting. In the example illustrated inFIG. 3 , a peak position 11cp of theR wave 11c is detected, and a designated number of seconds before and after the peak position 11cp of theR wave 11c are set as one unit, and thereby theunit waveform data 12 represents a single waveform based on thewaveform data 11. Subsequently, thedata conversion unit 32 applies processing to generate three-dimensional feature data 13 from the unit waveform data 12 (refer to (c) ofFIG. 3 . - In the
waveform data 11, the intervals of the pieces ofunit waveform data 12 are not constant due to fluctuations in heartbeat. Segmentation by each unit waveform improves the learning accuracy of an auto-encoder 41 in thelearning unit 33 described below and inhibits mixing of noise into difference data and a difference amount in thedifference calculation unit 35, and thus the accuracy of determination of arrhythmia improves. In addition, sections that do not have useful information for determination, such as out-of-unit waveform data 11g in (b) ofFIG. 3 , are excluded, and thus the amount of processing can be reduced. - In the example illustrated in
FIG. 3 , to perform segmentation by each unit waveform, the designated number of seconds before and after the peak position 11cp of theR wave 11c detected from the maximum value of a certain section are set as one unit waveform, but this is not limiting. If the waveform data does not have theR wave 11c and the peak position 11cp of theR wave 11c cannot be detected, theinput unit 31 determines the maximum value of the waveform data and extracts a designated number of seconds before and after that time, as a reference position, as one unit. - The
learning unit 33 performs learning optimizing network parameters of a neural network to generate a learned model. Thelearning unit 33 has an auto-encoder and performs learning of the auto-encoder with three-dimensional feature data generated based on the electrocardiographic information as data for learning. Examples of the learning include learning using the error back-propagation method and the stochastic gradient descent method. Thelearning unit 33 causes thestorage unit 38 to store therein the learned model after learning (hereinafter, also referred to simply as the learned model). - The following describes learning processing by the
learning unit 33.FIG. 4 is a flowchart of learning processing by thebiosignal analysis system 3. In the learning processing, the three-dimensional feature data 13 is acquired as the data for learning from the unit waveform data, which has been generated by thedata conversion unit 32 applying each processing based on theelectrocardiographic information 10 input to the input unit 31 (Step S101). Thelearning unit 33 performs learning of the auto-encoder using the generated data for learning and outputs the learned model after learning. In this process, a plurality of pieces of data for learning are prepared, and the pieces of data for learning that are known to be normal or arrhythmia, the majority of which are of normal waveform origin, are used. The "majority" referred to here is 95% or more. "Normal" to be employed as the data for learning refers to one determined to be "normal" by a physician, a clinical examination technician, and the like. In the present first embodiment, thelearning unit 33 performs learning using only data for learning based on normal pulse waveform data (normal waveform data). It is preferable for thelearning unit 33 to use only the normal waveform data in terms of increasing the accuracy of determination, but this is not limiting. - Referring back to
FIG. 1 , thedata restoration unit 34 performs restoration processing on the three-dimensional feature data generated by thedata conversion unit 32, the three-dimensional feature data obtained from theobject 1 to be determined (hereinafter, also referred to as data for determination) using the learned model generated by thelearning unit 33. - The
difference calculation unit 35 calculates a difference amount of the data before and after the restoration processing by thedata restoration unit 34. Specifically, thedifference calculation unit 35 generates difference data between the three-dimensional feature data before restoration and the three-dimensional feature data after restoration and calculates the difference amount based on the difference data. - The
determination unit 36 determines whether the pulse of theobject 1 to be determined is the normal waveform data or arrhythmic waveform data based on the difference amount calculated by thedifference calculation unit 35. - The
control unit 37 comprehensively controls the operation of thebiosignal analysis system 3. Thecontrol unit 37 causes a display to display determined results by thedetermination unit 36 or outputs them externally. - The
storage unit 38 stores therein various data including various computer programs for operating thebiosignal analysis system 3 and data generated by the units. The various computer programs include a determination program to be executed using the learned model. Thestorage unit 38 includes a read only memory (ROM) in which the various computer programs and the like are installed in advance and a random access memory (RAM), a hard disk drive (HDD), and a solid state drive (SSD) storing therein calculation parameters and data for each processing and the like. - The various computer programs can also be recorded on computer-readable recording media such as an HDD, a flash memory, a compact disc read only memory (CD-ROM), a digital versatile disc read only memory (DVD-ROM), and Blu-ray (registered trademark) to be widely distributed. It is also possible for the
input unit 31 to acquire various computer programs via a communication network. The communication network referred to here is one including an existing public line network, a local area network (LAN), or a wide area network (WAN), for example, and may be wired or wireless. - The
biosignal analysis system 3 having the above functional configuration is a computer including one or a plurality of pieces of hardware such as a central processing unit (CPU), a graphics processing unit (GPU), an application specific integrated circuit (ASIC), and a field programmable gate array (FPGA). - The following describes determination processing for being normal or arrhythmia based on the electrocardiographic information obtained from the
object 1 to be determined.FIG. 5 is a flowchart of the determination processing according to the first embodiment. In the determination processing, first, theinput unit 31 acquires theelectrocardiographic information 10 obtained from theobject 1 to be determined via the biosignal measuring device 2 (Step S201). Theinput unit 31 generates theunit waveform data 12, which is partial extraction of thewaveform data 11 of the acquiredelectrocardiographic information 10. - The
data conversion unit 32 converts the unit waveform data to generate the three-dimensional feature data (Step S202). This three-dimensional feature data serves as the data for determination or the data for learning. -
FIG. 6A andFIG. 6B are diagrams of processing examples by thedata conversion unit 32 according to the first embodiment.FIG. 6A illustrates an example of various data in a normal waveform, andFIG. 6B illustrates an example of various data in an arrhythmic waveform. In addition, (a) in each drawing illustrates the unit waveform data, and (b) illustrates the data for learning or the data for determination. Thedata conversion unit 32 applies time-frequency conversion to theunit waveform data 12 obtained by theinput unit 31. In this process, knowndata 14X for learning is obtained as the three-dimensional feature data for the learning processing, anddata data 14A for determination (the normal waveform:FIG. 6A ) and thedata 14B for determination (the arrhythmic waveform:FIG. 6B ), but in reality, it is unknown whether they are the normal waveform or the arrhythmic waveform. For the time-frequency conversion, general frequency conversion methods such as short-time Fourier transform and wavelet transform can be used, for example, but this is not limiting. The knowndata 14X for learning and thedata - Four pieces of unit waveform data (normal unit waveform data) 12A to 12D in
FIG. 6A are acquired from different objects to be determined, and it can be seen that the waveform shape differs from one object to be determined to another. Examples of the differences among individuals include the amount of depression of the S-wave and the height of the T-wave. When the time-frequency conversion by thedata conversion unit 32 is applied to these pieces ofunit waveform data 12A to 12D, three-dimensional feature data 13A to 13D are obtained. These pieces of three-dimensional feature data 13A to 13D are used as the knowndata 14X for learning and thedata 14A for determination of normal waveform origin, reducing the differences among individuals compared to those of theunit waveform data 12A to 12D. Thus, it is also possible to improve the accuracy of learning by diverting the knowndata 14X for learning (the three-dimensional feature data 13A to 13D) obtained from different objects in thelearning unit 33 described below. - Four pieces of unit waveform data (arrhythmic unit waveform data) 12E to 12H in
FIG. 6B are each an example of major arrhythmia or its sign. The object of thebiosignal analysis system 3 is to distinguish between theunit waveform data 12A to 12D and theunit waveform data 12E to 12H. However, it is difficult to capture the data features of the pieces of unit waveform data as they are, and it is difficult to distinguish between them. Thus, by applying the time-frequency conversion by thedata conversion unit 32 in the same way, three-dimensional feature data 13E to 13H are obtained. These pieces of three-dimensional feature data 13E to 13H are used as thedata 14B for determination of arrhythmic waveform origin, and arrhythmia-specific features appear in the regions R1 to R5 illustrated in (b) ofFIG. 6B , making a distinction from the normal waveform easy. - After data conversion, the
data restoration unit 34 acquires the learned model generated by the learning unit 33 (Step S203). In this process, thedata restoration unit 34 refers to thestorage unit 38 to acquire the learned model or acquires the learned model from thelearning unit 33. - The following describes the learned data generated by the
learning unit 33 with reference toFIG. 7 andFIG. 8 .FIG. 7 is a diagram of a configuration of the auto-encoder according to the first embodiment. As illustrated inFIG. 7 , the auto-encoder 41 is a neural network model including anencoder 411 and adecoder 412. Theencoder 411 weights a feature of eachnode 45 with a unique weight at eachedge 46 and inputs the feature to thenode 45 in the next layer while reducing the number of dimensions. This processing enables the feature ofinput data 43 to be compressed to a lower dimension. Thedecoder 412 performs processing opposite to that by theencoder 411 to generate restoreddata 44. That is, the restoreddata 44 is a reconstruction of theinput data 43 from the feature compressed by theencoder 411. In the following, the compression of the feature by theencoder 411 is referred to as feature extraction and the reconstruction of the feature by thedecoder 412 is referred to as restoration. Regarding the input and output of the auto-encoder 41, in the learning processing, theinput data 43 indicates thedata 14X for learning, and in the determination processing, theinput data 43 indicates the data for determination. The number of layers of the auto-encoder 41 and the number ofnodes 45 of each layer are not limited in the present first embodiment. -
FIG. 8 is a diagram of a processing example by thelearning unit 33 according to the first embodiment. Thelearning unit 33 performs learning of the auto-encoder 41 using the data for learning. The auto-encoder performs the restoration to generate restored data based on the feature extraction of theinput data 43 input as the data for learning and an extracted feature. (a) ofFIG. 8 represents an initial stage of learning, and (b) ofFIG. 8 represents a stage in which learning has progressed to some extent. As illustrated in (a) ofFIG. 8 , when learning is still insufficient, the accuracy of the feature extraction is low, and restored data (in learning) 44A does not restore the input data 343. By learning of an auto-encoder 41a (refer to (a) ofFIG. 8 ), the amount of weighting at eachedge 46 is adjusted so that the difference between theinput data 43 and the restored data (in learning) 44A is reduced. As learning progresses in this way, the state changes from (a) ofFIG. 8 to (b) ofFIG. 8 . Specifically, an auto-encoder 41b, which has progressed in learning, has performed the feature extraction for theinput data 43 and can thus generate restoreddata 44B, which is restored with high accuracy. - In the present first embodiment, the learned model is learned using only the
data 14X for learning known to be normal, which enables the feature extraction and the restoration of the normal waveform, in which the knowndata 14X for learning necessary for learning of the learned model is obtained from theunit waveform data 12A to 12D, which are easily available in large quantities, for example. Thus, there is no need to learn arrhythmia to be detected as in the past, and the data for learning is easily available, and thus it is easy to improve the accuracy of learning. - Upon acquisition of the learned model, the
data restoration unit 34 performs restoration processing using the data for determination generated at Step S202 and the learned model generated by the learning unit 33 (Step S204). The restoration processing gives three-dimensional feature data in which the data for determination generated at Step S202 is restored. -
FIG. 9A and FIG. 9B are diagrams of processing examples by thedata restoration unit 34 according to the first embodiment. For convenience, a distinction is made betweendata 131 for determination (the normal waveform:FIG. 9A ) anddata 13J for determination (the arrhythmic waveform:FIG. 9B ), but in reality, it is unknown whether they are the normal waveform or the arrhythmic waveform. Thedata restoration unit 34 restores thedata data conversion unit 32 to generate restoreddata model 42 learned by thelearning unit 33. - The learned
model 42 performs the feature extraction and the restoration of the normal waveform, and thus when thedata 131 for determination of normal waveform origin is input, the learnedmodel 42 can correctly perform the feature extraction and the restoration. When thedata 13J for determination of arrhythmia origin is input, on the other hand, the learnedmodel 42 cannot extract the feature of arrhythmia, and the restoration accuracy is low. - After the restoration processing, the
difference calculation unit 35 generates difference data between the data for determination (the three-dimensional feature data) generated at Step S202 and the three-dimensional feature data restored at Step S204 (Step S205). Subsequently, thedifference calculation unit 35 calculates a difference amount from the difference data (Step S206). -
FIG. 10A and FIG. 10B are diagrams of processing examples by thedifference calculation unit 35 according to the first embodiment. Thedifference calculation unit 35 compares the data for determination and the restored data, which are the input and output, respectively, in thedata restoration unit 34, generates difference data as the difference therebetween, and calculates a difference amount based on the difference data. For the calculation of the difference amount, general methods of difference calculation such as root mean square error (RMSE) and mean absolute error (MAE) can be used, for example, but this is not limiting. When the data 13I for determination is input to thedata restoration unit 34, the learnedmodel 42 can correctly restore the feature of the normal waveform, and thusdifference data 16A is data with flat intensity distribution (black in this case), and the value of adifference amount 17A is small (refer toFIG. 10A ). When thedata 13J for determination is input to thedata restoration unit 34, on the other hand, the learnedmodel 42 cannot correctly restore the feature of arrhythmia, anddifference data 16B is data with nonuniform intensity distribution, and the value of adifference amount 17B is large (refer toFIG. 10B ). - The
determination unit 36 determines whether the waveform data obtained from theobject 1 to be determined is normal or arrhythmia based on the difference amount calculated at Step S206 (Step S207). Subsequently, thedetermination unit 36 outputs a determined result (Step S208) . - Specifically, the
determination unit 36 determines being normal or arrhythmia depending on whether the difference amount (e.g., the difference amounts 17A and 17B) calculated by thedifference calculation unit 35 is smaller than a preset threshold and outputs a determined result.FIG. 11A and FIG. 11B are diagrams of processing examples by the determination unit according to the first embodiment. Let us assume that thedifference amount 17A is smaller than the threshold and thedifference amount 17B is larger than the threshold. As illustrated inFIG. 11A , thedifference amount 17A is small in the difference amount and is thus determined to be "normal" As illustrated inFIG. 11B , on the other hand, thedifference amount 17B is large in the difference amount and is thus determined to be "arrhythmia". -
FIG. 12 is a diagram of an analysis example by processing according to the first embodiment. Specifically, in the determination processing, 10 samples of each of thedata 14A for determination and thedata 14B for determination (refer toFIG. 6A andFIG. 6B ) are given as the data for determination, and difference amounts calculated by RMSE described above are illustrated. In this process, as described above, the difference amount of arrhythmic waveform origin is larger than the difference amount of normal waveform origin, and setting a threshold Th based on this difference enables determination of arrhythmia. - In principle, the determination processing is executed after the learning processing. However, if a learned model has already been output by the learning processing, it is possible to omit the learning processing and determine being normal or arrhythmia by using the existing learned model.
- According to the first embodiment described above, the
determination unit 36 can determine waveform data different from the normal waveform data, that is, arrhythmia. In addition, if the unit for performing determination is shortened, determination is enabled even when a sufficiently continuous amount of data cannot be processed under the influence of noise or the like, and furthermore, determination is enabled even for arrhythmia occurring singly. - The following describes a second embodiment of the present invention. The present second embodiment depends on the first embodiment. The configuration of a biosignal analysis system according to the second embodiment is the same as that of the
biosignal analysis system 3 according to the first embodiment, and thus a description thereof is omitted. The following describes parts different from the first embodiment. - In the present second embodiment, the
learning unit 33 generates a plurality of learned models by classifying the knowndata 14X for learning for use in learning into data groups for learning based on the feature of the waveform shape of the original unit waveform data and performing learning for each data group for learning of the classified type (feature). Examples of the feature of the waveform shape referred to here include the amount of depression of the S wave and the height of the T wave. In the second embodiment, thelearning unit 33 has a plurality of auto-encoders provided for each classification type. Each auto-encoder generates a learned model for each classification type. The number of the learned models (auto-encoders) prepared in thelearning unit 33 in the present second embodiment can be set freely, but it is preferable that there be four or more. - The determination processing in the present second embodiment differs only in the learned model acquisition processing (Step S203 illustrated in
FIG. 5 ), and the rest follows the flowchart illustrated inFIG. 5 . In the learned model acquisition processing, one data group for learning or one learned model (auto-encoder) is selected from the data groups for learning or the learned models (auto-encoders) of thelearning unit 33 based on the feature of the waveform shape of the unit waveform data in theobject 1 to be determined. The model for learning to be selected is determined in accordance with the purpose, but it is preferably the most appropriate one for the determination processing. Examples of a method for selecting the optimum learned model include a method of applying each processing to the learned models and the waveform data obtained from theobject 1 to be determined by thedata restoration unit 34 and thedifference calculation unit 35 and selecting a learned model with the smallest output difference amount, but this is not limiting. - In the first embodiment, as the feature of the learning processing, the unit waveform data is subjected to the time-frequency conversion by the
data conversion unit 32, and thereby the differences among individuals can be reduced. However, using the learned model in the present second embodiment can further reduce the differences among individuals and improve the determination accuracy. - In addition, the normal waveform obtained from objects to be determined that have developed cardiac hypertrophy or cardiac enlargement differs in the feature of the waveform shape from that obtained from ordinary persons who have not developed cardiac hypertrophy or cardiac enlargement. Thus, the learned model learned with the
electrocardiographic information 10 obtained from ordinary persons cannot correctly restore the feature of the normal waveform based on cardiac hypertrophy or cardiac enlargement, and the unevenness of the intensity distribution of the difference data and the value of the difference amount increase, which may be falsely determined to be arrhythmia. In such a case, thelearning unit 33 in the present second embodiment prepares a learned model for cardiac hypertrophy or a model for cardiac enlargement, and thereby arrhythmia can be determined with high accuracy even for objects to be determined that have developed cardiac hypertrophy or cardiac enlargement. - The following describes a third embodiment of the present invention. The configuration of a biosignal analysis system according to the third embodiment is the same as that of the
biosignal analysis system 3 according to the first embodiment, and thus a description thereof is omitted. The following describes parts different from the first embodiment. - In the present third embodiment, the
learning unit 33 performs learning with a combination of known data for learning including an object to be determined other than the object to be determined itself (hereinafter, referred to as thedata 14X for learning) and data for learning based on the waveform data of the normal waveform obtained from the object to be determined itself (hereinafter, referred to as data 14Y for learning). Examples of the learning with a combination of thedata 14X for learning and the data 14Y for learning include a method of performing learning with thedata 14X for learning and the data 14Y for learning as one data group, but this is not limiting. By using a thus obtained learned model as the learned model of thedata restoration unit 34 in the determination processing, the restoration accuracy increases, and the determination accuracy can improve. - In the first embodiment and the second embodiment, as the feature of the learning processing, the unit waveform data is subjected to the time-frequency conversion by the
data conversion unit 32, and thereby the differences among individuals can be reduced. However, using the learning processing by thelearning unit 33 according to the present third embodiment can further eliminate the differences among individuals by the data for learning obtained from the object to be determined itself and improve the determination accuracy. The learned model thus learned may be diverted as the learned model in the first embodiment. Learning by thelearning unit 33 in the present third embodiment is made possible by the fact that only the normal waveform data, which is easily available in large quantities, is necessary for learning of the learned model, and the degree of difficulty of learning is extremely low. - The following describes a fourth embodiment of the present invention. The present fourth embodiment depends on the third embodiment. The configuration of a biosignal analysis system according to the fourth embodiment is the same as that of the
biosignal analysis system 3 according to the first embodiment, and thus a description thereof is omitted. The following describes parts different from the third embodiment. - In the present fourth embodiment, the
learning unit 33 has a plurality of learned models obtained by classifying the knowndata 14X for learning for use in learning into data groups for learning based on the feature of the waveform shape of the original unit waveform data and performing learning based on the classified data groups for learning. Examples of the feature of the waveform shape referred to here include the amount of depression of the S wave and the height of the T wave. In the fourth embodiment, thelearning unit 33 has a plurality of auto-encoders provided for each classification type. Each auto-encoder generates a learned model for each classification type. The number of the data groups for learning or the learned models (auto-encoders) prepared by thelearning unit 33 in the present embodiment can be set freely, but it is preferable that there be four or more. - The learning processing or the determination processing in the present fourth embodiment basically follows the flowchart illustrated in
FIG. 4 or FIG. 5 , but in the learned model generation processing (Step S102 illustrated inFIG. 4 ) and the learned model acquisition processing (Step S203 illustrated inFIG. 5 ), based on the feature of the waveform shape of the unit waveform data in theobject 1 to be determined, one data group for learning or one learned model or preferably the optimum one is selected from the data groups for learning or the learned models of thelearning unit 33 and is used for learning or determination. Examples of a method for selecting the optimum data group for learning or learned model include a method of applying each processing to a plurality of learned models learned based on the data groups for learning and the normal waveform data obtained from theobject 1 to be determined by thedata restoration unit 34 and thedifference calculation unit 35 and selecting one with the smallest output difference amount, but this is not limiting. - In the third embodiment, as the feature of the learning processing, the differences among individuals can be further eliminated by the data 14Y for learning obtained from the object to be determined itself. However, using the learning processing by the
learning unit 33 according to the fourth embodiment can further reduce the differences among individuals and improve the determination accuracy. - In addition, the normal waveform obtained from objects to be determined that have developed cardiac hypertrophy or cardiac enlargement differs in the feature of the waveform shape from that obtained from ordinary persons. Thus, the learned model learned with the
electrocardiographic information 10 obtained from ordinary persons cannot correctly restore the feature of the normal waveform based on cardiac hypertrophy or cardiac enlargement, and the unevenness of the intensity distribution of the difference data and the value of the difference amount increase, which may be falsely determined to be arrhythmia. In such a case, thelearning unit 33 in the present embodiment prepares a data group for learning or a learned model for cardiac hypertrophy or cardiac enlargement, and thereby arrhythmia can be determined with high accuracy even for objects to be determined that have developed cardiac hypertrophy or cardiac enlargement. The learnedmodel 42 thus learned may be diverted as the learned model in the first to third embodiments. - The following describes a fifth embodiment of the present invention. The configuration of a biosignal analysis system according to the fifth embodiment is the same as that of the
biosignal analysis system 3 according to the first embodiment, and thus a description thereof is omitted. The following describes parts different from the first embodiment. - The learning processing in the present fifth embodiment basically follows the flowchart illustrated in
FIG. 4 , but in the learned model generation processing (Step S102 illustrated inFIG. 4 ), thelearning unit 33 performs learning using only the data 14Y for learning obtained from the object to be determined itself. By using a thus obtained learned model as the learned model of thedata restoration unit 34 in the determination processing, the restoration accuracy increases, and the determination accuracy can improve. - In the third embodiment, as the feature of the learning processing, the differences among individuals can be further eliminated by the known
data 14X for learning including the object to be determined other than the object to be determined itself and the data 14Y for learning obtained from the object to be determined itself. However, using the learning processing by thelearning unit 33 according to the present fifth embodiment can completely eliminate the differences among individuals by using only the data 14Y for learning obtained from the object to be determined itself and improve the determination accuracy. That is also effective when there is no corresponding data group for learning or learned model in the second embodiment and the fourth embodiment. The learned model thus learned may be diverted as the learned model in the first to fourth embodiments. Learning using the data 14Y for learning obtained from the object to be determined itself by thelearning unit 33 in the present fifth embodiment is made possible by the fact that only the normal waveform data of the object to be determined itself, which is easily available in large quantities, is necessary for learning of the learned model, and the degree of difficulty of learning is extremely low. - The following describes a sixth embodiment of the present invention. The configuration of a biosignal analysis system according to the sixth embodiment is the same as that of the
biosignal analysis system 3 according to the first embodiment, and thus a description thereof is omitted. The following describes parts different from the first embodiment. - In (b) of
FIG. 6B , in the three-dimensional feature data 13E of atrial fibrillation origin, the arrhythmia-specific features appear in the regions R1 and R2, but these features are so weak that they may be lost in the restoration processing by thedata restoration unit 34 or become small as the difference amount of the entire data in the arrhythmia determination by thedetermination unit 36, which may make separation from the normal waveform data difficult. - Given this situation, the
data conversion unit 32 in the present sixth embodiment performs weighting on a time-frequency feature region in which an arrhythmia-specific feature appears in the data for determination.FIG. 13A and FIG. 13B are diagrams of weighting examples of an arrhythmia-specific feature in the three-dimensional feature data according to the sixth embodiment. InFIG. 13A and FIG. 13B , as an example, the weighting of the feature of atrial fibrillation is performed based on a region R6, for which a range is set for time and frequency each, but this is not limiting. Inweighted data 13K', in which the weighting of the region R6 is performed based ondata 13K for determination known to be of normal waveform origin, for example, the effect of weighting is extremely small, anddifference data 16K to be obtained has flat intensity distribution as in the example inFIG. 10A (refer toFIG. 13A ). Inweighted data 13L', in which the weighting of the region R6 is performed based ondata 13L for determination known to be of atrial fibrillation origin, on the other hand, a large feature appears in the region R6, and thusdifference data 16L to be obtained is data with nonuniform intensity distribution (refer toFIG. 13B ) . - Thus, the
data conversion unit 32 in the present sixth embodiment performs weighting in advance on the weak arrhythmia-specific features such as theF wave 11f (refer to (b) ofFIG. 2 , for example) of atrial fibrillation or atrial flutter and can thereby prevent loss of the features due to restoration. Consequently, separation between the normal waveform data and the arrhythmic waveform data is made easy. - The following describes a seventh embodiment of the present invention. The configuration of a biosignal analysis system according to the seventh embodiment is the same as that of the
biosignal analysis system 3 according to the first embodiment, and thus a description thereof is omitted. The following describes parts different from the first embodiment. -
FIG. 14 is a diagram of identification examples of an arrhythmia factor based on time-frequency coordinates according to the present seventh embodiment. InFIG. 14 , (Sa), (Sb), and (Sc) show examples of electrocardiographic information related to atrial fibrillation, ventricular extrasystoles, and ventricular hypertrophy, respectively. Pieces of unit waveform data corresponding to the respective cases are the pieces of data illustrated in (a) ofFIG. 14 (unit waveform data 18A to 18C), pieces of data for determination obtained by performing frequency conversion on these pieces of unit waveform data are the pieces of data illustrated in (b) ofFIG. 14 (data 19A to 19C for determination), and pieces of difference data based on these pieces of data for determination and pieces of data for determination after restoration are the pieces of data illustrated in (c) ofFIG. 14 (difference data 20A to 20C). In the first to third embodiments, thedetermination unit 36 only determines being normal or arrhythmia based on the normal waveform and can determine arrhythmia regardless of its type, but it cannot identify an arrhythmia factor. Identification of the arrhythmia factor referred to here means identifying arrhythmia or its disease name or narrowing down the arrhythmia factor with a broad frame such as "caused by R wave" set. - Thus, the
determination unit 36 in the present seventh embodiment does not simply determine arrhythmia but identifies the arrhythmia factor by referring to coordinates in which the feature of the arrhythmia factor appears. The knowndata 14X for learning and the pieces ofdata 19A to 19C for determination can section waveform components (theP wave 11a, theQ wave 11b, theR wave 11c, theS wave 11d, theT wave 11e, and theF wave 11f illustrated inFIG. 2 ) from a time coordinate. It is also possible to read what kind of waveform is being drawn from the transition state of a band. As an example,FIG. 14 illustrates an example of sectioning into a section containing the P wave or the F wave (a PorF wave), a section containing the Q wave, the R wave, and the S wave (a QRS wave), and a section containing the T wave and the F wave (a TorF wave). If a band showing intensity has shifted toward a lower frequency direction in the time coordinate in which theR wave 11c appears as in ventricular extrasystole (Sb), for example, it means that the width of theR wave 11c has increased. Thus, based on the difference data obtained from the data for determination and the restored data, the difference amount is calculated for each of designated coordinate ranges (e.g., regions R11, R12, R13, and R14), and from their magnitude or their relation, the arrhythmia factor can be identified. In this case, the designation of the coordinate ranges may be done automatically by image processing such as edge detection, for example, or a user may input designation ranges via theinput unit 31. - Another effect of the
determination unit 36 in the present seventh embodiment is that the difference amount is calculated for each designated coordinate range, and thus determination is easy even for weak features such as the occurrence of the F wave of atrial fibrillation. - The aspects for performing the present invention have been described, but the present invention should not be limited only by the embodiments described above. The
biosignal analysis system 3 is described as including thelearning unit 33, for example, but thebiosignal analysis system 3 may be configured to acquire a learned model via a communication network without having the learningunit 33. The information to be analyzed is not limited to the electrocardiographic information, and any information using the waveform data described above can be used. - Using the integrated biosignal analysis system according to the present invention enables determination of arrhythmia based on electrocardiographic information.
-
- 1 OBJECT TO BE DETERMINED
- 2 BIOSIGNAL MEASURING DEVICE
- 3 BIOSIGNAL ANALYSIS SYSTEM
- 10 ELECTROCARDIOGRAPHIC INFORMATION
- 11 WAVEFORM DATA
- 12 and 12A to 12H UNIT WAVEFORM DATA
- 13 and 13A to 13H THREE-DIMENSIONAL FEATURE DATA
- 13I to 13L, 14A, 14B, and 19A to 19C DATA FOR DETERMINATION
- 13K' and 13L' WEIGHTED DATA
- 14X DATA FOR LEARNING
- 15A and 15B RESTORED DATA
- 16A, 16B, 16K, 16L, and 20A to 20C DIFFERENCE DATA
- 17A and 17B DIFFERENCE AMOUNT
- 31 INPUT UNIT
- 32 DATA CONVERSION UNIT
- 33 LEARNING UNIT
- 34 DATA RESTORATION UNIT
- 35 DIFFERENCE CALCULATION UNIT
- 36 DETERMINATION UNIT
- 37 CONTROL UNIT
- 38 STORAGE UNIT
- 41a and 41b AUTO-ENCODER
- 42 LEARNED MODEL
- 43 INPUT DATA
Claims (11)
- An integrated biosignal analysis system performing determination of arrhythmia based on electrocardiographic information, the biosignal analysis system comprising:an input unit configured to receive input of the electrocardiographic information;a data conversion unit configured to perform time-frequency conversion on the electrocardiographic information to generate data for determination;a data restoration unit configured to restore the data for determination using a learned model including an auto-encoder to generate restored data;a difference calculation unit configured to calculate a difference amount between the restored data and the data for determination; anda determination unit configured to determine whether the data for determination is either of normal waveform data and arrhythmic waveform data based on the difference amount.
- The biosignal analysis system according to claim 1, wherein the learned model is a model generated by learning using a plurality of pieces of known data for learning, 95% or more of which are generated based on normal waveform data.
- The biosignal analysis system according to claim 1, wherein the learned model is a model generated by learning using a plurality of pieces of known data for learning, 95% or more of which are generated based on normal waveform data, and data for learning acquired from an object for which determination is performed.
- The biosignal analysis system according to claim 1, wherein the learned model is a model generated by learning using data for learning acquired from an object to be determined.
- The biosignal analysis system according to any one of claims 1 to 4, whereinthe input unit is configured to segment waveform data of the electrocardiographic information into unit waveform data in which waveform data in a predetermined time range is extracted, andthe data conversion unit is configured to perform time-frequency conversion on the unit waveform data to generate the data for determination.
- The biosignal analysis system according to any one of claims 1 to 5, wherein the data conversion unit is configured to generate weighted data in which a time-frequency feature region of arrhythmia in the data for determination is weighted.
- The biosignal analysis system according to any one of claims 1 to 6, whereinthe difference calculation unit is configured to generate difference data indicating a difference between the restored data and the data for determination and calculate the difference amount based on the difference data, andthe determination unit is configured to identify an arrhythmia factor based on a time and frequency feature of the difference data.
- The biosignal analysis system according to any one of claims 1 to 7, wherein the learned model is a model generated by learning using data for learning known to be the normal waveform data.
- The biosignal analysis system according to any one of claims 1 to 8, further comprising a learning unit configured to perform learning of the auto-encoder using data for learning to generate the learned model.
- The biosignal analysis system according to claim 2, further comprising a learning unit configured to perform learning of the auto-encoder using the data for learning to generate the learned model, wherein
the learning unitincludes a plurality of auto-encoders corresponding to features of the known data for learning, andis configured to select one auto-encoder from the auto-encoders based on a feature of normal waveform data of an object to be determined. - The biosignal analysis system according to claim 3, further comprising a learning unit configured to perform learning of the auto-encoder using the data for learning to generate the learned model, wherein
the learning unitincludes a plurality of data groups for learning or a plurality of auto-encoders corresponding to features of the pieces of known data for learning andis configured to select one data group for learning or one auto-encoder from the data groups for learning or the auto-encoders based on a feature of normal waveform data of an object to be determined.
Applications Claiming Priority (2)
| Application Number | Priority Date | Filing Date | Title |
|---|---|---|---|
| JP2020194594 | 2020-11-24 | ||
| PCT/JP2021/041847 WO2022113792A1 (en) | 2020-11-24 | 2021-11-15 | Biological signal analysis system |
Publications (3)
| Publication Number | Publication Date |
|---|---|
| EP4252652A1 true EP4252652A1 (en) | 2023-10-04 |
| EP4252652A4 EP4252652A4 (en) | 2024-10-09 |
| EP4252652B1 EP4252652B1 (en) | 2025-05-07 |
Family
ID=81755969
Family Applications (1)
| Application Number | Title | Priority Date | Filing Date |
|---|---|---|---|
| EP21897766.8A Active EP4252652B1 (en) | 2020-11-24 | 2021-11-15 | Biological signal analysis system |
Country Status (7)
| Country | Link |
|---|---|
| US (1) | US12484832B2 (en) |
| EP (1) | EP4252652B1 (en) |
| JP (1) | JP7294459B2 (en) |
| KR (1) | KR20230107806A (en) |
| CN (1) | CN116528763B (en) |
| ES (1) | ES3032892T3 (en) |
| WO (1) | WO2022113792A1 (en) |
Cited By (1)
| Publication number | Priority date | Publication date | Assignee | Title |
|---|---|---|---|---|
| US20240000364A1 (en) * | 2020-11-24 | 2024-01-04 | Toray Industries, Inc. | Biosignal analysis system |
Families Citing this family (4)
| Publication number | Priority date | Publication date | Assignee | Title |
|---|---|---|---|---|
| JP7479909B2 (en) * | 2020-04-20 | 2024-05-09 | 株式会社東海理化電機製作所 | Learning device, learning method, and measurement device |
| WO2024163389A1 (en) * | 2023-01-31 | 2024-08-08 | Mars, Incorporated | Systems and methods for deep learning based ecg-signal classifications for canines |
| JP2025090039A (en) * | 2023-12-05 | 2025-06-17 | 三菱電機株式会社 | Model generation device, biological data estimation device, model generation system, biological data estimation system, and model generation program |
| KR102927826B1 (en) * | 2025-01-21 | 2026-02-13 | 주식회사 뷰노 | Method for augmenting electrocardiogram data |
Family Cites Families (20)
| Publication number | Priority date | Publication date | Assignee | Title |
|---|---|---|---|---|
| KR100967994B1 (en) * | 2008-02-18 | 2010-07-07 | 연세대학교 산학협력단 | Real-time compression transmission and storage method of biosignal data with periodicity and cardiovascular system for it |
| FR2935822B1 (en) * | 2008-09-05 | 2010-09-17 | Commissariat Energie Atomique | METHOD FOR RECOGNIZING FORMS AND SYSTEM IMPLEMENTING THE METHOD |
| KR20140063100A (en) | 2012-11-16 | 2014-05-27 | 삼성전자주식회사 | Apparatus and methods for remote cardiac disease management |
| JP6088273B2 (en) * | 2013-02-05 | 2017-03-01 | 日本光電工業株式会社 | ECG analyzer |
| JP2014171589A (en) | 2013-03-07 | 2014-09-22 | Seiko Epson Corp | Atrial fibrillation analyzation equipment and program |
| CN106037702A (en) * | 2015-04-17 | 2016-10-26 | 精工爱普生株式会社 | Biological information processing system, biological information processing device, terminal device, method for generating analysis result information, and biological information processing method |
| WO2017124044A1 (en) * | 2016-01-15 | 2017-07-20 | The Regents Of The University Of California | Machine-learning-based denoising of doppler ultrasound blood flow and intracranial pressure signal |
| JP2018189522A (en) | 2017-05-08 | 2018-11-29 | キユーピー株式会社 | Predictive diagnosis method for equipment failure |
| JP2019033878A (en) * | 2017-08-15 | 2019-03-07 | イーグルマトリックス株式会社 | Abnormality detection method, abnormality detection device and abnormality detection program |
| US10602942B2 (en) * | 2017-08-25 | 2020-03-31 | Cambridge Heartwear Limited | Method of detecting abnormalities in ECG signals |
| TWI653967B (en) * | 2017-12-08 | 2019-03-21 | 國立成功大學 | Arrhythmia diagnosis system and device and arrhythmia identification method |
| JP7070255B2 (en) * | 2018-08-31 | 2022-05-18 | 富士通株式会社 | Abnormality discrimination program, abnormality discrimination method and abnormality discrimination device |
| KR102179040B1 (en) * | 2018-10-25 | 2020-11-16 | 한국외국어대학교 연구산학협력단 | Apparatus and Method for Anomaly Detection of SMD Assembly Device Operation based on Deeplearnig |
| CN111261289A (en) * | 2018-11-30 | 2020-06-09 | 上海图灵医疗科技有限公司 | Heart disease detection method based on artificial intelligence model |
| CN111261278A (en) * | 2018-11-30 | 2020-06-09 | 上海图灵医疗科技有限公司 | Heart disease detection method based on deep learning model of three-dimensional image |
| JP7155061B2 (en) | 2019-03-27 | 2022-10-18 | 日本光電工業株式会社 | Biological information measuring device, arrhythmia analysis system, arrhythmia analysis method, arrhythmia analysis program |
| CN110801221B (en) * | 2019-12-09 | 2021-04-27 | 中山大学 | Device for detecting sleep apnea fragments based on unsupervised feature learning |
| CN111084621B (en) * | 2019-12-30 | 2022-09-06 | 上海数创医疗科技有限公司 | QRS wave group form identification method and device based on depth self-encoder |
| CN111265210A (en) * | 2020-03-24 | 2020-06-12 | 华中科技大学 | A deep learning-based atrial fibrillation prediction device and equipment |
| ES3032892T3 (en) * | 2020-11-24 | 2025-07-28 | Toray Industries | Biological signal analysis system |
-
2021
- 2021-11-15 ES ES21897766T patent/ES3032892T3/en active Active
- 2021-11-15 KR KR1020237015640A patent/KR20230107806A/en active Pending
- 2021-11-15 JP JP2021570835A patent/JP7294459B2/en active Active
- 2021-11-15 US US18/037,124 patent/US12484832B2/en active Active
- 2021-11-15 EP EP21897766.8A patent/EP4252652B1/en active Active
- 2021-11-15 CN CN202180078704.9A patent/CN116528763B/en active Active
- 2021-11-15 WO PCT/JP2021/041847 patent/WO2022113792A1/en not_active Ceased
Cited By (2)
| Publication number | Priority date | Publication date | Assignee | Title |
|---|---|---|---|---|
| US20240000364A1 (en) * | 2020-11-24 | 2024-01-04 | Toray Industries, Inc. | Biosignal analysis system |
| US12484832B2 (en) * | 2020-11-24 | 2025-12-02 | Toray Industries, Inc. | Biosignal analysis system |
Also Published As
| Publication number | Publication date |
|---|---|
| KR20230107806A (en) | 2023-07-18 |
| US12484832B2 (en) | 2025-12-02 |
| ES3032892T3 (en) | 2025-07-28 |
| CN116528763B (en) | 2025-12-16 |
| JP7294459B2 (en) | 2023-06-20 |
| WO2022113792A1 (en) | 2022-06-02 |
| EP4252652B1 (en) | 2025-05-07 |
| JPWO2022113792A1 (en) | 2022-06-02 |
| US20240000364A1 (en) | 2024-01-04 |
| EP4252652A4 (en) | 2024-10-09 |
| CN116528763A (en) | 2023-08-01 |
Similar Documents
| Publication | Publication Date | Title |
|---|---|---|
| EP4252652B1 (en) | Biological signal analysis system | |
| EP3672474B1 (en) | Detecting abnormalities in ecg signals | |
| EP3692900B1 (en) | Artificial intelligence self-learning-based static electrocardiography analysis method and apparatus | |
| US8543194B2 (en) | System and method of detecting abnormal movement of a physical object | |
| Safara et al. | Multi-level basis selection of wavelet packet decomposition tree for heart sound classification | |
| EP3616605B1 (en) | Non-invasive detection of coronary heart disease from short single-lead ecg | |
| JP7297464B2 (en) | BIOLOGICAL SIGNAL PROCESSING DEVICE AND DATA GENERATION METHOD FOR AUTOMATIC ANALYSIS | |
| KR102093257B1 (en) | Noise rejection filter in electrocardiograph and filtering method Therefor | |
| US20220386966A1 (en) | Non-invasive prediction of risk for sudden cardiac death | |
| KR102605130B1 (en) | Method for classifying cardiac arrhythmia from standard 12-lead Electrocardiogram signal using artificial neural network and classification device using the same | |
| JP6640939B1 (en) | ECG analysis system | |
| CN113662560A (en) | Interictal epileptiform discharge detection method, storage medium and device | |
| CN108937920B (en) | Ventricular fibrillation signal detection method, system and ventricular fibrillation detection device | |
| Di Marco et al. | Recurring patterns of atrial fibrillation in surface ECG predict restoration of sinus rhythm by catheter ablation | |
| Sarvestani et al. | VT and VF classification using trajectory analysis | |
| CN116172572A (en) | A heartbeat clustering method and system based on SHAP value weighting and segmented HDBSCAN | |
| CN115067967B (en) | Method for determining heartbeat signal reference point, method and device for identifying heartbeat type | |
| Rezaei et al. | Data augmentation for heart arrhythmia classification | |
| CN107753014A (en) | Electrocardiogram detecting method | |
| KR102803314B1 (en) | Method for analyzing ecg data using multiple deep neural networks and recording medium storing program to implement the method | |
| JP7394642B2 (en) | Electrocardiogram analysis system | |
| Berg et al. | Comparison of features characterizing beat-to-beat time series | |
| Maggu et al. | Explainable electrocardiogram-based atrial fibrillation detection using deep learning | |
| Chang et al. | Atrial fibrillation analysis based on blind source separation in 12-lead ECG data | |
| Ferdous et al. | Developing Detection Technique of Arrhythmia using Basic ECG Parameters |
Legal Events
| Date | Code | Title | Description |
|---|---|---|---|
| STAA | Information on the status of an ep patent application or granted ep patent |
Free format text: STATUS: THE INTERNATIONAL PUBLICATION HAS BEEN MADE |
|
| PUAI | Public reference made under article 153(3) epc to a published international application that has entered the european phase |
Free format text: ORIGINAL CODE: 0009012 |
|
| STAA | Information on the status of an ep patent application or granted ep patent |
Free format text: STATUS: REQUEST FOR EXAMINATION WAS MADE |
|
| 17P | Request for examination filed |
Effective date: 20230517 |
|
| AK | Designated contracting states |
Kind code of ref document: A1 Designated state(s): AL AT BE BG CH CY CZ DE DK EE ES FI FR GB GR HR HU IE IS IT LI LT LU LV MC MK MT NL NO PL PT RO RS SE SI SK SM TR |
|
| DAV | Request for validation of the european patent (deleted) | ||
| DAX | Request for extension of the european patent (deleted) | ||
| A4 | Supplementary search report drawn up and despatched |
Effective date: 20240909 |
|
| RIC1 | Information provided on ipc code assigned before grant |
Ipc: A61B 5/364 20210101ALI20240903BHEP Ipc: A61B 5/363 20210101ALI20240903BHEP Ipc: A61B 5/361 20210101AFI20240903BHEP |
|
| GRAP | Despatch of communication of intention to grant a patent |
Free format text: ORIGINAL CODE: EPIDOSNIGR1 |
|
| STAA | Information on the status of an ep patent application or granted ep patent |
Free format text: STATUS: GRANT OF PATENT IS INTENDED |
|
| INTG | Intention to grant announced |
Effective date: 20250131 |
|
| GRAS | Grant fee paid |
Free format text: ORIGINAL CODE: EPIDOSNIGR3 |
|
| GRAA | (expected) grant |
Free format text: ORIGINAL CODE: 0009210 |
|
| STAA | Information on the status of an ep patent application or granted ep patent |
Free format text: STATUS: THE PATENT HAS BEEN GRANTED |
|
| AK | Designated contracting states |
Kind code of ref document: B1 Designated state(s): AL AT BE BG CH CY CZ DE DK EE ES FI FR GB GR HR HU IE IS IT LI LT LU LV MC MK MT NL NO PL PT RO RS SE SI SK SM TR |
|
| P01 | Opt-out of the competence of the unified patent court (upc) registered |
Free format text: CASE NUMBER: APP_14951/2025 Effective date: 20250327 |
|
| REG | Reference to a national code |
Ref country code: GB Ref legal event code: FG4D |
|
| REG | Reference to a national code |
Ref country code: CH Ref legal event code: EP |
|
| REG | Reference to a national code |
Ref country code: DE Ref legal event code: R096 Ref document number: 602021030609 Country of ref document: DE |
|
| REG | Reference to a national code |
Ref country code: IE Ref legal event code: FG4D |
|
| REG | Reference to a national code |
Ref country code: ES Ref legal event code: FG2A Ref document number: 3032892 Country of ref document: ES Kind code of ref document: T3 Effective date: 20250728 |
|
| REG | Reference to a national code |
Ref country code: NL Ref legal event code: MP Effective date: 20250507 |
|
| PG25 | Lapsed in a contracting state [announced via postgrant information from national office to epo] |
Ref country code: FI Free format text: LAPSE BECAUSE OF FAILURE TO SUBMIT A TRANSLATION OF THE DESCRIPTION OR TO PAY THE FEE WITHIN THE PRESCRIBED TIME-LIMIT Effective date: 20250507 Ref country code: PT Free format text: LAPSE BECAUSE OF FAILURE TO SUBMIT A TRANSLATION OF THE DESCRIPTION OR TO PAY THE FEE WITHIN THE PRESCRIBED TIME-LIMIT Effective date: 20250908 |
|
| REG | Reference to a national code |
Ref country code: LT Ref legal event code: MG9D |
|
| PG25 | Lapsed in a contracting state [announced via postgrant information from national office to epo] |
Ref country code: GR Free format text: LAPSE BECAUSE OF FAILURE TO SUBMIT A TRANSLATION OF THE DESCRIPTION OR TO PAY THE FEE WITHIN THE PRESCRIBED TIME-LIMIT Effective date: 20250808 Ref country code: NO Free format text: LAPSE BECAUSE OF FAILURE TO SUBMIT A TRANSLATION OF THE DESCRIPTION OR TO PAY THE FEE WITHIN THE PRESCRIBED TIME-LIMIT Effective date: 20250807 |
|
| PG25 | Lapsed in a contracting state [announced via postgrant information from national office to epo] |
Ref country code: NL Free format text: LAPSE BECAUSE OF FAILURE TO SUBMIT A TRANSLATION OF THE DESCRIPTION OR TO PAY THE FEE WITHIN THE PRESCRIBED TIME-LIMIT Effective date: 20250507 Ref country code: PL Free format text: LAPSE BECAUSE OF FAILURE TO SUBMIT A TRANSLATION OF THE DESCRIPTION OR TO PAY THE FEE WITHIN THE PRESCRIBED TIME-LIMIT Effective date: 20250507 |
|
| REG | Reference to a national code |
Ref country code: AT Ref legal event code: MK05 Ref document number: 1791552 Country of ref document: AT Kind code of ref document: T Effective date: 20250507 |
|
| PG25 | Lapsed in a contracting state [announced via postgrant information from national office to epo] |
Ref country code: BG Free format text: LAPSE BECAUSE OF FAILURE TO SUBMIT A TRANSLATION OF THE DESCRIPTION OR TO PAY THE FEE WITHIN THE PRESCRIBED TIME-LIMIT Effective date: 20250507 |
|
| PG25 | Lapsed in a contracting state [announced via postgrant information from national office to epo] |
Ref country code: HR Free format text: LAPSE BECAUSE OF FAILURE TO SUBMIT A TRANSLATION OF THE DESCRIPTION OR TO PAY THE FEE WITHIN THE PRESCRIBED TIME-LIMIT Effective date: 20250507 |
|
| PG25 | Lapsed in a contracting state [announced via postgrant information from national office to epo] |
Ref country code: AT Free format text: LAPSE BECAUSE OF FAILURE TO SUBMIT A TRANSLATION OF THE DESCRIPTION OR TO PAY THE FEE WITHIN THE PRESCRIBED TIME-LIMIT Effective date: 20250507 |
|
| PGFP | Annual fee paid to national office [announced via postgrant information from national office to epo] |
Ref country code: FR Payment date: 20250930 Year of fee payment: 5 |
|
| PG25 | Lapsed in a contracting state [announced via postgrant information from national office to epo] |
Ref country code: RS Free format text: LAPSE BECAUSE OF FAILURE TO SUBMIT A TRANSLATION OF THE DESCRIPTION OR TO PAY THE FEE WITHIN THE PRESCRIBED TIME-LIMIT Effective date: 20250807 |
|
| PG25 | Lapsed in a contracting state [announced via postgrant information from national office to epo] |
Ref country code: IS Free format text: LAPSE BECAUSE OF FAILURE TO SUBMIT A TRANSLATION OF THE DESCRIPTION OR TO PAY THE FEE WITHIN THE PRESCRIBED TIME-LIMIT Effective date: 20250907 |
|
| PG25 | Lapsed in a contracting state [announced via postgrant information from national office to epo] |
Ref country code: LV Free format text: LAPSE BECAUSE OF FAILURE TO SUBMIT A TRANSLATION OF THE DESCRIPTION OR TO PAY THE FEE WITHIN THE PRESCRIBED TIME-LIMIT Effective date: 20250507 |
|
| PGFP | Annual fee paid to national office [announced via postgrant information from national office to epo] |
Ref country code: DE Payment date: 20250930 Year of fee payment: 5 |
|
| PGFP | Annual fee paid to national office [announced via postgrant information from national office to epo] |
Ref country code: GB Payment date: 20251001 Year of fee payment: 5 |
|
| PG25 | Lapsed in a contracting state [announced via postgrant information from national office to epo] |
Ref country code: SM Free format text: LAPSE BECAUSE OF FAILURE TO SUBMIT A TRANSLATION OF THE DESCRIPTION OR TO PAY THE FEE WITHIN THE PRESCRIBED TIME-LIMIT Effective date: 20250507 Ref country code: DK Free format text: LAPSE BECAUSE OF FAILURE TO SUBMIT A TRANSLATION OF THE DESCRIPTION OR TO PAY THE FEE WITHIN THE PRESCRIBED TIME-LIMIT Effective date: 20250507 |
|
| PGFP | Annual fee paid to national office [announced via postgrant information from national office to epo] |
Ref country code: IT Payment date: 20251022 Year of fee payment: 5 |
|
| PG25 | Lapsed in a contracting state [announced via postgrant information from national office to epo] |
Ref country code: CZ Free format text: LAPSE BECAUSE OF FAILURE TO SUBMIT A TRANSLATION OF THE DESCRIPTION OR TO PAY THE FEE WITHIN THE PRESCRIBED TIME-LIMIT Effective date: 20250507 |
|
| PG25 | Lapsed in a contracting state [announced via postgrant information from national office to epo] |
Ref country code: EE Free format text: LAPSE BECAUSE OF FAILURE TO SUBMIT A TRANSLATION OF THE DESCRIPTION OR TO PAY THE FEE WITHIN THE PRESCRIBED TIME-LIMIT Effective date: 20250507 |
|
| PG25 | Lapsed in a contracting state [announced via postgrant information from national office to epo] |
Ref country code: SK Free format text: LAPSE BECAUSE OF FAILURE TO SUBMIT A TRANSLATION OF THE DESCRIPTION OR TO PAY THE FEE WITHIN THE PRESCRIBED TIME-LIMIT Effective date: 20250507 |
|
| PGFP | Annual fee paid to national office [announced via postgrant information from national office to epo] |
Ref country code: ES Payment date: 20251209 Year of fee payment: 5 |
|
| REG | Reference to a national code |
Ref country code: DE Ref legal event code: R097 Ref document number: 602021030609 Country of ref document: DE |
|
| PG25 | Lapsed in a contracting state [announced via postgrant information from national office to epo] |
Ref country code: RO Free format text: LAPSE BECAUSE OF FAILURE TO SUBMIT A TRANSLATION OF THE DESCRIPTION OR TO PAY THE FEE WITHIN THE PRESCRIBED TIME-LIMIT Effective date: 20250507 |
|
| PLBE | No opposition filed within time limit |
Free format text: ORIGINAL CODE: 0009261 |
|
| STAA | Information on the status of an ep patent application or granted ep patent |
Free format text: STATUS: NO OPPOSITION FILED WITHIN TIME LIMIT |
|
| REG | Reference to a national code |
Ref country code: CH Ref legal event code: L10 Free format text: ST27 STATUS EVENT CODE: U-0-0-L10-L00 (AS PROVIDED BY THE NATIONAL OFFICE) Effective date: 20260318 |
|
| 26N | No opposition filed |
Effective date: 20260210 |
|
| REG | Reference to a national code |
Ref country code: CH Ref legal event code: H13 Free format text: ST27 STATUS EVENT CODE: U-0-0-H10-H13 (AS PROVIDED BY THE NATIONAL OFFICE) Effective date: 20260623 |
|
| PG25 | Lapsed in a contracting state [announced via postgrant information from national office to epo] |
Ref country code: LT Free format text: LAPSE BECAUSE OF FAILURE TO SUBMIT A TRANSLATION OF THE DESCRIPTION OR TO PAY THE FEE WITHIN THE PRESCRIBED TIME-LIMIT Effective date: 20250507 |
|
| PG25 | Lapsed in a contracting state [announced via postgrant information from national office to epo] |
Ref country code: MC Free format text: LAPSE BECAUSE OF FAILURE TO SUBMIT A TRANSLATION OF THE DESCRIPTION OR TO PAY THE FEE WITHIN THE PRESCRIBED TIME-LIMIT Effective date: 20250507 |
|
| PG25 | Lapsed in a contracting state [announced via postgrant information from national office to epo] |
Ref country code: CH Free format text: LAPSE BECAUSE OF NON-PAYMENT OF DUE FEES Effective date: 20251130 Ref country code: LU Free format text: LAPSE BECAUSE OF NON-PAYMENT OF DUE FEES Effective date: 20251115 |
|
| PG25 | Lapsed in a contracting state [announced via postgrant information from national office to epo] |
Ref country code: SE Free format text: LAPSE BECAUSE OF FAILURE TO SUBMIT A TRANSLATION OF THE DESCRIPTION OR TO PAY THE FEE WITHIN THE PRESCRIBED TIME-LIMIT Effective date: 20250507 |