EP4250169A1 - Method and system for non-intrusive profiling of high-level synthesis (hls) based applications - Google Patents
Method and system for non-intrusive profiling of high-level synthesis (hls) based applications Download PDFInfo
- Publication number
- EP4250169A1 EP4250169A1 EP22215449.4A EP22215449A EP4250169A1 EP 4250169 A1 EP4250169 A1 EP 4250169A1 EP 22215449 A EP22215449 A EP 22215449A EP 4250169 A1 EP4250169 A1 EP 4250169A1
- Authority
- EP
- European Patent Office
- Prior art keywords
- hdl
- source code
- hls
- signals
- files
- Prior art date
- Legal status (The legal status is an assumption and is not a legal conclusion. Google has not performed a legal analysis and makes no representation as to the accuracy of the status listed.)
- Pending
Links
Images


Classifications
-
- G—PHYSICS
- G06—COMPUTING OR CALCULATING; COUNTING
- G06F—ELECTRIC DIGITAL DATA PROCESSING
- G06F8/00—Arrangements for software engineering
- G06F8/20—Software design
-
- G—PHYSICS
- G06—COMPUTING OR CALCULATING; COUNTING
- G06F—ELECTRIC DIGITAL DATA PROCESSING
- G06F30/00—Computer-aided design [CAD]
- G06F30/30—Circuit design
- G06F30/34—Circuit design for reconfigurable circuits, e.g. field programmable gate arrays [FPGA] or programmable logic devices [PLD]
- G06F30/343—Logical level
-
- G—PHYSICS
- G06—COMPUTING OR CALCULATING; COUNTING
- G06F—ELECTRIC DIGITAL DATA PROCESSING
- G06F30/00—Computer-aided design [CAD]
- G06F30/30—Circuit design
- G06F30/32—Circuit design at the digital level
- G06F30/327—Logic synthesis; Behaviour synthesis, e.g. mapping logic, HDL to netlist, high-level language to RTL or netlist
-
- G—PHYSICS
- G06—COMPUTING OR CALCULATING; COUNTING
- G06F—ELECTRIC DIGITAL DATA PROCESSING
- G06F30/00—Computer-aided design [CAD]
- G06F30/30—Circuit design
- G06F30/32—Circuit design at the digital level
- G06F30/33—Design verification, e.g. functional simulation or model checking
- G06F30/3308—Design verification, e.g. functional simulation or model checking using simulation
- G06F30/3312—Timing analysis
-
- G—PHYSICS
- G06—COMPUTING OR CALCULATING; COUNTING
- G06F—ELECTRIC DIGITAL DATA PROCESSING
- G06F2117/00—Details relating to the type or aim of the circuit design
- G06F2117/08—HW-SW co-design, e.g. HW-SW partitioning
-
- G—PHYSICS
- G06—COMPUTING OR CALCULATING; COUNTING
- G06F—ELECTRIC DIGITAL DATA PROCESSING
- G06F2119/00—Details relating to the type or aim of the analysis or the optimisation
- G06F2119/12—Timing analysis or timing optimisation
Definitions
- the embodiments herein generally relate to High-Level Synthesis (HLS) profiling and, more particularly, to a method and system for non-intrusive profiling of High-Level Synthesis (HLS) based applications.
- HLS High-Level Synthesis
- Performance profilers are software development tools designed to assist in performance analysis of applications and improve poorly performing sections of a code. They provide measurements on time taken by a routine to execute, proportion of total time spent on it, its parent routine etc. Performance profiling are quite common practices in software paradigm as matured profiling tools are available. However, it is not the case in hardware development, mainly Field Programmable Gate Arrays (FPGAs). FPGAs are becoming a popular choice as an application accelerator due to its support for deep pipelines as well as low latency realizations. The datapath based design in FPGAs is favorable to performance sensitive applications.
- FPGAs Field Programmable Gate Arrays
- HDLs Hardware Description Languages
- VHSIC Very High Speed Integrated Circuit
- VHDL Hardware Description Language
- RTL Register Transfer Logic
- the HLS development flow includes HLS compiler for generating HDL description of source code and include co-simulation for cycle-accurate functional analysis. It should be noted that HLS development requires an additional step of implementation to generate the FPGA executable. Although the HLS development flow provides a simplified, faster, and highly abstracted way for hardware design developments, often, better parallel or pipelined algorithms may be designed which are better suited to the FPGA architecture.
- the special directives e.g., #pragma in Xilinx HLS tools
- HLS tools help in design space exploration to improve the design micro-architecture and FPGA hardware matching, but their efficient use depends on the programming abilities and experience of the developer.
- the performance profile of hardware design can help identify the performance bottlenecks and aid the developer in fine-tuning the design performance.
- Vivado HLS TM and Intel HLS TM are popular HLS tools used in industry. These HLS tools provide the overall latency of the source code along with the cycle-count at the loop or sub-function level but the cycle accounting for every line of source code is not available.
- HLS_Print framework TM can be used to derive profiling information. Similar to other profiling framework, HLS_Print is intrusive in nature and introduces additional circuitry in the application. Moreover, it requires the time-consuming implementation followed by programming the FPGA and application test on hardware. On hardware platforms like FPGA, this is a step can be avoided since cycle accurate simulators are available. The design signal waveforms can be viewed in the simulator to estimate the profile of the application. The signals are part of the RTL design that is generated by the HLS compiler.
- Embodiments of the present disclosure present technological improvements as solutions to one or more of the above-mentioned technical problems recognized by the inventors in conventional systems.
- a method for non-intrusive profiling of High-Level Synthesis (HLS) based applications includes synthesizing a design for a source code for an HLS based application using an HLS compiler, in accordance with a synthesis time period, wherein the design is specified by the HLS compiler in terms of a plurality of hardware description language (HDL) files, a synthesis report, a verbose binding report and a plurality of database files.
- HDL hardware description language
- the method includes co-simulating the design of the plurality of HDL files using a co-simulator, based on a test bench identified for the source code to generate a Value Change Dump (VCD) file comprising a plurality of HDL signals in the plurality of HDL files cycle-by-cycle and a corresponding plurality of HDL signal values for an entire execution time at every time instant with a plurality of commands.
- VCD Value Change Dump
- the method includes extracting structured information using an HLS profiler by: (a)parsing the VCD file to generate a timing information for the plurality of HDL signals from the plurality of HDL files with the corresponding plurality of HDL signal values; (b) parsing the synthesis report to generate a plurality of module names to which the plurality of HDL signals belong and a corresponding plurality of source code functions; (c) parsing the verbose binding report to link an initial name to an HDL signal name for each of the plurality of HDL signals; (d) parsing the plurality of HDL files to obtain whether the HDL signal name, associated with each of the plurality of HDL signals, is one of a wire and a register; (e) parsing the source code to record a plurality of variables, a plurality of array variables, a precision data type status, and a multiplication status at a line number for each of a plurality of code lines of the source code; and (f) parsing the plurality of database files to
- the method includes analyzing using the HLS profiler, the extracted structured information in accordance with one or more rules from a set of associative rules to define associations between the line number of the source code, the plurality of variables, the HDL signal name for each of the plurality of HDL signals and the corresponding plurality of HDL signal values providing visibility into cycle-by-cycle hardware execution of the source-code for entire HLS based application execution time to generate a performance profile table for the source code.
- the set of associative rules are based on source code semantics, parsed output corresponding to the extracted structured information and HDL design semantics and enable suppress invalid transitions getting captured in standard HLS profiling.
- a system for non-intrusive profiling of High-Level Synthesis (HLS) based applications comprises a memory storing instructions; one or more Input/Output (I/O) interfaces; and one or more hardware processors coupled to the memory via the one or more I/O interfaces, wherein the one or more hardware processors are configured by the instructions to synthesize a design for a source code for an HLS based application using an HLS compiler, in accordance with a synthesis time period, wherein the design is specified by the HLS compiler in terms of a plurality of hardware description language (HDL) files, a synthesis report, a verbose binding report and a plurality of database files.
- HDL hardware description language
- the one or more hardware processors are configured to co-simulating the design of the plurality of HDL files using a co-simulator, based on a test bench identified for the source code to generate a Value Change Dump (VCD) file comprising a plurality of HDL signals in the plurality of HDL files cycle-by-cycle and a corresponding plurality of HDL signal values for an entire execution time at every time instant with a plurality of commands.
- VCD Value Change Dump
- the one or more hardware processors are configured to extract structured information using an HLS profiler by: (a)parsing the VCD file to generate a timing information for the plurality of HDL signals from the plurality of HDL files with the corresponding plurality of HDL signal values; (b) parsing the synthesis report to generate a plurality of module names to which the plurality of HDL signals belong and a corresponding plurality of source code functions; (c) parsing the verbose binding report to link an initial name to an HDL signal name for each of the plurality of HDL signals; (d) parsing the plurality of HDL files to obtain whether the HDL signal name, associated with each of the plurality of HDL signals, is one of a wire and a register; (e) parsing the source code to record a plurality of variables, a plurality of array variables, a precision data type status, and a multiplication status at a line number for each of a plurality of code lines of the source code; and (f) parsing the
- the one or more hardware processors are configured to analyze using the HLS profiler, the extracted structured information in accordance with one or more rules from a set of associative rules to define associations between the line number of the source code, the plurality of variables, the HDL signal name for each of the plurality of HDL signals and the corresponding plurality of HDL signal values providing visibility into cycle-by-cycle hardware execution of the source-code for entire HLS based application execution time to generate a performance profile table for the source code.
- the set of associative rules are based on source code semantics, parsed output corresponding to the extracted structured information and HDL design semantics and enable suppress invalid transitions getting captured in standard HLS profiling.
- one or more non-transitory machine-readable information storage mediums comprising one or more instructions, which when executed by one or more hardware processors causes a method for non-intrusive profiling of High-Level Synthesis (HLS) based applications.
- the method includes synthesizing a design for a source code for an HLS based application using an HLS compiler, in accordance with a synthesis time period, wherein the design is specified by the HLS compiler in terms of a plurality of hardware description language (HDL) files, a synthesis report, a verbose binding report and a plurality of database files.
- HDL hardware description language
- the method includes co-simulating the design of the plurality of HDL files using a co-simulator, based on a test bench identified for the source code to generate a Value Change Dump (VCD) file comprising a plurality of HDL signals in the plurality of HDL files cycle-by-cycle and a corresponding plurality of HDL signal values for an entire execution time at every time instant with a plurality of commands.
- VCD Value Change Dump
- the method includes extracting structured information using an HLS profiler by: (a)parsing the VCD file to generate a timing information for the plurality of HDL signals from the plurality of HDL files with the corresponding plurality of HDL signal values; (b) parsing the synthesis report to generate a plurality of module names to which the plurality of HDL signals belong and a corresponding plurality of source code functions; (c) parsing the verbose binding report to link an initial name to an HDL signal name for each of the plurality of HDL signals; (d) parsing the plurality of HDL files to obtain whether the HDL signal name, associated with each of the plurality of HDL signals, is one of a wire and a register; (e) parsing the source code to record a plurality of variables, a plurality of array variables, a precision data type status, and a multiplication status at a line number for each of a plurality of code lines of the source code; and (f) parsing the plurality of database files to
- the method includes analyzing using the HLS profiler, the extracted structured information in accordance with one or more rules from a set of associative rules to define associations between the line number of the source code, the plurality of variables, the HDL signal name for each of the plurality of HDL signals and the corresponding plurality of HDL signal values providing visibility into cycle-by-cycle hardware execution of the source-code for entire HLS based application execution time to generate a performance profile table for the source code.
- the set of associative rules are based on source code semantics, parsed output corresponding to the extracted structured information and HDL design semantics and enable suppress invalid transitions getting captured in standard HLS profiling.
- Code profiling entails dynamic program analysis that captures code execution statistics including space (memory) or time complexity, frequency, and duration of function calls etc.
- the profiling information aids in program optimization and is commonly achieved by instrumenting either the program source code or its binary executable form using profiler tools.
- the output of the profiler tools can be a statistical summary of the code with profiling data (for example #of times a line of code is executed) annotated against the source code.
- profiling data for example #of times a line of code is executed
- performance issues in parallel programs often depend on the time relationship of events and thus require a full trace of code execution.
- Profiler tools work on the principle of sampling and instrumentation where the former supports low-profiling granularity as compared to the latter.
- a sampling profiler probes the program call stack at regular intervals using interrupts.
- Sampling profiles are less numerically accurate and specific but allow the target program to run at near full speed. Instrumentation technique effectively adds instructions to the target program to collect the profiling information. However, code instrumenting can cause performance changes, and may in some cases lead to inaccurate results. The instrumentation can be added manually or automatically at the source-code, intermediate-code or compiled executable level. Performance profile is an important instrument to efficiently explore the design space and systematically improve its performance.
- the challenges in relating the HLS code to a synthesized RTL design acts as a deterrent in analyzing the implementation performance when it comes to non-intrusive analysis. Moreover, control and branching statements add to the difficulty in performance evaluation based only on static information.
- embodiments herein provide a non-intrusive profiling of High-Level Synthesis (HLS) based applications.
- the method combines static information with hardware signal waveforms to come up with approaches that could be used to profile the application actual execution on Field Programmable Gate Arrays (FPGA).
- FPGA Field Programmable Gate Arrays
- the method formulates useful association rules that could help relate hardware signals and waveforms to the source code variables and line numbers.
- the association rules when incorporated into HLS profiler correctly profile all the diverse applications.
- FIGS. 1A through 3B where similar reference characters denote corresponding features consistently throughout the figures, there are shown preferred embodiments and these embodiments are described in the context of the following exemplary system and/or method.
- FIG. 1A is a functional block diagram of a system 100, for non-intrusive profiling of High-Level Synthesis (HLS) based applications, in accordance with some embodiments of the present disclosure.
- the system 100 includes a processor(s) 104, communication interface device(s), alternatively referred as input/output (I/O) interface(s) 106, and one or more data storage devices or a memory 102 operatively coupled to the processor(s) 104.
- the system 100 with one or more hardware processors is configured to execute functions of one or more functional blocks of the system 100.
- the processor(s) 104 can be one or more hardware processors 104.
- the one or more hardware processors 104 can be implemented as one or more microprocessors, microcomputers, microcontrollers, digital signal processors, central processing units, state machines, logic circuitries, and/or any devices that manipulate signals based on operational instructions.
- the one or more hardware processors 104 are configured to fetch and execute computer-readable instructions stored in the memory 102.
- the system 100 can be implemented in a variety of computing systems including laptop computers, notebooks, hand-held devices such as mobile phones, workstations, mainframe computers, servers, and the like.
- the I/O interface(s) 106 can include a variety of software and hardware interfaces, for example, a web interface, a graphical user interface and the like and can facilitate multiple communications within a wide variety of networks N/W and protocol types, including wired networks, for example, LAN, cable, etc., and wireless networks, such as WLAN, cellular and the like.
- the I/O interface (s) 106 can include one or more ports for connecting to a number of external devices or to another server or devices.
- the memory 102 may include any computer-readable medium known in the art including, for example, volatile memory, such as static random access memory (SRAM) and dynamic random access memory (DRAM), and/or non-volatile memory, such as read only memory (ROM), erasable programmable ROM, flash memories, hard disks, optical disks, and magnetic tapes.
- volatile memory such as static random access memory (SRAM) and dynamic random access memory (DRAM)
- DRAM dynamic random access memory
- non-volatile memory such as read only memory (ROM), erasable programmable ROM, flash memories, hard disks, optical disks, and magnetic tapes.
- the memory 102 includes a plurality of modules (not shown) and a database 108 and the like.
- the database 108 may also store generated performance profile tables for a given source code.
- the memory 102 may comprise information pertaining to input(s)/output(s) of each step performed by the processor(s) 104 of the system 100 and methods of the present disclosure.
- the database 108 may be external (not shown) to the system 100 and coupled to the system via the I/O interface 106.
- the system 100 includes functional blocks such as an HLS compiler 110, a co-simulator 112, and an HLS profiler 114.
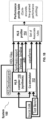
- FIG. 1B depicts an overview of the system 100 of FIG. 1A with process flow between the HLS compiler 110, the co-simulator 112, the HLS profiler 114, in accordance with some embodiments of the present disclosure.
- the HLS compiler 110 can be implemented via any available HLS compiler tools and platforms, which converts a source code of an HLS-based application, alternatively refereed herein after as application, developed in high-level language to low-level HDL implementation and by following three steps. 1) Scheduling 2) Binding, and 3) Control extraction. The logic operations are distributed through the clock cycles in scheduling and the number of such operations depends on the clock frequency, optimization directives and FPGA technology library. Binding assigns hardware resources for carrying out the logic operation which are scheduled using a state machine by the control extraction step.
- the co-simulator 112 provides a C/RTL co-simulation that uses C test bench to automatically verify the RTL design.
- the HLS compiler 110 generates the input test vectors based on the C test bench and uses them for RTL simulation of the synthesized RTL.
- the RTL simulation output is stored as output vectors that are verified for correctness by the C test bench.
- the designer can review generated waveform from C/RTL co-simulation using a Wave Viewer to analyze the temporal changes of design RTL signals.
- the temporal changes of RTL signals can also be captured in form of a Value Change Dump (VCD) report.
- VCD report contains the value of RTL or HDL signals at every time-stamps for entire simulation duration.
- the C/RTL co-simulation denotes the dynamic behavior of the design and depends on run-time value of the design variables.
- the HLS profiler 114 provides an automated and non-intrusive performance profiling tool that generates a cycle-by-cycle association to every line of source code (SC) for an entire HLS based application execution time.
- the HLS-profiler 114 based approach for profiling collects waveforms, source code and HDL files from HLS development flow along with verbose binding files, test bench, database files such as ⁇ .adb' files, and synthesis report files and translates it to profiling information as shown in FIG. 1B .
- Profiler framework is based on static analysis and dynamic trace, available from the HLS compilers, that is used along with associative rules to generate cycle-accurate profiles.
- the HLS compiler 110 generates the RTL equivalent of the C source code and represent the source code variable and RTL or HDL signal association in the form of static information.
- the dynamic behavior captured in form of RTL waveforms do not exhibit direct relation to C source code variables.
- This disconnect and technical limitation observed in the existing HLS development tools in the art acts as a deterrent to performance fine-tuning of HLS designs.
- the HLS profiler 114 disclosed herein associates every line of C-source code to a clock cycle.
- the HLS profiler 114 uses reports generated by the HLS compiler 110 during synthesis and co-simulation and presents a fine-grained performance profile table of designs developed using HLS development tools.
- the HLS profiler114 makes use of a set of associative rules to suppress invalid transitions that were otherwise getting captured in the performance profile.
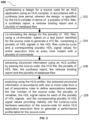
- FIG. 2 is a flow diagram illustrating a method 200 for non-intrusive profiling of High-Level Synthesis (HLS) based applications, using the system of FIG. 1 , in accordance with some embodiments of the present disclosure.
- the system 100 comprises one or more data storage devices or the memory 102 operatively coupled to the processor(s) 104 and is configured to store instructions for execution of steps of the method 200 by the processor(s) or one or more hardware processors 104 using the HLS compiler 110, co-simulator 112, and the HLS profiler 114.
- the steps of the method 200 of the present disclosure will now be explained with reference to the components or blocks of the system 100 as depicted in FIG. 1A and 1B and the steps of flow diagram as depicted in FIG.
- FIG. 3 an HLS profiler architecture of the system 100 of FIG. 1 as depicted in FIGS. 3A and 3B (collectively referred as FIG. 3 ).
- process steps, method steps, techniques or the like may be described in a sequential order, such processes, methods, and techniques may be configured to work in alternate orders. In other words, any sequence or order of steps that may be described does not necessarily indicate a requirement that the steps to be performed in that order. The steps of processes described herein may be performed in any order practical. Further, some steps may be performed simultaneously.
- the one or more hardware processors 104 using the HLS compiler 110, synthesize a design (RTL design) for a source code received for an HLS based application (application), in accordance with a synthesis time period.
- the source can be a C-source code.
- the design is specified by the HLS compiler 110 in terms of a plurality of hardware description language (HDL) files, a synthesis report, a verbose binding report and a plurality of database files such as ⁇ .adb' files.
- HDL hardware description language
- the one or more hardware processors 104 using the co-simulator 112, co-simulate the design for the plurality of HDL files,.
- the co-simulator utilizes the test bench (for example a C test bench) identified for the source code to generate the Value Change Dump (VCD) file comprising a plurality of HDL signals in the HDL files cycle-by-cycle and a corresponding plurality HDL signal values for entire execution time at every time instant with a plurality of commands.
- VCD Value Change Dump
- the one or more hardware processors 104 using the HLS profiler 114, extract structured information by parsing the plurality of hardware description language (HDL) files, the synthesis report, the verbose binding report, and the plurality of .adb files as explained in steps (a) to (f) below.
- HDL hardware description language
- the one or more hardware processors 104 using the HLS profiler 114, analyze the extracted structured information in accordance with one or more rules from a set of associative rules to define associations between the line number of the source code, the plurality of variables, the HDL signal name for each of the plurality of HDL signals and the corresponding plurality of HDL signal values providing visibility into the cycle-by-cycle hardware execution of the source-code for entire application execution time to generate the performance profile table for the source code.
- the set of associative rules are based on source code semantics, parsed output corresponding to the extracted structured information and HDL design semantics and enable suppress invalid transitions that get captured in standard HLS profiling.
- the set of associative rules comprise a first subset of rules among the set of associative rules that enable obtaining status at the line number level and a second subset of rules among set of associative rules that enable obtaining profile correctness in the performance profile table.
- the performance profile table can be shared with a developer, who can tune the performance of the design using HLS profiler 114 using following steps as listed below: Inputs: Source code, Test Bench, Synthesis Frequency and Top Function Name
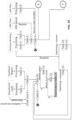
- FIGS. 3A and 3B depict the architecture of the HLS profiler 114 shown in the system 100 of FIG. 1 , in accordance with some embodiments of the present disclosure.
- HLS development tools Xilinx Vivado TM HLS or Xilinx Vitis TM HLS. Add source code and test bench to the project.
- Synthesis takes the source code and synthesis time period as inputs and generates the HDL (Verilog and VHDL) files of the source code. Synthesis also generates synthesis report, verbose binding and .adb files.
- Co-simulate the design Co-simulation takes the HDL files of the source code and test bench as input and generates the timing behavior of all the signals in the HDL files of the source code cycle-by-cycle.
- the co-simulation information is dumped in the form of VCD (value change dump) file that contains all HDL signals from all HDL files and their signal value for entire execution time at every time instant with the following commands.
- VCD value change dump
- Run VCDVCD parser which is an open source file processing tool.
- VCDVCD parser takes the VCD file as input and generates the timing information for all HDL signals from all HDL files with their values. It also generates the module name to which HDL signals belong.
- the module is equivalent to source code function (Table 1). This is more like a data processing step for VCD file to give it a certain structure required by following processing steps.
- Table 1 depicts table format Time Instant Module Name HDL signal name HDL signal value
- Parse synthesis report to generate Table 2 with columns 'module name' and 'source code function' by searching 'instance' keyword in ⁇ Utilization Estimates' section of synthesis report.
- Module is equivalent of Source code function in HDL.
- Table 2 depicts table format Module Name Source code function
- Table 3 contains source code function name for all HDL signals.
- Table 3 depicts format Time Instant Module Name Source code function HDL signal name HDL signal value
- the signal transition records is deleted from Table 3 that occur at time instances other than rising edge of clock. For this, the "ap_clk” HDL signal is used. At the rising edge of clock, “ap_clk” HDL signal value is 1 else it is 0. Records with Signal transitions at the clock instance when ap_clk HDL signal is 0 are deleted from Table 3.
- the verbose binding report contains design states and sequence of operations active in a state.
- the sequence of operations are distributed among states (bind_states) by the HLS compiler during synthesis.
- the operation record contains the target signal (in the form of initial name of HDL signal), the operator type, operands, predicate, and line numbers.
- the operands are the inputs of the operation and are available in the form of initial names of HDL signals.
- the predicate indicates the condition that needs to be satisfied for the target signal to attain the output of operation.
- the predicate contains either "TRUE” or a signal expression. When the predicate is "TRUE" or signal expression evaluates as "TRUE”, the output of operation gets assigned to target signal otherwise the target signal is not updated.
- Line number indicates the source code line number for the target signal. Parse the verbose binding report to record the target signals belonging to a particular state (state_bind) and their predicate, operation, operands, and line numbers.
- Table 6 contains HDL signal name for every initial name.
- Table 6 format and an example.
- Table 9 Merge Table 7 and Table 8 to generate Table 9.
- the source code variable information is added into Table 7 to generate Table 9.
- Parse the source code to record the target source code variables, array variables, precision data type status and multiplication status at each line along with line numbers in Table 10.
- Target source code variable holds the final variable at every line.
- Multiplication status holds TRUE when multiplication operation i.e., ⁇ *" operator is used at any line else it is FALSE.
- RLTLE 1 A Line number present in Table 10, if also present in line number column of Table 9 then Line number availability in Table 11 for the same is ⁇ avail' else it is 'NA' i.e., non-available. The 'avail' or NA status is populated in Table 11.
- RULE 2 If Line number availability is 'avail' in Table 11. The source variable and array variable at that line from Table 10 is compared with the source variable entry for the same line in Table 9. If both source variables are the same or if array variable present in Table 10 is same as source variable in Table 9, then the line number status is correct otherwise incorrect.
- RULE 4 A source code variable present in Table 10, if also present in Table 9 then source code variable availability in Table 11 is ⁇ avail' else it is 'NA' i.e., non-available.
- RULE 5 For every source code variable present in Table 11, if source code variable status is 'avail' and Tablet 1.line number is same as Table9.Line number corresponding to same source code variable then source code variable status is 'correct'.
- Table 9 format state_bind HDL signal name type (wire/reg) initial _name Source code variable operator operands predicate Line number
- RULE 7 For any line number if the Line number availability is 'avail' and status is 'incorrect'. These are the cases when line numbers other than line numbers present in Table 11 come up in Table 9. In such cases, unwanted line numbers from Table 9 are suppressed by deleting those line numbers from Table9.line number column.
- Missing line numbers line numbers obtained from Table 18(after typecasting) - line numbers obtained from Table 18 (before typecasting ie. Original code).
- Table 18 of type-casted code and original-code with keys operator and operands to create Table 19 with column Type-casted.initial_name, Type-casted.operator, Type-casted.operands, Type-casted.line_number, Type-casted.source_code_variable, Original-code.initial_name, Original-code.operator, Original-code. operands. Table 19: format and an example.
- Type-casted code Originalcode Initial_na me operat or opernds Line_num ber Source_c ode variable Initial_na me operat or operands sub_ln23 sub triangle_3d_ x2, tri angl e_3d_ x0 23 NA ret29 sub triangle_3d_x2 _V, triangle_3d_x0 _V
- Source code variable availability is 'avail'
- source code status is 'incorrect', and if it is due to multiple signals having same source code variable, and that variable is array with array index then correct source variable is generated through mux rule.
- Table 11 of Example Source Code Line number Source code line precision data type status
- Source code variable Source code variable availability
- Source code variable status 101 for(int i 0; i ⁇ n_leaves; i++) ⁇ FALSE i avail correct 102
- FALSE value_leaf avail incorrect if(activation_leaf[i]) ⁇ return value_leaf[i]; ⁇
- Table 9 format and an example state_ bind initial_n ame operat or operands predi cate Line num ber HDL signal name Type (wire /reg)
- Source code variable 3 value_le af_V_0_ 13 select icmp_ln94 _37, p_read_24, value_leaf V_0_12 true 95 value_l eaf_V_ 0_13_f u_5361 wire value_l eaf.V[0] 3 value_le af_V_0_ 14 select icmp_ln94 _43, p_read_23, value_leaf V_0_13 true 95 value_l eaf_V_ 0_14_f u_5733 wire value_le af.V[0] 4 sext_ln9 5_1 sext value_leaf V_0_14 true 95 sext_ln 95_1_f u_6486 wire NA 4 tmp_36 mux
- Table 20 Source code variables in Table 9 source code variable against same initials. Table 20: format and an example initial operands operation line number Source code variable tmp_36 sext_ln95_1, mux 103 value_leaf[0] sext_ln95_2, value_leaf[1] sext_ln95_3, value_leaf[2] sext_ln95_4, value_leaf[3] sext_ln95_5, value_leaf[4] sext_ln95_6, value_leaf[5] sext_ln95_7, value_leaf[6] sext_ln95_8, value_leaf[7] select_ln102_5
- Table 21 If Table 21 is not empty, then compare Table21.'if/elif'Ln_no with Table9.line number and find the equivalent signal of every 'if/else' comparison and record the same in Table22.
- 'if/elif'Ln_no Equivalent signal
- Table 22 format and an example 'if/elif'Ln_no Equivalent signal 4 icmp_ln4 6 icmp_ln6 10 xor_ln10
- HDL signal (#Module + ap_start) is low at any clock for source code function, then source code function is inactive at that clock. At that clock, all HDL signals in Table15.HDL_signal_name which has same inactive source code function in Table15.source_code_function belong to inactive function. All the column entries for HDL signals corresponding to inactive function are deleted at that clock from Table 15..
- Table 15 Clock cycle # Module Source code function HDL signal name HDL signal value Line number Source code variable Type (wire/reg) predicate i abc abc_func abc_hdl abc_hdl_val abc_ln abc_sc wire abc_pred
- the method disclosed provides intrusive profiling of high-level synthesis HLS based applications with a cycle-accurate, fine-grained performance profiling framework that is non-intrusive and provides an end-to-end profile of the design.
- profiling tool can help the designer/DSE tool to quickly identify the performance bottlenecks and have a guided approach towards tuning it.
- Such computer-readable storage means contain program-code means for implementation of one or more steps of the method, when the program runs on a server or mobile device or any suitable programmable device.
- the hardware device can be any kind of device which can be programmed including e.g., any kind of computer like a server or a personal computer, or the like, or any combination thereof.
- the device may also include means which could be e.g., hardware means like e.g., an application-specific integrated circuit (ASIC), a field-programmable gate array (FPGA), or a combination of hardware and software means, e.g., an ASIC and an FPGA, or at least one microprocessor and at least one memory with software processing components located therein.
- the means can include both hardware means, and software means.
- the method embodiments described herein could be implemented in hardware and software.
- the device may also include software means. Alternatively, the embodiments may be implemented on different hardware devices, e.g., using a plurality of CPUs.
- the embodiments herein can comprise hardware and software elements.
- the embodiments that are implemented in software include but are not limited to, firmware, resident software, microcode, etc.
- the functions performed by various components described herein may be implemented in other components or combinations of other components.
- a computer-usable or computer readable medium can be any apparatus that can comprise, store, communicate, propagate, or transport the program for use by or in connection with the instruction execution system, apparatus, or device.
- a computer-readable storage medium refers to any type of physical memory on which information or data readable by a processor may be stored.
- a computer-readable storage medium may store instructions for execution by one or more processors, including instructions for causing the processor(s) to perform steps or stages consistent with the embodiments described herein.
- the term "computer-readable medium” should be understood to include tangible items and exclude carrier waves and transient signals, i.e., be non-transitory. Examples include random access memory (RAM), read-only memory (ROM), volatile memory, nonvolatile memory, hard drives, CD ROMs, DVDs, flash drives, disks, and any other known physical storage media.
Landscapes
- Engineering & Computer Science (AREA)
- Theoretical Computer Science (AREA)
- Computer Hardware Design (AREA)
- Physics & Mathematics (AREA)
- General Engineering & Computer Science (AREA)
- General Physics & Mathematics (AREA)
- Software Systems (AREA)
- Evolutionary Computation (AREA)
- Geometry (AREA)
- Debugging And Monitoring (AREA)
- Devices For Executing Special Programs (AREA)
Abstract
Description
- The present application claims priority to
Indian application no. 202221017111, filed on March 25, 2022 - The embodiments herein generally relate to High-Level Synthesis (HLS) profiling and, more particularly, to a method and system for non-intrusive profiling of High-Level Synthesis (HLS) based applications.
- Performance profilers are software development tools designed to assist in performance analysis of applications and improve poorly performing sections of a code. They provide measurements on time taken by a routine to execute, proportion of total time spent on it, its parent routine etc. Performance profiling are quite common practices in software paradigm as matured profiling tools are available. However, it is not the case in hardware development, mainly Field Programmable Gate Arrays (FPGAs). FPGAs are becoming a popular choice as an application accelerator due to its support for deep pipelines as well as low latency realizations. The datapath based design in FPGAs is favorable to performance sensitive applications. The traditional hardware development encompasses coding the design in Hardware Description Languages (HDLs), such as Verilog and Very High Speed Integrated Circuit (VHSIC) Hardware Description Language (VHDL) and define the Register Transfer Logic (RTL) datapath from input to output and achieve the desired functionality. A recent approach for hardware design development is through High Level Synthesis (HLS) tools. With HLS, the design development productivity improves as it supports high-level languages (C/C++) and the process of creating HDL description, defining RTL datapath, operation scheduling etc. are abstracted away from the developer.
- The HLS development flow includes HLS compiler for generating HDL description of source code and include co-simulation for cycle-accurate functional analysis. It should be noted that HLS development requires an additional step of implementation to generate the FPGA executable. Although the HLS development flow provides a simplified, faster, and highly abstracted way for hardware design developments, often, better parallel or pipelined algorithms may be designed which are better suited to the FPGA architecture. The special directives (e.g., #pragma in Xilinx HLS tools) available in HLS tools help in design space exploration to improve the design micro-architecture and FPGA hardware matching, but their efficient use depends on the programming abilities and experience of the developer. However, as is the case in software design, the performance profile of hardware design can help identify the performance bottlenecks and aid the developer in fine-tuning the design performance. Vivado HLS™ and Intel HLS™ are popular HLS tools used in industry. These HLS tools provide the overall latency of the source code along with the cycle-count at the loop or sub-function level but the cycle accounting for every line of source code is not available. Though, it is possible to relate the synthesized HDL to clock cycles through waveforms but associating the source code statements to the synthesized HDL is not straight-forward, since a single C statement can be expressed as multiple HDL signals triggering one another while being spread across multiple clock cycles.
- The missing correspondence between source-code and performance information can be addressed by line-by-line profiling. This concept is not new and is available in software through tools like Gprof™. The performance profilers can outline how much time has been spent in each line of code. However, this information is difficult to obtain for highly-parallel superscalar-like architectures. Additionally, it is normal for one line of source code to translate into many lines of assembly instructions, that can be scheduled with out of order parallelism. Depending on the ISA scheduling, it is possible that more than one lines of code are executing in a single clock cycle. However, works in literature indicate that existing profiling tools are intrusive in nature and often introduce performance overheads. This is because of the additional profiling instructions that are added in the compiled application code to collect the required data. Apart from profiling tools, use of 'print' statements in software is a common method used to collect profile data.
- On hardware platforms like FPGA, HLS_Print framework™ can be used to derive profiling information. Similar to other profiling framework, HLS_Print is intrusive in nature and introduces additional circuitry in the application. Moreover, it requires the time-consuming implementation followed by programming the FPGA and application test on hardware. On hardware platforms like FPGA, this is a step can be avoided since cycle accurate simulators are available. The design signal waveforms can be viewed in the simulator to estimate the profile of the application. The signals are part of the RTL design that is generated by the HLS compiler.
- Embodiments of the present disclosure present technological improvements as solutions to one or more of the above-mentioned technical problems recognized by the inventors in conventional systems.
- For example, in one embodiment, a method for non-intrusive profiling of High-Level Synthesis (HLS) based applications is provided. The method includes synthesizing a design for a source code for an HLS based application using an HLS compiler, in accordance with a synthesis time period, wherein the design is specified by the HLS compiler in terms of a plurality of hardware description language (HDL) files, a synthesis report, a verbose binding report and a plurality of database files. Further, the method includes co-simulating the design of the plurality of HDL files using a co-simulator, based on a test bench identified for the source code to generate a Value Change Dump (VCD) file comprising a plurality of HDL signals in the plurality of HDL files cycle-by-cycle and a corresponding plurality of HDL signal values for an entire execution time at every time instant with a plurality of commands. Further, the method includes extracting structured information using an HLS profiler by: (a)parsing the VCD file to generate a timing information for the plurality of HDL signals from the plurality of HDL files with the corresponding plurality of HDL signal values; (b) parsing the synthesis report to generate a plurality of module names to which the plurality of HDL signals belong and a corresponding plurality of source code functions; (c) parsing the verbose binding report to link an initial name to an HDL signal name for each of the plurality of HDL signals; (d) parsing the plurality of HDL files to obtain whether the HDL signal name, associated with each of the plurality of HDL signals, is one of a wire and a register; (e) parsing the source code to record a plurality of variables, a plurality of array variables, a precision data type status, and a multiplication status at a line number for each of a plurality of code lines of the source code; and (f) parsing the plurality of database files to link the initial name for each of the HDL signals to the plurality of variables in the source code. Furthermore, the method includes analyzing using the HLS profiler, the extracted structured information in accordance with one or more rules from a set of associative rules to define associations between the line number of the source code, the plurality of variables, the HDL signal name for each of the plurality of HDL signals and the corresponding plurality of HDL signal values providing visibility into cycle-by-cycle hardware execution of the source-code for entire HLS based application execution time to generate a performance profile table for the source code. The set of associative rules are based on source code semantics, parsed output corresponding to the extracted structured information and HDL design semantics and enable suppress invalid transitions getting captured in standard HLS profiling.
- In another aspect, a system for non-intrusive profiling of High-Level Synthesis (HLS) based applications is provided. The system comprises a memory storing instructions; one or more Input/Output (I/O) interfaces; and one or more hardware processors coupled to the memory via the one or more I/O interfaces, wherein the one or more hardware processors are configured by the instructions to synthesize a design for a source code for an HLS based application using an HLS compiler, in accordance with a synthesis time period, wherein the design is specified by the HLS compiler in terms of a plurality of hardware description language (HDL) files, a synthesis report, a verbose binding report and a plurality of database files. Further, the one or more hardware processors are configured to co-simulating the design of the plurality of HDL files using a co-simulator, based on a test bench identified for the source code to generate a Value Change Dump (VCD) file comprising a plurality of HDL signals in the plurality of HDL files cycle-by-cycle and a corresponding plurality of HDL signal values for an entire execution time at every time instant with a plurality of commands. Further, the one or more hardware processors are configured to extract structured information using an HLS profiler by: (a)parsing the VCD file to generate a timing information for the plurality of HDL signals from the plurality of HDL files with the corresponding plurality of HDL signal values; (b) parsing the synthesis report to generate a plurality of module names to which the plurality of HDL signals belong and a corresponding plurality of source code functions; (c) parsing the verbose binding report to link an initial name to an HDL signal name for each of the plurality of HDL signals; (d) parsing the plurality of HDL files to obtain whether the HDL signal name, associated with each of the plurality of HDL signals, is one of a wire and a register; (e) parsing the source code to record a plurality of variables, a plurality of array variables, a precision data type status, and a multiplication status at a line number for each of a plurality of code lines of the source code; and (f) parsing the plurality of database files to link the initial name for each of the HDL signals to the plurality of variables in the source code. Furthermore, the one or more hardware processors are configured to analyze using the HLS profiler, the extracted structured information in accordance with one or more rules from a set of associative rules to define associations between the line number of the source code, the plurality of variables, the HDL signal name for each of the plurality of HDL signals and the corresponding plurality of HDL signal values providing visibility into cycle-by-cycle hardware execution of the source-code for entire HLS based application execution time to generate a performance profile table for the source code. The set of associative rules are based on source code semantics, parsed output corresponding to the extracted structured information and HDL design semantics and enable suppress invalid transitions getting captured in standard HLS profiling.
- In yet another aspect, there are provided one or more non-transitory machine-readable information storage mediums comprising one or more instructions, which when executed by one or more hardware processors causes a method for non-intrusive profiling of High-Level Synthesis (HLS) based applications. The method includes synthesizing a design for a source code for an HLS based application using an HLS compiler, in accordance with a synthesis time period, wherein the design is specified by the HLS compiler in terms of a plurality of hardware description language (HDL) files, a synthesis report, a verbose binding report and a plurality of database files. Further, the method includes co-simulating the design of the plurality of HDL files using a co-simulator, based on a test bench identified for the source code to generate a Value Change Dump (VCD) file comprising a plurality of HDL signals in the plurality of HDL files cycle-by-cycle and a corresponding plurality of HDL signal values for an entire execution time at every time instant with a plurality of commands. Further, the method includes extracting structured information using an HLS profiler by: (a)parsing the VCD file to generate a timing information for the plurality of HDL signals from the plurality of HDL files with the corresponding plurality of HDL signal values; (b) parsing the synthesis report to generate a plurality of module names to which the plurality of HDL signals belong and a corresponding plurality of source code functions; (c) parsing the verbose binding report to link an initial name to an HDL signal name for each of the plurality of HDL signals; (d) parsing the plurality of HDL files to obtain whether the HDL signal name, associated with each of the plurality of HDL signals, is one of a wire and a register; (e) parsing the source code to record a plurality of variables, a plurality of array variables, a precision data type status, and a multiplication status at a line number for each of a plurality of code lines of the source code; and (f) parsing the plurality of database files to link the initial name for each of the HDL signals to the plurality of variables in the source code. Furthermore, the method includes analyzing using the HLS profiler, the extracted structured information in accordance with one or more rules from a set of associative rules to define associations between the line number of the source code, the plurality of variables, the HDL signal name for each of the plurality of HDL signals and the corresponding plurality of HDL signal values providing visibility into cycle-by-cycle hardware execution of the source-code for entire HLS based application execution time to generate a performance profile table for the source code. The set of associative rules are based on source code semantics, parsed output corresponding to the extracted structured information and HDL design semantics and enable suppress invalid transitions getting captured in standard HLS profiling.
- It is to be understood that both the foregoing general description and the following detailed description are exemplary and explanatory only and are not restrictive of the invention, as claimed.
- The accompanying drawings, which are incorporated in and constitute a part of this disclosure, illustrate exemplary embodiments and, together with the description, serve to explain the disclosed principles:
-
FIG. 1A is a functional block diagram of a system, for non-intrusive profiling of High-Level Synthesis (HLS) based applications, in accordance with some embodiments of the present disclosure. -
FIG. 1B depicts an overview of the system ofFIG. 1A , in accordance with some embodiments of the present disclosure. -
FIG. 2 is a flow diagram illustrating a method for non-intrusive profiling of High-Level Synthesis (HLS) based applications, using the system ofFIG. 1B , in accordance with some embodiments of the present disclosure. -
FIGS. 3A and3B (collectively referred asFIG. 3 ) depict an architecture of an HLS profiler of the system ofFIG. 1B , in accordance with some embodiments of the present disclosure. - It should be appreciated by those skilled in the art that any block diagrams herein represent conceptual views of illustrative systems and devices embodying the principles of the present subject matter. Similarly, it will be appreciated that any flow charts, flow diagrams, and the like represent various processes which may be substantially represented in computer readable medium and so executed by a computer or processor, whether or not such computer or processor is explicitly shown.
- Exemplary embodiments are described with reference to the accompanying drawings. In the figures, the left-most digit(s) of a reference number identifies the figure in which the reference number first appears. Wherever convenient, the same reference numbers are used throughout the drawings to refer to the same or like parts. While examples and features of disclosed principles are described herein, modifications, adaptations, and other implementations are possible without departing from the scope of the disclosed embodiments.
- Code profiling entails dynamic program analysis that captures code execution statistics including space (memory) or time complexity, frequency, and duration of function calls etc. The profiling information aids in program optimization and is commonly achieved by instrumenting either the program source code or its binary executable form using profiler tools. The output of the profiler tools can be a statistical summary of the code with profiling data (for example #of times a line of code is executed) annotated against the source code. On the other hand, performance issues in parallel programs often depend on the time relationship of events and thus require a full trace of code execution. Profiler tools work on the principle of sampling and instrumentation where the former supports low-profiling granularity as compared to the latter. A sampling profiler probes the program call stack at regular intervals using interrupts. Sampling profiles are less numerically accurate and specific but allow the target program to run at near full speed. Instrumentation technique effectively adds instructions to the target program to collect the profiling information. However, code instrumenting can cause performance changes, and may in some cases lead to inaccurate results. The instrumentation can be added manually or automatically at the source-code, intermediate-code or compiled executable level. Performance profile is an important instrument to efficiently explore the design space and systematically improve its performance. The challenges in relating the HLS code to a synthesized RTL design acts as a deterrent in analyzing the implementation performance when it comes to non-intrusive analysis. Moreover, control and branching statements add to the difficulty in performance evaluation based only on static information.
- Thus, embodiments herein provide a non-intrusive profiling of High-Level Synthesis (HLS) based applications. The method combines static information with hardware signal waveforms to come up with approaches that could be used to profile the application actual execution on Field Programmable Gate Arrays (FPGA). The method formulates useful association rules that could help relate hardware signals and waveforms to the source code variables and line numbers. The association rules when incorporated into HLS profiler correctly profile all the diverse applications.
- Referring now to the drawings, and more particularly to
FIGS. 1A through 3B , where similar reference characters denote corresponding features consistently throughout the figures, there are shown preferred embodiments and these embodiments are described in the context of the following exemplary system and/or method. -
FIG. 1A is a functional block diagram of asystem 100, for non-intrusive profiling of High-Level Synthesis (HLS) based applications, in accordance with some embodiments of the present disclosure. In an embodiment, thesystem 100 includes a processor(s) 104, communication interface device(s), alternatively referred as input/output (I/O) interface(s) 106, and one or more data storage devices or amemory 102 operatively coupled to the processor(s) 104. Thesystem 100 with one or more hardware processors is configured to execute functions of one or more functional blocks of thesystem 100. - Referring to the components of
system 100, in an embodiment, the processor(s) 104, can be one ormore hardware processors 104. In an embodiment, the one ormore hardware processors 104 can be implemented as one or more microprocessors, microcomputers, microcontrollers, digital signal processors, central processing units, state machines, logic circuitries, and/or any devices that manipulate signals based on operational instructions. Among other capabilities, the one ormore hardware processors 104 are configured to fetch and execute computer-readable instructions stored in thememory 102. In an embodiment, thesystem 100 can be implemented in a variety of computing systems including laptop computers, notebooks, hand-held devices such as mobile phones, workstations, mainframe computers, servers, and the like. - The I/O interface(s) 106 can include a variety of software and hardware interfaces, for example, a web interface, a graphical user interface and the like and can facilitate multiple communications within a wide variety of networks N/W and protocol types, including wired networks, for example, LAN, cable, etc., and wireless networks, such as WLAN, cellular and the like. In an embodiment, the I/O interface (s) 106 can include one or more ports for connecting to a number of external devices or to another server or devices.
- The
memory 102 may include any computer-readable medium known in the art including, for example, volatile memory, such as static random access memory (SRAM) and dynamic random access memory (DRAM), and/or non-volatile memory, such as read only memory (ROM), erasable programmable ROM, flash memories, hard disks, optical disks, and magnetic tapes. - Further, the
memory 102 includes a plurality of modules (not shown) and adatabase 108 and the like. Thedatabase 108, may also store generated performance profile tables for a given source code. Further, thememory 102 may comprise information pertaining to input(s)/output(s) of each step performed by the processor(s) 104 of thesystem 100 and methods of the present disclosure. In an embodiment, thedatabase 108 may be external (not shown) to thesystem 100 and coupled to the system via the I/O interface 106. Further, thesystem 100 includes functional blocks such as anHLS compiler 110, a co-simulator 112, and anHLS profiler 114. -
FIG. 1B depicts an overview of thesystem 100 ofFIG. 1A with process flow between theHLS compiler 110, the co-simulator 112, theHLS profiler 114, in accordance with some embodiments of the present disclosure. As part of HLS synthesis, theHLS compiler 110, can be implemented via any available HLS compiler tools and platforms, which converts a source code of an HLS-based application, alternatively refereed herein after as application, developed in high-level language to low-level HDL implementation and by following three steps. 1) Scheduling 2) Binding, and 3) Control extraction. The logic operations are distributed through the clock cycles in scheduling and the number of such operations depends on the clock frequency, optimization directives and FPGA technology library. Binding assigns hardware resources for carrying out the logic operation which are scheduled using a state machine by the control extraction step. - The co-simulator 112 provides a C/RTL co-simulation that uses C test bench to automatically verify the RTL design. The
HLS compiler 110 generates the input test vectors based on the C test bench and uses them for RTL simulation of the synthesized RTL. The RTL simulation output is stored as output vectors that are verified for correctness by the C test bench. The designer can review generated waveform from C/RTL co-simulation using a Wave Viewer to analyze the temporal changes of design RTL signals. The temporal changes of RTL signals can also be captured in form of a Value Change Dump (VCD) report. The VCD report contains the value of RTL or HDL signals at every time-stamps for entire simulation duration. The C/RTL co-simulation denotes the dynamic behavior of the design and depends on run-time value of the design variables. - To support profiling in HLS-based designs, the
HLS profiler 114, also referred to as profiler framework, provides an automated and non-intrusive performance profiling tool that generates a cycle-by-cycle association to every line of source code (SC) for an entire HLS based application execution time. The HLS-profiler 114 based approach for profiling collects waveforms, source code and HDL files from HLS development flow along with verbose binding files, test bench, database files such as `.adb' files, and synthesis report files and translates it to profiling information as shown inFIG. 1B . Profiler framework is based on static analysis and dynamic trace, available from the HLS compilers, that is used along with associative rules to generate cycle-accurate profiles. TheHLS compiler 110 generates the RTL equivalent of the C source code and represent the source code variable and RTL or HDL signal association in the form of static information. The dynamic behavior captured in form of RTL waveforms do not exhibit direct relation to C source code variables. This disconnect and technical limitation observed in the existing HLS development tools in the art acts as a deterrent to performance fine-tuning of HLS designs. Unlike the existing profiling tools, theHLS profiler 114 disclosed herein associates every line of C-source code to a clock cycle. TheHLS profiler 114 uses reports generated by theHLS compiler 110 during synthesis and co-simulation and presents a fine-grained performance profile table of designs developed using HLS development tools. In addition toHLS compiler 110 generated reports, the HLS profiler114 makes use of a set of associative rules to suppress invalid transitions that were otherwise getting captured in the performance profile. - Functions of the components of the
system 100 are explained in conjunction with flow diagram ofFIG. 2 and example ofFIG. 3 . -
FIG. 2 is a flow diagram illustrating amethod 200 for non-intrusive profiling of High-Level Synthesis (HLS) based applications, using the system ofFIG. 1 , in accordance with some embodiments of the present disclosure. In an embodiment, thesystem 100 comprises one or more data storage devices or thememory 102 operatively coupled to the processor(s) 104 and is configured to store instructions for execution of steps of themethod 200 by the processor(s) or one ormore hardware processors 104 using theHLS compiler 110, co-simulator 112, and theHLS profiler 114. The steps of themethod 200 of the present disclosure will now be explained with reference to the components or blocks of thesystem 100 as depicted inFIG. 1A and1B and the steps of flow diagram as depicted inFIG. 2 , and an HLS profiler architecture of thesystem 100 ofFIG. 1 as depicted inFIGS. 3A and3B (collectively referred asFIG. 3 ). Although process steps, method steps, techniques or the like may be described in a sequential order, such processes, methods, and techniques may be configured to work in alternate orders. In other words, any sequence or order of steps that may be described does not necessarily indicate a requirement that the steps to be performed in that order. The steps of processes described herein may be performed in any order practical. Further, some steps may be performed simultaneously. - Referring to the steps of the
method 200, atstep 202 of themethod 200, the one ormore hardware processors 104, using theHLS compiler 110, synthesize a design (RTL design) for a source code received for an HLS based application (application), in accordance with a synthesis time period. The source can be a C-source code. The design is specified by theHLS compiler 110 in terms of a plurality of hardware description language (HDL) files, a synthesis report, a verbose binding report and a plurality of database files such as `.adb' files. - At
step 204 of themethod 200, the one ormore hardware processors 104, using the co-simulator 112, co-simulate the design for the plurality of HDL files,. The co-simulator utilizes the test bench (for example a C test bench) identified for the source code to generate the Value Change Dump (VCD) file comprising a plurality of HDL signals in the HDL files cycle-by-cycle and a corresponding plurality HDL signal values for entire execution time at every time instant with a plurality of commands. - At
step 206 of themethod 200, the one ormore hardware processors 104, using theHLS profiler 114, extract structured information by parsing the plurality of hardware description language (HDL) files, the synthesis report, the verbose binding report, and the plurality of .adb files as explained in steps (a) to (f) below. - a) Parse the VCD file to generate timing information for the plurality of HDL signals from the plurality of HDL files with the corresponding plurality of HDL signal values;
- b) Parse the synthesis report to generate a plurality of module names to which the plurality of HDL signals belong and a corresponding plurality of source code functions;
- c) Parse the verbose binding report to link an initial name to an HDL signal name for each of the plurality of HDL signals;
- d) Parse the plurality of HDL files to obtain whether the HDL signal name, associated with each of the plurality of HDL signals, is a wire or register;
- e) Parse the source code to record a plurality of variables, a plurality of array variables, precision data type status, and multiplication status at a line number for each of a plurality of code lines of the source code;
- f) Parse the plurality of .adb files to link the initial name for each of the HDL signals to the plurality of variables in the source code.
- At
step 208 of themethod 200, the one ormore hardware processors 104, using theHLS profiler 114, analyze the extracted structured information in accordance with one or more rules from a set of associative rules to define associations between the line number of the source code, the plurality of variables, the HDL signal name for each of the plurality of HDL signals and the corresponding plurality of HDL signal values providing visibility into the cycle-by-cycle hardware execution of the source-code for entire application execution time to generate the performance profile table for the source code. The set of associative rules are based on source code semantics, parsed output corresponding to the extracted structured information and HDL design semantics and enable suppress invalid transitions that get captured in standard HLS profiling. The set of associative rules comprise a first subset of rules among the set of associative rules that enable obtaining status at the line number level and a second subset of rules among set of associative rules that enable obtaining profile correctness in the performance profile table. - Once the performance profile table is generated it can be shared with a developer, who can tune the performance of the design using
HLS profiler 114 using following steps as listed below:
Inputs: Source code, Test Bench, Synthesis Frequency and Top Function Name - 1. Run the HLS_Profiler script.
- 2. Performance profile of the source code is available in a text file.
- 3. Identify, optimize bottleneck, and update source code with appropriate pragma directive.
- 4. Repeat Steps 1-3 till performance target is met.
-
FIGS. 3A and3B (collectively referred asFIG. 3 ) depict the architecture of theHLS profiler 114 shown in thesystem 100 ofFIG. 1 , in accordance with some embodiments of the present disclosure. - Inputs: Source code, test bench, synthesis time period
- Output: Cycle-by-cycle performance profile
- Create HLS project using HLS development tools, Xilinx Vivado™ HLS or Xilinx Vitis™ HLS. Add source code and test bench to the project.
- Synthesize the design. Synthesis takes the source code and synthesis time period as inputs and generates the HDL (Verilog and VHDL) files of the source code. Synthesis also generates synthesis report, verbose binding and .adb files.
- Co-simulate the design. Co-simulation takes the HDL files of the source code and test bench as input and generates the timing behavior of all the signals in the HDL files of the source code cycle-by-cycle. The co-simulation information is dumped in the form of VCD (value change dump) file that contains all HDL signals from all HDL files and their signal value for entire execution time at every time instant with the following commands.
- 1. restart
- 2. open_vcd
- 3. log_vcd
- 4. run #entire execution time(ns)
- 5. close_vcd
- Run VCDVCD parser, which is an open source file processing tool. VCDVCD parser takes the VCD file as input and generates the timing information for all HDL signals from all HDL files with their values. It also generates the module name to which HDL signals belong. The module is equivalent to source code function (Table 1). This is more like a data processing step for VCD file to give it a certain structure required by following processing steps.
Table 1: depicts table format Time Instant Module Name HDL signal name HDL signal value - Parse synthesis report to generate Table 2 with columns 'module name' and 'source code function' by searching 'instance' keyword in `Utilization Estimates' section of synthesis report. Module is equivalent of Source code function in HDL.
Table 2: depicts table format Module Name Source code function - Merge Table 1 and Table2 by comparing Table1.Module Name and Table2.Module Name to create Table 3.
- In addition to Table 2 data, Table 3 contains source code function name for all HDL signals.
Table 3: depicts format Time Instant Module Name Source code function HDL signal name HDL signal value - The signal transition records is deleted from Table 3 that occur at time instances other than rising edge of clock. For this, the "ap_clk" HDL signal is used. At the rising edge of clock, "ap_clk" HDL signal value is 1 else it is 0. Records with Signal transitions at the clock instance when ap_clk HDL signal is 0 are deleted from Table 3.
- For the retained records, the time instants are converted to clock cycles number. For this, the time period provided during synthesis is used and the following formula.

- This clock cycle # information is added to the Table 3 entries as shown below.
Table 3: format (updated with clock cycle #) Time Instant Clock cycle # Module Source code function HDL signal name HDL signal value - The verbose binding report contains design states and sequence of operations active in a state. The sequence of operations are distributed among states (bind_states) by the HLS compiler during synthesis.
- The operation record contains the target signal (in the form of initial name of HDL signal), the operator type, operands, predicate, and line numbers. The operands are the inputs of the operation and are available in the form of initial names of HDL signals. The predicate indicates the condition that needs to be satisfied for the target signal to attain the output of operation. The predicate contains either "TRUE" or a signal expression. When the predicate is "TRUE" or signal expression evaluates as "TRUE", the output of operation gets assigned to target signal otherwise the target signal is not updated. Line number indicates the source code line number for the target signal. Parse the verbose binding report to record the target signals belonging to a particular state (state_bind) and their predicate, operation, operands, and line numbers. The signals here are indicated as initial_names and do not directly correspond to HDL signal names. This information is presented in tabular format (Table 4).
Table 4: format and an example. state_bind # initial_name operator operands predicate Line number 2 i add i_0,1 true 3 - Parse the verbose binding report to link the initial_name to HDL signal name. For every initial_name the verbose binding report contains the HDL signal name. This information is presented in tabular format (Table 5).
Table 5: format and an example. Initial_name HDL signal name i i_fu_142 - Merge Table 4 and Table 5 to generate Table 6. In addition to Table 4 entries, Table 6 contains HDL signal name for every initial name.
Table 6: format and an example. state_bind # HDL signal name initial_name operator operands predicate Line number 2 i_fu_142 i add i_0,1 true 3 - Parse the HDL file to obtain whether HDL signal name is a wire or register. The 'type' information is added into Table 6 to generate Table 7.
Table 7: format and an example state_bind HDL signal name type (wire/reg) initial _name operator operands predicate Line number 2 i_fu_142 wire i add i_0,1 true 3 - Parse .adb file to link initial_names to source code variables. This information is presented in tabular format in Table 8.
Table 8: format and an example Initial_name Source code variable i i - Merge Table 7 and Table 8 to generate Table 9. The source code variable information is added into Table 7 to generate Table 9.
Table 9: format and an example state_bin d HDL signal name type (wire/re g) initial_nam e Source code variabl e operate r operand s predicat e Line numbe r 2 i_fu_14 2wire i i add i_0,1 true 3 - STEP 14:
- Parse the source code to record the target source code variables, array variables, precision data type status and multiplication status at each line along with line numbers in Table 10.
- Target source code variable holds the final variable at every line.
- Array variables stores the source code variables whose data structure is array and present at right hand side of assignment ('=') operator. At any line, if square bracket i.e. [] is followed by any source code variable, then that source code variable is array, square brackets may be empty, or they might contain the size of array as some constant or variables. If no array is present at any line then array variables hold 'NA' i.e., non-available value.
- Precision data type status stores the status of lines i.e., whether the line includes variables with precision data type or not. If source code contains #ap_int.h or #ap_fixed.h library then assign precision_data.value = 1 else precision_data.value = 0. If precision_data. value == 1 and any variable on any Line number is declared as precision data type i.e., of type ap_int or ap_fixed (and not standard data type (int, short, char, double, float)) then precision data type status on that line is TRUE else it is FALSE.
- Multiplication status holds TRUE when multiplication operation i.e., `*" operator is used at any line else it is FALSE.
- If 'if/else' condition is present in source code i.e., 'if keyword at any line, then assign if/else.value = 1 or if/else.value = 0.
- If multiple functions are defined in source code and Table 2 has more than 1 entry then assign mult_func.value =1 else mult_func.value=0.
mult_func.value=0
if/else.value = 0
precision_data.value = 0Table 10: format and an example Line # Line source code variable array variables precision data type status Multiplication status 3 outer:for(i=0;i<row_size;i++) { i NA FALSE FALSE 4 middle:for(j=0;j<col_size;j++) { j NA FALSE FALSE 5 i_col = i ∗ col_size; i_col NA FALSE TRUE 6 double sum = 0; sum NA FALSE FALSE 7 inner:for(k=0;k<row_size;k++) { k NA FALSE FALSE 8 k_col = k ∗ col_size; k_col NA FALSE TRUE 9 mult = m1[i_col + k] * m2[k_col + j]; mult m1,m2 FALSE TRUE 10 sum += mult;} sum NA FALSE FALSE 11 prod[i_col + j] = sum } } } prod NA FALSE FALSE - Update Table 10 to Table 11 by adding line number availability status, line number status , source code variables availability status and source code variable status at every line of source code. One or more rules from an example set of associative rules mentioned below are used to obtain various status at line level. As can be understood the rules can be modified as per the requirements.
- RLTLE 1: A Line number present in Table 10, if also present in line number column of Table 9 then Line number availability in Table 11 for the same is `avail' else it is 'NA' i.e., non-available. The 'avail' or NA status is populated in Table 11.
- RULE 2: If Line number availability is 'avail' in Table 11. The source variable and array variable at that line from Table 10 is compared with the source variable entry for the same line in Table 9. If both source variables are the same or if array variable present in Table 10 is same as source variable in Table 9, then the line number status is correct otherwise incorrect.
- RULE 3: If Line number availability is 'NA' in Table 11, then Line number status will be NA i.e., not applicable.
- RULE 4: A source code variable present in Table 10, if also present in Table 9 then source code variable availability in Table 11 is `avail' else it is 'NA' i.e., non-available.
- RULE 5: For every source code variable present in Table 11, if source code variable status is 'avail' and Tablet 1.line number is same as Table9.Line number corresponding to same source code variable then source code variable status is 'correct'.
- If in Table9, more than 1 HDL signals have the same source code variable, and if that source code variable is array with array index (i.e., if source code variable is in the form of source code variable[n], where n is index) then source code variable status is 'incorrect' for the same in Table 11.
- In all the rest cases, source code variable status is 'incorrect' in Table 11.
- RULE 6: For every source code variable present in Table 11, if source code variable availability is 'NA' then source code variable status is 'NA' i.e., NOT applicable. mult_func.value=0
if/else.value = 0
precision_data.value = 0Table 11: depicting status Line numb er Line Sourc e code variab le Array variab le precisi on data type status Multiplicat ion status Line number availabili ty Line numb er status Source code variable availabili ty Sourc e code varia ble status 3 Outer: for(i=0; i<row_size;i ++) { i NA FALS E FALSE avail correc t avail correc t 4 Middle : for(j=0; j<col_size;j ++) { j NA FALS E FALSE avail correc t avail correc t 5 i_col = i * col_size; i_col NA FALS E TRUE avail correc t avail correc t - If the Line number availability is 'avail' and status is 'correct' → No further processing is required for this line.
- If the Line number availability is 'avail' and status is 'incorrect' →
Apply RULE 7 to suppress incorrect line numbers. - If the Line number availability is 'NA', status is 'NA' and precision_data.value = 1 →
Apply RULE 8 to obtain the correct line numbers. - If the Line number availability is 'NA', status is 'NA' and precision_data.value = 0 → No further processing is required for this line as line number gets optimized.
- Reasons for line number optimization are:
- a. Source code variable can be initialized at that line number.
- b. Same computation is performed at any previous line numbers.
- c. One variable is assigned to any other variable without any computation performed on former.
- If the source code variable availability is 'avail' and status is 'correct' → No further processing is required for this source code variable.
- If the source code variable availability is 'avail' and status is 'incorrect' →
Apply RULE 9 to obtain the correct source code variables. - If the source code variable availability is 'NA' and status is 'NA' →
Apply RULE 8 andRULE 10 to RULE 12 to obtain the correct source code variables. - Update the Table 9.line number and Table9.source code variables with correct line numbers and correct source code variables after applying appropriate rules.
Table 9: format state_bind HDL signal name type (wire/reg) initial _name Source code variable operator operands predicate Line number - Check if pipelining is present in the design. For this check, parse the verbose binding report and search for Pipeline keyword. If the value of Pipeline is not equal to 0, pipeline is present in the design. If the value of Pipeline is 0, pipeline is not present in the design.
- If pipeline is not present in the design: Extract the state variable to determine the state of execution at a particular clock cycle. The "AP_CS_FSM" HDL signal value is used for this. The "AP_CS_FSM" value is converted from hexadecimal to integer and take its antilog for every clock cycle. The state variable value is obtained by adding 1 to the antilog value. The state variable thus obtained is referred to as "AP_CS_FSM_st".
- Parse the verbose binding report to link the states available (indicated as state _bind) in verbose binding report to the states obtained from "AP_CS_FSM". The states with equal values for state_bind and AP_CS_FSM_st are same. This information is presented in tabular format (Table 12)
-
Table 12 format and an example AP_CS_FSM_st state_bind 5 5 - If pipelining is present in the design: Value of pipeline will be same as the number of `for loops' in which pipelining pragma is applied. To link the timing information for HDL signals present in Table 3 with Table 9, follow the given steps:
STEP 21.1 : Parse the verbose binding report to record the pipeline_name, initiation interval (II), states (state _bind) and create Table 13.Table 13: format and example pipeline_name Initiation_interval state_bind Pipeline-0 2 45678
• pipeline_stage_hdl_signal is captured in the form of pipeline stages that are derived from state _bind and initiation interval. - ∘ Total number of pipeline stages = Initiation interval, and Pipeline stages number varies from 0 to (Initiation interval -1). If pipelining is applied, only one pipeline stage can be active at any clock and, but multiple bind states can be active simultaneously at any clock.
- ∘ STEP i- m starts from 0
- ∘ STEP ii- pipeline_stage_hdl_signal for present state_bind = string concatenate ("ap_CS_fsm_pp " + #pipeline_value + "_stage" + m).
- ∘ STEP iii- if m is not equal to (initiation interval -1), increment m by 1.
- ∘ STEP iv- if m is equal to (initiation interval -1), reset m to 0.
- ∘ Repeat steps STEP ii, STEP iii, and STEP iv till all states in state _bind is exhausted.
- Start cycle by cycle processing of Table 3 obtained in STEP7.
- Fetch all HDL signals and their values sharing the same cycle#.
Entries from Table 3 Clock cycle # Module Source code function HDL signal name HDL signal value i abc abc_func abc_hdl abc_hdl_val i bed bcd_func bcd_hdl bcd_hdl_val - (Link the timing information for HDL signals using Table 3, Table 9, and Table 12/Table14. )
- From the set of all HDL signals of a particular clock cycle #, Check the "AP_CS_FSM_st" value for non-pipelined designs and "pipeline_stage_hdl_signal " and "control_hdl_signal" for pipelined designs.
- Fetch the state_bind value from Table 12 for non-pipelined design. For pipelined design, fetch the state_bind value from Table 14 when pipeline stage hdl signal and control hdl signal are high at a clock cycle.
- Fetch the HDL signal names for that state_bind value from Table 9.
Entries from Table 9 state_ bind initial _ name operator operands predicate Line number HDL signal name type (wire/reg) Source code variable 1 abc_x add abc_op1, abc_op2 abc_pred abc_ln abc_hdl wire abc_sc - From all HDL signal fetched in STEP 22, retain signals that match HDL signals fetched for state_bind in STEP 23. Populate Line number, source code variable, type, and predicate entries for HDL signal from Table 9.
Table 15 Clock cycle # Module Source code function HDL signal name HDL signal value Line number Source code variable Type (wire/reg) predicate i abc abc_func abc_hdl abc_hdl_val abc_ln abc_sc wire abc_pred - Check if retained HDL signal name is wire or reg in Table 15.
- If wire, record signals under present state of execution.
- If reg, record signals under next state of execution.
- Check the predicate for an HDL signal names in Table 15.
- If the predicate is true or evaluates true, retain the record, otherwise delete the record.
- Rules to maintain correctness in profile in cycle by cycle behaviour of profile.
- Check if/else.value obtained at
STEP 14 is 1 -->Apply RULE 13, and - Check if mult_func.value obtained at
STEP 14 is 1 -->Apply RULE 14, otherwise proceed to STEP 28. - Repeat STEP 25-27, for all HDL signals in state_bind.
- Populate retained record in performance table (Table 16) with clock cycle#, Line number, source code variable and HDL signal value entries from Table 15.
Table 16: format Clock cycle # Line number Source code variable HDL signal value - Repeat STEP 22-STEP29 to generate the entire performance profile in tabular format i.e., for all HDL signals for all states. Keep populating Table 16 for entire execution time.
- RULE 7: For any line number if the Line number availability is 'avail' and status is 'incorrect'. These are the cases when line numbers other than line numbers present in Table 11 come up in Table 9. In such cases, unwanted line numbers from Table 9 are suppressed by deleting those line numbers from Table9.line number column.
- RULE 8: For any line number/ source code variable present in Table 11, if line number/ source code variable availability is 'NA', status is 'NA' and precision_data.value = 1 then the Line number/ source code variable can be generated through code transformation parser (discussed in STEP R8.1-R8.6).
- If source code contains #ap_int.h or #ap_fixed.h, then replace the arbitrary precision datatype of all variables with converted data types based on Table17:
Table: 17 Arbitrary precision Datatype Converted data type ap_uint<n> ; 0<n<=8 unsigned char ap_uint<n>; 8<n<=16 unsigned short int ap_uint<n> ;16<n<=32 unsigned int ap_int<n> ; 0<n<=8 char ap_int<n>; 8<n<=16 short int ap_int<n> ;16<n<=32 int ap_int<n> ;32<n<=64 long ap_ufixed<W,I>; 0<W<=32 float ap_ufixed<W,I>; 32<W<=64 double ap_fixed<W,I>; 0<W<=32 float ap_fixed<W,I>; 32<W<=64 double - After converting datatype of arbitrary precision datatype variables, synthesize the type-casted
code using STEP - Repeat steps
STEP Table 18: format initial_name operator operands Line number Source code variable - Generate Table18 for type-casted code and original-code.
- Find all the missing line numbers of original code due to precision data types. Missing line numbers = line numbers obtained from Table 18(after typecasting) - line numbers obtained from Table 18 (before typecasting ie. Original code).
- Merge Table 18 of type-casted code and original-code with keys operator and operands to create Table 19 with column Type-casted.initial_name, Type-casted.operator, Type-casted.operands, Type-casted.line_number, Type-casted.source_code_variable, Original-code.initial_name, Original-code.operator, Original-code. operands.
Table 19: format and an example. Type-casted code Originalcode Initial_na me operat or opernds Line_num ber Source_c ode variable Initial_na me operat or operands sub_ln23 sub triangle_3d_ x2, tri angl e_3d_ x0 23 NA ret29 sub triangle_3d_x2 _V, triangle_3d_x0 _V - If (Type-casted.operator == Original-code.operator) and (Type-casted.operands == Original-code.operands), then Original-code.initial_name = Type-casted.initial_name.
- Populate Type-casted.Line number and Type-casted.source_code variable name from Table 19 for Original-code.inital_name entry in Table 9.
- For any source code variable present in Table 11, if source code variable availability is 'avail', source code status is 'incorrect', and if it is due to multiple signals having same source code variable, and that variable is array with array index then correct source variable is generated through mux rule.
Table 11 of Example Source Code Line number Source code line precision data type status Source code variable Source code variable availability Source code variable status 101 for(int i = 0; i < n_leaves; i++){ FALSE i avail correct 102 FALSE NA NA NA 103 FALSE value_leaf avail incorrect 104 if(activation_leaf[i]){ return value_leaf[i]; } - Create Table 20 with columns 'initial', 'operands', 'operation', `line number' and `source code variable'. Compare line number of incorrect source code variable present in Table 11 with the line number in Table 9, initials in Table 9 with same Line number and operation 'mux' will be stored as initials in Table 20 along with operands, operation, and line number of the same.
Table 9: format and an example state_ bind initial_n ame operat or operands predi cate Line num ber HDL signal name Type (wire /reg) Source code variable 3 value_le af_V_0_ 13 select icmp_ln94 _37, p_read_24, value_leaf V_0_12 true 95 value_l eaf_V_ 0_13_f u_5361 wire value_l eaf.V[0] 3 value_le af_V_0_ 14 select icmp_ln94 _43, p_read_23, value_leaf V_0_13 true 95 value_l eaf_V_ 0_14_f u_5733 wire value_le af.V[0] 4 sext_ln9 5_1 sext value_leaf V_0_14 true 95 sext_ln 95_1_f u_6486 wire NA 4 tmp_36 mux sext_ln95_ 1, sext_ln95_ 2,sext_ln95_ 3,sext_ln95_ 4,sext_ln95_ 5,sext_ln95_ 6,sext_ln95_ 7,sext_ln95_ 8, select_ln10 2_5true 103 or_ln10 2_5_re g_7820 reg NA - Compare Table11.Line number with Table20.Line number for 'incorrect' source code variable status present in Table 11. If both Table11.Line number ==Table20.Line number, then assign source code variable present in Table 11 to all the operands in Table 20 who's initial has same line number. Assign array index of source code variable according to the position of operands except last operand.
- Now compare Table9. Initial_name and Table20. Operands, if they are same then populate Table 20. Source code variables in Table 9 source code variable against same initials.
Table 20: format and an example initial operands operation line number Source code variable tmp_36 sext_ln95_1, mux 103 value_leaf[0] sext_ln95_2, value_leaf[1] sext_ln95_3, value_leaf[2] sext_ln95_4, value_leaf[3] sext_ln95_5, value_leaf[4] sext_ln95_6, value_leaf[5] sext_ln95_7, value_leaf[6] sext_ln95_8, value_leaf[7] select_ln102_5 - For any source code variable present in Table 11, if source code variable availability is `NA', source code status is NA and multiplication status is TRUE, then the target signal on the same line number with `bitconcatenate' / 'ashr' operation in Table 9 will be assigned same source code variable.
- There are cases when source code variable availability is 'NA' in Table 11, but they are same as initial_name in Table 9. Therefore, these initial names can be populated as source code variables in Table 9.
- If HDL signal names in Table 9 are in form of name+'_d'/'_q' + port number then SC variable is same as name.
- Ex.
SC variable name for signal name M1_q0 is M1 - If "if/else" present in source code then follow the below steps to maintain the correctness in dynamic performance profile.
- Parse source code to store every 'if-else' condition line number present in source code in Table 21, It will store
- 'if /elif condition line no in 'if/elif'Ln_no column,
- the executed line numbers when 'if/elif' condition become true in `if/elif then'Ln_no column,
- 'else' condition line no in 'else'Ln_no column, and
- the executed line number when 'else' condition become true in `else then'Ln_no column.
- If there is no 'else' condition for any `if c condition, then 'NA' i.e., not available is stored in 'else'Ln_no' and `else then'Ln_no.
- If there is no 'if/elif' condition in source code i.e., if/else.value == 0 then keep Table 21 empty.
Table 21 format and an example 'if/elif'Ln_no 'if/elif then'Ln_no 'else'Ln_no 'else then'Ln_no 4 5 NA NA 6 7 8 9,10,11,12 10 11 12 12 - If Table 21 is not empty, then compare Table21.'if/elif'Ln_no with Table9.line number and find the equivalent signal of every 'if/else' comparison and record the same in Table22.
'if/elif'Ln_no : Equivalent signalTable 22: format and an example 'if/elif'Ln_no Equivalent signal 4 icmp_ln4 6 icmp_ln6 10 xor_ln10 - Equivalent signal for every comparison can be found by given below ways:
- a. Compare Table 21.'if/elif'Ln_no.values with Table9.line number, if both are equal and Table9.operation.value is `br' and operand is other than `void', then the operand will be the equivalent comparison signal.
- b. For every 'if/elif'Ln_no in Table 21, find the initial_name whose operation is same as `icmp' / 'xor' / 'and' / 'or'. If there are multiple initials with same operation, then select the target initial (i.e., last occurring initial) as equivalent comparison signal.
- c. If there is no line number in Table 9 for any Table21.'if/elif'Ln_no.value then compare the
Table2 1. 'if/elif then'Ln_no.value with Table 9.line number.values.For same line numbers, do the 'and' operation of every corresponding predicate signal and the resultant will be equivalent comparison signal. - After finding the equivalent comparison signal of every 'if/elif' condition in Table22, if comparison signal is true at any clock in Table 15, then generate the 'if/elif then'Ln_no and suppress the `else then' Ln no at that clock. If 'if/elif' comparison signal is low at any clock, then suppress the 'if/elif then'Ln_no at that clock.
- If mult_func.value = 1.
- Follow below steps to maintain accuracy.
- For every source code function in Table 2, check the transition of HDL signal ( #Module Name + ap_start) throughout the execution in Table 15.
- If HDL signal (#Module + ap_start) is low at any clock for source code function, then source code function is inactive at that clock. At that clock, all HDL signals in Table15.HDL_signal_name which has same inactive source code function in Table15.source_code_function belong to inactive function. All the column entries for HDL signals corresponding to inactive function are deleted at that clock from Table 15..
Table 15 Clock cycle # Module Source code function HDL signal name HDL signal value Line number Source code variable Type (wire/reg) predicate i abc abc_func abc_hdl abc_hdl_val abc_ln abc_sc wire abc_pred - The written description describes the subject matter herein to enable any person skilled in the art to make and use the embodiments. The scope of the subject matter embodiments is defined by the claims and may include other modifications that occur to those skilled in the art. Such other modifications are intended to be within the scope of the claims if they have similar elements that do not differ from the literal language of the claims or if they include equivalent elements with insubstantial differences from the literal language of the claims.
- The method disclosed provides intrusive profiling of high-level synthesis HLS based applications with a cycle-accurate, fine-grained performance profiling framework that is non-intrusive and provides an end-to-end profile of the design. Such profiling tool can help the designer/DSE tool to quickly identify the performance bottlenecks and have a guided approach towards tuning it.
- It is to be understood that the scope of the protection is extended to such a program and in addition to a computer-readable means having a message therein; such computer-readable storage means contain program-code means for implementation of one or more steps of the method, when the program runs on a server or mobile device or any suitable programmable device. The hardware device can be any kind of device which can be programmed including e.g., any kind of computer like a server or a personal computer, or the like, or any combination thereof. The device may also include means which could be e.g., hardware means like e.g., an application-specific integrated circuit (ASIC), a field-programmable gate array (FPGA), or a combination of hardware and software means, e.g., an ASIC and an FPGA, or at least one microprocessor and at least one memory with software processing components located therein. Thus, the means can include both hardware means, and software means. The method embodiments described herein could be implemented in hardware and software. The device may also include software means. Alternatively, the embodiments may be implemented on different hardware devices, e.g., using a plurality of CPUs.
- The embodiments herein can comprise hardware and software elements. The embodiments that are implemented in software include but are not limited to, firmware, resident software, microcode, etc. The functions performed by various components described herein may be implemented in other components or combinations of other components. For the purposes of this description, a computer-usable or computer readable medium can be any apparatus that can comprise, store, communicate, propagate, or transport the program for use by or in connection with the instruction execution system, apparatus, or device.
- The illustrated steps are set out to explain the exemplary embodiments shown, and it should be anticipated that ongoing technological development will change the manner in which particular functions are performed. These examples are presented herein for purposes of illustration, and not limitation. Further, the boundaries of the functional building blocks have been arbitrarily defined herein for the convenience of the description. Alternative boundaries can be defined so long as the specified functions and relationships thereof are appropriately performed. Alternatives (including equivalents, extensions, variations, deviations, etc., of those described herein) will be apparent to persons skilled in the relevant art(s) based on the teachings contained herein. Such alternatives fall within the scope of the disclosed embodiments. Also, the words "comprising," "having," "containing," and "including," and other similar forms are intended to be equivalent in meaning and be open ended in that an item or items following any one of these words is not meant to be an exhaustive listing of such item or items or meant to be limited to only the listed item or items. It must also be noted that as used herein and in the appended claims, the singular forms "a," "an," and "the" include plural references unless the context clearly dictates otherwise.
- Furthermore, one or more computer-readable storage media may be utilized in implementing embodiments consistent with the present disclosure. A computer-readable storage medium refers to any type of physical memory on which information or data readable by a processor may be stored. Thus, a computer-readable storage medium may store instructions for execution by one or more processors, including instructions for causing the processor(s) to perform steps or stages consistent with the embodiments described herein. The term "computer-readable medium" should be understood to include tangible items and exclude carrier waves and transient signals, i.e., be non-transitory. Examples include random access memory (RAM), read-only memory (ROM), volatile memory, nonvolatile memory, hard drives, CD ROMs, DVDs, flash drives, disks, and any other known physical storage media.
- It is intended that the disclosure and examples be considered as exemplary only, with a true scope of disclosed embodiments being indicated by the following claims.
∘ # of Control signals vary from 0 to {ceil(n/2)-1} where n is the number of bind states (state_bind).
∘ STEP a- k starts from 0.
∘ STEP b- k remains constant till state _bind equal to initiation interval gets exhausted.
∘ STEP c- Control signal for present state_bind = string concatenate ("ap_enable_reg_pp" + #(integer value in pipeline_name) + "_iter" + k).
∘ STEP d- k gets incremented by 1.
∘ STEP e: Repeat steps STEP b, STEP c and STEP d till all states in state _bind is exhausted.
∘ Repeat steps STEP a, STEP b, STEP c, STEP d and STEP e for all pipelines.
| pipeline _name | state bind | pipeline_stage_hdl_signal | control_hdl_signal |
| Pipeline-0 | 4 | ap_CS_fsm_pp0_stage0 | ap_enable_reg_pp0_iter0 |
| Pipeline-0 | 5 | ap_CS_fsm_pp0_stage1 | ap_enable_reg_pp0_iter0 |
| Pipeline-0 | 6 | ap_CS_fsm_pp0_stage0 | ap_enable_reg_pp0_iter1 |
| Pipeline-0 | 7 | ap_CS_fsm_pp0_stage1 | ap_enable_reg_pp0_iter1 |
| Pipeline-0 | 8 | ap_CS_fsm_pp0_stage0 | ap_enable_reg_pp0_iter2 |
Claims (6)
- A processor implemented method (200) for non-intrusive profiling of High-Level Synthesis (HLS) applications, the method comprising:synthesizing a design for a source code for an HLS based application, by one or more hardware processors, using an HLS compiler, in accordance with a synthesis time period, wherein the design is specified by the HLS compiler in terms of a plurality of hardware description language (HDL) files, a synthesis report, a verbose binding report and a plurality of database files (202);co-simulating the design of the plurality of HDL files, by the one or more hardware processors using a co-simulator, based on a test bench identified for the source code to generate a Value Change Dump (VCD) file comprising a plurality of HDL signals in the plurality of HDL files cycle-by-cycle and a corresponding plurality of HDL signal values for an entire execution time at every time instant with a plurality of commands (204);extracting structured information (206), by the one or more hardware processors, using an HLS profiler by:(a) parsing the VCD file to generate a timing information for the plurality of HDL signals from the plurality of HDL files with the corresponding plurality of HDL signal values;(b) parsing the synthesis report to generate a plurality of module names to which the plurality of HDL signals belong and a corresponding plurality of source code functions;(c) parsing the verbose binding report to link an initial name to an HDL signal name for each of the plurality of HDL signals;(d) parsing the plurality of HDL files to obtain whether the HDL signal name, associated with each of the plurality of HDL signals, is one of a wire and a register;(e) parsing the source code to record a plurality of variables, a plurality of array variables, a precision data type status, and a multiplication status at a line number for each of a plurality of code lines of the source code; and(f) parsing the plurality of database files to link the initial name for each of the HDL signals to the plurality of variables in the source code; andanalyzing, by the one or more hardware processors, using the HLS profiler, the extracted structured information in accordance with one or more rules from a set of associative rules to define associations between the line number of the source code, the plurality of variables, the HDL signal name for each of the plurality of HDL signals and the corresponding plurality of HDL signal values providing visibility into cycle-by-cycle hardware execution of the source-code for entire HLS based application execution time to generate a performance profile table for the source code (208).
- The method of claim 1, wherein the set of associative rules are based on source code semantics, parsed output corresponding to the extracted structured information and HDL design semantics and enable suppress invalid transitions getting captured in standard HLS profiling, wherein a first subset of rules among the set of associative rules enable obtaining status at the line number level and a second subset of rules among set of associative rules enable obtaining profile correctness in the performance profile table.
- A system (100) for non-intrusive profiling for High-Level Synthesis (HLS) based applications, the system (100) comprising:a memory (102) storing instructions;one or more Input/Output (I/O) interfaces (106); andone or more hardware processors (104) coupled to the memory (102) via the one or more I/O interfaces (106), wherein the one or more hardware processors (104) are configured by the instructions to:synthesize a design for a source code for an HLS based application using an HLS compiler, in accordance with a synthesis time period, wherein the design is specified by the HLS compiler in terms of a plurality of hardware description language (HDL) files, a synthesis report, a verbose binding report and a plurality of database files;co-simulate the design of the plurality of HDL files using a co-simulator, based on a test bench identified for the source code to generate a Value Change Dump (VCD) file comprising a plurality of HDL signals in the plurality of HDL files cycle-by-cycle and a corresponding plurality of HDL signal values for an entire execution time at every time instant with a plurality of commands;extract structured information using an HLS profiler by:(a) parsing the VCD file to generate a timing information for the plurality of HDL signals from the plurality of HDL files with the corresponding plurality of HDL signal values;(b) parsing the synthesis report to generate a plurality of module names to which the plurality of HDL signals belong and a corresponding plurality of source code functions;(c) parsing the verbose binding report to link an initial name to an HDL signal name for each of the plurality of HDL signals;(d) parsing the plurality of HDL files to obtain whether the HDL signal name, associated with each of the plurality of HDL signals, is one of a wire and a register;(e) parsing the source code to record a plurality of variables, a plurality of array variables, a precision data type status, and a multiplication status at a line number for each of a plurality of code lines of the source code; and(f) parsing the plurality of database files to link the initial name for each of the HDL signals to the plurality of variables in the source code; andanalyze using the HLS profiler, the extracted structured information in accordance with one or more rules from a set of associative rules to define associations between the line number of the source code, the plurality of variables, the HDL signal name for each of the plurality of HDL signals and the corresponding plurality of HDL signal values providing visibility into cycle-by-cycle hardware execution of the source-code for entire HLS based application execution time to generate a performance profile table for the source code.
- The system of claim 3, wherein the set of associative rules are based on source code semantics, parsed output corresponding to the extracted structured information and HDL design semantics, and enable suppress invalid transitions getting captured in standard HLS profiling, wherein a first subset of rules among the set of associative rules enable obtaining status at the line number level and a second subset of rules among set of associative rules enable obtaining profile correctness in the performance profile table.
- One or more non-transitory machine-readable information storage mediums comprising one or more instructions which when executed by one or more hardware processors cause:synthesizing a design for a source code for an HLS based application, using an HLS compiler, in accordance with a synthesis time period, wherein the design is specified by the HLS compiler in terms of a plurality of hardware description language (HDL) files, a synthesis report, a verbose binding report and a plurality of database files;co-simulating the design of the plurality of HDL files, using a co-simulator, based on a test bench identified for the source code to generate a Value Change Dump (VCD) file comprising a plurality of HDL signals in the plurality of HDL files cycle-by-cycle and a corresponding plurality of HDL signal values for an entire execution time at every time instant with a plurality of commands;extracting structured information, using an HLS profiler by:(a) parsing the VCD file to generate a timing information for the plurality of HDL signals from the plurality of HDL files with the corresponding plurality of HDL signal values;(b) parsing the synthesis report to generate a plurality of module names to which the plurality of HDL signals belong and a corresponding plurality of source code functions;(c) parsing the verbose binding report to link an initial name to an HDL signal name for each of the plurality of HDL signals;(d) parsing the plurality of HDL files to obtain whether the HDL signal name, associated with each of the plurality of HDL signals, is one of a wire and a register;(e) parsing the source code to record a plurality of variables, a plurality of array variables, a precision data type status, and a multiplication status at a line number for each of a plurality of code lines of the source code; and(f) parsing the plurality of database files to link the initial name for each of the HDL signals to the plurality of variables in the source code; andanalyzing, using the HLS profiler, the extracted structured information in accordance with one or more rules from a set of associative rules to define associations between the line number of the source code, the plurality of variables, the HDL signal name for each of the plurality of HDL signals and the corresponding plurality of HDL signal values providing visibility into cycle-by-cycle hardware execution of the source-code for entire HLS based application execution time to generate a performance profile table for the source code.
- The one or more non-transitory machine-readable information storage mediums of claim 5, wherein the set of associative rules are based on source code semantics, parsed output corresponding to the extracted structured information and HDL design semantics and enable suppress invalid transitions getting captured in standard HLS profiling, wherein a first subset of rules among the set of associative rules enable obtaining status at the line number level and a second subset of rules among set of associative rules enable obtaining profile correctness in the performance profile table.
Applications Claiming Priority (1)
| Application Number | Priority Date | Filing Date | Title |
|---|---|---|---|
| IN202221017111 | 2022-03-25 |
Publications (1)
| Publication Number | Publication Date |
|---|---|
| EP4250169A1 true EP4250169A1 (en) | 2023-09-27 |
Family
ID=84568896
Family Applications (1)
| Application Number | Title | Priority Date | Filing Date |
|---|---|---|---|
| EP22215449.4A Pending EP4250169A1 (en) | 2022-03-25 | 2022-12-21 | Method and system for non-intrusive profiling of high-level synthesis (hls) based applications |
Country Status (2)
| Country | Link |
|---|---|
| US (1) | US12423060B2 (en) |
| EP (1) | EP4250169A1 (en) |
Families Citing this family (1)
| Publication number | Priority date | Publication date | Assignee | Title |
|---|---|---|---|---|
| US12399688B2 (en) * | 2023-04-07 | 2025-08-26 | SiMa Technologies, Inc. | Development platform for image processing pipelines that use machine learning with user interface |
Citations (5)
| Publication number | Priority date | Publication date | Assignee | Title |
|---|---|---|---|---|
| US20130191799A1 (en) * | 2012-01-25 | 2013-07-25 | Fujitsu Semiconductor Limited | High-level synthesis device, high-level synthesis method, high-level synthesis program, and integrated circuit design method |
| US9652570B1 (en) * | 2015-09-03 | 2017-05-16 | Xilinx, Inc. | Automatic implementation of a customized system-on-chip |
| US20190095566A1 (en) * | 2017-09-26 | 2019-03-28 | Intel Corporation | Method of reporting circuit performance for high-level synthesis |
| US10262088B1 (en) * | 2017-03-16 | 2019-04-16 | Cadence Design Systems, Inc. | Converting real number modeling code to cycle-driven simulation interface code for circuit design in digital mixed signal environments |
| US10515168B1 (en) * | 2014-06-04 | 2019-12-24 | Mentor Graphics Corporation | Formal verification using microtransactions |
Family Cites Families (3)
| Publication number | Priority date | Publication date | Assignee | Title |
|---|---|---|---|---|
| US20150278078A1 (en) * | 2014-03-25 | 2015-10-01 | Akiyoshi Kawamura | Method and computer program for identifying performance tuning opportunities in parallel programs |
| US11675948B2 (en) * | 2017-09-29 | 2023-06-13 | Intel Corporation | Methods and apparatus for profile-guided optimization of integrated circuits |
| IT201900006380A1 (en) * | 2019-04-26 | 2020-10-26 | Milano Politecnico | METHOD FOR CREATING A HARDWARE DEVICE TO PERFORM OPERATIONS DEFINED BY A HIGH-LEVEL SOFTWARE CODE |
-
2022
- 2022-12-21 US US18/086,248 patent/US12423060B2/en active Active
- 2022-12-21 EP EP22215449.4A patent/EP4250169A1/en active Pending
Patent Citations (5)
| Publication number | Priority date | Publication date | Assignee | Title |
|---|---|---|---|---|
| US20130191799A1 (en) * | 2012-01-25 | 2013-07-25 | Fujitsu Semiconductor Limited | High-level synthesis device, high-level synthesis method, high-level synthesis program, and integrated circuit design method |
| US10515168B1 (en) * | 2014-06-04 | 2019-12-24 | Mentor Graphics Corporation | Formal verification using microtransactions |
| US9652570B1 (en) * | 2015-09-03 | 2017-05-16 | Xilinx, Inc. | Automatic implementation of a customized system-on-chip |
| US10262088B1 (en) * | 2017-03-16 | 2019-04-16 | Cadence Design Systems, Inc. | Converting real number modeling code to cycle-driven simulation interface code for circuit design in digital mixed signal environments |
| US20190095566A1 (en) * | 2017-09-26 | 2019-03-28 | Intel Corporation | Method of reporting circuit performance for high-level synthesis |
Non-Patent Citations (1)
| Title |
|---|
| JAY FENLASON ET AL: "GNU gprof - The GNU Profiler - Manual for version 2.9.1", INTERNET CITATION, 7 November 1998 (1998-11-07), XP002456352, Retrieved from the Internet <URL:http://www.gnu.org/software/binutils/manual/gprof-2.9.1/html_mono/gprof.html> [retrieved on 20071024] * |
Also Published As
| Publication number | Publication date |
|---|---|
| US12423060B2 (en) | 2025-09-23 |
| US20230305814A1 (en) | 2023-09-28 |
Similar Documents
| Publication | Publication Date | Title |
|---|---|---|
| US10289541B2 (en) | Source code flow analysis using information retrieval | |
| US8387026B1 (en) | Compile-time feedback-directed optimizations using estimated edge profiles from hardware-event sampling | |
| US20140331203A1 (en) | Analysis of source code changes | |
| Karandikar et al. | CDPU: Co-designing compression and decompression processing units for hyperscale systems | |
| Lam et al. | Fine-grained floating-point precision analysis | |
| CN113138767B (en) | Code language conversion method, device, electronic equipment and storage medium | |
| US9727319B1 (en) | Reducing compilation time using profile-directed feedback | |
| US20180121585A1 (en) | Graph based dynamic timing and activity analysis | |
| US11474795B2 (en) | Static enforcement of provable assertions at compile | |
| CN111949540A (en) | A code change risk estimation auditing method and device | |
| CN112328259A (en) | Compiling time length processing method and device | |
| Friese et al. | Generating performance models for irregular applications | |
| Callou et al. | Energy consumption and execution time estimation of embedded system applications | |
| US12423060B2 (en) | Method and system for non-intrusive profiling of high-level synthesis (HLS) based applications | |
| Févotte et al. | Debugging and optimization of HPC programs with the Verrou tool | |
| Liu et al. | Funredisp: Reordering function dispatch in smart contract to reduce invocation gas fees | |
| Zhu et al. | An analysis of programming language statement frequency in C, C++, and Java source code | |
| Févotte et al. | Debugging and optimization of HPC programs in mixed precision with the Verrou tool | |
| Wolf et al. | Execution cost interval refinement in static software analysis | |
| Szalay et al. | Towards better symbol resolution for C/C++ programs: A cluster-based solution | |
| Maron et al. | Should PARSEC benchmarks be more parametric? a case study with Dedup | |
| CN109582574A (en) | A kind of code coverage statistical method, device, storage medium and terminal device | |
| Madougou et al. | Using colored petri nets for GPGPU performance modeling | |
| CN111339035A (en) | Target data query method and device, computer equipment and storage medium | |
| EP4220473B1 (en) | Method and system for validation of calculation code against calculation specification |
Legal Events
| Date | Code | Title | Description |
|---|---|---|---|
| PUAI | Public reference made under article 153(3) epc to a published international application that has entered the european phase |
Free format text: ORIGINAL CODE: 0009012 |
|
| STAA | Information on the status of an ep patent application or granted ep patent |
Free format text: STATUS: THE APPLICATION HAS BEEN PUBLISHED |
|
| AK | Designated contracting states |
Kind code of ref document: A1 Designated state(s): AL AT BE BG CH CY CZ DE DK EE ES FI FR GB GR HR HU IE IS IT LI LT LU LV MC ME MK MT NL NO PL PT RO RS SE SI SK SM TR |
|
| STAA | Information on the status of an ep patent application or granted ep patent |
Free format text: STATUS: REQUEST FOR EXAMINATION WAS MADE |
|
| 17P | Request for examination filed |
Effective date: 20240325 |
|
| RBV | Designated contracting states (corrected) |
Designated state(s): AL AT BE BG CH CY CZ DE DK EE ES FI FR GB GR HR HU IE IS IT LI LT LU LV MC ME MK MT NL NO PL PT RO RS SE SI SK SM TR |