EP4249906A1 - Method of measuring hemoglobin f - Google Patents
Method of measuring hemoglobin f Download PDFInfo
- Publication number
- EP4249906A1 EP4249906A1 EP23162854.6A EP23162854A EP4249906A1 EP 4249906 A1 EP4249906 A1 EP 4249906A1 EP 23162854 A EP23162854 A EP 23162854A EP 4249906 A1 EP4249906 A1 EP 4249906A1
- Authority
- EP
- European Patent Office
- Prior art keywords
- peak
- hbf
- hemoglobin
- liquid chromatography
- value
- Prior art date
- Legal status (The legal status is an assumption and is not a legal conclusion. Google has not performed a legal analysis and makes no representation as to the accuracy of the status listed.)
- Granted
Links
Images



Classifications
-
- G—PHYSICS
- G01—MEASURING; TESTING
- G01N—INVESTIGATING OR ANALYSING MATERIALS BY DETERMINING THEIR CHEMICAL OR PHYSICAL PROPERTIES
- G01N33/00—Investigating or analysing materials by specific methods not covered by groups G01N1/00 - G01N31/00
- G01N33/48—Biological material, e.g. blood, urine; Haemocytometers
- G01N33/483—Physical analysis of biological material
- G01N33/487—Physical analysis of biological material of liquid biological material
- G01N33/49—Blood
-
- G—PHYSICS
- G01—MEASURING; TESTING
- G01N—INVESTIGATING OR ANALYSING MATERIALS BY DETERMINING THEIR CHEMICAL OR PHYSICAL PROPERTIES
- G01N30/00—Investigating or analysing materials by separation into components using adsorption, absorption or similar phenomena or using ion-exchange, e.g. chromatography or field flow fractionation
- G01N30/02—Column chromatography
- G01N30/86—Signal analysis
- G01N30/8675—Evaluation, i.e. decoding of the signal into analytical information
- G01N30/8679—Target compound analysis, i.e. whereby a limited number of peaks is analysed
-
- G—PHYSICS
- G01—MEASURING; TESTING
- G01N—INVESTIGATING OR ANALYSING MATERIALS BY DETERMINING THEIR CHEMICAL OR PHYSICAL PROPERTIES
- G01N30/00—Investigating or analysing materials by separation into components using adsorption, absorption or similar phenomena or using ion-exchange, e.g. chromatography or field flow fractionation
- G01N30/02—Column chromatography
- G01N30/88—Integrated analysis systems specially adapted therefor, not covered by a single one of the groups G01N30/04 - G01N30/86
-
- G—PHYSICS
- G01—MEASURING; TESTING
- G01N—INVESTIGATING OR ANALYSING MATERIALS BY DETERMINING THEIR CHEMICAL OR PHYSICAL PROPERTIES
- G01N30/00—Investigating or analysing materials by separation into components using adsorption, absorption or similar phenomena or using ion-exchange, e.g. chromatography or field flow fractionation
- G01N30/96—Investigating or analysing materials by separation into components using adsorption, absorption or similar phenomena or using ion-exchange, e.g. chromatography or field flow fractionation using ion-exchange
-
- G—PHYSICS
- G01—MEASURING; TESTING
- G01N—INVESTIGATING OR ANALYSING MATERIALS BY DETERMINING THEIR CHEMICAL OR PHYSICAL PROPERTIES
- G01N33/00—Investigating or analysing materials by specific methods not covered by groups G01N1/00 - G01N31/00
- G01N33/48—Biological material, e.g. blood, urine; Haemocytometers
- G01N33/483—Physical analysis of biological material
- G01N33/487—Physical analysis of biological material of liquid biological material
- G01N33/49—Blood
- G01N33/491—Blood by separating the blood components
-
- G—PHYSICS
- G01—MEASURING; TESTING
- G01N—INVESTIGATING OR ANALYSING MATERIALS BY DETERMINING THEIR CHEMICAL OR PHYSICAL PROPERTIES
- G01N33/00—Investigating or analysing materials by specific methods not covered by groups G01N1/00 - G01N31/00
- G01N33/48—Biological material, e.g. blood, urine; Haemocytometers
- G01N33/50—Chemical analysis of biological material, e.g. blood, urine; Testing involving biospecific ligand binding methods; Immunological testing
- G01N33/72—Chemical analysis of biological material, e.g. blood, urine; Testing involving biospecific ligand binding methods; Immunological testing involving blood pigments, e.g. haemoglobin, bilirubin or other porphyrins; involving occult blood
- G01N33/721—Haemoglobin
-
- G—PHYSICS
- G01—MEASURING; TESTING
- G01N—INVESTIGATING OR ANALYSING MATERIALS BY DETERMINING THEIR CHEMICAL OR PHYSICAL PROPERTIES
- G01N30/00—Investigating or analysing materials by separation into components using adsorption, absorption or similar phenomena or using ion-exchange, e.g. chromatography or field flow fractionation
- G01N30/02—Column chromatography
- G01N2030/022—Column chromatography characterised by the kind of separation mechanism
- G01N2030/027—Liquid chromatography
-
- G—PHYSICS
- G01—MEASURING; TESTING
- G01N—INVESTIGATING OR ANALYSING MATERIALS BY DETERMINING THEIR CHEMICAL OR PHYSICAL PROPERTIES
- G01N30/00—Investigating or analysing materials by separation into components using adsorption, absorption or similar phenomena or using ion-exchange, e.g. chromatography or field flow fractionation
- G01N30/02—Column chromatography
- G01N30/88—Integrated analysis systems specially adapted therefor, not covered by a single one of the groups G01N30/04 - G01N30/86
- G01N2030/8809—Integrated analysis systems specially adapted therefor, not covered by a single one of the groups G01N30/04 - G01N30/86 analysis specially adapted for the sample
- G01N2030/8813—Integrated analysis systems specially adapted therefor, not covered by a single one of the groups G01N30/04 - G01N30/86 analysis specially adapted for the sample biological materials
- G01N2030/8822—Integrated analysis systems specially adapted therefor, not covered by a single one of the groups G01N30/04 - G01N30/86 analysis specially adapted for the sample biological materials involving blood
Definitions
- the present invention relates to a method of measuring hemoglobin F in a blood sample.
- Hemoglobin in blood samples can be measured by separation/fractionation methods such as high-performance liquid chromatography or capillary electrophoresis. Since a measured value of hemoglobin F (HbF), which is a type of hemoglobin, can be used as a basis for diagnosis of hemoglobinopathy and thalassemia, the value needs to be highly accurate. Measurement of HbF is often carried out by capillary electrophoresis, and a measured value of HbF obtained by measurement by capillary electrophoresis is often used as a basis for diagnosis. Examples of a method of measuring hemoglobin F using liquid chromatography include the method disclosed in Japanese Patent Application Laid-Open ( JP-A) No. 2014-235023 .
- the component peaks found in a chromatogram of hemoglobin obtained by liquid chromatography show almost the same ratios as those of the component peaks found in an analysis chart of hemoglobin obtained by capillary electrophoresis, and only the HbF peak presents a difference. More specifically, the ratio of the HbF peak in liquid chromatography is lower than the ratio of the HbF peak in capillary electrophoresis.
- an aspect of the present disclosure provides a technique that enables a more accurate measurement of HbF from a chromatogram obtained by subjecting a blood sample to liquid chromatography.
- the ratio of the HbF peak to the entire hemoglobin peak is calculated, and the ratio is multiplied by a predetermined factor, to calculate a corrected value of the HbF peak with respect to the entire hemoglobin peak.
- HbF can be more accurately measured from a chromatograph obtained by subjecting a blood sample to liquid chromatography.
- peak value in the disclosure means the height or area of each peak found in a chromatogram, and the value may be either a relative value or an absolute value.
- the relative value may be the ratio to the total area of the chromatogram, may be the ratio to the total area of the peaks related to hemoglobin in the chromatogram, or may be the ratio to the area of a specific peak (such as an HbA0 peak).
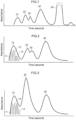
- a chromatograph of hemoglobin such as the one schematically represented in Fig. 1 can be obtained.
- a composite peak 10 including an HbA1a peak 11 and an HbA1b peak 12 (see Fig. 2 and Fig. 3 ), an HbF peak 20, an unstable HbA1c peak 30, an HbA1c peak 40, an HbA0 peak 50, and an HbA2 peak 60 appear in the order of increasing rate of elution from the column.
- Fig. 2 schematically shows a chromatograph of a normal blood sample having an HbF peak value of less than 1%
- Fig. 3 schematically shows a chromatograph of a blood sample of a high-HbF patient.
- the HbF peak 20 in the chromatograph of Fig. 3 is higher than the HbF peak 20 in the chromatograph of Fig. 2
- the composite peak 10 in the chromatograph of Fig. 3 is also higher than the composite peak 10 in the chromatograph of Fig. 2 .
- the composite peak 10 includes an HbA1a peak 11 and an HbA1b peak 12 of HbA1, which is a glycosylated product of HbA.
- an increase in the HbF peak 20 results in an increase in the composite peak 10. Since the composite peak 10 includes the HbA1a peak 11 and the HbA1b peak 12, which are glycosylated products, the increase in the composite peak 10 is thought to be due to an increase in a modified-HbF peak 13, which is a modified product of HbF, as shown in Fig. 3 .
- the normal sample shown in Fig. 2 hardly includes the modified-HbF peak 13, and most part of the composite peak 10 is thought to be formed by the HbA1a peak 11 and the HbA1b peak 12.
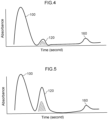
- Fig. 4 schematically shows an analysis chart obtained by subjecting a normal blood sample having an HbF peak value of less than 1% to capillary electrophoresis
- Fig. 5 schematically shows an analysis chart obtained by subjecting a blood sample of a high-HbF patient to capillary electrophoresis.
- an HbA peak 100, an HbF peak 120, and an HbA2 peak 160 appear in this order in the analysis chart.
- the HbF peak 120 in the chromatograph of Fig. 5 is higher than the HbF peak 120 in the chromatograph of Fig. 4 .
- the sizes of the HbA peak 100 and the HbA2 peak 160 in Fig. 4 are almost the same as the sizes of the HbA peak 100 and the HbA2 peak 160 in Fig. 5 . It can thus be assumed that the HbF peak 120 in capillary electrophoresis also includes a modified-HbF peak value.
- the ratio of the hemoglobin F peak to the entire hemoglobin peak is calculated, and the ratio is multiplied by a predetermined factor, to calculate a corrected value of the hemoglobin F peak with respect to the entire hemoglobin peak.
- the predetermined factor is from 1.15 to less than 1.25.
- the more preferable predetermined factor is 1.2.
- the calculation of the corrected value is not limited as long as the ratio of the hemoglobin F peak to the entire hemoglobin peak is multiplied by the predetermined factor as a result.
- the corrected value of the hemoglobin F peak with respect to the entire hemoglobin peak can be calculated.
- cation-exchange chromatography apparatuses of the following Apparatus 1, Apparatus 2, Apparatus 3, and Apparatus 4 were used.
- ADAMS HA-8180V (commercially available from ARKRAY, Inc.) was used.
- a Column Unit 80 (commercially available from ARKRAY, Inc.), which is a column packed with 0.35 ml of a hydrophilic polymer containing a methacrylate copolymer as a packing, was used.
- 80A (commercially available from ARKRAY, Inc.) as Eluent A
- 80B (commercially available from ARKRAY, Inc.) as Eluent B
- 80CV (commercially available from ARKRAY, Inc.) as Eluent C
- 80H (commercially available from ARKRAY, Inc.) was used as a hemolysis/washing liquid.
- the compositions and pHs of 80A, 80B, 80CV, and 80H were as shown in Table 1 below.
- ADAMS HA-8180T (commercially available from ARKRAY, Inc.) was used.
- a Column Unit 80T (commercially available from ARKRAY, Inc.), which is a column packed with 0.45 ml of a hydrophilic polymer containing a methacrylate copolymer as a packing, was used.
- 80A as Eluent A
- 80B as Eluent B
- 80CT commercially available from ARKRAY, Inc.
- Eluent C were used for eluting hemoglobin from the column
- 80H was used as a hemolysis/washing liquid.
- the compositions and pHs of 80A, 80B, 80CT, and 80H were as shown in Table 1 below.
- ADAMS HA-8190V (commercially available from ARKRAY, Inc.) was used.
- a Column Unit 90 (commercially available from ARKRAY, Inc.), which is a column packed with 0.25 ml of a hydrophilic polymer containing a methacrylate copolymer as a packing, was used.
- 90A (commercially available from ARKRAY, Inc.) as Eluent A
- 90B (commercially available from ARKRAY, Inc.) as Eluent B
- 90CV (commercially available from ARKRAY, Inc.) as Eluent C
- 90H (commercially available from ARKRAY, Inc.) was used as a hemolysis/washing liquid.
- the compositions and pHs of 90A, 90B, 90CV, and 90H were as shown in Table 1 below.
- Eluent A had the lowest strength
- Eluent B had the highest strength among Eluents A to C.
- Eluent A was passed through the column to elute HbF and HbA1c, and then Eluent B was passed through the column to completely elute the remaining hemoglobin.
- Eluent A was passed through the column to elute HbF and HbA1c, and then Eluent C was passed through the column to elute HbS, HbC, HbE, and HbD, followed by passing Eluent B through the column to completely elute the remaining hemoglobin.
- the HbF peak value was measured for 51 whole blood samples.
- Fig. 6 shows an example of the measurement using Apparatus 1 by the first mode
- Fig. 7 shows an example of the measurement using Apparatus 1 by the second mode
- Fig. 8 shows an example of the measurement using Apparatus 2
- Fig. 9 shows an example of the measurement using Apparatus 3 by the first mode
- Fig. 10 shows an example of the measurement using Apparatus 3 by the second mode. It was shown that the HbF peak 20, and the composite peak 10 of the HbA1a peak and the HbA1b peak, can be separated from each other by any of the apparatuses.
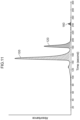
- Fig. 11 shows an example of the measurement using the capillary electrophoresis apparatus.
- the ratio of the HbF peak 120 to the total of the hemoglobin peaks in the analysis chart of Fig. 11 was found to be clearly higher than the ratio of the HbF peak 20 to the total of the hemoglobin peaks analyzed using each liquid chromatography apparatus.
- Fig. 12 is a graph illustrating a correlation between the HbF peak value obtained by the measurement using each liquid chromatography apparatus and the HbF peak value obtained by the measurement using the capillary electrophoresis apparatus, wherein the measurement was carried out for the same sample.
- the abscissa of the graph represents the HbF peak value obtained by the capillary electrophoresis apparatus
- the ordinate of the graph represents the HbF peak value obtained by the liquid chromatography apparatus.
- Table 2 shows the ratio of the HbF peak value obtained by the capillary electrophoresis apparatus to the HbF peak value obtained by each liquid chromatography apparatus. It was found that the HbF peak value obtained by the capillary electrophoresis apparatus is 1.18 to 1.23 times the HbF peak value obtained by each liquid chromatography apparatus.
- the invention is applicable to measurement of HbF in a blood sample using liquid chromatography.
Landscapes
- Health & Medical Sciences (AREA)
- Life Sciences & Earth Sciences (AREA)
- Engineering & Computer Science (AREA)
- Chemical & Material Sciences (AREA)
- Biomedical Technology (AREA)
- Physics & Mathematics (AREA)
- Immunology (AREA)
- Hematology (AREA)
- Analytical Chemistry (AREA)
- General Physics & Mathematics (AREA)
- General Health & Medical Sciences (AREA)
- Pathology (AREA)
- Biochemistry (AREA)
- Urology & Nephrology (AREA)
- Molecular Biology (AREA)
- Food Science & Technology (AREA)
- Medicinal Chemistry (AREA)
- Ecology (AREA)
- Biophysics (AREA)
- Biotechnology (AREA)
- Cell Biology (AREA)
- Microbiology (AREA)
- Library & Information Science (AREA)
- Investigating Or Analysing Biological Materials (AREA)
Abstract
Description
- The present invention relates to a method of measuring hemoglobin F in a blood sample.
- Hemoglobin in blood samples can be measured by separation/fractionation methods such as high-performance liquid chromatography or capillary electrophoresis. Since a measured value of hemoglobin F (HbF), which is a type of hemoglobin, can be used as a basis for diagnosis of hemoglobinopathy and thalassemia, the value needs to be highly accurate. Measurement of HbF is often carried out by capillary electrophoresis, and a measured value of HbF obtained by measurement by capillary electrophoresis is often used as a basis for diagnosis. Examples of a method of measuring hemoglobin F using liquid chromatography include the method disclosed in Japanese Patent Application Laid-Open (
JP-A) No. 2014-235023 - The component peaks found in a chromatogram of hemoglobin obtained by liquid chromatography show almost the same ratios as those of the component peaks found in an analysis chart of hemoglobin obtained by capillary electrophoresis, and only the HbF peak presents a difference. More specifically, the ratio of the HbF peak in liquid chromatography is lower than the ratio of the HbF peak in capillary electrophoresis.
- In view of this, an aspect of the present disclosure provides a technique that enables a more accurate measurement of HbF from a chromatogram obtained by subjecting a blood sample to liquid chromatography.
- In one aspect of the method of measuring HbF of the disclosure, from a chromatogram obtained by subjecting a blood sample to liquid chromatography, the ratio of the HbF peak to the entire hemoglobin peak is calculated, and the ratio is multiplied by a predetermined factor, to calculate a corrected value of the HbF peak with respect to the entire hemoglobin peak.
- According to an aspect of the invention, HbF can be more accurately measured from a chromatograph obtained by subjecting a blood sample to liquid chromatography.
- Exemplary embodiments will be described in detail based on the following figures, wherein:
-
Fig. 1 schematically shows an example of a chromatograph of hemoglobin obtained by subjecting a blood sample to high-performance liquid chromatography; -
Fig. 2 schematically shows a relationship between an HbF peak and a composite peak in a normal sample; -
Fig. 3 schematically shows a relationship between an HbF peak and a composite peak in a high-HbF sample; -
Fig. 4 schematically shows an analysis chart of hemoglobin obtained by subjecting a normal sample to capillary electrophoresis; -
Fig. 5 schematically shows an analysis chart of hemoglobin obtained by subjecting a high-HbF sample to capillary electrophoresis; -
Fig. 6 is an example of a chromatogram obtained using an Apparatus 1 by a first mode; -
Fig. 7 is an example of a chromatogram obtained using an Apparatus 1 by a second mode; -
Fig. 8 is an example of a chromatogram of a blood sample, obtained using an Apparatus 2; -
Fig. 9 is an example of a chromatogram of a blood sample, obtained using an Apparatus 3 by a first mode; -
Fig. 10 is an example of a chromatogram of a blood sample, obtained using an Apparatus 3 by a second mode; -
Fig. 11 is an example of an analysis chart of a blood sample, obtained using a capillary electrophoresis apparatus; and -
Fig. 12 is a graph illustrating a correlation between an HbF peak value obtained by liquid chromatography, and an HbF peak value obtained by capillary electrophoresis. - Embodiments in the disclosure are described below with reference to drawings.
- The symbols shared among the diagrams represent identical portions even without any description. The "peak value" in the disclosure means the height or area of each peak found in a chromatogram, and the value may be either a relative value or an absolute value. The relative value may be the ratio to the total area of the chromatogram, may be the ratio to the total area of the peaks related to hemoglobin in the chromatogram, or may be the ratio to the area of a specific peak (such as an HbA0 peak).
- When a blood sample is subjected to liquid chromatography, a chromatograph of hemoglobin such as the one schematically represented in
Fig. 1 can be obtained. In this chromatograph, acomposite peak 10 including anHbA1a peak 11 and an HbA1b peak 12 (seeFig. 2 and Fig. 3 ), anHbF peak 20, anunstable HbA1c peak 30, anHbA1c peak 40, anHbA0 peak 50, and an HbA2 peak 60 (seeFig. 8 ) appear in the order of increasing rate of elution from the column. -
Fig. 2 schematically shows a chromatograph of a normal blood sample having an HbF peak value of less than 1%, andFig. 3 schematically shows a chromatograph of a blood sample of a high-HbF patient. As can be seen by comparison between these figures, which show HbA1c peaks 30 of almost the same size, theHbF peak 20 in the chromatograph ofFig. 3 is higher than theHbF peak 20 in the chromatograph ofFig. 2 . In this case, thecomposite peak 10 in the chromatograph ofFig. 3 is also higher than thecomposite peak 10 in the chromatograph ofFig. 2 . - Here, as shown in
Fig. 2 , thecomposite peak 10 includes anHbA1a peak 11 and anHbA1b peak 12 of HbA1, which is a glycosylated product of HbA. As shown inFig. 3 , an increase in theHbF peak 20 results in an increase in thecomposite peak 10. Since thecomposite peak 10 includes theHbA1a peak 11 and theHbA1b peak 12, which are glycosylated products, the increase in thecomposite peak 10 is thought to be due to an increase in a modified-HbF peak 13, which is a modified product of HbF, as shown inFig. 3 . In contrast, the normal sample shown inFig. 2 hardly includes the modified-HbF peak 13, and most part of thecomposite peak 10 is thought to be formed by theHbA1a peak 11 and theHbA1b peak 12. -
Fig. 4 schematically shows an analysis chart obtained by subjecting a normal blood sample having an HbF peak value of less than 1% to capillary electrophoresis, andFig. 5 schematically shows an analysis chart obtained by subjecting a blood sample of a high-HbF patient to capillary electrophoresis. As shown in these figures, anHbA peak 100, anHbF peak 120, and anHbA2 peak 160 appear in this order in the analysis chart. As can be seen by comparison between these figures, theHbF peak 120 in the chromatograph ofFig. 5 is higher than theHbF peak 120 in the chromatograph ofFig. 4 . However, the sizes of theHbA peak 100 and theHbA2 peak 160 inFig. 4 are almost the same as the sizes of theHbA peak 100 and theHbA2 peak 160 inFig. 5 . It can thus be assumed that theHbF peak 120 in capillary electrophoresis also includes a modified-HbF peak value. - In view of the above observation, in one aspect of the method of measuring HbF of the disclosure, from a chromatogram obtained by subjecting a blood sample to liquid chromatography, the ratio of the hemoglobin F peak to the entire hemoglobin peak is calculated, and the ratio is multiplied by a predetermined factor, to calculate a corrected value of the hemoglobin F peak with respect to the entire hemoglobin peak. More specifically, the predetermined factor is from 1.15 to less than 1.25. The more preferable predetermined factor is 1.2. The calculation of the corrected value is not limited as long as the ratio of the hemoglobin F peak to the entire hemoglobin peak is multiplied by the predetermined factor as a result. For example, by determining a corrected value by multiplying a peak value of hemoglobin F by a predetermined factor, and calculating the ratio of the corrected value to the peak value of the entire hemoglobin peak, the corrected value of the hemoglobin F peak with respect to the entire hemoglobin peak can be calculated.
- As liquid chromatography apparatuses, cation-exchange chromatography apparatuses of the following Apparatus 1, Apparatus 2, Apparatus 3, and Apparatus 4 were used.
- As Apparatus 1, ADAMS HA-8180V (commercially available from ARKRAY, Inc.) was used. For Apparatus 1, a Column Unit 80 (commercially available from ARKRAY, Inc.), which is a column packed with 0.35 ml of a hydrophilic polymer containing a methacrylate copolymer as a packing, was used. As reagents, 80A (commercially available from ARKRAY, Inc.) as Eluent A, 80B (commercially available from ARKRAY, Inc.) as Eluent B, and 80CV (commercially available from ARKRAY, Inc.) as Eluent C were used for eluting hemoglobin from the column, and 80H (commercially available from ARKRAY, Inc.) was used as a hemolysis/washing liquid. The compositions and pHs of 80A, 80B, 80CV, and 80H were as shown in Table 1 below. These reagents were passed though the column at a flow rate of 1.7 ml/min.
- As Apparatus 2, ADAMS HA-8180T (commercially available from ARKRAY, Inc.) was used. For Apparatus 2, a Column Unit 80T (commercially available from ARKRAY, Inc.), which is a column packed with 0.45 ml of a hydrophilic polymer containing a methacrylate copolymer as a packing, was used. As reagents, 80A as Eluent A, 80B as Eluent B, and 80CT (commercially available from ARKRAY, Inc.) as Eluent C were used for eluting hemoglobin from the column, and 80H was used as a hemolysis/washing liquid. The compositions and pHs of 80A, 80B, 80CT, and 80H were as shown in Table 1 below. These reagents were passed though the column at a flow rate of 1.7 ml/min.
- As Apparatus 3, ADAMS HA-8190V (commercially available from ARKRAY, Inc.) was used. For Apparatus 3, a Column Unit 90 (commercially available from ARKRAY, Inc.), which is a column packed with 0.25 ml of a hydrophilic polymer containing a methacrylate copolymer as a packing, was used. As reagents, 90A (commercially available from ARKRAY, Inc.) as Eluent A, 90B (commercially available from ARKRAY, Inc.) as Eluent B, and 90CV (commercially available from ARKRAY, Inc.) as Eluent C were used for eluting hemoglobin from the column, and 90H (commercially available from ARKRAY, Inc.) was used as a hemolysis/washing liquid. The compositions and pHs of 90A, 90B, 90CV, and 90H were as shown in Table 1 below. These reagents were passed though the column at a flow rate of 4.0 ml/min.
[Table 1] Reagent Name Composition pH Eluent A 80A Phosphate buffer 5.35 ± 0.05 90A Phosphate buffer 5.35 ± 0.15 Eluent B 80B Phosphate buffer 8.05 ± 0.20 90B Phosphate buffer 8.05 ± 0.25 Eluent C 80CV Phosphate buffer 6.9 to 7.2 80CT Phosphate buffer 7.0 to 7.4 90CV Phosphate buffer 7.05 ± 0.25 Hemolysis / washing liquid 80H Phosphate buffer containing a surfactant 7.5 ± 0.1 90H Phosphate buffer containing a surfactant 7.5 ± 0.2 - Regarding the elution strength for hemoglobin, Eluent A had the lowest strength, and Eluent B had the highest strength among Eluents A to C.
- Measurement of HbF using Apparatus 1, Apparatus 2, and Apparatus 3 was carried out according to a document accompanying the apparatus provided by ARKRAY, Inc. For each of Apparatus 1 and Apparatus 3, the measurement was carried out by both the first mode and the second mode described below.
- Eluent A was passed through the column to elute HbF and HbA1c, and then Eluent B was passed through the column to completely elute the remaining hemoglobin.
- Eluent A was passed through the column to elute HbF and HbA1c, and then Eluent C was passed through the column to elute HbS, HbC, HbE, and HbD, followed by passing Eluent B through the column to completely elute the remaining hemoglobin.
- As a capillary electrophoresis apparatus, Capillarys 2 Flexpiercing (Sebia) was used.
- The measurement of HbF using the capillary electrophoresis apparatus was carried out according to a document accompanying the apparatus provided by Sebia.
- Using Apparatus 1 to Apparatus 3, and the capillary electrophoresis apparatus, the HbF peak value was measured for 51 whole blood samples.
- Regarding the liquid chromatography apparatuses,
Fig. 6 shows an example of the measurement using Apparatus 1 by the first mode;Fig. 7 shows an example of the measurement using Apparatus 1 by the second mode;Fig. 8 shows an example of the measurement using Apparatus 2;Fig. 9 shows an example of the measurement using Apparatus 3 by the first mode; andFig. 10 shows an example of the measurement using Apparatus 3 by the second mode. It was shown that theHbF peak 20, and thecomposite peak 10 of the HbA1a peak and the HbA1b peak, can be separated from each other by any of the apparatuses. -
Fig. 11 shows an example of the measurement using the capillary electrophoresis apparatus. The ratio of theHbF peak 120 to the total of the hemoglobin peaks in the analysis chart ofFig. 11 was found to be clearly higher than the ratio of theHbF peak 20 to the total of the hemoglobin peaks analyzed using each liquid chromatography apparatus. -
Fig. 12 is a graph illustrating a correlation between the HbF peak value obtained by the measurement using each liquid chromatography apparatus and the HbF peak value obtained by the measurement using the capillary electrophoresis apparatus, wherein the measurement was carried out for the same sample. The abscissa of the graph represents the HbF peak value obtained by the capillary electrophoresis apparatus, and the ordinate of the graph represents the HbF peak value obtained by the liquid chromatography apparatus. The dotted line in the graph is the line of
y = x wherein x is the abscissa, and y is the ordinate. From this graph, it was found that the HbF peak value obtained by the capillary electrophoresis apparatus was higher than the HbF peak value obtained by each liquid chromatography apparatus. - Table 2 below shows the ratio of the HbF peak value obtained by the capillary electrophoresis apparatus to the HbF peak value obtained by each liquid chromatography apparatus. It was found that the HbF peak value obtained by the capillary electrophoresis apparatus is 1.18 to 1.23 times the HbF peak value obtained by each liquid chromatography apparatus.
[Table 2] Apparatus Mode Ratio Apparatus 1 First mode 1.20 Second mode 1.19 Apparatus 2 - 1.18 Apparatus 3 First mode 1.18 Second mode 1.23 - Thus, it was shown that, by multiplying an HbF peak value obtained by a liquid chromatography apparatus by a factor from 1.15 to less than 1.25, preferably a factor from 1.18 to 1.23, more preferably a factor of 1.2, a more accurate HbF peak value can be measured similarly to a case where the value is obtained by a capillary electrophoresis apparatus.
- The invention is applicable to measurement of HbF in a blood sample using liquid chromatography.
Claims (4)
- A method of measuring hemoglobin F, the method comprising:calculating, from a chromatogram obtained by subjecting a blood sample to liquid chromatography, a ratio of a peak value of a hemoglobin F peak (20) to a peak value of an entire hemoglobin peak; andcalculating a corrected value of the hemoglobin F peak (20) with respect to the entire hemoglobin peak by multiplying the ratio by a predetermined factor.
- The method of measuring hemoglobin F according to claim 1, wherein the factor is from 1.15 to less than 1.25.
- The method of measuring hemoglobin F according to claim 2, wherein the factor is 1.2.
- The method of measuring hemoglobin F according to any one of claim 1 to claim 3, wherein the liquid chromatography is cation-exchange chromatography.
Applications Claiming Priority (1)
| Application Number | Priority Date | Filing Date | Title |
|---|---|---|---|
| JP2022045898A JP7813619B2 (en) | 2022-03-22 | 2022-03-22 | Hemoglobin F measurement method |
Publications (3)
| Publication Number | Publication Date |
|---|---|
| EP4249906A1 true EP4249906A1 (en) | 2023-09-27 |
| EP4249906B1 EP4249906B1 (en) | 2025-12-31 |
| EP4249906C0 EP4249906C0 (en) | 2025-12-31 |
Family
ID=85724913
Family Applications (1)
| Application Number | Title | Priority Date | Filing Date |
|---|---|---|---|
| EP23162854.6A Active EP4249906B1 (en) | 2022-03-22 | 2023-03-20 | METHOD FOR MEASURING HEMOGLOBIN F |
Country Status (4)
| Country | Link |
|---|---|
| US (1) | US20230304990A1 (en) |
| EP (1) | EP4249906B1 (en) |
| JP (1) | JP7813619B2 (en) |
| CN (1) | CN116794208A (en) |
Citations (2)
| Publication number | Priority date | Publication date | Assignee | Title |
|---|---|---|---|---|
| JP2014235023A (en) | 2013-05-31 | 2014-12-15 | 東ソー株式会社 | Quantifying method of hemoglobin f using liquid chromatography |
| JP2019060653A (en) * | 2017-09-25 | 2019-04-18 | アークレイ株式会社 | Method, system, device, and computer program for determining possibility of blood transfusion syndrome affection between unborn child and matrix in pregnant woman |
Family Cites Families (2)
| Publication number | Priority date | Publication date | Assignee | Title |
|---|---|---|---|---|
| JP2009186445A (en) | 2008-02-08 | 2009-08-20 | Arkray Inc | Method of analyzing hemoglobin by capillary electrophoresis, and reagent used for it |
| JP7384752B2 (en) | 2019-06-21 | 2023-11-21 | アークレイ株式会社 | Separation and analysis method of sample components |
-
2022
- 2022-03-22 JP JP2022045898A patent/JP7813619B2/en active Active
-
2023
- 2023-03-16 CN CN202310253435.6A patent/CN116794208A/en active Pending
- 2023-03-20 EP EP23162854.6A patent/EP4249906B1/en active Active
- 2023-03-20 US US18/123,480 patent/US20230304990A1/en active Pending
Patent Citations (2)
| Publication number | Priority date | Publication date | Assignee | Title |
|---|---|---|---|---|
| JP2014235023A (en) | 2013-05-31 | 2014-12-15 | 東ソー株式会社 | Quantifying method of hemoglobin f using liquid chromatography |
| JP2019060653A (en) * | 2017-09-25 | 2019-04-18 | アークレイ株式会社 | Method, system, device, and computer program for determining possibility of blood transfusion syndrome affection between unborn child and matrix in pregnant woman |
Non-Patent Citations (1)
| Title |
|---|
| KOSKINEN L ET AL: "Determination of fetal hemoglobin by cation exchange liquid chromatography", CLINICA CHIMICA ACTA, ELSEVIER BV, AMSTERDAM, NL, vol. 206, no. 3, 31 March 1992 (1992-03-31), pages 215 - 223, XP024785180, ISSN: 0009-8981, [retrieved on 19920331], DOI: 10.1016/0009-8981(92)90091-4 * |
Also Published As
| Publication number | Publication date |
|---|---|
| CN116794208A (en) | 2023-09-22 |
| JP7813619B2 (en) | 2026-02-13 |
| US20230304990A1 (en) | 2023-09-28 |
| EP4249906B1 (en) | 2025-12-31 |
| EP4249906C0 (en) | 2025-12-31 |
| JP2023140055A (en) | 2023-10-04 |
Similar Documents
| Publication | Publication Date | Title |
|---|---|---|
| EP2447712B1 (en) | One-point calibration method for measurement of hemoglobin A1c | |
| JP7081385B2 (en) | How to calculate the similarity of chromatograms | |
| CN109073616B (en) | Method for measuring glycated hemoglobin and glycated hemoglobin measurement apparatus | |
| Rhemrev-Boom | Determination of anions with capillary electrophoresis and indirect ultraviolet detection | |
| JP3496390B2 (en) | Data processing method for glycated hemoglobin measuring device using liquid chromatography | |
| JP2001159625A (en) | Method for separating hemoglobin A2 | |
| Novotny | Capillary biomolecular separations | |
| EP3751279B1 (en) | Methods for optimizing buffer conditions with liquid chromatography | |
| US20230304990A1 (en) | Method of measuring hemoglobin f | |
| EP4249905B1 (en) | Method of measuring hemoglobin f | |
| JP2017187319A (en) | Background correction method by section division | |
| Adamovics | Determination of antibiotics and antimicrobial agents in human serum by direct injection onto silica liquid chromatographic columns | |
| HIRAOKA et al. | Capillary-zone electrophoretic analyses of the proteins and amino acid components in cerebrospinal fluid of central nervous system diseases | |
| JP2001194355A (en) | Column washing solution | |
| JP7639447B2 (en) | Peak separation method and apparatus | |
| JPH04366762A (en) | Device and method for analysis using liquid chromatography | |
| Francina et al. | Chromatofocusing of human hemoglobins: application to the quantitation of hemoglobin A2 | |
| JP2002082105A (en) | Filler for liquid chromatography, column, and method for measuring hemoglobins using the same | |
| Choudhary et al. | Integrated approach to the multidimensional analysis of complex biological samples by microseparation techniques: Analysis of glycoprotein factor associated with cancer cachexia | |
| WO2018189871A1 (en) | Sample analysis method using liquid chromatography–mass spectrometry | |
| Sidén et al. | Broad pH-gradient chromatofocusing | |
| Cooper et al. | Automated sequential trace enrichment of dialysates combined with high-performance liquid chromatography and automated heart-cutting for the determination of the nucleoside 1-(β-d-arabinofuranosyl)-5-(1-propynyl) uracil and its metabolite 5-propynyluracil in urine | |
| EP4722712A1 (en) | Method for analyzing hemoglobin and system for analyzing hemoglobin | |
| JP2000146941A (en) | Method for measuring hemoglobins | |
| EP4343323A1 (en) | Hemoglobin a1c measurement method, hemoglobin analyzer, and non-transitory computer-readable recording medium |
Legal Events
| Date | Code | Title | Description |
|---|---|---|---|
| PUAI | Public reference made under article 153(3) epc to a published international application that has entered the european phase |
Free format text: ORIGINAL CODE: 0009012 |
|
| STAA | Information on the status of an ep patent application or granted ep patent |
Free format text: STATUS: THE APPLICATION HAS BEEN PUBLISHED |
|
| AK | Designated contracting states |
Kind code of ref document: A1 Designated state(s): AL AT BE BG CH CY CZ DE DK EE ES FI FR GB GR HR HU IE IS IT LI LT LU LV MC ME MK MT NL NO PL PT RO RS SE SI SK SM TR |
|
| STAA | Information on the status of an ep patent application or granted ep patent |
Free format text: STATUS: REQUEST FOR EXAMINATION WAS MADE |
|
| 17P | Request for examination filed |
Effective date: 20240322 |
|
| RBV | Designated contracting states (corrected) |
Designated state(s): AL AT BE BG CH CY CZ DE DK EE ES FI FR GB GR HR HU IE IS IT LI LT LU LV MC ME MK MT NL NO PL PT RO RS SE SI SK SM TR |
|
| GRAP | Despatch of communication of intention to grant a patent |
Free format text: ORIGINAL CODE: EPIDOSNIGR1 |
|
| STAA | Information on the status of an ep patent application or granted ep patent |
Free format text: STATUS: GRANT OF PATENT IS INTENDED |
|
| RIC1 | Information provided on ipc code assigned before grant |
Ipc: G01N 30/86 20060101AFI20250709BHEP Ipc: G01N 30/88 20060101ALI20250709BHEP Ipc: G01N 33/49 20060101ALI20250709BHEP Ipc: G01N 33/72 20060101ALI20250709BHEP |
|
| INTG | Intention to grant announced |
Effective date: 20250801 |
|
| GRAS | Grant fee paid |
Free format text: ORIGINAL CODE: EPIDOSNIGR3 |
|
| GRAA | (expected) grant |
Free format text: ORIGINAL CODE: 0009210 |
|
| STAA | Information on the status of an ep patent application or granted ep patent |
Free format text: STATUS: THE PATENT HAS BEEN GRANTED |
|
| AK | Designated contracting states |
Kind code of ref document: B1 Designated state(s): AL AT BE BG CH CY CZ DE DK EE ES FI FR GB GR HR HU IE IS IT LI LT LU LV MC ME MK MT NL NO PL PT RO RS SE SI SK SM TR |
|
| REG | Reference to a national code |
Ref country code: CH Ref legal event code: F10 Free format text: ST27 STATUS EVENT CODE: U-0-0-F10-F00 (AS PROVIDED BY THE NATIONAL OFFICE) Effective date: 20251231 Ref country code: GB Ref legal event code: FG4D |
|
| REG | Reference to a national code |
Ref country code: DE Ref legal event code: R096 Ref document number: 602023010242 Country of ref document: DE |
|
| REG | Reference to a national code |
Ref country code: IE Ref legal event code: FG4D |
|
| U01 | Request for unitary effect filed |
Effective date: 20251231 |
|
| U07 | Unitary effect registered |
Designated state(s): AT BE BG DE DK EE FI FR IT LT LU LV MT NL PT RO SE SI Effective date: 20260107 |
|
| PG25 | Lapsed in a contracting state [announced via postgrant information from national office to epo] |
Ref country code: NO Free format text: LAPSE BECAUSE OF FAILURE TO SUBMIT A TRANSLATION OF THE DESCRIPTION OR TO PAY THE FEE WITHIN THE PRESCRIBED TIME-LIMIT Effective date: 20260331 |
|
| PG25 | Lapsed in a contracting state [announced via postgrant information from national office to epo] |
Ref country code: HR Free format text: LAPSE BECAUSE OF FAILURE TO SUBMIT A TRANSLATION OF THE DESCRIPTION OR TO PAY THE FEE WITHIN THE PRESCRIBED TIME-LIMIT Effective date: 20251231 |
|
| PG25 | Lapsed in a contracting state [announced via postgrant information from national office to epo] |
Ref country code: RS Free format text: LAPSE BECAUSE OF FAILURE TO SUBMIT A TRANSLATION OF THE DESCRIPTION OR TO PAY THE FEE WITHIN THE PRESCRIBED TIME-LIMIT Effective date: 20260331 |
|
| U20 | Renewal fee for the european patent with unitary effect paid |
Year of fee payment: 4 Effective date: 20260326 |