EP4218599A1 - Information processing device, information processing method, program, and model generation method - Google Patents
Information processing device, information processing method, program, and model generation method Download PDFInfo
- Publication number
- EP4218599A1 EP4218599A1 EP21875483.6A EP21875483A EP4218599A1 EP 4218599 A1 EP4218599 A1 EP 4218599A1 EP 21875483 A EP21875483 A EP 21875483A EP 4218599 A1 EP4218599 A1 EP 4218599A1
- Authority
- EP
- European Patent Office
- Prior art keywords
- region
- blood vessel
- plaque burden
- regions
- plaque
- Prior art date
- Legal status (The legal status is an assumption and is not a legal conclusion. Google has not performed a legal analysis and makes no representation as to the accuracy of the status listed.)
- Pending
Links
Images









Classifications
-
- G—PHYSICS
- G06—COMPUTING OR CALCULATING; COUNTING
- G06T—IMAGE DATA PROCESSING OR GENERATION, IN GENERAL
- G06T7/00—Image analysis
- G06T7/0002—Inspection of images, e.g. flaw detection
- G06T7/0012—Biomedical image inspection
-
- A—HUMAN NECESSITIES
- A61—MEDICAL OR VETERINARY SCIENCE; HYGIENE
- A61B—DIAGNOSIS; SURGERY; IDENTIFICATION
- A61B8/00—Diagnosis using ultrasonic, sonic or infrasonic waves
- A61B8/08—Clinical applications
- A61B8/0833—Clinical applications involving detecting or locating foreign bodies or organic structures
- A61B8/085—Clinical applications involving detecting or locating foreign bodies or organic structures for locating body or organic structures, e.g. tumours, calculi, blood vessels, nodules
-
- A—HUMAN NECESSITIES
- A61—MEDICAL OR VETERINARY SCIENCE; HYGIENE
- A61B—DIAGNOSIS; SURGERY; IDENTIFICATION
- A61B8/00—Diagnosis using ultrasonic, sonic or infrasonic waves
- A61B8/08—Clinical applications
- A61B8/0891—Clinical applications for diagnosis of blood vessels
-
- A—HUMAN NECESSITIES
- A61—MEDICAL OR VETERINARY SCIENCE; HYGIENE
- A61B—DIAGNOSIS; SURGERY; IDENTIFICATION
- A61B8/00—Diagnosis using ultrasonic, sonic or infrasonic waves
- A61B8/12—Diagnosis using ultrasonic, sonic or infrasonic waves in body cavities or body tracts, e.g. by using catheters
-
- G—PHYSICS
- G06—COMPUTING OR CALCULATING; COUNTING
- G06T—IMAGE DATA PROCESSING OR GENERATION, IN GENERAL
- G06T7/00—Image analysis
- G06T7/10—Segmentation; Edge detection
- G06T7/11—Region-based segmentation
-
- G—PHYSICS
- G06—COMPUTING OR CALCULATING; COUNTING
- G06T—IMAGE DATA PROCESSING OR GENERATION, IN GENERAL
- G06T7/00—Image analysis
- G06T7/10—Segmentation; Edge detection
- G06T7/174—Segmentation; Edge detection involving the use of two or more images
-
- A—HUMAN NECESSITIES
- A61—MEDICAL OR VETERINARY SCIENCE; HYGIENE
- A61B—DIAGNOSIS; SURGERY; IDENTIFICATION
- A61B6/00—Apparatus or devices for radiation diagnosis; Apparatus or devices for radiation diagnosis combined with radiation therapy equipment
- A61B6/02—Arrangements for diagnosis sequentially in different planes; Stereoscopic radiation diagnosis
- A61B6/03—Computed tomography [CT]
- A61B6/032—Transmission computed tomography [CT]
-
- A—HUMAN NECESSITIES
- A61—MEDICAL OR VETERINARY SCIENCE; HYGIENE
- A61B—DIAGNOSIS; SURGERY; IDENTIFICATION
- A61B6/00—Apparatus or devices for radiation diagnosis; Apparatus or devices for radiation diagnosis combined with radiation therapy equipment
- A61B6/50—Apparatus or devices for radiation diagnosis; Apparatus or devices for radiation diagnosis combined with radiation therapy equipment specially adapted for specific body parts; specially adapted for specific clinical applications
- A61B6/504—Apparatus or devices for radiation diagnosis; Apparatus or devices for radiation diagnosis combined with radiation therapy equipment specially adapted for specific body parts; specially adapted for specific clinical applications for diagnosis of blood vessels, e.g. by angiography
-
- G—PHYSICS
- G06—COMPUTING OR CALCULATING; COUNTING
- G06T—IMAGE DATA PROCESSING OR GENERATION, IN GENERAL
- G06T2200/00—Indexing scheme for image data processing or generation, in general
- G06T2200/24—Indexing scheme for image data processing or generation, in general involving graphical user interfaces [GUIs]
-
- G—PHYSICS
- G06—COMPUTING OR CALCULATING; COUNTING
- G06T—IMAGE DATA PROCESSING OR GENERATION, IN GENERAL
- G06T2207/00—Indexing scheme for image analysis or image enhancement
- G06T2207/10—Image acquisition modality
- G06T2207/10068—Endoscopic image
-
- G—PHYSICS
- G06—COMPUTING OR CALCULATING; COUNTING
- G06T—IMAGE DATA PROCESSING OR GENERATION, IN GENERAL
- G06T2207/00—Indexing scheme for image analysis or image enhancement
- G06T2207/10—Image acquisition modality
- G06T2207/10072—Tomographic images
-
- G—PHYSICS
- G06—COMPUTING OR CALCULATING; COUNTING
- G06T—IMAGE DATA PROCESSING OR GENERATION, IN GENERAL
- G06T2207/00—Indexing scheme for image analysis or image enhancement
- G06T2207/20—Special algorithmic details
- G06T2207/20076—Probabilistic image processing
-
- G—PHYSICS
- G06—COMPUTING OR CALCULATING; COUNTING
- G06T—IMAGE DATA PROCESSING OR GENERATION, IN GENERAL
- G06T2207/00—Indexing scheme for image analysis or image enhancement
- G06T2207/20—Special algorithmic details
- G06T2207/20081—Training; Learning
-
- G—PHYSICS
- G06—COMPUTING OR CALCULATING; COUNTING
- G06T—IMAGE DATA PROCESSING OR GENERATION, IN GENERAL
- G06T2207/00—Indexing scheme for image analysis or image enhancement
- G06T2207/20—Special algorithmic details
- G06T2207/20084—Artificial neural networks [ANN]
-
- G—PHYSICS
- G06—COMPUTING OR CALCULATING; COUNTING
- G06T—IMAGE DATA PROCESSING OR GENERATION, IN GENERAL
- G06T2207/00—Indexing scheme for image analysis or image enhancement
- G06T2207/20—Special algorithmic details
- G06T2207/20092—Interactive image processing based on input by user
- G06T2207/20104—Interactive definition of region of interest [ROI]
-
- G—PHYSICS
- G06—COMPUTING OR CALCULATING; COUNTING
- G06T—IMAGE DATA PROCESSING OR GENERATION, IN GENERAL
- G06T2207/00—Indexing scheme for image analysis or image enhancement
- G06T2207/30—Subject of image; Context of image processing
- G06T2207/30004—Biomedical image processing
- G06T2207/30096—Tumor; Lesion
-
- G—PHYSICS
- G06—COMPUTING OR CALCULATING; COUNTING
- G06T—IMAGE DATA PROCESSING OR GENERATION, IN GENERAL
- G06T2207/00—Indexing scheme for image analysis or image enhancement
- G06T2207/30—Subject of image; Context of image processing
- G06T2207/30004—Biomedical image processing
- G06T2207/30101—Blood vessel; Artery; Vein; Vascular
Definitions
- the diagnostic imaging device 2 displays the stent region 7 having a length equal to or longer than the lesion length measured above such that both ends of the stent region 7 are located in the second regions HP1 and HD1 determined as the regions where both ends should be located.
- the diagnostic imaging device 2 stores, in the auxiliary storage unit 27, information on stent products in predetermined length increments (for example, 9 mm, 12 mm, 15 mm ...) that can be used for a procedure.
- the diagnostic imaging device 2 selects a stent that exceeds the lesion length and has the minimum length from among the stent products.
- the diagnostic imaging device 2 then superimposes and displays the stent region 7 having the length of the selected stent such that both ends thereof are located in the second regions HP1 and HD1.
- the selection of the stent, the determination of the superimposing position of the stent region 7, and the like may be performed by manual operation by the user.
- Fig. 11 is a flowchart depicting a procedure of plaque burden calculation processing. Processing details executed by the diagnostic imaging device 2 will be described with reference to Fig. 11 .
- the semantic segmentation model is a neural network that identifies an object in an image in units of pixels, and includes a convolutional layer (encoder) that convolves an input image and a deconvolutional layer (decoder) that maps a convoluted feature amount to the original image size.
- deconvolutional layer which object exists at which position in the image is identified based on the feature amount extracted in the convolutional layer, and data obtained by binarizing which object each pixel corresponds to is generated.
- Fig. 17 is an explanatory diagram related to generation processing of the calculation model 51 according to the second modification.
- Fig. 17 conceptually illustrates a state in which some network structures and parameters of the identification model 52 (semantic segmentation model) are applied to the calculation model 51 (CNN) to perform transfer learning.
- the description is provided assuming that the server 1 has generated the identification model 52.
Landscapes
- Engineering & Computer Science (AREA)
- Health & Medical Sciences (AREA)
- Life Sciences & Earth Sciences (AREA)
- Physics & Mathematics (AREA)
- Medical Informatics (AREA)
- General Health & Medical Sciences (AREA)
- Nuclear Medicine, Radiotherapy & Molecular Imaging (AREA)
- Radiology & Medical Imaging (AREA)
- Theoretical Computer Science (AREA)
- General Physics & Mathematics (AREA)
- Computer Vision & Pattern Recognition (AREA)
- Molecular Biology (AREA)
- Veterinary Medicine (AREA)
- Public Health (AREA)
- Biophysics (AREA)
- Animal Behavior & Ethology (AREA)
- Surgery (AREA)
- Pathology (AREA)
- Biomedical Technology (AREA)
- Heart & Thoracic Surgery (AREA)
- Vascular Medicine (AREA)
- Quality & Reliability (AREA)
- Optics & Photonics (AREA)
- High Energy & Nuclear Physics (AREA)
- Oral & Maxillofacial Surgery (AREA)
- Dentistry (AREA)
- Apparatus For Radiation Diagnosis (AREA)
Abstract
Description
- The present invention relates to an information processing device, an information processing method, a program, and a model generation method.
- A technology has been used to support diagnostic imaging related to vascular treatment such as percutaneous coronary intervention (PCI). For example,
Patent Literature 1 discloses a medical image processing device for converting three-dimensional computer tomography (CT) data to a two-dimensional projection image, and the medical image processing device extracts a plaque region of a blood vessel from the three-dimensional CT data, calculates a stenosis rate of the blood vessel, and displays a projection image in which a color value of the plaque region is set according to the calculated stenosis rate or the like. - Patent Literature 1:
JP 2012-176282 A - The invention according to
Patent Literature 1, however, relates to rule-based extraction of a plaque region from the three-dimensional CT value, and does not always extract a plaque region with high accuracy to calculate a stenosis rate. Further, the invention according toPatent Literature 1 involves three-dimensional CT data and does not calculate a stenosis rate and the like based on two-dimensional data (image). - According to one aspect, an object of the present invention is to provide an information processing device and so on that are capable of supporting diagnostic imaging related to vascular treatment suitably.
- An information processing device according to one aspect includes an acquisition unit that is configured to acquire transverse tomographic images of a plurality of frames obtained by imaging a blood vessel of a patient, a calculation unit that is configured to calculate plaque burden at each position of the blood vessel along an axial direction of the blood vessel based on the transverse tomographic images of the plurality of frames, a division unit that is configured to divide a longitudinal cross section of the blood vessel into a first region in which the plaque burden is equal to or greater than a threshold and a second region in which the plaque burden is less than the threshold, and a determination unit that is configured to determine, in each of the regions obtained by the division, regions in which both ends of a treatment area of the blood vessel with a predetermined treatment device are to be located.
- According to one aspect, it is possible to suitably support diagnostic imaging related to vascular treatment.
-
-
Fig. 1 is an explanatory diagram illustrating a configuration example of a diagnostic imaging system. -
Fig. 2 is a block diagram illustrating a configuration example of a server. -
Fig. 3 is a block diagram illustrating a configuration example of a diagnostic imaging device. -
Fig. 4 is an explanatory diagram related to calculation processing of plaque burden. -
Fig. 5 is an explanatory diagram illustrating a display example of plaque burden. -
Fig. 6 is an explanatory diagram illustrating another display example of plaque burden. -
Fig. 7 is an explanatory diagram related to determination processing of a treatment area of a blood vessel. -
Fig. 8 is an explanatory diagram illustrating a display example of a lesion length. -
Fig. 9 is an explanatory diagram illustrating an example where a stent is superimposed. -
Fig. 10 is a flowchart depicting a procedure of generation processing of a calculation model. -
Fig. 11 is a flowchart depicting a procedure of plaque burden calculation processing. -
Fig. 12 is an explanatory diagram related to processing for identifying a lesion region according to a first modification. -
Fig. 13 is a block diagram illustrating a configuration example of a diagnostic imaging device according to a second embodiment. -
Fig. 14 is an explanatory diagram related to calculation processing of plaque burden according to the second embodiment. -
Fig. 15 is a flowchart depicting a procedure of generation processing of an identification model. -
Fig. 16 is a flowchart depicting a procedure of calculation processing of plaque burden according to the second embodiment. -
Fig. 17 is an explanatory diagram related to generation processing of a calculation model according to a second modification. -
Fig. 18 is a flowchart depicting a procedure of generation processing of a calculation model according to the second modification. - Hereinafter, the present invention will be described in detail with reference to the drawings illustrating embodiments thereof.
-
Fig. 1 is an explanatory diagram illustrating a configuration example of a diagnostic imaging system. In the present embodiment, description is provided of a diagnostic imaging system that calculates plaque burden based on a transverse tomographic image obtained by imaging a blood vessel of a patient and supports vascular treatment using a predetermined treatment device. Adiagnostic imaging device 2 includes aserver 1 and the diagnostic imaging device (information processing device) 2. The devices are communicably connected via a network N such as the Internet. - The
server 1 is a server computer capable of performing various types of information processing and transmitting and receiving information. Note that the device corresponding to theserver 1 may be a device such as a personal computer. Theserver 1 performs machine learning to learn predetermined training data, and functions as a generation device that generates a calculation model 51 (seeFig. 4 ) for calculating plaque burden using a blood vessel tomographic image of a patient as an input. - The plaque burden is an area ratio of a plaque to a transverse cross section of a blood vessel, and is a value obtained by dividing cross-sectional areas of the plaque and a tunica media by a blood vessel cross-sectional area (area of a region in external elastic membrane (EEM)) (see
Fig. 4 ). - The
diagnostic imaging device 2 is an imaging device that captures a medical image obtained by imaging a blood vessel of a patient, and is, for example, an intravascular ultrasound (IVUS) device that performs an ultrasound examination using acatheter 201. Thecatheter 201 is a medical instrument inserted into the blood vessel of the patient, and transmits an ultrasound signal from an ultrasound probe attached to a distal end of thecatheter 201 and receives a reflected wave. Thediagnostic imaging device 2 generates an ultrasound tomographic image based on the reflected wave received by thecatheter 201 and displays the ultrasound tomographic image. - Note that, in the present embodiment, the
diagnostic imaging device 2 is described as an IVUS device, but may be an optical imaging device using optical coherence tomography (OCT) and the like. In addition, the blood vessel tomographic image may be captured by a method other than IVUS or OCT. - Data of the
calculation model 51 generated by theserver 1 is installed in thediagnostic imaging device 2, and thediagnostic imaging device 2 inputs a blood vessel tomographic image captured using thecatheter 201 to thecalculation model 51 and calculates plaque burden. Thediagnostic imaging device 2 then presents the calculated plaque burden to a user (medical worker). In addition, thediagnostic imaging device 2 identifies a lesion region of the blood vessel based on the calculated plaque burden, and supports determination of an indwelling position at which a stent (treatment device) to be indwelled in the blood vessel is indwelled. - In the present embodiment, the
diagnostic imaging device 2 calculates the plaque burden using thecalculation model 51, but theserver 1 on a cloud may execute processing using thecalculation model 51. Alternatively, for example, a general-purpose computer connected to thediagnostic imaging device 2 may perform the processing. As described above, what executes the series of processes is not particularly limited. - Further, in the present embodiment, a stent is exemplified as the treatment device, but as described later, a balloon for expanding a blood vessel, a rotablator for scraping a stenotic lesion of a blood vessel, or the like may be used.
-
Fig. 2 is a block diagram illustrating a configuration example of theserver 1. Theserver 1 includes acontrol unit 11, amain storage unit 12, acommunication unit 13, and anauxiliary storage unit 14. - The
control unit 11 includes one or a plurality of arithmetic processing devices such as a central processing unit (CPU), a micro-processing unit (MPU), and a graphics processing unit (CPU), and performs various types of information processing, control processing, and the like by reading and executing a program P1 stored in theauxiliary storage unit 14. Themain storage unit 12 is a temporary storage area such as a static random access memory (SRAM), a dynamic random access memory (DRAM), or a flash memory, and temporarily stores data necessary for thecontrol unit 11 to execute arithmetic processing. Thecommunication unit 13 is a communication module for performing processing related to communication, and transmits and receives information to and from an external device. Theauxiliary storage unit 14 is a non-volatile storage area such as a large-capacity memory or a hard disk, and stores the program P1 necessary for thecontrol unit 11 to execute processing and other data. - Note that the
server 1 may be a multi-computer including a plurality of computers, or may be a virtual machine virtually configured by software. - Further, in the present embodiment, the
server 1 is not limited to have the above configuration, and may include, for example, an input unit that receives an operation input, a display unit that displays an image, and the like. Further, theserver 1 may include a reading unit that reads aportable storage medium 1a such as a compact disk (CD)-ROM and a digital versatile disc (DVD)-ROM, and may read the program P1 from theportable storage medium 1a to execute the program P1. Alternatively, theserver 1 may read the program P1 from asemiconductor memory 1b. -
Fig. 3 is a block diagram illustrating a configuration example of thediagnostic imaging device 2. Thediagnostic imaging device 2 includes acontrol unit 21, amain storage unit 22, acommunication unit 23, adisplay unit 24, aninput unit 25, animage processing unit 26, and anauxiliary storage unit 27. - The
control unit 21 is an arithmetic processing device such as one or a plurality of CPUs, MPUs, and GPUs, and performs various types of information processing, control processing, and the like by reading and executing a program P2 stored in theauxiliary storage unit 27. Themain storage unit 22 is a temporary storage area such as a RAM, and temporarily stores data necessary for thecontrol unit 21 to execute arithmetic processing. Thecommunication unit 23 is a communication module for performing processing related to communication, and transmits and receives information to and from an external device. Thedisplay unit 24 is a display screen such as a liquid crystal display, and displays an image. Theinput unit 25 is an operation interface such as a keyboard and a mouse, and receives an operation input from the user. Theimage processing unit 26 is an image processing module that processes signals transmitted and received via thecatheter 201 and generates a tomographic image. - The
auxiliary storage unit 27 is a non-volatile storage area such as a hard disk or a large-capacity memory, and stores the program P2 necessary for thecontrol unit 21 to execute processing and other data. Theauxiliary storage unit 27 also stores thecalculation model 51. Thecalculation model 51 is a machine learning model generated by learning predetermined training data, and is a learned model that calculates plaque burden using, as an input, a transverse tomographic image of a blood vessel captured by thediagnostic imaging device 2. Thecalculation model 51 is assumed to be used as a program module constituting a part of artificial intelligence software. - Note that the
diagnostic imaging device 2 may include a reading unit that reads aportable storage medium 2a such as a CD-ROM, and may read the program P2 from theportable storage medium 2a to execute the program P2. Alternatively, thediagnostic imaging device 2 may read the program P2 from asemiconductor memory 2b. -
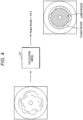
Fig. 4 is an explanatory diagram related to calculation processing of plaque burden.Fig. 4 conceptually illustrates a state in which each frame of a blood vessel tomographic image captured by thediagnostic imaging device 2 is input to thecalculation model 51 to calculate plaque burden. - The
calculation model 51 is a machine learning model that has learned predetermined training data, and is, for example, a convolution neural network (CNN). Note that thecalculation model 51 only needs to be a model capable of calculating plaque burden from the blood vessel tomographic image, and may be a model based on another learning algorithm such as a neural network other than CNN, a decision tree, or a support vector machine (SVM). - The
calculation model 51 includes an input layer that receives an input of an image (tomographic image), an intermediate layer that extracts a feature amount of an input image, and an output layer that calculates (outputs) plaque burden. The input layer receives an input of an image and transfers data on the input image to the intermediate layer. The intermediate layer includes a convolutional layer that convolves data on the input image, extracts a feature amount of the input image, and transfers the feature amount to the output layer. The output layer calculates the plaque burden based on the feature amount extracted in the intermediate layer. - In the present embodiment, the processing executed by the
calculation model 51 is treated as a regression problem, and the plaque burden is predicted with continuous values. Note that this processing may be treated as a classification problem, and the plaque burden may be predicted (classified) within a certain numerical range, for example, "0 to X1 "," X1 to X2 ", "X2 to X3 ", ... (0 < X1 < X2 < X3 ... ). Alternatively, the plaque burden may be classified into a plurality of stages (classified into, for example, red zone, orange zone, yellow zone, ..., and so on) without numerically predicting the plaque burden. - The
server 1 generates thecalculation model 51 by using, as training data (second training data), data in which a correct value of the plaque burden is given to a blood vessel tomographic image (transverse tomographic image) for training. The tomographic image for training is a blood vessel tomographic image captured with an actual patient as the subject, and the correct value is an actual value of plaque burden in the tomographic image of the patient. Theserver 1 inputs the tomographic image for training to thecalculation model 51 to calculate the plaque burden, and compares the plaque burden with the correct value. Theserver 1 optimizes parameters such as weights between neurons so that the two approximate to each other, and generates thecalculation model 51. - The
diagnostic imaging device 2 uses thecalculation model 51 generated by theserver 1 to calculate plaque burden in a blood vessel of a patient who undergoes catheter treatment. Specifically, thediagnostic imaging device 2 sequentially inputs, to thecalculation model 51, tomographic images of a plurality of frames captured according to pull-back operation of thecatheter 201, and calculates the plaque burden in each frame. As a result, thediagnostic imaging device 2 calculates an area ratio obtained by dividing an area of an image region (referred to as "plaque region" in the following description) corresponding to the plaque and the tunica media by an area of an EEM region (region obtained by adding a lumen region to the plaque region), that is, plaque burden (see the lower right ofFig. 4 ). - The
diagnostic imaging device 2 presents, to the user, the plaque burden in each frame calculated above, that is, the plaque burden at each position of the blood vessel along the axial direction, and supports determination of a position at which the stent is indwelled. -
Fig. 5 is an explanatory diagram illustrating a display example of the plaque burden. In the present embodiment, thediagnostic imaging device 2 displays a predetermined object (first object) representing the magnitude of the plaque burden at each position of the blood vessel, corresponding to a longitudinaltomographic image 5 obtained by reconstructing the transverse tomographic images of a plurality of frames. Specifically, as illustrated inFig. 5 , thediagnostic imaging device 2 displays agradation bar 6 in which a display color is gradually changed according to the magnitude of the plaque burden on the upper side of the longitudinaltomographic image 5. - The longitudinal
tomographic image 5 is a longitudinal cross section in which the state of the blood vessel is reproduced along the axial direction (flow direction) of the blood vessel, and is generated from the transverse tomographic images of a plurality of frames captured according to the pull-back operation. For example, as illustrated inFig. 5 , thediagnostic imaging device 2 displays the longitudinaltomographic image 5 with the axial direction of the blood vessel as the transverse direction. - The
diagnostic imaging device 2 displays, on the upper side of the longitudinaltomographic image 5, thegradation bar 6 having substantially the same length as the length of the longitudinaltomographic image 5 along the axial direction. Thegradation bar 6 is a rod-like object representing the magnitude of the plaque burden, and is a display bar in which the display color is changed depending on each position of the corresponding longitudinaltomographic image 5, that is, the magnitude of the plaque burden in the transverse tomographic image of each frame. Thediagnostic imaging device 2 changes the display color at each position of thegradation bar 6, according to the magnitude of the plaque burden at each position on the longitudinaltomographic image 5. - In
Fig. 5 , for convenience, a region having large plaque burden (region equal to or greater than a threshold) is shown with hatching. Actually, as described below, the gradation of the display color in thegradation bar 6 is finely set according to the numerical value of the plaque burden, but inFig. 5 , for convenience, a region having large plaque burden is shown with the same hatching. - In the present embodiment, the description is given assuming that the object indicating the magnitude of plaque burden is the
gradation bar 6, but the object is not limited to thegradation bar 6. For example, thediagnostic imaging device 2 may display a line graph indicating the magnitude of plaque burden on the upper side of the longitudinaltomographic image 5. As described above, thegradation bar 6 is an example of the object, and any object may be used as long as the object appropriately indicates the magnitude of plaque burden. - For example, the
diagnostic imaging device 2 refers to a predetermined threshold (for example, 50%) set by default, and sets a display color for a region having many plaques. Specifically, thediagnostic imaging device 2 sets the display color for a region having plaque burden equal to or greater than the threshold to a warm color (orange, for example), and sets the display color for a region having plaque burden less than the threshold to a default color (white, for example). Thediagnostic imaging device 2 then changes the display color (for example, increases the lightness) so that the larger the plaque burden, the more the region having plaque burden equal to or greater than the threshold is emphasized, and performs gradation display. - As a method of gradation display, for example, it is assumed that lightness is changed, but hue, saturation, and the like may be changed, and a specific display method is not particularly limited.
- In a case where the
gradation bar 6 is displayed as described above, it is preferable that thediagnostic imaging device 2 hides a region in which the reliability of the calculation result of the plaque burden in thecalculation model 51 is low (hereinafter, referred to as a "low reliability region"). InFig. 5 , the low reliability region is illustrated in black. For the calculation of the plaque burden in each frame using thecalculation model 51, thediagnostic imaging device 2 acquires the reliability of the calculated value (for example, a probability value of 0 to 1) from thecalculation model 51 together with the plaque burden in each frame. In a case where the reliability at each position (frame) of the blood vessel is equal to or less than a predetermined value, that is, in a case where the reliability is low, thediagnostic imaging device 2 leaves a region on thecorresponding gradation bar 6 blank as the low reliability region. As a result, the certainty of the calculation result of the plaque burden can be presented to the user. - As described above, the
diagnostic imaging device 2 displays thegradation bar 6 together with the longitudinaltomographic image 5, and quantitatively presents the state of the blood vessel at each position. As illustrated inFig. 5 , thediagnostic imaging device 2 displays a maximum value, a minimum value, and an average value of the plaque burden. This enables the user (medical worker) to grasp the state of the blood vessel and determine a treatment area to be treated with a treatment device such as a stent. -
Fig. 6 is an explanatory diagram illustrating another display example of the plaque burden. InFig. 5 , the display example has been described in which the warm color is displayed for the region having the plaque burden equal to or greater than the threshold, but gradation display may be performed also for the region having the plaque burden less than the threshold, that is, the region having few plaques. - For example, the
diagnostic imaging device 2 sets the display color for the region having the plaque burden equal to or greater than the threshold to a warm color, and sets the display color for the region having the plaque burden less than the threshold to a cold color. InFig. 6 , the region having the plaque burden equal to or greater than the threshold and the region having the plaque burden less than the threshold are shown with different hatching. Similarly to the region having the plaque burden equal to or greater than the threshold, thediagnostic imaging device 2 changes the display color (for example, increases the lightness) as the plaque burden is smaller, and performs gradation display. As described above, thediagnostic imaging device 2 may present a region that has a large number of plaques and needs to be treated, and may also present a region that has a small number of plaques and has a low need for treatment. - Note that, in the example of
Fig. 6 , the number of regions for gradation display is two, but it is possible that a threshold is further provided and gradation display is performed in three or more regions. - In addition, in a case where the gradation display is performed, the user may set a threshold as a display reference. Specifically, the
diagnostic imaging device 2 receives, from the user, a setting input for changing the threshold from a default value to an arbitrary value, determines the region having the plaque burden equal to or greater than the threshold and the region having the plaque burden less than the threshold according to the set threshold, and changes the display color. This enables the user to visualize a region of interest by himself/herself, resulting in supporting the user more suitably. -
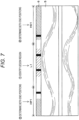
Fig. 7 is an explanatory diagram related to determination processing of a treatment area of a blood vessel. In the present embodiment, a treatment area to be treated with a predetermined treatment device is further presented to the user based on the calculation result of the plaque burden. - Specifically, the
diagnostic imaging device 2 determines positions of both ends of a stent indwelled in the blood vessel. In the case of vascular treatment such as PCI, it is preferable to indwell the stent so as to cover the entire lesion, but in practice, it is difficult to cover the entire lesion because plaques are continuously present. For example, basically, the stent is indwelled so that both ends of the stent are located in a normal site where no plaque is present; however, when it is difficult to do so, the stent is indwelled so that both ends of the stent are located at a site where the plaque burden is a predetermined value (for example, 50%) or less. If that is also difficult, the stent is indwelled so that both ends of the stent are located at a site with the least plaque burden. - At present, the plaque burden of all frames is not calculated as described above, and a stenosed site is visually identified on the image, and the plaque burden of several frames is measured as necessary. In view of this, in the present embodiment, an area where both ends of the stent should be located is determined based on the plaque burden calculated by the
calculation model 51. - In the present embodiment, the stent is exemplified as a treatment device, but the treatment device is not limited to the stent. For example, the
diagnostic imaging device 2 may determine both end positions of an expansion area to be expanded with a balloon used for expanding a blood vessel. Alternatively, for example, thediagnostic imaging device 2 may determine both end positions of a cut area to be cut by a rotablator used for scraping a hard lesion (for example, calcified tissue). As described above, thediagnostic imaging device 2 only needs to be able to determine both end positions of a treatment area to be treated with a treatment device inserted into a blood vessel, and the treatment device is not limited to the stent. - First, the
diagnostic imaging device 2 divides the longitudinal tomographic image 5 (longitudinal cross section) of the blood vessel into a first region in which the plaque burden is equal to or greater than a predetermined threshold and a second region in which the plaque burden is less than the threshold. The threshold is, for example, the same value as the threshold used as the reference for the gradation display described above, but may be a different value. Thediagnostic imaging device 2 divides, based on the plaque burden in each frame calculated by thecalculation model 51, the longitudinaltomographic image 5 into first regions L1, L2, L3 ... (L: Lesion) in which the plaque burden is equal to or greater than the threshold and second regions H1, H2, H3 ... (H: Healthy) in which the plaque burden is less than the threshold. - In the present embodiment, the
diagnostic imaging device 2 identifies the first regions LX (X = 1, 2, 3 ... ) including the position (frame) where the plaque burden takes the maximum value as a lesion region LX in which the stent is to be indwelled. Thediagnostic imaging device 2 then determines two second regions HY and Hz (Y, Z = 1, 2, 3 ...) located on both sides of the identified lesion region LX as regions where both ends of the stent should be located. -
Fig. 7 illustrates the longitudinaltomographic image 5 in which one first region L1 and two second regions HP1 and HD1 (P: Proximal, D: Distal) are present. In a case where the plaque burden takes the maximum value in the first region L1, thediagnostic imaging device 2 determines the second regions HP1 and HD1 sandwiching the first region L1 therebetween as the regions where both ends of the stent should be located. - Note that, for example, in a case where there is a low reliability region in which the reliability of the calculation result of the plaque burden is low, it is preferable that the
diagnostic imaging device 2 groups a plurality of the first regions or the second regions extending over the low reliability region as the same region. For example, inFig. 7 , two low reliability regions are present in the first region L1. In this case, thediagnostic imaging device 2 determines whether or not the length of each low reliability region in the axial direction of the blood vessel is equal to or less than a predetermined length (for example, 1 mm). In a case where the length of the low reliability region is equal to or less than the predetermined length, thediagnostic imaging device 2 treats the plurality of first regions extending over the low reliability region as the same region and divides the regions. In the example ofFig. 7 , since the length of both of the two low reliability regions is equal to or less than the predetermined length, thediagnostic imaging device 2 divides the three regions extending over the low reliability region into the same first region L1. - Similarly for the second region, in a case where there is a plurality of second regions extending over the low reliability region of which the length is equal to or less than the predetermined length, the
diagnostic imaging device 2 divides the plurality of second regions as the same region. As described above, in a case where the length of the low reliability region in the axial direction is equal to or less than the predetermined length, thediagnostic imaging device 2 divides the plurality of first regions or the plurality of second regions extending over the low reliability region as the same region. As a result, the indwelling position of the stent can be suitably determined while reliability is ensured. - Note that the user may change the predetermined length. For example, the
diagnostic imaging device 2 receives a setting input for changing a default value of the predetermined length to an arbitrary value (for example, lengths in predetermined increments of 0.6 mm, 0.8 mm, 1.2 mm ...). Thediagnostic imaging device 2 divides each region by determining whether the length is equal to or less than a set predetermined length. This enables the user to determine the indwelling position of the stent more suitably. - Similarly to the gradation display, in the
diagnostic imaging device 2, the user may change a threshold serving as a reference for the region division. In this case, thediagnostic imaging device 2 may be able to set different thresholds for the proximal side (Proximal) and the distal side (Distal) of the blood vessel. For example, in a case where 50% is set as the threshold on the proximal side and 60% is set as the threshold on the distal side, thediagnostic imaging device 2 performs division with a position where the plaque burden is equal to or greater than 50% as viewed from the left side ofFig. 7 used as the start point of the first region and a position where the plaque burden is less than 60% used as the end point of the first region. This enables the user to finely adjust the first region and the second region by himself/herself. -
Fig. 8 is an explanatory diagram illustrating a display example of a lesion length. As described above, thediagnostic imaging device 2 divides the longitudinaltomographic image 5 into the first regions L1, L2, L3 ... and the second regions H1, H2, H3 ..., and identifies a lesion region L1. In a case where the lesion region L1 is identified, thediagnostic imaging device 2 measures the length of the lesion region L1 in the axial direction of the blood vessel, that is, the lesion length, and displays the length in association with the lesion region L1 in the longitudinaltomographic image 5. Specifically, as illustrated inFig. 8 , thediagnostic imaging device 2 displays a portion corresponding to the lesion region L1 on thegradation bar 6 with an arrow, and displays the lesion length. Thereby, the length of a lesion site can be visualized. -
Fig. 9 is an explanatory diagram illustrating an example where a stent is superimposed. In the present embodiment, thediagnostic imaging device 2 further presents, to the user, a treatment area to be treated with the treatment device, that is, an area in which the stent is to be indwelled. Specifically, thediagnostic imaging device 2 superimposes and displays a stent region 7 (second object) representing the size of the stent (treatment device) on the longitudinaltomographic image 5. - The
stent region 7 is an object simulating the stent indwelled in the blood vessel, and is a rectangular object representing an area in which the stent is indwelled. It is only required that at least the length of thestent region 7 in the axial direction is equal to the actual length of the stent, and the length of thestent region 7 in the radial direction (length in the longitudinal direction inFig. 8 ) is not required to be equal to the actual length of the stent. - Further, in the present embodiment, since the treatment device is a stent, the shape of the object is a rectangular shape; however, for example, in a case where the treatment device is a balloon, the shape of the object may be a sandbag shape. As described above, the
diagnostic imaging device 2 only needs to be able to display an object having a shape corresponding to the treatment device. - For example, the
diagnostic imaging device 2 displays thestent region 7 having a length equal to or longer than the lesion length measured above such that both ends of thestent region 7 are located in the second regions HP1 and HD1 determined as the regions where both ends should be located. For example, thediagnostic imaging device 2 stores, in theauxiliary storage unit 27, information on stent products in predetermined length increments (for example, 9 mm, 12 mm, 15 mm ...) that can be used for a procedure. Thediagnostic imaging device 2 selects a stent that exceeds the lesion length and has the minimum length from among the stent products. Thediagnostic imaging device 2 then superimposes and displays thestent region 7 having the length of the selected stent such that both ends thereof are located in the second regions HP1 and HD1. The selection of the stent, the determination of the superimposing position of thestent region 7, and the like may be performed by manual operation by the user. - For example, the
diagnostic imaging device 2 superimposes and displays thestent region 7 such that the center position (midpoint) of the lesion region L1 in the axial direction of the blood vessel coincides with the center position of thestent region 7. In this case, as illustrated inFig. 9 , downward arrows are displayed at positions corresponding to both ends of the stent, and bidirectional arrows are displayed at portions exceeding the first region L1. Thediagnostic imaging device 2 moves thestent region 7 in accordance with an operation input (for example, mouse operation) by the user, and allows the user to determine the optimum indwelling position of the stent. - In this case, as illustrated in
Fig. 9 , thediagnostic imaging device 2 preferably displays transverse tomographic images at positions corresponding to both ends of thestent region 7. This enables the user to search for the optimum indwelling position of the stent while moving thestent region 7. - Although the
stent region 7 is superimposed and displayed on the longitudinaltomographic image 5 in the above description, thediagnostic imaging device 2 may display thestent region 7 at a location other than the longitudinal tomographic image 5 (for example, on thegradation bar 6, inside thegradation bar 6, or the like) . As described above, thediagnostic imaging device 2 only needs to be able to display the object simulating the treatment device, and the display position is not limited on the longitudinaltomographic image 5. -
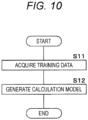
Fig. 10 is a flowchart depicting a procedure of generation processing of thecalculation model 51. Processing details for a case where thecalculation model 51 is generated by machine learning will be described with reference toFig. 10 . - The
control unit 11 of theserver 1 acquires training data (second training data) for generating the calculation model 51 (step S11). The training data is data in which a correct value of plaque burden is correlated with a transverse tomographic image of a blood vessel for training. - The
control unit 11 generates, based on the training data, thecalculation model 51 for calculating plaque burden in a case where the transverse tomographic image of the blood vessel is input (step S12). Specifically, as described above, thecontrol unit 11 generates a neural network such as a CNN as thecalculation model 51. Thecontrol unit 11 inputs the blood vessel tomographic image for training to thecalculation model 51 to calculate the plaque burden, and compares the plaque burden with the correct value. Thecontrol unit 11 optimizes parameters such as weights between neurons so that the plaque burden calculated is approximate to the correct value, and generates thecalculation model 51. Thecontrol unit 11 ends the series of processing. -
Fig. 11 is a flowchart depicting a procedure of plaque burden calculation processing. Processing details executed by thediagnostic imaging device 2 will be described with reference toFig. 11 . - The
control unit 21 of thediagnostic imaging device 2 acquires transverse tomographic images of a plurality of frames obtained by imaging a blood vessel of a patient (step S31). Thecontrol unit 21 inputs the transverse tomographic image of each frame to thecalculation model 51 and calculates the plaque burden in each frame (step S32). Specifically, thecontrol unit 21 acquires, from thecalculation model 51, the plaque burden in each frame and the reliability of the calculated value. - The
control unit 21 identifies a blood vessel position (frame) at which the plaque burden takes the maximum value (step S33). Thecontrol unit 21 also identifies a low reliability region in which the reliability of the plaque burden is equal to or less than a predetermined value in the axial direction of the blood vessel (step S34). Further, thecontrol unit 21 receives a setting input of a threshold (step S35). Note that thecontrol unit 21 may skip step S35 and set a default threshold. - The
control unit 21 generates (reconstructs) a longitudinal tomographic image of the blood vessel on the basis of the transverse tomographic images of the plurality of frames acquired in step S31 (step S36). Thecontrol unit 21 displays the generated longitudinal tomographic image and an object (first object) indicating the magnitude of the plaque burden at each position of the longitudinal tomographic image along the axial direction of the blood vessel (step S37). Specifically, as described above, thecontrol unit 21 displays a gradation bar in which the display color is gradually changed according to the magnitude of the plaque burden. In this case, thecontrol unit 21 displays the gradation bar in which the low reliability region is hidden. - The
control unit 21 divides, based on the plaque burden at each position (frame) of the blood vessel, the longitudinal tomographic image (longitudinal cross section) of the blood vessel into a first region having the plaque burden equal to or greater than the threshold and a second region having the plaque burden less than the threshold (step S38). Specifically, thecontrol unit 21 divides the longitudinal tomographic image into a plurality of regions according to whether or not the plaque burden is equal to or greater than the threshold, and in a case where the length of the low reliability region is equal to or less than a predetermined length, thecontrol unit 21 divides the plurality of first regions or second regions extending over the low reliability region as the same region. - The
control unit 21 identifies a first region including the maximum value of the plaque burden as a lesion region (step S39). Thecontrol unit 21 then determines a region in which both ends of a treatment area to be treated with the treatment device are to be located according to the identified lesion region (step S40). Specifically, thecontrol unit 21 determines second regions located on both sides of the lesion region as regions where both ends of the stent indwelled in the blood vessel should be located. - The
control unit 21 measures the length in the axial direction of the lesion region identified in step S39, that is, the lesion length, and displays the lesion length in correlation with the lesion region in the longitudinal tomographic image (step S41). Thecontrol unit 21 also displays an object (second object) representing the size of the treatment device in correlation with the longitudinal tomographic image (step S42). For example, as described above, thecontrol unit 21 superimposes and displays the stent region representing the length of the stent in the axial direction of the blood vessel on the longitudinal tomographic image such that both ends are located in the region determined in step S40. Thecontrol unit 21 ends the series of processing. - As described above, according to the first embodiment, the plaque burden at each position of the blood vessel is calculated based on the transverse tomographic images of the plurality of frames obtained by imaging the blood vessel of the patient, and the object such as the gradation bar representing the magnitude of the calculated plaque burden is displayed in correlation with the longitudinal tomographic image. This makes it possible to suitably support diagnostic imaging related to vascular treatment such as determination of the indwelling position of the stent.
- In addition, according to the first embodiment, the certainty of the calculation result of the plaque burden can be presented to the user by hiding the low reliability region in which the reliability of the calculation result of the plaque burden is low.
- Further, according to the first embodiment, it is possible to more suitably support diagnostic imaging by presenting the length of the lesion region (lesion length), the indwelling area of the stent (stent region), and the like.
- Further, according to the first embodiment, the longitudinal cross section (longitudinal tomographic image) of the blood vessel is divided into a plurality of regions according to the plaque burden, and regions where both ends of a treatment area of the blood vessel by the treatment device such as the stent are to be located are determined. This makes it possible to more suitably support diagnostic imaging related to vascular treatment such as determination of the indwelling position of the stent.
- According to the first embodiment, in a case where the length of the low reliability region is equal to or less than the predetermined length, the plurality of regions (first region or second region) extending over the low reliability region is regarded as the same region and divided. As a result, the indwelling position of the stent and the like can be suitably determined while reliability is ensured.
- In the first embodiment, the first region where the plaque burden takes the maximum value is identified as the lesion region. However, the lesion region is not necessary to be a region where the plaque burden takes the maximum value.
-
Fig. 12 is an explanatory diagram related to processing for identifying a lesion region according to the first modification. In the first embodiment, the lesion region is identified first, and then the region where both ends of the stent should be located is determined; however, the region where both ends of the stent should be located may be determined first, and then the lesion region may be identified. - Specifically, after dividing the longitudinal
tomographic image 5 into the first regions L1, L2, L3 ... and the second regions H1, H2, H3 ..., thediagnostic imaging device 2 searches for two second regions Hy and Hz sandwiching a first region Lx therebetween. In a case where the two second regions Hy and Hz sandwiching the first region Lx are searched, thediagnostic imaging device 2 identifies, as the lesion region Lx, the first region Lx sandwiched between the two second regions Hy and Hz. Thediagnostic imaging device 2 then measures the length of the lesion region Lx (lesion length) and superimposes and displays thestent region 7. - As described above, the
diagnostic imaging device 2 may determine the region in which the stent is to be indwelled from the positional relationship between the first region and the second region. The determination method described in the first embodiment is an example, and various methods are assumed. - In the first embodiment, the configuration in which the
calculation model 51 directly calculates plaque burden has been described. In the present embodiment, description is provided of a configuration in which a plaque region is identified from a blood vessel tomographic image (transverse tomographic image) using another machine learning model to indirectly calculate plaque burden. The same reference numerals are given to the same contents as those of the first embodiment, and the description thereof will be omitted. -
Fig. 13 is a block diagram illustrating a configuration example of thediagnostic imaging device 2 according to the second embodiment. Theauxiliary storage unit 27 of thediagnostic imaging device 2 according to the present embodiment stores anidentification model 52. As with thecalculation model 51 according to the first embodiment, theidentification model 52 is a machine learning model generated by learning predetermined training data, and is a learned model that identifies a plaque region in a blood vessel tomographic image using the blood vessel tomographic image as an input. Theidentification model 52 is assumed to be used as a program module constituting a part of artificial intelligence software. -
Fig. 14 is an explanatory diagram related to calculation processing of plaque burden according to the second embodiment.Fig. 14 conceptually illustrates a state in which an image region (referred to as a "plaque region" in the following description) corresponding to a plaque and a tunica media is identified from a transverse tomographic image of a blood vessel using theidentification model 52, and plaque burden is calculated from an area of the identified plaque region. An outline of the present embodiment will be described with reference toFig. 14 . - The
identification model 52 is a machine learning model that has learned predetermined training data, and is, for example, a neural network generated by deep learning. In the present embodiment, the description will be given on the assumption that theidentification model 52 is a semantic segmentation model which is a kind of CNN. - The semantic segmentation model is a neural network that identifies an object in an image in units of pixels, and includes a convolutional layer (encoder) that convolves an input image and a deconvolutional layer (decoder) that maps a convoluted feature amount to the original image size. In the deconvolutional layer, which object exists at which position in the image is identified based on the feature amount extracted in the convolutional layer, and data obtained by binarizing which object each pixel corresponds to is generated.
- The
server 1 generates theidentification model 52 using training data (first training data) in which data indicating a correct plaque region is correlated with a tomographic image for training. Theserver 1 inputs the tomographic image for training to theidentification model 52 to identify a plaque region, and optimizes parameters such as weights between neurons so that the identified plaque region approximates to the correct plaque region. Thediagnostic imaging device 2 identifies a plaque region using theidentification model 52 generated by theserver 1. - Note that, in the present embodiment, the description will be given assuming that the
identification model 52 is a semantic segmentation model, but theidentification model 52 may be a model based on a neural network other than the semantic segmentation model, a generative adversarial network (GAN), or another learning algorithm. - Alternatively, the
server 1 may generate theidentification model 52 capable of also identifying a region other than the plaque region by training using training data to which correct answer data on a region other than the plaque region (for example, EEM region, lumen region, and so on) is also given. That is, theidentification model 52 only needs to be able to identify at least a plaque region, and may be able to identify other image regions. - In a case where a blood vessel of a patient is imaged, the
diagnostic imaging device 2 sequentially inputs tomographic images of frames to theidentification model 52, and identifies a plaque region in each frame. Thediagnostic imaging device 2 then calculates plaque burden based on the identification result of the plaque region. That is, thediagnostic imaging device 2 calculates the plaque burden by calculating an area of the plaque region and an area of the entire blood vessel including the plaque region. - As described above, the configuration in which the machine learning model directly calculates the plaque burden is not essential, and the plaque burden may be indirectly calculated from a prediction result in the machine learning model.
-
Fig. 15 is a flowchart depicting a procedure of generation processing of theidentification model 52. Processing details for a case where theidentification model 52 is generated by machine learning will be described with reference toFig. 15 . - The
control unit 11 of theserver 1 acquires training data (first training data) for generating the identification model 52 (step S201). The training data is data in which data indicating a correct plaque region is correlated with a transverse tomographic image of a blood vessel for training. - The
control unit 11 generates, based on the training data, theidentification model 52 for identifying the plaque region in a case where the transverse tomographic image of the blood vessel is input (step S202). Specifically, as described above, thecontrol unit 11 generates the CNN related to semantic segmentation as theidentification model 52. Thecontrol unit 11 inputs a transverse tomographic image for training to theidentification model 52 to identify the plaque region, and compares the plaque region with the correct plaque region. Thecontrol unit 11 optimizes parameters such as weights between neurons so that the two approximate to each other, and generates theidentification model 52. Thecontrol unit 11 ends the series of processing. -
Fig. 16 is a flowchart depicting a procedure of calculation processing of plaque burden according to the second embodiment. After acquiring the transverse tomographic images of the plurality of frames obtained by imaging a blood vessel of a patient (step S31), thediagnostic imaging device 2 executes the following processing. - The
control unit 21 of thediagnostic imaging device 2 inputs the transverse tomographic image of each frame to theidentification model 52 and identifies a plaque region in each frame (step S221). Thecontrol unit 21 then calculates the plaque burden in each frame on the basis of the identification result (step S 222). Thecontrol unit 21 shifts the processing to step S31. - As described above, according to the second embodiment, plaque burden can also be calculated by using the identification result of the
identification model 52 that identifies a plaque region from a transverse tomographic image of a blood vessel. - In the second embodiment, the
identification model 52 capable of identifying a plaque region in a tomographic image has been described. On the other hand, a parameter such as a weight obtained by learning in theidentification model 52 may be applied to thecalculation model 51, and transfer learning for generating thecalculation model 51 from the learning result in theidentification model 52 may be performed. -
Fig. 17 is an explanatory diagram related to generation processing of thecalculation model 51 according to the second modification.Fig. 17 conceptually illustrates a state in which some network structures and parameters of the identification model 52 (semantic segmentation model) are applied to the calculation model 51 (CNN) to perform transfer learning. In the present modification, the description is provided assuming that theserver 1 has generated theidentification model 52. - The
server 1 performs learning by setting parameters such as weights obtained by generating (training) theidentification model 52 to initial values in thecalculation model 51 having a network structure similar to a part of the network structure of theidentification model 52. For example, thecalculation model 51 has a structure in which an output layer for plaque burden calculation is connected to an input layer similar to theidentification model 52 and a part (convolutional layer) of an intermediate layer corresponding to a decoder portion of theidentification model 52. Theserver 1 sets parameters obtained by training theidentification model 52 to initial values of the parameters of the intermediate layer, and performs learning by giving training data (first training data). Theserver 1 inputs the tomographic image for training to calculate the plaque burden, compares the plaque burden with the correct value, and optimizes the parameters so that the two values are approximated. Such transfer learning can reduce the amount of data learned by thecalculation model 51 and the learning time thereof. -
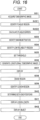
Fig. 18 is a flowchart depicting a procedure of generation processing of thecalculation model 51 according to the second modification. After acquiring training data (first training data) for generating the calculation model 51 (step S11), theserver 1 executes the following processing. The description is provided assuming that theserver 1 has generated theidentification model 52. - The
control unit 11 of theserver 1 generates thecalculation model 51 based on the parameters obtained by generating theidentification model 52 and the training data (step S301). Specifically, as described above, thecontrol unit 11 performs learning after setting parameters such as weights obtained by training theidentification model 52 to initial values of the parameters of thecalculation model 51. Thecontrol unit 11 inputs the tomographic image for training to thecalculation model 51 to calculate the plaque burden, compares the plaque burden with the correct value, and optimizes the parameters so that the two values are approximated. Thecontrol unit 11 ends the series of processing. - As described above, according to the present first modification, the amount of data learned by the
calculation model 51 and the learning time thereof can be reduced by using the learning result in theidentification model 52. - It is supposed that the embodiments disclosed herein are considered to be an example in all respects and not to be restrictive. The scope of the present invention is indicated not by the above meaning but by the claims and is intended to include all changes within the meaning and scope equivalent to the claims.
-
- 1
- Server
- 11
- Control unit
- 12
- Main storage unit
- 13
- Communication unit
- 14
- Auxiliary storage unit
- P1
- Program
- 2
- Diagnostic imaging device
- 21
- Control unit
- 22
- Main storage unit
- 23
- Communication unit
- 24
- Display unit
- 25
- Input unit
- 26
- Image processing unit
- 27
- Auxiliary storage unit
- P2
- Program
- 51
- Calculation model
- 52
- Identification model
- 5
- Longitudinal tomographic image
- 6
- Gradation bar
- 7
- Stent region
Claims (15)
- An information processing device comprising:an acquisition unit that is configured to acquire transverse tomographic images of a plurality of frames obtained by imaging a blood vessel of a patient;a calculation unit that is configured to calculate plaque burden at each position of the blood vessel along an axial direction of the blood vessel based on the transverse tomographic images of the plurality of frames;a division unit that is configured to divide a longitudinal cross section of the blood vessel into a first region in which the plaque burden is equal to or greater than a threshold and a second region in which the plaque burden is less than the threshold; anda determination unit that is configured to determine, in each of the regions obtained by the division, regions in which both ends of a treatment area of the blood vessel with a predetermined treatment device are to be located.
- The information processing device according to claim 1, wherein
the determination unit determines regions in which both ends of a stent indwelled in the blood vessel are to be located. - The information processing device according to claim 1, wherein
the determination unit determines two of the second regions sandwiching the first region to be the regions in which the both ends are to be located. - The information processing device according to claim 3, whereinthe determination unitidentifies the first region in which the plaque burden takes a maximum value from each of the regions obtained by dividing the longitudinal cross section, anddetermines two of the second regions sandwiching the identified first region to be the regions in which the both ends are to be located.
- The information processing device according to any one of claims 1 to 4, comprisinga receiving unit that is configured to receive, from a user, a setting input for setting the threshold, whereinthe division unit divides the longitudinal cross section according to the set threshold.
- The information processing device according to any one of claims 1 to 5, wherein
the calculation unit calculates the plaque burden in each of the frames by inputting each of the transverse tomographic images of the plurality of frames to a calculation model that has learned to calculate plaque burden in response to the transverse tomographic image inputted. - The information processing device according to any one of claims 1 to 5, whereinthe calculation unitidentifies an image region corresponding to plaque in each of the frames by inputting each of the transverse tomographic images of the plurality of frames to an identification model that has learned to identify the image region in response to the transverse tomographic image inputted, andcalculates the plaque burden in each of the frames based on an area of the identified image region.
- The information processing device according to claim 6 or 7, whereinthe calculation unit calculates the plaque burden in each of the frames and a reliability indicating certainty of a calculation result of the plaque burden in each of the frames,an identification unit is provided to identify a low reliability region in which the reliability is equal to or less than a predetermined value in the longitudinal cross section of the blood vessel, andin a case where a length of the low reliability region in the axial direction is equal to or less than a predetermined length, the division unit divides the plurality of first regions or second regions extending over the low reliability region as a same region.
- The information processing device according to claim 8, comprisinga second receiving unit that is configured to receive, from the user, a setting input for setting the predetermined length, whereinthe division unit divides the longitudinal cross section according to the set predetermined length.
- The information processing device according to any one of claims 1 to 9, comprising
a display unit that is configured to display a longitudinal tomographic image of the blood vessel corresponding to the longitudinal cross section and a second object that is an object with a predetermined shape displayed in correlation with the longitudinal cross section and has both ends located in the regions in which the both ends are to be located. - The information processing device according to claim 10, wherein
the display unit further displays a first object that represents magnitude of the plaque burden at each position of the longitudinal tomographic images along the axial direction. - The information processing device according to claim 10 or 11, comprisinga length measurement unit that is configured to measure a length, in the axial direction, of the first region, whereinthe display unit displays the measured length in correlation with the first region in the longitudinal tomographic image.
- An information processing method in which a computer executes processing comprising:acquiring transverse tomographic images of a plurality of frames obtained by imaging a blood vessel of a patient;calculating plaque burden at each position of the blood vessel along an axial direction of the blood vessel based on the transverse tomographic images of the plurality of frames;dividing a longitudinal cross section of the blood vessel into a first region in which the plaque burden is equal to or greater than a threshold and a second region in which the plaque burden is less than the threshold; anddetermining, in each of the regions obtained by the division, regions in which both ends of a treatment area of the blood vessel with a predetermined treatment device are to be located.
- A program for causing a computer execute processing comprising:acquiring transverse tomographic images of a plurality of frames obtained by imaging a blood vessel of a patient;calculating plaque burden at each position of the blood vessel along an axial direction of the blood vessel based on the transverse tomographic images of the plurality of frames;dividing a longitudinal cross section of the blood vessel into a first region in which the plaque burden is equal to or greater than a threshold and a second region in which the plaque burden is less than the threshold; anddetermining, in each of the regions obtained by the division, regions in which both ends of a treatment area of the blood vessel with a predetermined treatment device are to be located.
- A model generation method in which a computer executes processing comprising:acquiring first training data in which data indicating an image region corresponding to plaque is given to a transverse tomographic image obtained by imaging a blood vessel of a patient;generating, based on the first training data, an identification model for identifying the image region corresponding to the plaque in response to the transverse tomographic image inputted;acquiring second training data in which a correct value of plaque burden is given to the transverse tomographic image; andgenerating, based on a learned parameter obtained by generating the identification model and the second training data, a calculation model for calculating the plaque burden in response to the transverse tomographic image inputted.
Applications Claiming Priority (2)
| Application Number | Priority Date | Filing Date | Title |
|---|---|---|---|
| JP2020163914 | 2020-09-29 | ||
| PCT/JP2021/035259 WO2022071181A1 (en) | 2020-09-29 | 2021-09-27 | Information processing device, information processing method, program, and model generation method |
Publications (2)
| Publication Number | Publication Date |
|---|---|
| EP4218599A1 true EP4218599A1 (en) | 2023-08-02 |
| EP4218599A4 EP4218599A4 (en) | 2024-03-27 |
Family
ID=80951464
Family Applications (1)
| Application Number | Title | Priority Date | Filing Date |
|---|---|---|---|
| EP21875483.6A Pending EP4218599A4 (en) | 2020-09-29 | 2021-09-27 | INFORMATION PROCESSING APPARATUS, INFORMATION PROCESSING METHOD, PROGRAM AND MODEL GENERATION METHOD |
Country Status (4)
| Country | Link |
|---|---|
| US (1) | US20230230252A1 (en) |
| EP (1) | EP4218599A4 (en) |
| JP (1) | JP7695262B2 (en) |
| WO (1) | WO2022071181A1 (en) |
Families Citing this family (5)
| Publication number | Priority date | Publication date | Assignee | Title |
|---|---|---|---|---|
| JPWO2024071121A1 (en) * | 2022-09-28 | 2024-04-04 | ||
| WO2024071251A1 (en) * | 2022-09-29 | 2024-04-04 | テルモ株式会社 | Computer program, information processing method, information processing device, and learning model |
| CN121335671A (en) * | 2023-03-30 | 2026-01-13 | 波士顿科学国际有限公司 | Graphical user interface for indicating intravascular plaque burden |
| WO2024211117A1 (en) * | 2023-04-03 | 2024-10-10 | Medstar Health, Inc. | Machine learning prediction models of coronary plaque progression from intravascular ultrasound images |
| US20260044959A1 (en) * | 2023-07-17 | 2026-02-12 | Lightlab Imaging, Inc. | Automated Lesion Detection |
Family Cites Families (6)
| Publication number | Priority date | Publication date | Assignee | Title |
|---|---|---|---|---|
| US6381350B1 (en) * | 1999-07-02 | 2002-04-30 | The Cleveland Clinic Foundation | Intravascular ultrasonic analysis using active contour method and system |
| JP2012200532A (en) * | 2011-03-28 | 2012-10-22 | Terumo Corp | Imaging apparatus for diagnosis and display method |
| JP5318253B2 (en) | 2012-06-04 | 2013-10-16 | 株式会社東芝 | Medical image processing device |
| WO2017130927A1 (en) * | 2016-01-26 | 2017-08-03 | テルモ株式会社 | Image display device and method for controlling same |
| CN117398183A (en) * | 2016-09-28 | 2024-01-16 | 光学实验室成像公司 | Stent planning system and method using vascular manifestations |
| CA3288480A1 (en) * | 2019-03-17 | 2025-11-29 | Lightlab Imaging Inc | Arterial imaging and assessment systems and methods and related user interface based-workflows |
-
2021
- 2021-09-27 WO PCT/JP2021/035259 patent/WO2022071181A1/en not_active Ceased
- 2021-09-27 JP JP2022553930A patent/JP7695262B2/en active Active
- 2021-09-27 EP EP21875483.6A patent/EP4218599A4/en active Pending
-
2023
- 2023-03-29 US US18/191,974 patent/US20230230252A1/en active Pending
Also Published As
| Publication number | Publication date |
|---|---|
| JPWO2022071181A1 (en) | 2022-04-07 |
| EP4218599A4 (en) | 2024-03-27 |
| WO2022071181A1 (en) | 2022-04-07 |
| JP7695262B2 (en) | 2025-06-18 |
| US20230230252A1 (en) | 2023-07-20 |
Similar Documents
| Publication | Publication Date | Title |
|---|---|---|
| US12620089B2 (en) | Information processing device, information processing method, and program | |
| US20230230252A1 (en) | Information processing device, information processing method, program, and model generation method | |
| US11694330B2 (en) | Medical image processing apparatus, system, and method | |
| CN108962381B (en) | Learning-based method for personalized assessment, long-term prediction and management of atherosclerosis | |
| CN113164131B (en) | Selection of the most relevant X-ray images for hemodynamic simulations | |
| JP7536861B2 (en) | PROGRAM, INFORMATION PROCESSING METHOD, INFORMATION PROCESSING APPARATUS AND MODEL GENERATION METHOD | |
| JP2023051917A (en) | Methods of using stent planning systems and vessel representations | |
| WO2021117043A1 (en) | Automatic stenosis detection | |
| JP7490045B2 (en) | PROGRAM, INFORMATION PROCESSING METHOD, INFORMATION PROCESSING APPARATUS AND MODEL GENERATION METHOD | |
| JP7536862B2 (en) | PROGRAM, INFORMATION PROCESSING METHOD, INFORMATION PROCESSING APPARATUS AND MODEL GENERATION METHOD | |
| JP7803869B2 (en) | Program, information processing device and information processing method | |
| CN113241183B (en) | Treatment scheme prediction method and device | |
| US20250217985A1 (en) | Method and system for determining a treatment strategy for a vessel with multiple or diffuse lesions | |
| CN116309346A (en) | Medical image detection method, device, equipment, storage medium and program product | |
| KR20210118285A (en) | Method for diagnosing the carotid artery | |
| US20240005459A1 (en) | Program, image processing method, and image processing device | |
| JP7667134B2 (en) | PROGRAM, INFORMATION PROCESSING METHOD, INFORMATION PROCESSING APPARATUS AND MODEL GENERATION METHOD | |
| US20230274424A1 (en) | Appartus and method for quantifying lesion in biometric image | |
| CN114881935B (en) | Method, device, equipment and medium for detecting in-stent restenosis | |
| WO2022071208A1 (en) | Information processing device, information processing method, program, model generation method, and training data generation method | |
| JP7749536B2 (en) | Information processing device, information processing method, and program | |
| CN113838007A (en) | Physiological parameter acquisition method, device, electronic device and storage medium | |
| WO2021193021A1 (en) | Program, information processing method, information processing device, and model generation method | |
| JP2025052747A (en) | Information processing method, program, and information processing device | |
| Luque-Baena et al. | Stenosis detection in coronary angiography images using deep learning models |
Legal Events
| Date | Code | Title | Description |
|---|---|---|---|
| STAA | Information on the status of an ep patent application or granted ep patent |
Free format text: STATUS: THE INTERNATIONAL PUBLICATION HAS BEEN MADE |
|
| PUAI | Public reference made under article 153(3) epc to a published international application that has entered the european phase |
Free format text: ORIGINAL CODE: 0009012 |
|
| STAA | Information on the status of an ep patent application or granted ep patent |
Free format text: STATUS: REQUEST FOR EXAMINATION WAS MADE |
|
| 17P | Request for examination filed |
Effective date: 20230427 |
|
| AK | Designated contracting states |
Kind code of ref document: A1 Designated state(s): AL AT BE BG CH CY CZ DE DK EE ES FI FR GB GR HR HU IE IS IT LI LT LU LV MC MK MT NL NO PL PT RO RS SE SI SK SM TR |
|
| DAV | Request for validation of the european patent (deleted) | ||
| DAX | Request for extension of the european patent (deleted) | ||
| A4 | Supplementary search report drawn up and despatched |
Effective date: 20240228 |
|
| RIC1 | Information provided on ipc code assigned before grant |
Ipc: A61B 8/12 20060101AFI20240222BHEP |
|
| STAA | Information on the status of an ep patent application or granted ep patent |
Free format text: STATUS: EXAMINATION IS IN PROGRESS |
|
| 17Q | First examination report despatched |
Effective date: 20250623 |