EP4177605A1 - Pathological diagnosis assist device, operation method of pathological diagnosis assist device, and operation program of pathological diagnosis assist device - Google Patents
Pathological diagnosis assist device, operation method of pathological diagnosis assist device, and operation program of pathological diagnosis assist device Download PDFInfo
- Publication number
- EP4177605A1 EP4177605A1 EP21833599.0A EP21833599A EP4177605A1 EP 4177605 A1 EP4177605 A1 EP 4177605A1 EP 21833599 A EP21833599 A EP 21833599A EP 4177605 A1 EP4177605 A1 EP 4177605A1
- Authority
- EP
- European Patent Office
- Prior art keywords
- region
- fibrotic
- pathological diagnosis
- evaluation information
- support apparatus
- Prior art date
- Legal status (The legal status is an assumption and is not a legal conclusion. Google has not performed a legal analysis and makes no representation as to the accuracy of the status listed.)
- Pending
Links
Images












Classifications
-
- G—PHYSICS
- G01—MEASURING; TESTING
- G01N—INVESTIGATING OR ANALYSING MATERIALS BY DETERMINING THEIR CHEMICAL OR PHYSICAL PROPERTIES
- G01N33/00—Investigating or analysing materials by specific methods not covered by groups G01N1/00 - G01N31/00
- G01N33/48—Biological material, e.g. blood, urine; Haemocytometers
- G01N33/483—Physical analysis of biological material
- G01N33/4833—Physical analysis of biological material of solid biological material, e.g. tissue samples, cell cultures
-
- G—PHYSICS
- G06—COMPUTING OR CALCULATING; COUNTING
- G06T—IMAGE DATA PROCESSING OR GENERATION, IN GENERAL
- G06T7/00—Image analysis
- G06T7/0002—Inspection of images, e.g. flaw detection
- G06T7/0012—Biomedical image inspection
-
- G—PHYSICS
- G01—MEASURING; TESTING
- G01N—INVESTIGATING OR ANALYSING MATERIALS BY DETERMINING THEIR CHEMICAL OR PHYSICAL PROPERTIES
- G01N21/00—Investigating or analysing materials by the use of optical means, i.e. using sub-millimetre waves, infrared, visible or ultraviolet light
- G01N21/17—Systems in which incident light is modified in accordance with the properties of the material investigated
- G01N21/25—Colour; Spectral properties, i.e. comparison of effect of material on the light at two or more different wavelengths or wavelength bands
-
- G—PHYSICS
- G01—MEASURING; TESTING
- G01N—INVESTIGATING OR ANALYSING MATERIALS BY DETERMINING THEIR CHEMICAL OR PHYSICAL PROPERTIES
- G01N33/00—Investigating or analysing materials by specific methods not covered by groups G01N1/00 - G01N31/00
- G01N33/48—Biological material, e.g. blood, urine; Haemocytometers
- G01N33/50—Chemical analysis of biological material, e.g. blood, urine; Testing involving biospecific ligand binding methods; Immunological testing
- G01N33/68—Chemical analysis of biological material, e.g. blood, urine; Testing involving biospecific ligand binding methods; Immunological testing involving proteins, peptides or amino acids
- G01N33/6893—Chemical analysis of biological material, e.g. blood, urine; Testing involving biospecific ligand binding methods; Immunological testing involving proteins, peptides or amino acids related to diseases not provided for elsewhere
-
- G—PHYSICS
- G06—COMPUTING OR CALCULATING; COUNTING
- G06T—IMAGE DATA PROCESSING OR GENERATION, IN GENERAL
- G06T7/00—Image analysis
- G06T7/10—Segmentation; Edge detection
- G06T7/11—Region-based segmentation
-
- G—PHYSICS
- G06—COMPUTING OR CALCULATING; COUNTING
- G06T—IMAGE DATA PROCESSING OR GENERATION, IN GENERAL
- G06T7/00—Image analysis
- G06T7/10—Segmentation; Edge detection
- G06T7/136—Segmentation; Edge detection involving thresholding
-
- G—PHYSICS
- G06—COMPUTING OR CALCULATING; COUNTING
- G06T—IMAGE DATA PROCESSING OR GENERATION, IN GENERAL
- G06T7/00—Image analysis
- G06T7/60—Analysis of geometric attributes
- G06T7/62—Analysis of geometric attributes of area, perimeter, diameter or volume
-
- G—PHYSICS
- G16—INFORMATION AND COMMUNICATION TECHNOLOGY [ICT] SPECIALLY ADAPTED FOR SPECIFIC APPLICATION FIELDS
- G16H—HEALTHCARE INFORMATICS, i.e. INFORMATION AND COMMUNICATION TECHNOLOGY [ICT] SPECIALLY ADAPTED FOR THE HANDLING OR PROCESSING OF MEDICAL OR HEALTHCARE DATA
- G16H30/00—ICT specially adapted for the handling or processing of medical images
- G16H30/40—ICT specially adapted for the handling or processing of medical images for processing medical images, e.g. editing
-
- G—PHYSICS
- G16—INFORMATION AND COMMUNICATION TECHNOLOGY [ICT] SPECIALLY ADAPTED FOR SPECIFIC APPLICATION FIELDS
- G16H—HEALTHCARE INFORMATICS, i.e. INFORMATION AND COMMUNICATION TECHNOLOGY [ICT] SPECIALLY ADAPTED FOR THE HANDLING OR PROCESSING OF MEDICAL OR HEALTHCARE DATA
- G16H50/00—ICT specially adapted for medical diagnosis, medical simulation or medical data mining; ICT specially adapted for detecting, monitoring or modelling epidemics or pandemics
- G16H50/30—ICT specially adapted for medical diagnosis, medical simulation or medical data mining; ICT specially adapted for detecting, monitoring or modelling epidemics or pandemics for calculating health indices; for individual health risk assessment
-
- G—PHYSICS
- G01—MEASURING; TESTING
- G01N—INVESTIGATING OR ANALYSING MATERIALS BY DETERMINING THEIR CHEMICAL OR PHYSICAL PROPERTIES
- G01N2800/00—Detection or diagnosis of diseases
- G01N2800/08—Hepato-biliairy disorders other than hepatitis
- G01N2800/085—Liver diseases, e.g. portal hypertension, fibrosis, cirrhosis, bilirubin
-
- G—PHYSICS
- G06—COMPUTING OR CALCULATING; COUNTING
- G06T—IMAGE DATA PROCESSING OR GENERATION, IN GENERAL
- G06T2200/00—Indexing scheme for image data processing or generation, in general
- G06T2200/24—Indexing scheme for image data processing or generation, in general involving graphical user interfaces [GUIs]
-
- G—PHYSICS
- G06—COMPUTING OR CALCULATING; COUNTING
- G06T—IMAGE DATA PROCESSING OR GENERATION, IN GENERAL
- G06T2207/00—Indexing scheme for image analysis or image enhancement
- G06T2207/10—Image acquisition modality
- G06T2207/10024—Color image
-
- G—PHYSICS
- G06—COMPUTING OR CALCULATING; COUNTING
- G06T—IMAGE DATA PROCESSING OR GENERATION, IN GENERAL
- G06T2207/00—Indexing scheme for image analysis or image enhancement
- G06T2207/10—Image acquisition modality
- G06T2207/10056—Microscopic image
-
- G—PHYSICS
- G06—COMPUTING OR CALCULATING; COUNTING
- G06T—IMAGE DATA PROCESSING OR GENERATION, IN GENERAL
- G06T2207/00—Indexing scheme for image analysis or image enhancement
- G06T2207/20—Special algorithmic details
- G06T2207/20084—Artificial neural networks [ANN]
-
- G—PHYSICS
- G06—COMPUTING OR CALCULATING; COUNTING
- G06T—IMAGE DATA PROCESSING OR GENERATION, IN GENERAL
- G06T2207/00—Indexing scheme for image analysis or image enhancement
- G06T2207/30—Subject of image; Context of image processing
- G06T2207/30004—Biomedical image processing
- G06T2207/30024—Cell structures in vitro; Tissue sections in vitro
-
- G—PHYSICS
- G06—COMPUTING OR CALCULATING; COUNTING
- G06T—IMAGE DATA PROCESSING OR GENERATION, IN GENERAL
- G06T2207/00—Indexing scheme for image analysis or image enhancement
- G06T2207/30—Subject of image; Context of image processing
- G06T2207/30004—Biomedical image processing
- G06T2207/30056—Liver; Hepatic
-
- G—PHYSICS
- G06—COMPUTING OR CALCULATING; COUNTING
- G06T—IMAGE DATA PROCESSING OR GENERATION, IN GENERAL
- G06T2207/00—Indexing scheme for image analysis or image enhancement
- G06T2207/30—Subject of image; Context of image processing
- G06T2207/30004—Biomedical image processing
- G06T2207/30061—Lung
-
- G—PHYSICS
- G06—COMPUTING OR CALCULATING; COUNTING
- G06T—IMAGE DATA PROCESSING OR GENERATION, IN GENERAL
- G06T2207/00—Indexing scheme for image analysis or image enhancement
- G06T2207/30—Subject of image; Context of image processing
- G06T2207/30004—Biomedical image processing
- G06T2207/30101—Blood vessel; Artery; Vein; Vascular
-
- G—PHYSICS
- G16—INFORMATION AND COMMUNICATION TECHNOLOGY [ICT] SPECIALLY ADAPTED FOR SPECIFIC APPLICATION FIELDS
- G16H—HEALTHCARE INFORMATICS, i.e. INFORMATION AND COMMUNICATION TECHNOLOGY [ICT] SPECIALLY ADAPTED FOR THE HANDLING OR PROCESSING OF MEDICAL OR HEALTHCARE DATA
- G16H50/00—ICT specially adapted for medical diagnosis, medical simulation or medical data mining; ICT specially adapted for detecting, monitoring or modelling epidemics or pandemics
- G16H50/20—ICT specially adapted for medical diagnosis, medical simulation or medical data mining; ICT specially adapted for detecting, monitoring or modelling epidemics or pandemics for computer-aided diagnosis, e.g. based on medical expert systems
-
- G—PHYSICS
- G16—INFORMATION AND COMMUNICATION TECHNOLOGY [ICT] SPECIALLY ADAPTED FOR SPECIFIC APPLICATION FIELDS
- G16H—HEALTHCARE INFORMATICS, i.e. INFORMATION AND COMMUNICATION TECHNOLOGY [ICT] SPECIALLY ADAPTED FOR THE HANDLING OR PROCESSING OF MEDICAL OR HEALTHCARE DATA
- G16H50/00—ICT specially adapted for medical diagnosis, medical simulation or medical data mining; ICT specially adapted for detecting, monitoring or modelling epidemics or pandemics
- G16H50/70—ICT specially adapted for medical diagnosis, medical simulation or medical data mining; ICT specially adapted for detecting, monitoring or modelling epidemics or pandemics for mining of medical data, e.g. analysing previous cases of other patients
Definitions
- the technology of the present disclosure relates to a pathological diagnosis support apparatus, an operation method for a pathological diagnosis support apparatus, and an operation program for a pathological diagnosis support apparatus.
- a pathologist In pathological diagnosis, the degree of fibrosis of a biological tissue leading to a risk of a disease such as cancer is evaluated. Conventionally, a pathologist observes a sample collected from the biological tissue under a microscope and visually evaluates the degree of fibrosis. However, such an evaluation method imposes a heavy burden on the pathologist. Furthermore, the evaluation may vary depending on the skill level of the pathologist.
- a method has been proposed in which an image of a sample (hereinafter referred to as a sample image) is analyzed by a computer to detect a fibrotic region, and the areal percentage of the fibrotic region or the like is derived and presented to a user such as a pathologist.
- the fibrotic region is not uniformly stained with the same color by staining with a dye such as Sirius red.
- a dye such as Sirius red
- the color changes depending on the concentration of the dye or the ambient environment such as temperature and humidity.
- the color also changes depending on the difference in the imaging apparatus of the sample image. Therefore, as disclosed in Vincenza Calvaruso et al., "Computer-Assisted Image Analysis of Liver Collagen: Relationship to Ishak Scoring and Hepatic Venous Pressure Gradient", published in April 2009, HEPATOLOGY (49), pp. 1236-1244 , a method for detecting a fibrotic region by simply comparing the pixel values of RGB color channels of the sample image with the threshold value has low detection accuracy of the fibrotic region.
- An object of the technology of the present disclosure is to provide a pathological diagnosis support apparatus, an operation method for a pathological diagnosis support apparatus, and an operation program for a pathological diagnosis support apparatus, by which the detection accuracy of the fibrotic region can be improved.
- a pathological diagnosis support apparatus includes at least one processor, in which the processor is configured to: acquire a sample image obtained by imaging a sample of a biological tissue stained with a dye, the sample image having pixel values of a plurality of color channels; detect a fibrotic region of the biological tissue by comparing a ratio between pixel values of two color channels among the plurality of color channels with a preset threshold value; derive evaluation information indicating a degree of fibrosis of the biological tissue based on the detected fibrotic region; and output the evaluation information.
- the processor preferably calculates a ratio between pixel values of two color channels corresponding to two color regions having a relatively large difference in absorbance in an absorption spectrum of the dye.
- the processor preferably derives the evaluation information separately for a perivascular region and a non-perivascular region other than the perivascular region, the perivascular region including a periphery of a blood vessel passing through the biological tissue.
- the sample is collected from a liver, and the processor derives the evaluation information separately for a pericentral region and the non-perivascular region, the pericentral region including a periphery of a central vein passing through the liver.
- the processor preferably derives a numerical value related to at least one of an area or a length of the fibrotic region as the evaluation information.
- the processor preferably detects the fibrotic region after performing compression processing on the acquired sample image.
- a processor executes: an acquisition process of acquiring a sample image obtained by imaging a sample of a biological tissue stained with a dye, the sample image having pixel values of a plurality of color channels; a detection process of detecting a fibrotic region of the biological tissue by comparing a ratio between pixel values of two color channels among the plurality of color channels with a preset threshold value; a derivation process of deriving evaluation information indicating a degree of fibrosis of the biological tissue based on the detected fibrotic region; and an output process of outputting the evaluation information.
- the program causes a processor to execute: an acquisition process of acquiring a sample image obtained by imaging a sample of a biological tissue stained with a dye, the sample image having pixel values of a plurality of color channels; a detection process of detecting a fibrotic region of the biological tissue by comparing a ratio between pixel values of two color channels among the plurality of color channels with a preset threshold value; a derivation process of deriving evaluation information indicating a degree of fibrosis of the biological tissue based on the detected fibrotic region; and an output process of outputting the evaluation information.
- a pathological diagnosis support apparatus an operation method for a pathological diagnosis support apparatus, and an operation program for a pathological diagnosis support apparatus, by which the detection accuracy of the fibrotic region can be improved.
- a biopsy needle 10 is inserted into a liver LV from the outside of a body of a patient P under monitoring by an ultrasonic observation apparatus (omitted from illustration), and an elongated test substance 11 is collected from the liver LV.
- the test substance 11 is embedded in paraffin, and then sliced into a plurality of slices 12 by a microtome, and the sliced slices 12 are attached to pieces of glass 13. Subsequently, the paraffin is removed, the slices 12 are stained with a dye, and the stained slices 12 are covered with cover glasses 14 to complete samples 20.
- Sirius red is used as the dye.
- the liver LV is an example of a "biological tissue" according to the technology of the present disclosure.
- the samples 20 are each set in an imaging apparatus (omitted from illustration) such as a digital optical microscope and imaged.
- Sample images 21 of the samples 20 thus obtained are input to a pathological diagnosis support apparatus 25 as a sample image group 21G.
- a patient identification data (ID) for uniquely identifying the patient P, imaging date and time, and the like are attached to the sample images 21.
- the pixel values of the three color channels of RGB are assigned to pixels 30 of each sample image 21. Therefore, the sample image 21 is a full-color image.
- the pixel value is, for example, a numerical value in a range of 0 to 255.
- the sample 20 including the slice 12 is captured in the sample image 21.
- the slice 12 has a vascular region 32 and a parenchymal region 33.
- the vascular region 32 is a region of a blood vessel passing through the liver LV, such as a portal vein and a central vein.
- the vascular region 32 is hollow in the slice 12.
- the parenchymal region 33 is a region where hepatocytes of the liver LV are present.
- fibrotic regions 35 are present in perivascular regions 36, which are regions around vascular regions 32, and in places in the parenchymal region 33.
- perivascular regions 36 which are regions around vascular regions 32, and in places in the parenchymal region 33.
- a fibrotic region 35 connecting two blood vessels that is, bridging fibrosis, is also observed. Bridging fibrosis is referred to as P-P bridging when the two blood vessels are both in a portal vein region, or P-C bridging when the two blood vessels are a portal vein and a central vein.
- the pathological diagnosis support apparatus 25 is, for example, a desktop personal computer, and has a display 40 and an input device 41.
- the input device 41 is a keyboard, a mouse, a touch panel, or the like.
- the pathological diagnosis support apparatus 25 analyzes the sample image 21 to detect the fibrotic region 35. Then, the pathological diagnosis support apparatus 25 derives evaluation information 71 (see Fig. 3 and the like) such as the areal percentage of the fibrotic region 35, and displays the evaluation information 71 on the display 40.
- the computer constituting the pathological diagnosis support apparatus 25 includes a storage device 45, a memory 46, a central processing unit (CPU) 47, and a communication unit 48 in addition to the display 40 and the input device 41 described above. These are connected to each other via a busline 49.
- the storage device 45 is a hard disk drive incorporated in the computer constituting the pathological diagnosis support apparatus 25 or connected thereto through a cable or a network.
- the storage device 45 is a disk array in which a plurality of hard disk drives are continuously mounted.
- the storage device 45 stores a control program such as an operating system, various application programs, various types of data accompanying these programs, and the like.
- a solid-state drive may be used instead of the hard disk drive.
- the memory 46 is a work memory for the CPU 47 to execute processing.
- the CPU 47 loads a program stored in the storage device 45 to the memory 46 and performs processing in accordance with the program to generally control units of the computer.
- the communication unit 48 is a network interface that controls transmission of various types of information via a network such as a local area network (LAN).
- the display 40 displays various screens.
- the computer constituting the pathological diagnosis support apparatus 25 receives an input of an operation instruction from the input device 41 through various screens.
- an operation program 55 is stored in the storage device 45 of the pathological diagnosis support apparatus 25.
- the operation program 55 is an application program for causing the computer to function as the pathological diagnosis support apparatus 25. That is, the operation program 55 is an example of an "operation program of a pathological diagnosis support apparatus" according to the technology of the present disclosure.
- the storage device 45 also stores the sample image group 21G, a threshold value TH, and the like.
- the CPU 47 of the computer constituting the pathological diagnosis support apparatus 25 functions as a read/write (hereinafter abbreviated as RW) control unit 60, an instruction receiving unit 61, a detection unit 62, a derivation unit 63, and a display control unit 64 in cooperation with the memory 46 and the like.
- RW read/write
- the CPU 47 is an example of a "processor" according to the technology of the present disclosure.
- the RW control unit 60 controls storage of various types of data in the storage device 45 and reading out of various types of data in the storage device 45.
- the RW control unit 60 receives the sample image group 21G transmitted from the imaging apparatus, and stores it in the storage device 45.
- the RW control unit 60 reads out, from the storage device 45, the sample image group 21G for which the instruction receiving unit 61 has received an image analysis instruction by a user via the input device 41, and outputs it to the detection unit 62, the derivation unit 63, and the display control unit 64. That is, the RW control unit 60 performs an "acquisition process" according to the technology of the present disclosure.
- the image analysis instruction by the user via the input device 41 is issued by inputting and designating, for example, the patient ID and the imaging date and time attached to the sample image 21.
- the RW control unit 60 reads out the threshold value TH from the storage device 45, and outputs it to the detection unit 62.
- the instruction receiving unit 61 receives various instructions from the user via the input device 41.
- the various instructions include the above-described image analysis instruction.
- the detection unit 62 Based on the threshold value TH, the detection unit 62 detects the fibrotic region 35 from each of the plurality of sample images 21 constituting the sample image group 21G. That is, the detection unit 62 performs a "detection process" according to the technology of the present disclosure. The detection unit 62 outputs a detection result 70 of the fibrotic region 35 to the derivation unit 63 and the display control unit 64.
- the derivation unit 63 derives the evaluation information 71 indicating the degree of fibrosis of the liver LV based on the detection result 70. That is, the derivation unit 63 performs a "derivation process" according to the technology of the present disclosure.
- the derivation unit 63 outputs the evaluation information 71 to the display control unit 64.
- the display control unit 64 performs control to display various screens on the display 40.
- the various screens include an analysis result display screen 90 (see Fig. 12 ) representing a result of the image analysis.
- the display control unit 64 generates the analysis result display screen 90 based on the sample image group 21G, the detection result 70, and the evaluation information 71.
- the detection unit 62 calculates a ratio PV_R/PV_G between a pixel value PV_G of the G channel corresponding to the G region and a pixel value PV_R of the R channel corresponding to the R region for each pixel 30 of the sample image 21.
- the detection unit 62 log-transforms the ratio PV_R/PV_G to log(PV _R/PV_G) in order to obtain a numerical value that can be easily handled by a computer (see Fig. 5 ). Instead of the ratio PV_R/PV_G, a ratio PV_G/PV_R in which the denominator and the numerator are reversed may be calculated.
- the detection unit 62 compares log(PV_R/PV_G) with the threshold value TH.
- the detection unit 62 detects a pixel 30 in which log(PV_R/PV_G) is greater than or equal to the threshold value TH as the fibrotic region 35.
- the detection unit 62 detects a pixel 30 in which log(PV _R/PV_G) is less than the threshold value TH as a non-fibrotic region.
- the threshold value TH is a value empirically obtained from past knowledge.
- the detection unit 62 outputs a binarized image 80 as the detection result 70.
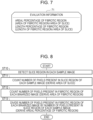
- the derivation unit 63 derives a numerical value related to at least one of the area or the length of the fibrotic region 35 as the evaluation information 71. More specifically, the evaluation information 71 includes the areal percentage of the fibrotic region 35 and the length percentage of the fibrotic region 35.
- the areal percentage of the fibrotic region 35 is a value obtained by dividing the area of the fibrotic region 35 by the area of the slice 12.
- the length percentage of the fibrotic region 35 is a value obtained by dividing the length of the fibrotic region 35 by the area of the slice 12.
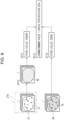
- Figs. 8 and 9 illustrate a procedure for deriving the areal percentage of the fibrotic region 35 in the derivation unit 63.
- the derivation unit 63 detects a region (hereinafter referred to as a slice region) 82 of the slice 12 in each of the plurality of sample images 21 constituting the sample image group 21G (step ST10).
- the derivation unit 63 determines a portion where a difference between pixel values of two adjacent pixels 30 is greater than or equal to a threshold value as a boundary between the slice 12 and the glass 13 outside the slice 12, and detects an inside of the boundary as the slice region 82.
- the derivation unit 63 counts the number of pixels 30 present in the slice region 82 of each sample image 21 to derive the area of the slice 12 captured in each sample image 21 (step ST11). In addition, the derivation unit 63 counts the number of pixels 30 present in the fibrotic region 35 of each binarized image 80 corresponding to each sample image 21 to derive the area of the fibrotic region 35 (step ST12).
- the derivation unit 63 divides the number of pixels 30 present in the fibrotic region 35 of each binarized image 80 counted in step ST12 by the number of pixels 30 present in the slice region 82 of each sample image 21 counted in step ST11 to derive the areal percentage of the fibrotic region 35 (step ST13).
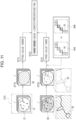
- Figs. 10 and 11 illustrate a procedure for deriving the length percentage of the fibrotic region 35 in the derivation unit 63.
- the procedure up to step ST10 and step ST11 is the same as the procedure for deriving the areal percentage of the fibrotic region 35 illustrated in Figs. 8 and 9 .
- the derivation unit 63 After deriving the area of the slice 12 captured in each sample image 21 in step ST11, the derivation unit 63 performs a thinning process on the fibrotic region 35 of each binarized image 80 corresponding to each sample image 21 (step ST20).
- the thinning process is a process of converting the fibrotic region 35 into a line 83 having a width of one pixel and passing through the center of the width of the fibrotic region 35.
- the derivation unit 63 counts the number of pixels 30 in the fibrotic region 35 after the thinning process, that is, the number of pixels 30 constituting the line 83, to derive the length of the fibrotic region 35 (step ST21). At this time, the derivation unit 63 counts the numbers of all pixels of the pixels 30 connected vertically, horizontally, and diagonally as 1, as illustrated in a two dot chain line frame 84A. Alternatively, the derivation unit 63 counts, among the pixels 30 constituting the line 83, the number of pixels 30 connected vertically and horizontally as 1, and the number of pixels 30 connected diagonally as ⁇ 2, as illustrated in a two dot chain line frame 84B. As the length of the fibrotic region 35, the method illustrated in the frame 84B is more accurate.
- the derivation unit 63 divides the number of pixels 30 in the fibrotic region 35 after the thinning process counted in step ST21 by the number of pixels 30 present in the slice region 82 of each sample image 21 counted in step ST11 to derive the length percentage of the fibrotic region 35 (step ST22).
- Fig. 11 illustrates, as an example, a case where the number of pixels 30 present in the slice region 82 of each sample image 21 is 100000, as in the case in Fig. 9 , and the number of pixels 30 in the fibrotic region 35 after the thinning process is 14000.
- Fig. 12 illustrates the analysis result display screen 90 displayed on the display 40 under the control of the display control unit 64.
- the sample image 21 is displayed in which the fibrotic region 35 detected by the detection unit 62 is painted in blue, for example.
- the sample image 21 displayed can be switched by operating a frame return button 91A and a frame advance button 91B.
- the evaluation information 71 is displayed in the lower part of the analysis result display screen 90. That is, the display control unit 64 performs an "output process" according to the technology of the present disclosure.
- a confirmation button 92 is provided next to the evaluation information 71.
- the display control unit 64 turns off the display of the analysis result display screen 90.
- the sample image 21 in which the fibrotic region 35 is distinguished in a specific color and the evaluation information 71 can be stored in the storage device 45 in response to an instruction from the user.
- the CPU 47 of the pathological diagnosis support apparatus 25 functions as the RW control unit 60, the instruction receiving unit 61, the detection unit 62, the derivation unit 63, and the display control unit 64.
- the RW control unit 60 reads out, from the storage device 45, the sample image group 21G for which the user has issued an image analysis instruction (step ST100).
- the sample image group 21G is output from the RW control unit 60 to the detection unit 62, the derivation unit 63, and the display control unit 64.
- the RW control unit 60 reads out the threshold value TH from the storage device 45, and outputs it to the detection unit 62.
- Step ST100 is an example of an "acquisition process" according to the technology of the present disclosure.
- the detection unit 62 calculates the ratio PV_R/PV_G between the pixel value PV_G of the G channel and the pixel value PV_R of the R channel for each pixel 30 of the sample image 21 (step ST110). Subsequently, as illustrated in Fig. 5 , the logarithm log(PV_R/PV_G) of the ratio PV_R/PV_G is compared with the threshold value TH.
- Step ST120 the pixels 30 in which log(PV _R/PV_G) is greater than or equal to the threshold value TH are detected as the fibrotic region 35, and the pixels 30 in which log (PV_R/PV_G) is less than the threshold value TH are detected as the non-fibrotic region (step ST120).
- the detection unit 62 generates the binarized image 80 illustrated in Fig. 6 as the detection result 70 of the fibrotic region 35.
- the detection unit 62 outputs the detection result 70 to the derivation unit 63 and the display control unit 64.
- Step ST120 is an example of a "detection process" according to the technology of the present disclosure.
- the derivation unit 63 derives the areal percentage of the fibrotic region 35 and the length percentage of the fibrotic region 35 as the evaluation information 71 (step ST130).
- the evaluation information 71 is output from the derivation unit 63 to the display control unit 64.
- Step ST130 is an example of a "derivation process" according to the technology of the present disclosure.
- Step ST140 Under the control of the display control unit 64, the analysis result display screen 90 illustrated in Fig. 12 is displayed on the display 40 (step ST140). Accordingly, the fibrotic region 35 and the evaluation information 71 are presented to the user. The user grasps the degree of fibrosis in the liver LV of the patient P who is a target of pathological diagnosis on the analysis result display screen 90.
- Step ST140 is an example of an "output process" according to the technology of the present disclosure.
- the pathological diagnosis support apparatus 25 includes the RW control unit 60, the detection unit 62, the derivation unit 63, and the display control unit 64.
- the RW control unit 60 acquires the sample image 21 obtained by imaging the sample 20 of the liver LV stained with Sirius red by reading it out from the storage device 45.
- the detection unit 62 detects the fibrotic region 35 of the liver LV by comparing, with the preset threshold value TH, the ratio PV_R/PV_G between the pixel values PV_G and PV_R of the G channel and the R channel among the three color channels of RGB of the sample image 21.
- the derivation unit 63 derives the evaluation information 71 indicating the degree of fibrosis of the liver LV based on the detected fibrotic region 35.
- the display control unit 64 outputs the evaluation information 71 by displaying the analysis result display screen 90 including the evaluation information 71 on the display 40.
- the ratio PV_R/PV_G is more robust than the pixel value PV_G or PV_R itself with respect to changes in the color of staining due to differences in the concentration of Sirius red, the ambient environment, the imaging apparatus of the sample image 21, and the like. This can improve the detection accuracy of the fibrotic region 35. Therefore, the fibrotic region 35, which has been detected intermittently due to low detection accuracy of the fibrotic region 35 in spite of actual bridging fibrosis, can be reliably recognized as bridging fibrosis.
- the detection unit 62 calculates the ratio PV_R/PV_G between the pixel values PV_G and PV_R of the G channel and the R channel corresponding to the G region and the R region in which the difference in absorbance is relatively large. Therefore, it is possible to widen the dynamic range of the ratio and further improve the detection accuracy of the fibrotic region 35.
- the derivation unit 63 derives, as the evaluation information 71, a numerical value related to at least one of the area or the length of the fibrotic region 35, specifically, the areal percentage of the fibrotic region 35 and the length percentage of the fibrotic region 35. Therefore, the degree of fibrosis of the liver LV can be objectively evaluated.
- the numerical value related to the length of the fibrotic region 35 is relatively large, it can be estimated that fibrosis has progressed in a relatively wide range of the liver LV.
- the dye is not limited to Sirius red illustrated as an example.
- iron hematoxylin, Ponceau xylidine, acid fuchsin, and aniline blue used for Masson's trichrome staining may be used.
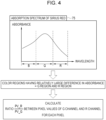
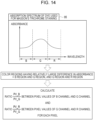
- the dye used for Masson's trichrome staining as illustrated in an absorption spectrum 95 in Fig. 14 , the absorbance in the G region is relatively high, and the absorbances in the B region and the R region are relatively low. In addition, there is almost no difference in absorbance between the B region and the R region.
- the detection unit 62 calculates a ratio PV_B/PV_G between the pixel value PV_B of the B channel corresponding to the B region and the pixel value PV_G of the G channel corresponding to the G region, and the ratio PV_R/PV_G between the pixel value PV_G of the G channel corresponding to the G region and the pixel value PV_R of the R channel corresponding to the R region, for each pixel 30 of the sample image 21.
- the detection unit 62 log-transforms the ratio PV_B/PV_G to log(PV_B/PV_G) and log-transforms the ratio PV_R/PV_G to log (PV_R/PV_G) (see Fig. 15 ).
- a ratio PV_G/PV_B and a ratio PV_G/PV_R may be calculated.
- the detection unit 62 compares log(PV_B/PV_G) with a first threshold value TH1. In addition, the detection unit 62 compares log(PV _R/PV_G) with a second threshold value TH2. The detection unit 62 detects a pixel 30 in which log(PV _B/PV_G) is greater than or equal to the first threshold value TH1 and log(PV _R/PV_G) is greater than or equal to the second threshold value TH2 as the fibrotic region 35.
- the detection unit 62 detects a pixel 30 in which log(PV _B/PV_G) is less than the first threshold value TH1 or log(PV _R/PV_G) is less than the second threshold value TH2 as the non-fibrotic region.
- the first threshold value TH1 and the second threshold value TH2 are values empirically obtained from past knowledge.
- the ratio between the pixel values of the two color channels calculated for detecting the fibrotic region 35 is not limited to one type.
- a pixel 30 in which log(PV_B/PV_G) is less than the first threshold value TH1 and log (PV_R/PV_G) is less than the second threshold value TH2 may be detected as the non-fibrotic region
- a pixel 30 in which log (PV _B/PV_G) is greater than or equal to the first threshold value TH1 or log (PV _R/PV_G) is greater than or equal to the second threshold value TH2 may be detected as the fibrotic region 35.
- the evaluation information 71 is not limited to the areal percentage of the fibrotic region 35 and the length percentage of the fibrotic region 35 illustrated as examples above.
- the areal percentage of the fibrotic region 35 may be changed to five levels representing the degrees of fibrosis with reference to a table 97 illustrated in Fig. 16 , and the levels may be derived as evaluation information 101 (see Fig. 17 ).
- levels corresponding to ranges of the areal percentage of the fibrotic region 35 are registered. For example, level 0 is registered when the areal percentage of the fibrotic region 35 is 0% or more and less than 5%, level 3 is registered when the areal percentage is 20% or more and less than 30%, and level 4 is registered when the areal percentage is 30% or more.
- the table 97 is stored in the storage device 45, and is read out by the RW control unit 60 and output to the derivation unit 63.
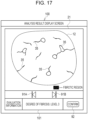
- Fig. 17 illustrates an analysis result display screen 100 on which a level indicating the degree of fibrosis is displayed as the evaluation information 101.
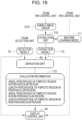
- stages of known fibrosis evaluation indexes such as new Inuyama classification and METAVIR score may be derived and output as evaluation information 106.
- Each stage of the new Inuyama classification and the METAVIR score is derived from an estimation expression using, for example, the areal percentage of the fibrotic region 35 and the length percentage of the fibrotic region 35 as parameters and using the stage as a solution.
- NAFLD non-alcoholic fatty liver disease
- NAS non-alcoholic fatty liver disease activity score
- evaluation information 113 is derived separately for the perivascular region 36 and a non-perivascular region 115 other than the perivascular region 36.
- a CPU of a pathological diagnosis support apparatus functions as an extraction unit 110 in addition to the units 60 to 64 (omitted from the illustration in Fig. 19 except the derivation unit 63 and the display control unit 64) according to the first embodiment above.
- the extraction unit 110 extracts the perivascular region 36 and the non-perivascular region 115 from each of the sample images 21 constituting the sample image group 21G using a machine learning model 111.
- the machine learning model 111 is, for example, a convolutional neural network such as U-shaped neural network (U-Net), SegNet, residual network (ResNet), or densely connected convolutional network (DenseNet).
- U-Net U-shaped neural network
- SegNet residual network
- DenseNet densely connected convolutional network
- the machine learning model 111 is stored in the storage device 45, and is read out by the RW control unit 60 and output to the extraction unit 110.
- the machine learning model 111 is a model in which the sample image 21 is used as an input image, and a binarized image in which the pixels 30 in the perivascular region 36 are replaced with white and the pixels 30 in the non-perivascular region 115 are replaced with black is used as an output image as illustrated in Fig. 20 , for example.
- the machine learning model 111 extracts, for example, a region having a width of about 20 pixels surrounding the periphery of the vascular region 32 as the perivascular region 36.
- the machine learning model 111 extracts the pixels 30 of the slice 12 other than the pixels 30 extracted as the perivascular region 36 as the non-perivascular region 115.
- the non-perivascular region 115 includes the vascular region 32 and most of the parenchymal region 33.
- the machine learning model 111 is trained using a plurality of sets of a sample image 21 for learning and a correct image in which the perivascular region 36 of the sample image 21 for learning is designated by a user's hand.
- the extraction unit 110 outputs the binarized image in which the pixels 30 in the perivascular region 36 are replaced with white and the pixels 30 in the non-perivascular region 115 are replaced with black to the derivation unit 63 and the display control unit 64 as an extraction result 112.
- the derivation unit 63 Based on the extraction result 112 from the extraction unit 110 and the detection result 70 from the detection unit 62, the derivation unit 63 derives, as the evaluation information 113, the areal percentage of the fibrotic region 35 in the perivascular region 36 and the length percentage of the fibrotic region 35 in the perivascular region 36.
- the derivation unit 63 derives, as the evaluation information 113, the areal percentage of the fibrotic region 35 in the non-perivascular region 115 and the length percentage of the fibrotic region 35 in the non-perivascular region 115.
- the areal percentage of the fibrotic region 35 in the non-perivascular region 36 is derived in step ST12 illustrated in Figs. 8 and 9 by counting the number of pixels 30 present in the fibrotic region 35 in the non-perivascular region 36 and then dividing this by the number of pixels 30 present in the slice region 82 of each sample image 21 counted in step ST11.
- the length percentage of the fibrotic region 35 in the non-perivascular region 36 is derived in step ST21 illustrated in Figs. 10 and 11 by counting the number of pixels 30 in the fibrotic region 35 in the non-perivascular region 36 after the thinning process and then dividing this by the number of pixels 30 present in the slice region 82 of each sample image 21 counted in step ST11.
- the display control unit 64 displays an analysis result display screen 120 illustrated in Fig. 21 on the display 40.
- the analysis result display screen 120 as also illustrated in Fig. 22 which is an enlarged view of a frame 121, the sample image 21 is displayed in which the fibrotic region 35 in the perivascular region 36 is painted in green, for example, and the fibrotic region 35 in the non-perivascular region 115 is painted in blue, for example.
- the evaluation information 113 the areal percentage and the length percentage of the fibrotic region 35 in the perivascular region 36 and the areal percentage and the length percentage of the fibrotic region 35 in the non-perivascular region 115 are displayed.
- the evaluation information 71 is derived separately for the perivascular region 36 and the non-perivascular region 115. Therefore, it is possible to evaluate a disease for which the progression of fibrosis is mainly observed in the perivascular region 36 and a disease for which the progression of fibrosis is mainly observed in the non-perivascular region 115 while distinguishing the disease states from each other.
- a fatty liver is intentionally caused by injecting a drug such as carbon tetrachloride. Therefore, in any case, fibrosis is likely to progress in the perivascular region 36 due to the influence of the drug. Therefore, when the evaluation information 71 is derived separately for the perivascular region 36 and the non-perivascular region 115 as in the second embodiment, it is possible to evaluate the degree of fibrosis excluding the influence of the drug.
- the colors of the fibrotic region 35 in the perivascular region 36 and the fibrotic region 35 in the non-perivascular region 115 are different, and the areal percentage and the length percentage of the fibrotic region 35 in the perivascular region 36 and the areal percentage and the length percentage of the fibrotic region 35 in the non-perivascular region 115 are displayed as the evaluation information 113.
- the present disclosure is not limited to this.
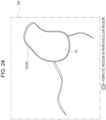
- only the fibrotic region 35 in the perivascular region 36 may be painted in green, for example (see also Fig.
- a frame 126 which is an enlarged view of a frame 126
- only the areal percentage and the length percentage of the fibrotic region 35 in the perivascular region 36 may be displayed as the evaluation information 127.
- only the fibrotic region 35 in the non-perivascular region 115 may be painted in blue, for example, and only the areal percentage and the length percentage of the fibrotic region 35 in the non-perivascular region 115 may be displayed as the evaluation information.
- the display mode illustrated in Fig. 21 , the display mode illustrated in Fig. 23 , and the display mode opposite to the case of Fig. 23 may be configured to be switchable.
- the perivascular region 36 may be extracted without using the machine learning model 111.
- the vascular region 32 is extracted using a known image recognition technique, and a region surrounding the periphery of the extracted vascular region 32 and having a width of 20 pixels, for example, is extracted as the perivascular region 36.
- the user may be caused to designate the perivascular region 36.
- evaluation information 133 is derived separately for a pericentral region 36C and the non-perivascular region 115.
- the pericentral region 36C includes the periphery of the central vein passing through the liver LV.
- an extraction unit 130 extracts the pericentral region 36C, a periportal region 36P, and the non-perivascular region 115 from each of the sample images 21 constituting the sample image group 21G using a machine learning model 131.
- the machine learning model 131 is a convolutional neural network such as U-Net, similarly to the machine learning model 111 according to the second embodiment above.
- the machine learning model 131 is stored in the storage device 45, and is read out by the RW control unit 60 and output to the extraction unit 130.
- the machine learning model 131 is a model in which the sample image 21 is used as an input image, and a binarized image in which the pixels 30 in the pericentral region 36C are replaced with white and the pixels 30 in the non-perivascular region 115 are replaced with black is used as an output image as illustrated in Fig. 26 , for example.
- the machine learning model 131 extracts, for example, a region having a width of about 20 pixels surrounding the periphery of a central vein region 32C as the pericentral region 36C. Similarly, the machine learning model 131 extracts, for example, a region having a width of about 20 pixels surrounding the periphery of a portal vein region 32P as the periportal region 36C. In addition, the machine learning model 131 extracts the pixels 30 of the slice 12 other than the pixels 30 extracted as the pericentral region 36C and the periportal region 36P as the non-perivascular region 115. The machine learning model 131 is trained using a plurality of sets of a sample image 21 for learning and a correct image in which the pericentral region 36C and the periportal region 36P of the sample image 21 for learning are designated by a user's hand.
- the extraction unit 130 outputs the binarized image in which the pixels 30 in the pericentral region 36C are replaced with white and the pixels 30 in the non-perivascular region 115 are replaced with black to the derivation unit 63 and the display control unit 64 as an extraction result 132.
- the derivation unit 63 Based on the extraction result 132 from the extraction unit 130 and the detection result 70 from the detection unit 62, the derivation unit 63 derives, as the evaluation information 133, the areal percentage of the fibrotic region 35 in the pericentral region 36C and the length percentage of the fibrotic region 35 in the pericentral region 36C.
- the derivation unit 63 derives, as the evaluation information 133, the areal percentage of the fibrotic region 35 in the non-perivascular region 115 and the length percentage of the fibrotic region 35 in the non-perivascular region 115.
- the areal percentage of the fibrotic region 35 in the pericentral region 36C is derived in step ST12 illustrated in Figs. 8 and 9 by counting the number of pixels 30 present in the fibrotic region 35 in the pericentral region 36C and then dividing this by the number of pixels 30 present in the slice region 82 of each sample image 21 counted in step ST11.
- the length percentage of the fibrotic region 35 in the pericentral region 36C is derived in step ST21 illustrated in Figs. 10 and 11 by counting the number of pixels 30 in the fibrotic region 35 in the perivascular region 36 after the thinning process and then dividing this by the number of pixels 30 present in the slice region 82 of each sample image 21 counted in step ST11.
- the display control unit 64 displays an analysis result display screen 140 illustrated in Fig. 27 on the display 40.
- the analysis result display screen 140 as also illustrated in Fig. 28 which is an enlarged view of a frame 141, the sample image 21 is displayed in which the fibrotic region 35 in the pericentral region 36C is painted in green, for example, and the fibrotic region 35 in the non-perivascular region 115 is painted in blue, for example.
- the evaluation information 133 the areal percentage and the length percentage of the fibrotic region 35 in the pericentral region 36C and the areal percentage and the length percentage of the fibrotic region 35 in the non-perivascular region 115 are displayed.
- the evaluation information 71 is derived separately for the pericentral region 36C and the non-perivascular region 115. Therefore, it is possible to correctly evaluate the state of a disease such as non-alcoholic steatohepatitis (NASH) in which fibrosis progresses from the pericentral region 36C toward the non-perivascular region 115.
- NASH non-alcoholic steatohepatitis
- only the fibrotic region 35 in the pericentral region 36C may be painted in green, for example, and only the areal percentage and the length percentage of the fibrotic region 35 in the pericentral region 36C may be displayed as the evaluation information.
- This display mode and the display mode illustrated in Fig. 27 may be configured to be switchable.
- the pericentral region 36C may be extracted without using the machine learning model 111 by, for example, causing the user to designate the pericentral region 36C.
- evaluation information 142 illustrated in Fig. 29A not only the areal percentage and the length percentage of the fibrotic region 35 in the pericentral region 36C, but also the areal percentage and the length percentage of the fibrotic region 35 in the periportal region 36P may be derived.
- evaluation information 143 illustrated in Fig. 29B bridging fibrosis between portal veins, that is, the number of P-P bridges, and bridging fibrosis between a portal vein and a central vein, that is, the number of P-C bridges may be derived.
- a fourth embodiment illustrated in Fig. 30 after the sample images 21 are subjected to compression processing, the fibrotic region 35 is detected.
- a CPU of a pathological diagnosis support apparatus functions as a compression unit 150 in addition to the units 60 to 64 (omitted from the illustration in Fig. 30 except the detection unit 62) according to the first embodiment above.
- the sample image group 21G read out from the storage device 45 by the RW control unit 60 is input to the compression unit 150.
- the compression unit 150 performs compression processing on each of the plurality of sample images 21 constituting the sample image group 21G.
- the compression unit 150 outputs the sample image group 21G after the compression processing to the detection unit 62.
- the detection unit 62 detects the fibrotic region 35 from the compressed sample image 21, and outputs the detection result 70 to the derivation unit 63 and the like.
- the detection unit 62 detects the fibrotic region 35. Therefore, it is possible to reduce a processing load as compared with a case where the fibrotic region 35 is detected from the full-size sample images 21.
- a sample 156 may be prepared from a test substance 155 collected from a lung LG of the patient P using the biopsy needle 10. It may also be a sample collected from skin, breast, stomach, large intestine, and the like.
- the color channels of the pixel values of the sample image 21 are not limited to the illustrated RGB color channels. They may be four color channels of CMYG (Cyan, Magenta, Yellow, and Green).
- the output form of the evaluation information is not limited to the form of displaying on the analysis result display screen.
- the evaluation information may be printed out on a paper medium, or a data file of the evaluation information may be transmitted and output by e-mail or the like.
- the pathological diagnosis support apparatus may be configured by a plurality of computers separated as hardware for the purpose of improving processing capability and reliability.
- the functions of the RW control unit 60 and the instruction receiving unit 61 and the functions of the detection unit 62, the derivation unit 63, and the display control unit 64 are distributed to two computers. In this case, two computers constitute the pathological diagnosis support apparatus.
- the hardware configuration of the computer of the pathological diagnosis support apparatus can be changed as appropriate in accordance with required performance such as processing capability, safety, and reliability.
- application programs such as the operation program 55 can be duplicated or distributed and stored in a plurality of storage devices for the purpose of ensuring safety and reliability.
- processors include, in addition to the CPU 47, which is a general-purpose processor functioning as various processing units by executing software (the operation program 55), a programmable logic device (PLD) that is a processor in which the circuit configuration is changeable after manufacture, such as field programmable gate array (FPGA), a dedicated electric circuit that is a processor having a circuit configuration that is specially designed to execute specific processing, such as an application specific integrated circuit (ASIC), and the like.
- PLD programmable logic device
- FPGA field programmable gate array
- ASIC application specific integrated circuit
- One processing unit may be constituted by one of these various processors, or may be constituted by two or more processors of the same type or different types in combination (e.g., a combination of a plurality of FPGAs, and/or a combination of a CPU and an FPGA).
- a plurality of processing units may be configured as one processor.
- one processor may be constituted by a combination of one or more CPUs and software, and this processor may function as a plurality of processing units, as typified by a computer such as a client or a server.
- a processor may be used that implements the functions of the entire system including a plurality of processing units as one integrated circuit (IC) chip, as typified by a system on chip (SoC) or the like.
- IC integrated circuit
- SoC system on chip
- these various processors may be electric circuitry constituted by combining circuit elements such as semiconductor elements.
- a and/or B is synonymous with “at least one of A or B". That is, “A and/or B” means that A may be employed alone, B may be employed alone, or A and B may be employed in combination. In addition, in the present specification, when three or more matters are expressed by being combined with “and/or", the same concept as “A and/or B" is applied.
Landscapes
- Engineering & Computer Science (AREA)
- Health & Medical Sciences (AREA)
- Physics & Mathematics (AREA)
- Life Sciences & Earth Sciences (AREA)
- General Health & Medical Sciences (AREA)
- General Physics & Mathematics (AREA)
- Medical Informatics (AREA)
- Biomedical Technology (AREA)
- Computer Vision & Pattern Recognition (AREA)
- Theoretical Computer Science (AREA)
- Chemical & Material Sciences (AREA)
- Radiology & Medical Imaging (AREA)
- Nuclear Medicine, Radiotherapy & Molecular Imaging (AREA)
- Public Health (AREA)
- Pathology (AREA)
- Immunology (AREA)
- Primary Health Care (AREA)
- Epidemiology (AREA)
- Analytical Chemistry (AREA)
- Biochemistry (AREA)
- Urology & Nephrology (AREA)
- Molecular Biology (AREA)
- Hematology (AREA)
- Quality & Reliability (AREA)
- Medicinal Chemistry (AREA)
- Food Science & Technology (AREA)
- Biophysics (AREA)
- Spectroscopy & Molecular Physics (AREA)
- Optics & Photonics (AREA)
- Geometry (AREA)
- Proteomics, Peptides & Aminoacids (AREA)
- Biotechnology (AREA)
- Cell Biology (AREA)
- Microbiology (AREA)
- Data Mining & Analysis (AREA)
- Databases & Information Systems (AREA)
- Investigating Or Analysing Biological Materials (AREA)
- Investigating Or Analysing Materials By Optical Means (AREA)
Abstract
Description
- The technology of the present disclosure relates to a pathological diagnosis support apparatus, an operation method for a pathological diagnosis support apparatus, and an operation program for a pathological diagnosis support apparatus.
- In pathological diagnosis, the degree of fibrosis of a biological tissue leading to a risk of a disease such as cancer is evaluated. Conventionally, a pathologist observes a sample collected from the biological tissue under a microscope and visually evaluates the degree of fibrosis. However, such an evaluation method imposes a heavy burden on the pathologist. Furthermore, the evaluation may vary depending on the skill level of the pathologist.
- Therefore, for example, as in Vincenza Calvaruso et al., "Computer-Assisted Image Analysis of Liver Collagen: Relationship to Ishak Scoring and Hepatic Venous Pressure Gradient", published in April 2009, HEPATOLOGY (49), pp. 1236-1244, a method has been proposed in which an image of a sample (hereinafter referred to as a sample image) is analyzed by a computer to detect a fibrotic region, and the areal percentage of the fibrotic region or the like is derived and presented to a user such as a pathologist. Vincenza Calvaruso et al., "Computer-Assisted Image Analysis of Liver Collagen: Relationship to Ishak Scoring and Hepatic Venous Pressure Gradient", published in April 2009, HEPATOLOGY (49), pp. 1236-1244 uses a sample image of a sample in which a fibrotic region is stained with a dye such as Sirius red. Then, the fibrotic region is detected by comparing pixel values of color channels of RGB (Red, Green, and Blue) of the sample image with a threshold value that is preset by a user.
- The fibrotic region is not uniformly stained with the same color by staining with a dye such as Sirius red. For example, the color changes depending on the concentration of the dye or the ambient environment such as temperature and humidity. In addition, the color also changes depending on the difference in the imaging apparatus of the sample image. Therefore, as disclosed in Vincenza Calvaruso et al., "Computer-Assisted Image Analysis of Liver Collagen: Relationship to Ishak Scoring and Hepatic Venous Pressure Gradient", published in April 2009, HEPATOLOGY (49), pp. 1236-1244, a method for detecting a fibrotic region by simply comparing the pixel values of RGB color channels of the sample image with the threshold value has low detection accuracy of the fibrotic region.
- An object of the technology of the present disclosure is to provide a pathological diagnosis support apparatus, an operation method for a pathological diagnosis support apparatus, and an operation program for a pathological diagnosis support apparatus, by which the detection accuracy of the fibrotic region can be improved.
- In order to achieve the above object, a pathological diagnosis support apparatus according to the present disclosure includes at least one processor, in which the processor is configured to: acquire a sample image obtained by imaging a sample of a biological tissue stained with a dye, the sample image having pixel values of a plurality of color channels; detect a fibrotic region of the biological tissue by comparing a ratio between pixel values of two color channels among the plurality of color channels with a preset threshold value; derive evaluation information indicating a degree of fibrosis of the biological tissue based on the detected fibrotic region; and output the evaluation information.
- The processor preferably calculates a ratio between pixel values of two color channels corresponding to two color regions having a relatively large difference in absorbance in an absorption spectrum of the dye.
- The processor preferably derives the evaluation information separately for a perivascular region and a non-perivascular region other than the perivascular region, the perivascular region including a periphery of a blood vessel passing through the biological tissue.
- The sample is collected from a liver, and the processor derives the evaluation information separately for a pericentral region and the non-perivascular region, the pericentral region including a periphery of a central vein passing through the liver.
- The processor preferably derives a numerical value related to at least one of an area or a length of the fibrotic region as the evaluation information.
- The processor preferably detects the fibrotic region after performing compression processing on the acquired sample image.
- In an operation method for a pathological diagnosis support apparatus according to the present disclosure, a processor executes: an acquisition process of acquiring a sample image obtained by imaging a sample of a biological tissue stained with a dye, the sample image having pixel values of a plurality of color channels; a detection process of detecting a fibrotic region of the biological tissue by comparing a ratio between pixel values of two color channels among the plurality of color channels with a preset threshold value; a derivation process of deriving evaluation information indicating a degree of fibrosis of the biological tissue based on the detected fibrotic region; and an output process of outputting the evaluation information.
- In an operation program for a pathological diagnosis support apparatus according to the present disclosure, the program causes a processor to execute: an acquisition process of acquiring a sample image obtained by imaging a sample of a biological tissue stained with a dye, the sample image having pixel values of a plurality of color channels; a detection process of detecting a fibrotic region of the biological tissue by comparing a ratio between pixel values of two color channels among the plurality of color channels with a preset threshold value; a derivation process of deriving evaluation information indicating a degree of fibrosis of the biological tissue based on the detected fibrotic region; and an output process of outputting the evaluation information.
- According to the technology of the present disclosure, it is possible to provide a pathological diagnosis support apparatus, an operation method for a pathological diagnosis support apparatus, and an operation program for a pathological diagnosis support apparatus, by which the detection accuracy of the fibrotic region can be improved.
-
-
Fig. 1 is a diagram illustrating a pathological diagnosis process, a sample image, and a pathological diagnosis support apparatus; -
Fig. 2 is a block diagram illustrating a computer constituting the pathological diagnosis support apparatus; -
Fig. 3 is a block diagram illustrating a processing unit of a central processing unit (CPU) of the pathological diagnosis support apparatus; -
Fig. 4 is a diagram illustrating processing performed by a detection unit according to an absorption spectrum of Sirius red; -
Fig. 5 is a diagram illustrating processing performed by the detection unit in a case of staining with Sirius red; -
Fig. 6 is a diagram illustrating detection results; -
Fig. 7 is a diagram illustrating evaluation information; -
Fig. 8 is a flowchart illustrating a procedure for deriving an areal percentage of a fibrotic region; -
Fig. 9 is a diagram illustrating the procedure for deriving the areal percentage of the fibrotic region; -
Fig. 10 is a flowchart illustrating a procedure for deriving a length percentage of a fibrotic region; -
Fig. 11 is a diagram illustrating the procedure for deriving the length percentage of the fibrotic region; -
Fig. 12 is a diagram illustrating an analysis result display screen; -
Fig. 13 is a flowchart illustrating a processing procedure of the pathological diagnosis support apparatus; -
Fig. 14 is a diagram illustrating processing performed by the detection unit according to an absorption spectrum of a dye used for Masson's trichrome staining; -
Fig. 15 is a diagram illustrating processing performed by the detection unit in a case of Masson's trichrome staining; -
Fig. 16 is a diagram illustrating a table in which levels representing degrees of fibrosis corresponding to ranges of the areal percentage of the fibrotic region are registered; -
Fig. 17 is a diagram illustrating another example of the analysis result display screen; -
Fig. 18 is a diagram illustrating another example of the analysis result display screen; -
Fig. 19 is a diagram illustrating a processing unit according to a second embodiment; -
Fig. 20 is a diagram illustrating a state in which a perivascular region and a non-perivascular region are extracted by a machine learning model; -
Fig. 21 is a diagram illustrating an analysis result display screen according to the second embodiment; -
Fig. 22 is an enlarged view of a sample image displayed on the analysis result display screen illustrated inFig. 21 ; -
Fig. 23 is a diagram illustrating another example of the analysis result display screen according to the second embodiment; -
Fig. 24 is an enlarged view of a sample image displayed on the analysis result display screen illustrated inFig. 23 ; -
Fig. 25 is a diagram illustrating a processing unit according to a third embodiment; -
Fig. 26 is a diagram illustrating a state in which a pericentral region, a periportal region, and a non-perivascular region are extracted by a machine learning model; -
Fig. 27 is a diagram illustrating an analysis result display screen according to the third embodiment; -
Fig. 28 is an enlarged view of a sample image displayed on the analysis result display screen illustrated inFig. 27 ; -
Figs. 29A and 29B are diagrams illustrating other examples of evaluation information according to the third embodiment, in whichFig. 29A illustrates evaluation information including an areal percentage and a length percentage of a fibrotic region in a periportal region, andFig. 29B illustrates evaluation information including the number of P-P bridges and the number of P-C bridges; -
Fig. 30 is a diagram illustrating a processing unit according to a fourth embodiment; and -
Fig. 31 illustrates a sample collected from a lung of a patient. - In
Fig. 1 , pathological diagnosis is performed, for example, through the following steps. First, abiopsy needle 10 is inserted into a liver LV from the outside of a body of a patient P under monitoring by an ultrasonic observation apparatus (omitted from illustration), and anelongated test substance 11 is collected from the liver LV. Thetest substance 11 is embedded in paraffin, and then sliced into a plurality ofslices 12 by a microtome, and the slicedslices 12 are attached to pieces ofglass 13. Subsequently, the paraffin is removed, theslices 12 are stained with a dye, and the stained slices 12 are covered withcover glasses 14 to completesamples 20. In the present example, Sirius red is used as the dye. The liver LV is an example of a "biological tissue" according to the technology of the present disclosure. - The
samples 20 are each set in an imaging apparatus (omitted from illustration) such as a digital optical microscope and imaged.Sample images 21 of thesamples 20 thus obtained are input to a pathologicaldiagnosis support apparatus 25 as asample image group 21G. A patient identification data (ID) for uniquely identifying the patient P, imaging date and time, and the like are attached to thesample images 21. - As illustrated in Table 31, the pixel values of the three color channels of RGB are assigned to
pixels 30 of eachsample image 21. Therefore, thesample image 21 is a full-color image. The pixel value is, for example, a numerical value in a range of 0 to 255. - The
sample 20 including theslice 12 is captured in thesample image 21. Theslice 12 has avascular region 32 and aparenchymal region 33. Thevascular region 32 is a region of a blood vessel passing through the liver LV, such as a portal vein and a central vein. Thevascular region 32 is hollow in theslice 12. Theparenchymal region 33 is a region where hepatocytes of the liver LV are present. - Sirius red stains a fibrotic region 35 (more specifically, the region of collagen fibers) red. In the
sample image 21 illustrated inFig. 1 ,fibrotic regions 35 are present inperivascular regions 36, which are regions aroundvascular regions 32, and in places in theparenchymal region 33. In addition, as surrounded by a two dotchain line frame 37, afibrotic region 35 connecting two blood vessels, that is, bridging fibrosis, is also observed. Bridging fibrosis is referred to as P-P bridging when the two blood vessels are both in a portal vein region, or P-C bridging when the two blood vessels are a portal vein and a central vein. - The pathological
diagnosis support apparatus 25 is, for example, a desktop personal computer, and has adisplay 40 and aninput device 41. Theinput device 41 is a keyboard, a mouse, a touch panel, or the like. The pathologicaldiagnosis support apparatus 25 analyzes thesample image 21 to detect thefibrotic region 35. Then, the pathologicaldiagnosis support apparatus 25 derives evaluation information 71 (seeFig. 3 and the like) such as the areal percentage of thefibrotic region 35, and displays theevaluation information 71 on thedisplay 40. - In
Fig. 2 , the computer constituting the pathologicaldiagnosis support apparatus 25 includes astorage device 45, amemory 46, a central processing unit (CPU) 47, and acommunication unit 48 in addition to thedisplay 40 and theinput device 41 described above. These are connected to each other via abusline 49. - The
storage device 45 is a hard disk drive incorporated in the computer constituting the pathologicaldiagnosis support apparatus 25 or connected thereto through a cable or a network. Alternatively, thestorage device 45 is a disk array in which a plurality of hard disk drives are continuously mounted. Thestorage device 45 stores a control program such as an operating system, various application programs, various types of data accompanying these programs, and the like. A solid-state drive may be used instead of the hard disk drive. - The
memory 46 is a work memory for theCPU 47 to execute processing. TheCPU 47 loads a program stored in thestorage device 45 to thememory 46 and performs processing in accordance with the program to generally control units of the computer. - The
communication unit 48 is a network interface that controls transmission of various types of information via a network such as a local area network (LAN). Thedisplay 40 displays various screens. The computer constituting the pathologicaldiagnosis support apparatus 25 receives an input of an operation instruction from theinput device 41 through various screens. - In
Fig. 3 , anoperation program 55 is stored in thestorage device 45 of the pathologicaldiagnosis support apparatus 25. Theoperation program 55 is an application program for causing the computer to function as the pathologicaldiagnosis support apparatus 25. That is, theoperation program 55 is an example of an "operation program of a pathological diagnosis support apparatus" according to the technology of the present disclosure. Thestorage device 45 also stores thesample image group 21G, a threshold value TH, and the like. - When the
operation program 55 is started, theCPU 47 of the computer constituting the pathologicaldiagnosis support apparatus 25 functions as a read/write (hereinafter abbreviated as RW)control unit 60, aninstruction receiving unit 61, adetection unit 62, aderivation unit 63, and adisplay control unit 64 in cooperation with thememory 46 and the like. TheCPU 47 is an example of a "processor" according to the technology of the present disclosure. - The
RW control unit 60 controls storage of various types of data in thestorage device 45 and reading out of various types of data in thestorage device 45. For example, theRW control unit 60 receives thesample image group 21G transmitted from the imaging apparatus, and stores it in thestorage device 45. In addition, theRW control unit 60 reads out, from thestorage device 45, thesample image group 21G for which theinstruction receiving unit 61 has received an image analysis instruction by a user via theinput device 41, and outputs it to thedetection unit 62, thederivation unit 63, and thedisplay control unit 64. That is, theRW control unit 60 performs an "acquisition process" according to the technology of the present disclosure. The image analysis instruction by the user via theinput device 41 is issued by inputting and designating, for example, the patient ID and the imaging date and time attached to thesample image 21. - Furthermore, the
RW control unit 60 reads out the threshold value TH from thestorage device 45, and outputs it to thedetection unit 62. - The
instruction receiving unit 61 receives various instructions from the user via theinput device 41. The various instructions include the above-described image analysis instruction. - Based on the threshold value TH, the
detection unit 62 detects thefibrotic region 35 from each of the plurality ofsample images 21 constituting thesample image group 21G. That is, thedetection unit 62 performs a "detection process" according to the technology of the present disclosure. Thedetection unit 62 outputs adetection result 70 of thefibrotic region 35 to thederivation unit 63 and thedisplay control unit 64. - The
derivation unit 63 derives theevaluation information 71 indicating the degree of fibrosis of the liver LV based on thedetection result 70. That is, thederivation unit 63 performs a "derivation process" according to the technology of the present disclosure. Thederivation unit 63 outputs theevaluation information 71 to thedisplay control unit 64. - The
display control unit 64 performs control to display various screens on thedisplay 40. The various screens include an analysis result display screen 90 (seeFig. 12 ) representing a result of the image analysis. Thedisplay control unit 64 generates the analysisresult display screen 90 based on thesample image group 21G, thedetection result 70, and theevaluation information 71. - In
Fig. 4 , in anabsorption spectrum 75 of Sirius red, the absorbance is highest in the G region, and then decreases in the order of the B region and the R region. Therefore, in theabsorption spectrum 75 of Sirius red, the difference in absorbance is relatively larger between the G region and the R region than between the B region and the G region and between the B region and the R region. Therefore, thedetection unit 62 calculates a ratio PV_R/PV_G between a pixel value PV_G of the G channel corresponding to the G region and a pixel value PV_R of the R channel corresponding to the R region for eachpixel 30 of thesample image 21. Thedetection unit 62 log-transforms the ratio PV_R/PV_G to log(PV _R/PV_G) in order to obtain a numerical value that can be easily handled by a computer (seeFig. 5 ). Instead of the ratio PV_R/PV_G, a ratio PV_G/PV_R in which the denominator and the numerator are reversed may be calculated. - As illustrated in
Fig. 5 , thedetection unit 62 compares log(PV_R/PV_G) with the threshold value TH. Thedetection unit 62 detects apixel 30 in which log(PV_R/PV_G) is greater than or equal to the threshold value TH as thefibrotic region 35. On the other hand, thedetection unit 62 detects apixel 30 in which log(PV _R/PV_G) is less than the threshold value TH as a non-fibrotic region. The threshold value TH is a value empirically obtained from past knowledge. - As illustrated in
Fig. 6 , thedetection unit 62 outputs abinarized image 80 as thedetection result 70. Thebinarized image 80 is an image in whichpixels 30 detected as thefibrotic region 35 are replaced with white (pixel value of each color channel = 255) andpixels 30 detected as the non-fibrotic region are replaced with black (pixel value of each color channel = 0). - As illustrated in
Fig. 7 , thederivation unit 63 derives a numerical value related to at least one of the area or the length of thefibrotic region 35 as theevaluation information 71. More specifically, theevaluation information 71 includes the areal percentage of thefibrotic region 35 and the length percentage of thefibrotic region 35. The areal percentage of thefibrotic region 35 is a value obtained by dividing the area of thefibrotic region 35 by the area of theslice 12. The length percentage of thefibrotic region 35 is a value obtained by dividing the length of thefibrotic region 35 by the area of theslice 12. -
Figs. 8 and9 illustrate a procedure for deriving the areal percentage of thefibrotic region 35 in thederivation unit 63. First, thederivation unit 63 detects a region (hereinafter referred to as a slice region) 82 of theslice 12 in each of the plurality ofsample images 21 constituting thesample image group 21G (step ST10). For example, thederivation unit 63 determines a portion where a difference between pixel values of twoadjacent pixels 30 is greater than or equal to a threshold value as a boundary between theslice 12 and theglass 13 outside theslice 12, and detects an inside of the boundary as theslice region 82. - Subsequently, the
derivation unit 63 counts the number ofpixels 30 present in theslice region 82 of eachsample image 21 to derive the area of theslice 12 captured in each sample image 21 (step ST11). In addition, thederivation unit 63 counts the number ofpixels 30 present in thefibrotic region 35 of eachbinarized image 80 corresponding to eachsample image 21 to derive the area of the fibrotic region 35 (step ST12). - Finally, the
derivation unit 63 divides the number ofpixels 30 present in thefibrotic region 35 of eachbinarized image 80 counted in step ST12 by the number ofpixels 30 present in theslice region 82 of eachsample image 21 counted in step ST11 to derive the areal percentage of the fibrotic region 35 (step ST13). -
Fig. 9 illustrates, as an example, a case where the number ofpixels 30 present in theslice region 82 of eachsample image 21 is 100000, and the number ofpixels 30 present in thefibrotic region 35 of eachbinarized image 80 is 22000. In this case, the areal percentage of thefibrotic region 35 is (22000/100000) × 100 = 22%. -
Figs. 10 and11 illustrate a procedure for deriving the length percentage of thefibrotic region 35 in thederivation unit 63. The procedure up to step ST10 and step ST11 is the same as the procedure for deriving the areal percentage of thefibrotic region 35 illustrated inFigs. 8 and9 . After deriving the area of theslice 12 captured in eachsample image 21 in step ST11, thederivation unit 63 performs a thinning process on thefibrotic region 35 of eachbinarized image 80 corresponding to each sample image 21 (step ST20). The thinning process is a process of converting thefibrotic region 35 into aline 83 having a width of one pixel and passing through the center of the width of thefibrotic region 35. - Subsequently, the
derivation unit 63 counts the number ofpixels 30 in thefibrotic region 35 after the thinning process, that is, the number ofpixels 30 constituting theline 83, to derive the length of the fibrotic region 35 (step ST21). At this time, thederivation unit 63 counts the numbers of all pixels of thepixels 30 connected vertically, horizontally, and diagonally as 1, as illustrated in a two dotchain line frame 84A. Alternatively, thederivation unit 63 counts, among thepixels 30 constituting theline 83, the number ofpixels 30 connected vertically and horizontally as 1, and the number ofpixels 30 connected diagonally as √2, as illustrated in a two dotchain line frame 84B. As the length of thefibrotic region 35, the method illustrated in theframe 84B is more accurate. - Finally, the
derivation unit 63 divides the number ofpixels 30 in thefibrotic region 35 after the thinning process counted in step ST21 by the number ofpixels 30 present in theslice region 82 of eachsample image 21 counted in step ST11 to derive the length percentage of the fibrotic region 35 (step ST22). -
Fig. 11 illustrates, as an example, a case where the number ofpixels 30 present in theslice region 82 of eachsample image 21 is 100000, as in the case inFig. 9 , and the number ofpixels 30 in thefibrotic region 35 after the thinning process is 14000. In this case, the length percentage of thefibrotic region 35 is (14000/100000) × 100 = 14%. -
Fig. 12 illustrates the analysisresult display screen 90 displayed on thedisplay 40 under the control of thedisplay control unit 64. On the analysisresult display screen 90, thesample image 21 is displayed in which thefibrotic region 35 detected by thedetection unit 62 is painted in blue, for example. Thesample image 21 displayed can be switched by operating aframe return button 91A and aframe advance button 91B. - The
evaluation information 71 is displayed in the lower part of the analysisresult display screen 90. That is, thedisplay control unit 64 performs an "output process" according to the technology of the present disclosure. - A
confirmation button 92 is provided next to theevaluation information 71. When theconfirmation button 92 is selected, thedisplay control unit 64 turns off the display of the analysisresult display screen 90. Thesample image 21 in which thefibrotic region 35 is distinguished in a specific color and theevaluation information 71 can be stored in thestorage device 45 in response to an instruction from the user. - Next, operations of the above configuration will be described with reference to the flowchart in
Fig. 13 . First, when theoperation program 55 is started in the pathologicaldiagnosis support apparatus 25, as illustrated inFig. 3 , theCPU 47 of the pathologicaldiagnosis support apparatus 25 functions as theRW control unit 60, theinstruction receiving unit 61, thedetection unit 62, thederivation unit 63, and thedisplay control unit 64. - The
RW control unit 60 reads out, from thestorage device 45, thesample image group 21G for which the user has issued an image analysis instruction (step ST100). Thesample image group 21G is output from theRW control unit 60 to thedetection unit 62, thederivation unit 63, and thedisplay control unit 64. Furthermore, theRW control unit 60 reads out the threshold value TH from thestorage device 45, and outputs it to thedetection unit 62. Step ST100 is an example of an "acquisition process" according to the technology of the present disclosure. - As illustrated in
Fig. 4 , thedetection unit 62 calculates the ratio PV_R/PV_G between the pixel value PV_G of the G channel and the pixel value PV_R of the R channel for eachpixel 30 of the sample image 21 (step ST110). Subsequently, as illustrated inFig. 5 , the logarithm log(PV_R/PV_G) of the ratio PV_R/PV_G is compared with the threshold value TH. Then, thepixels 30 in which log(PV _R/PV_G) is greater than or equal to the threshold value TH are detected as thefibrotic region 35, and thepixels 30 in which log (PV_R/PV_G) is less than the threshold value TH are detected as the non-fibrotic region (step ST120). Thedetection unit 62 generates thebinarized image 80 illustrated inFig. 6 as thedetection result 70 of thefibrotic region 35. Thedetection unit 62 outputs thedetection result 70 to thederivation unit 63 and thedisplay control unit 64. Step ST120 is an example of a "detection process" according to the technology of the present disclosure. - As illustrated in
Figs. 7 to 11 , thederivation unit 63 derives the areal percentage of thefibrotic region 35 and the length percentage of thefibrotic region 35 as the evaluation information 71 (step ST130). Theevaluation information 71 is output from thederivation unit 63 to thedisplay control unit 64. Step ST130 is an example of a "derivation process" according to the technology of the present disclosure. - Under the control of the
display control unit 64, the analysisresult display screen 90 illustrated inFig. 12 is displayed on the display 40 (step ST140). Accordingly, thefibrotic region 35 and theevaluation information 71 are presented to the user. The user grasps the degree of fibrosis in the liver LV of the patient P who is a target of pathological diagnosis on the analysisresult display screen 90. Step ST140 is an example of an "output process" according to the technology of the present disclosure. - As described above, the pathological
diagnosis support apparatus 25 includes theRW control unit 60, thedetection unit 62, thederivation unit 63, and thedisplay control unit 64. TheRW control unit 60 acquires thesample image 21 obtained by imaging thesample 20 of the liver LV stained with Sirius red by reading it out from thestorage device 45. Thedetection unit 62 detects thefibrotic region 35 of the liver LV by comparing, with the preset threshold value TH, the ratio PV_R/PV_G between the pixel values PV_G and PV_R of the G channel and the R channel among the three color channels of RGB of thesample image 21. Thederivation unit 63 derives theevaluation information 71 indicating the degree of fibrosis of the liver LV based on the detectedfibrotic region 35. Thedisplay control unit 64 outputs theevaluation information 71 by displaying the analysisresult display screen 90 including theevaluation information 71 on thedisplay 40. - The ratio PV_R/PV_G is more robust than the pixel value PV_G or PV_R itself with respect to changes in the color of staining due to differences in the concentration of Sirius red, the ambient environment, the imaging apparatus of the
sample image 21, and the like. This can improve the detection accuracy of thefibrotic region 35. Therefore, thefibrotic region 35, which has been detected intermittently due to low detection accuracy of thefibrotic region 35 in spite of actual bridging fibrosis, can be reliably recognized as bridging fibrosis. - In the
absorption spectrum 75 of Sirius red, thedetection unit 62 calculates the ratio PV_R/PV_G between the pixel values PV_G and PV_R of the G channel and the R channel corresponding to the G region and the R region in which the difference in absorbance is relatively large. Therefore, it is possible to widen the dynamic range of the ratio and further improve the detection accuracy of thefibrotic region 35. - The
derivation unit 63 derives, as theevaluation information 71, a numerical value related to at least one of the area or the length of thefibrotic region 35, specifically, the areal percentage of thefibrotic region 35 and the length percentage of thefibrotic region 35. Therefore, the degree of fibrosis of the liver LV can be objectively evaluated. When the numerical value related to the length of thefibrotic region 35 is relatively large, it can be estimated that fibrosis has progressed in a relatively wide range of the liver LV. - The dye is not limited to Sirius red illustrated as an example. For example, iron hematoxylin, Ponceau xylidine, acid fuchsin, and aniline blue used for Masson's trichrome staining may be used. In a case of the dye used for Masson's trichrome staining, as illustrated in an
absorption spectrum 95 inFig. 14 , the absorbance in the G region is relatively high, and the absorbances in the B region and the R region are relatively low. In addition, there is almost no difference in absorbance between the B region and the R region. Therefore, in theabsorption spectrum 95 of the dye used for Masson's trichrome staining, the difference in absorbance is relatively larger between the B region and the G region and the G region and the R region than between the B region and the R region. Therefore, in this case, thedetection unit 62 calculates a ratio PV_B/PV_G between the pixel value PV_B of the B channel corresponding to the B region and the pixel value PV_G of the G channel corresponding to the G region, and the ratio PV_R/PV_G between the pixel value PV_G of the G channel corresponding to the G region and the pixel value PV_R of the R channel corresponding to the R region, for eachpixel 30 of thesample image 21. Thedetection unit 62 log-transforms the ratio PV_B/PV_G to log(PV_B/PV_G) and log-transforms the ratio PV_R/PV_G to log (PV_R/PV_G) (seeFig. 15 ). A ratio PV_G/PV_B and a ratio PV_G/PV_R may be calculated. - As illustrated in
Fig. 15 , thedetection unit 62 compares log(PV_B/PV_G) with a first threshold value TH1. In addition, thedetection unit 62 compares log(PV _R/PV_G) with a second threshold value TH2. Thedetection unit 62 detects apixel 30 in which log(PV _B/PV_G) is greater than or equal to the first threshold value TH1 and log(PV _R/PV_G) is greater than or equal to the second threshold value TH2 as thefibrotic region 35. On the other hand, thedetection unit 62 detects apixel 30 in which log(PV _B/PV_G) is less than the first threshold value TH1 or log(PV _R/PV_G) is less than the second threshold value TH2 as the non-fibrotic region. Like the threshold value TH, the first threshold value TH1 and the second threshold value TH2 are values empirically obtained from past knowledge. - As described above, the ratio between the pixel values of the two color channels calculated for detecting the
fibrotic region 35 is not limited to one type. Note that apixel 30 in which log(PV_B/PV_G) is less than the first threshold value TH1 and log (PV_R/PV_G) is less than the second threshold value TH2 may be detected as the non-fibrotic region, and apixel 30 in which log (PV _B/PV_G) is greater than or equal to the first threshold value TH1 or log (PV _R/PV_G) is greater than or equal to the second threshold value TH2 may be detected as thefibrotic region 35. - The
evaluation information 71 is not limited to the areal percentage of thefibrotic region 35 and the length percentage of thefibrotic region 35 illustrated as examples above. For example, the areal percentage of thefibrotic region 35 may be changed to five levels representing the degrees of fibrosis with reference to a table 97 illustrated inFig. 16 , and the levels may be derived as evaluation information 101 (seeFig. 17 ). In the table 97, levels corresponding to ranges of the areal percentage of thefibrotic region 35 are registered. For example,level 0 is registered when the areal percentage of thefibrotic region 35 is 0% or more and less than 5%,level 3 is registered when the areal percentage is 20% or more and less than 30%, andlevel 4 is registered when the areal percentage is 30% or more. The table 97 is stored in thestorage device 45, and is read out by theRW control unit 60 and output to thederivation unit 63. -
Fig. 17 illustrates an analysisresult display screen 100 on which a level indicating the degree of fibrosis is displayed as theevaluation information 101. - In addition, as in an analysis
result display screen 105 illustrated inFig. 18 , stages of known fibrosis evaluation indexes such as new Inuyama classification and METAVIR score may be derived and output asevaluation information 106. Each stage of the new Inuyama classification and the METAVIR score is derived from an estimation expression using, for example, the areal percentage of thefibrotic region 35 and the length percentage of thefibrotic region 35 as parameters and using the stage as a solution. In addition, non-alcoholic fatty liver disease (NAFLD) activity score (NAS) or the like may be derived and output as evaluation information. - In a second embodiment illustrated in
Figs. 19 to 22 ,evaluation information 113 is derived separately for theperivascular region 36 and anon-perivascular region 115 other than theperivascular region 36. - As illustrated in
Fig. 19 , a CPU of a pathological diagnosis support apparatus according to the second embodiment functions as anextraction unit 110 in addition to theunits 60 to 64 (omitted from the illustration inFig. 19 except thederivation unit 63 and the display control unit 64) according to the first embodiment above. Theextraction unit 110 extracts theperivascular region 36 and thenon-perivascular region 115 from each of thesample images 21 constituting thesample image group 21G using amachine learning model 111. - The
machine learning model 111 is, for example, a convolutional neural network such as U-shaped neural network (U-Net), SegNet, residual network (ResNet), or densely connected convolutional network (DenseNet). Themachine learning model 111 is stored in thestorage device 45, and is read out by theRW control unit 60 and output to theextraction unit 110. Themachine learning model 111 is a model in which thesample image 21 is used as an input image, and a binarized image in which thepixels 30 in theperivascular region 36 are replaced with white and thepixels 30 in thenon-perivascular region 115 are replaced with black is used as an output image as illustrated inFig. 20 , for example. Themachine learning model 111 extracts, for example, a region having a width of about 20 pixels surrounding the periphery of thevascular region 32 as theperivascular region 36. In addition, themachine learning model 111 extracts thepixels 30 of theslice 12 other than thepixels 30 extracted as theperivascular region 36 as thenon-perivascular region 115. Thus, thenon-perivascular region 115 includes thevascular region 32 and most of theparenchymal region 33. Themachine learning model 111 is trained using a plurality of sets of asample image 21 for learning and a correct image in which theperivascular region 36 of thesample image 21 for learning is designated by a user's hand. - In
Fig. 19 , theextraction unit 110 outputs the binarized image in which thepixels 30 in theperivascular region 36 are replaced with white and thepixels 30 in thenon-perivascular region 115 are replaced with black to thederivation unit 63 and thedisplay control unit 64 as anextraction result 112. Based on theextraction result 112 from theextraction unit 110 and thedetection result 70 from thedetection unit 62, thederivation unit 63 derives, as theevaluation information 113, the areal percentage of thefibrotic region 35 in theperivascular region 36 and the length percentage of thefibrotic region 35 in theperivascular region 36. In addition, thederivation unit 63 derives, as theevaluation information 113, the areal percentage of thefibrotic region 35 in thenon-perivascular region 115 and the length percentage of thefibrotic region 35 in thenon-perivascular region 115. - The areal percentage of the
fibrotic region 35 in thenon-perivascular region 36 is derived in step ST12 illustrated inFigs. 8 and9 by counting the number ofpixels 30 present in thefibrotic region 35 in thenon-perivascular region 36 and then dividing this by the number ofpixels 30 present in theslice region 82 of eachsample image 21 counted in step ST11. The length percentage of thefibrotic region 35 in thenon-perivascular region 36 is derived in step ST21 illustrated inFigs. 10 and11 by counting the number ofpixels 30 in thefibrotic region 35 in thenon-perivascular region 36 after the thinning process and then dividing this by the number ofpixels 30 present in theslice region 82 of eachsample image 21 counted in step ST11. The same applies to the areal percentage of thefibrotic region 35 in thenon-perivascular region 115 and the length percentage of thefibrotic region 35 in thenon-perivascular region 115. - The
display control unit 64 displays an analysisresult display screen 120 illustrated inFig. 21 on thedisplay 40. On the analysisresult display screen 120, as also illustrated inFig. 22 which is an enlarged view of aframe 121, thesample image 21 is displayed in which thefibrotic region 35 in theperivascular region 36 is painted in green, for example, and thefibrotic region 35 in thenon-perivascular region 115 is painted in blue, for example. In addition, as theevaluation information 113, the areal percentage and the length percentage of thefibrotic region 35 in theperivascular region 36 and the areal percentage and the length percentage of thefibrotic region 35 in thenon-perivascular region 115 are displayed. - In this manner, in the second embodiment, the
evaluation information 71 is derived separately for theperivascular region 36 and thenon-perivascular region 115. Therefore, it is possible to evaluate a disease for which the progression of fibrosis is mainly observed in theperivascular region 36 and a disease for which the progression of fibrosis is mainly observed in thenon-perivascular region 115 while distinguishing the disease states from each other. - In clinical trials using rats or the like, a fatty liver is intentionally caused by injecting a drug such as carbon tetrachloride. Therefore, in any case, fibrosis is likely to progress in the
perivascular region 36 due to the influence of the drug. Therefore, when theevaluation information 71 is derived separately for theperivascular region 36 and thenon-perivascular region 115 as in the second embodiment, it is possible to evaluate the degree of fibrosis excluding the influence of the drug. - In the analysis
result display screen 120 illustrated inFig. 21 , the colors of thefibrotic region 35 in theperivascular region 36 and thefibrotic region 35 in thenon-perivascular region 115 are different, and the areal percentage and the length percentage of thefibrotic region 35 in theperivascular region 36 and the areal percentage and the length percentage of thefibrotic region 35 in thenon-perivascular region 115 are displayed as theevaluation information 113. However, the present disclosure is not limited to this. As in an analysisresult display screen 125 illustrated inFig. 23 , only thefibrotic region 35 in theperivascular region 36 may be painted in green, for example (see alsoFig. 24 which is an enlarged view of a frame 126), and only the areal percentage and the length percentage of thefibrotic region 35 in theperivascular region 36 may be displayed as theevaluation information 127. Alternatively, although illustration is omitted, in contrast to the case ofFig. 23 , only thefibrotic region 35 in thenon-perivascular region 115 may be painted in blue, for example, and only the areal percentage and the length percentage of thefibrotic region 35 in thenon-perivascular region 115 may be displayed as the evaluation information. The display mode illustrated inFig. 21 , the display mode illustrated inFig. 23 , and the display mode opposite to the case ofFig. 23 may be configured to be switchable. - The
perivascular region 36 may be extracted without using themachine learning model 111. For example, thevascular region 32 is extracted using a known image recognition technique, and a region surrounding the periphery of the extractedvascular region 32 and having a width of 20 pixels, for example, is extracted as theperivascular region 36. Alternatively, the user may be caused to designate theperivascular region 36. - In a third embodiment illustrated in
Figs. 25 to 28 ,evaluation information 133 is derived separately for apericentral region 36C and thenon-perivascular region 115. Thepericentral region 36C includes the periphery of the central vein passing through the liver LV. - As illustrated in
Fig. 25 , anextraction unit 130 according to the third embodiment extracts thepericentral region 36C, aperiportal region 36P, and thenon-perivascular region 115 from each of thesample images 21 constituting thesample image group 21G using amachine learning model 131. - The
machine learning model 131 is a convolutional neural network such as U-Net, similarly to themachine learning model 111 according to the second embodiment above. Themachine learning model 131 is stored in thestorage device 45, and is read out by theRW control unit 60 and output to theextraction unit 130. Themachine learning model 131 is a model in which thesample image 21 is used as an input image, and a binarized image in which thepixels 30 in thepericentral region 36C are replaced with white and thepixels 30 in thenon-perivascular region 115 are replaced with black is used as an output image as illustrated inFig. 26 , for example. Themachine learning model 131 extracts, for example, a region having a width of about 20 pixels surrounding the periphery of acentral vein region 32C as thepericentral region 36C. Similarly, themachine learning model 131 extracts, for example, a region having a width of about 20 pixels surrounding the periphery of aportal vein region 32P as theperiportal region 36C. In addition, themachine learning model 131 extracts thepixels 30 of theslice 12 other than thepixels 30 extracted as thepericentral region 36C and theperiportal region 36P as thenon-perivascular region 115. Themachine learning model 131 is trained using a plurality of sets of asample image 21 for learning and a correct image in which thepericentral region 36C and theperiportal region 36P of thesample image 21 for learning are designated by a user's hand. - In
Fig. 25 , theextraction unit 130 outputs the binarized image in which thepixels 30 in thepericentral region 36C are replaced with white and thepixels 30 in thenon-perivascular region 115 are replaced with black to thederivation unit 63 and thedisplay control unit 64 as anextraction result 132. Based on theextraction result 132 from theextraction unit 130 and thedetection result 70 from thedetection unit 62, thederivation unit 63 derives, as theevaluation information 133, the areal percentage of thefibrotic region 35 in thepericentral region 36C and the length percentage of thefibrotic region 35 in thepericentral region 36C. In addition, thederivation unit 63 derives, as theevaluation information 133, the areal percentage of thefibrotic region 35 in thenon-perivascular region 115 and the length percentage of thefibrotic region 35 in thenon-perivascular region 115. - The areal percentage of the
fibrotic region 35 in thepericentral region 36C is derived in step ST12 illustrated inFigs. 8 and9 by counting the number ofpixels 30 present in thefibrotic region 35 in thepericentral region 36C and then dividing this by the number ofpixels 30 present in theslice region 82 of eachsample image 21 counted in step ST11. The length percentage of thefibrotic region 35 in thepericentral region 36C is derived in step ST21 illustrated inFigs. 10 and11 by counting the number ofpixels 30 in thefibrotic region 35 in theperivascular region 36 after the thinning process and then dividing this by the number ofpixels 30 present in theslice region 82 of eachsample image 21 counted in step ST11. - The
display control unit 64 displays an analysisresult display screen 140 illustrated inFig. 27 on thedisplay 40. On the analysisresult display screen 140, as also illustrated inFig. 28 which is an enlarged view of aframe 141, thesample image 21 is displayed in which thefibrotic region 35 in thepericentral region 36C is painted in green, for example, and thefibrotic region 35 in thenon-perivascular region 115 is painted in blue, for example. In addition, as theevaluation information 133, the areal percentage and the length percentage of thefibrotic region 35 in thepericentral region 36C and the areal percentage and the length percentage of thefibrotic region 35 in thenon-perivascular region 115 are displayed. - In this manner, in the third embodiment, the
evaluation information 71 is derived separately for thepericentral region 36C and thenon-perivascular region 115. Therefore, it is possible to correctly evaluate the state of a disease such as non-alcoholic steatohepatitis (NASH) in which fibrosis progresses from thepericentral region 36C toward thenon-perivascular region 115. - As in the second embodiment above, only the
fibrotic region 35 in thepericentral region 36C may be painted in green, for example, and only the areal percentage and the length percentage of thefibrotic region 35 in thepericentral region 36C may be displayed as the evaluation information. This display mode and the display mode illustrated inFig. 27 may be configured to be switchable. Alternatively, thepericentral region 36C may be extracted without using themachine learning model 111 by, for example, causing the user to designate thepericentral region 36C. - As in
evaluation information 142 illustrated inFig. 29A , not only the areal percentage and the length percentage of thefibrotic region 35 in thepericentral region 36C, but also the areal percentage and the length percentage of thefibrotic region 35 in theperiportal region 36P may be derived. In addition, as inevaluation information 143 illustrated inFig. 29B , bridging fibrosis between portal veins, that is, the number of P-P bridges, and bridging fibrosis between a portal vein and a central vein, that is, the number of P-C bridges may be derived. - In a fourth embodiment illustrated in
Fig. 30 , after thesample images 21 are subjected to compression processing, thefibrotic region 35 is detected. - In
Fig. 30 , a CPU of a pathological diagnosis support apparatus according to the fourth embodiment functions as acompression unit 150 in addition to theunits 60 to 64 (omitted from the illustration inFig. 30 except the detection unit 62) according to the first embodiment above. Thesample image group 21G read out from thestorage device 45 by theRW control unit 60 is input to thecompression unit 150. Thecompression unit 150 performs compression processing on each of the plurality ofsample images 21 constituting thesample image group 21G. Thecompression unit 150 outputs thesample image group 21G after the compression processing to thedetection unit 62. Thedetection unit 62 detects thefibrotic region 35 from the compressedsample image 21, and outputs thedetection result 70 to thederivation unit 63 and the like. - As described above, in the fourth embodiment, after the compression processing is performed by the
compression unit 150 on thesample images 21 acquired by theRW control unit 60, thedetection unit 62 detects thefibrotic region 35. Therefore, it is possible to reduce a processing load as compared with a case where thefibrotic region 35 is detected from the full-size sample images 21. - The above embodiments have illustrated the
sample 20 collected from the liver LV of the patient P as an example. However, the present disclosure is not limited this. For example, as illustrated inFig. 31 , asample 156 may be prepared from atest substance 155 collected from a lung LG of the patient P using thebiopsy needle 10. It may also be a sample collected from skin, breast, stomach, large intestine, and the like. - The color channels of the pixel values of the
sample image 21 are not limited to the illustrated RGB color channels. They may be four color channels of CMYG (Cyan, Magenta, Yellow, and Green). - The output form of the evaluation information is not limited to the form of displaying on the analysis result display screen. The evaluation information may be printed out on a paper medium, or a data file of the evaluation information may be transmitted and output by e-mail or the like.
- Various modifications can be made to the hardware configuration of the computer constituting the pathological diagnosis support apparatus. The pathological diagnosis support apparatus may be configured by a plurality of computers separated as hardware for the purpose of improving processing capability and reliability. For example, the functions of the
RW control unit 60 and theinstruction receiving unit 61 and the functions of thedetection unit 62, thederivation unit 63, and thedisplay control unit 64 are distributed to two computers. In this case, two computers constitute the pathological diagnosis support apparatus. - As described above, the hardware configuration of the computer of the pathological diagnosis support apparatus can be changed as appropriate in accordance with required performance such as processing capability, safety, and reliability. Furthermore, not only hardware but also application programs such as the
operation program 55 can be duplicated or distributed and stored in a plurality of storage devices for the purpose of ensuring safety and reliability. - In each of the above-described embodiments, for example, as a hardware structure of a processing unit that executes various kinds of processing such as the
RW control unit 60, theinstruction receiving unit 61, thedetection unit 62, thederivation unit 63, thedisplay control unit 64, theextraction units compression unit 150, various processors described below can be used. Various processors include, in addition to theCPU 47, which is a general-purpose processor functioning as various processing units by executing software (the operation program 55), a programmable logic device (PLD) that is a processor in which the circuit configuration is changeable after manufacture, such as field programmable gate array (FPGA), a dedicated electric circuit that is a processor having a circuit configuration that is specially designed to execute specific processing, such as an application specific integrated circuit (ASIC), and the like. - One processing unit may be constituted by one of these various processors, or may be constituted by two or more processors of the same type or different types in combination (e.g., a combination of a plurality of FPGAs, and/or a combination of a CPU and an FPGA). In addition, a plurality of processing units may be configured as one processor.
- As a first example for constituting a plurality of processing units with one processor, one processor may be constituted by a combination of one or more CPUs and software, and this processor may function as a plurality of processing units, as typified by a computer such as a client or a server. As a second example, a processor may be used that implements the functions of the entire system including a plurality of processing units as one integrated circuit (IC) chip, as typified by a system on chip (SoC) or the like. In this manner, various processing units are constituted by one or more of the above various processors in terms of hardware configuration.
- Furthermore, the hardware configuration of these various processors may be electric circuitry constituted by combining circuit elements such as semiconductor elements.
- In the technology of the present disclosure, the above-described various embodiments and various modifications may be combined as appropriate. The present disclosure is not limited to the above-described embodiments, and various configurations can be employed without departing from the gist of the present disclosure, as a matter of course. Furthermore, the technology of the present disclosure covers not only the program but also a recording medium having the program stored therein in a non-transitory manner.
- The content described above and illustrated in the drawings is a detailed description of portions related to the technology of the present disclosure, and is merely an example of the technology of the present disclosure. For example, the above description regarding the configuration, the function, the operation, and the effect is a description regarding an example of the configuration, the function, the operation, and the effect of the portions related to the technology of the present disclosure. Therefore, it is needless to say that unnecessary portions may be deleted, new elements may be added, or replacement may be performed with respect to the content described above and illustrated in the drawings without departing from the gist of the technology of the present disclosure. In addition, in order to avoid complexity and to facilitate understanding of portions related to the technology of the present disclosure, description of common technical knowledge and the like that do not particularly require description in order to enable implementation of the technology of the present disclosure is omitted from the content described above and illustrated in the drawings.
- As used herein, "A and/or B" is synonymous with "at least one of A or B". That is, "A and/or B" means that A may be employed alone, B may be employed alone, or A and B may be employed in combination. In addition, in the present specification, when three or more matters are expressed by being combined with "and/or", the same concept as "A and/or B" is applied.
- All documents, patent applications, and technical standards mentioned in the present specification are incorporated herein by reference to the same extent as if individual document, patent application, or technical standard is specifically and individually indicated to be incorporated by reference.
Claims (8)
- A pathological diagnosis support apparatus comprising at least one processor configured to:acquire a sample image obtained by imaging a sample of a biological tissue stained with a dye, the sample image having pixel values of a plurality of color channels;detect a fibrotic region of the biological tissue by comparing a ratio between pixel values of two color channels among the plurality of color channels with a preset threshold value;derive evaluation information indicating a degree of fibrosis of the biological tissue based on the detected fibrotic region; andoutput the evaluation information.
- The pathological diagnosis support apparatus according to claim 1, wherein the processor calculates a ratio between pixel values of two color channels corresponding to two color regions having a relatively large difference in absorbance in an absorption spectrum of the dye.
- The pathological diagnosis support apparatus according to claim 1, wherein the processor derives the evaluation information separately for a perivascular region and a non-perivascular region other than the perivascular region, the perivascular region including a periphery of a blood vessel passing through the biological tissue.
- The pathological diagnosis support apparatus according to claim 3, whereinthe sample is collected from a liver, andthe processor derives the evaluation information separately for a pericentral region and the non-perivascular region, the pericentral region including a periphery of a central vein passing through the liver.
- The pathological diagnosis support apparatus according to any one of claims 1 to 4, wherein the processor derives a numerical value related to at least any one of an area or a length of the fibrotic region as the evaluation information.
- The pathological diagnosis support apparatus according to any one of claims 1 to 5, wherein the processor detects the fibrotic region after performing compression processing on the acquired sample image.
- An operation method for a pathological diagnosis support apparatus, wherein a processor executes:an acquisition process of acquiring a sample image obtained by imaging a sample of a biological tissue stained with a dye, the sample image having pixel values of a plurality of color channels;a detection process of detecting a fibrotic region of the biological tissue by comparing a ratio between pixel values of two color channels among the plurality of color channels with a preset threshold value;a derivation process of deriving evaluation information indicating a degree of fibrosis of the biological tissue based on the detected fibrotic region; andan output process of outputting the evaluation information.
- An operation program for a pathological diagnosis support apparatus, the program causing a processor to execute:an acquisition process of acquiring a sample image obtained by imaging a sample of a biological tissue stained with a dye, the sample image having pixel values of a plurality of color channels;a detection process of detecting a fibrotic region of the biological tissue by comparing a ratio between pixel values of two color channels among the plurality of color channels with a preset threshold value;a derivation process of deriving evaluation information indicating a degree of fibrosis of the biological tissue based on the detected fibrotic region; andan output process of outputting the evaluation information.
Applications Claiming Priority (2)
| Application Number | Priority Date | Filing Date | Title |
|---|---|---|---|
| JP2020115065 | 2020-07-02 | ||
| PCT/JP2021/019793 WO2022004198A1 (en) | 2020-07-02 | 2021-05-25 | Pathological diagnosis assist device, operation method of pathological diagnosis assist device, and operation program of pathological diagnosis assist device |
Publications (2)
| Publication Number | Publication Date |
|---|---|
| EP4177605A1 true EP4177605A1 (en) | 2023-05-10 |
| EP4177605A4 EP4177605A4 (en) | 2023-12-06 |
Family
ID=79315908
Family Applications (1)
| Application Number | Title | Priority Date | Filing Date |
|---|---|---|---|
| EP21833599.0A Pending EP4177605A4 (en) | 2020-07-02 | 2021-05-25 | Pathological diagnosis assist device, operation method of pathological diagnosis assist device, and operation program of pathological diagnosis assist device |
Country Status (5)
| Country | Link |
|---|---|
| US (1) | US20230125525A1 (en) |
| EP (1) | EP4177605A4 (en) |
| JP (1) | JP7436666B2 (en) |
| CN (1) | CN115769073A (en) |
| WO (1) | WO2022004198A1 (en) |
Families Citing this family (2)
| Publication number | Priority date | Publication date | Assignee | Title |
|---|---|---|---|---|
| US12430901B2 (en) * | 2021-06-22 | 2025-09-30 | University Of Louisville Research Foundation, Inc. | Systems and methods for digital transformation of medical images and fibrosis detection |
| GB2631590A (en) * | 2024-06-17 | 2025-01-08 | Histoindex Pte Ltd | Method and system for predicting a clinical outcome of metabolic dysfunction-associated steatotic liver disease |
Family Cites Families (7)
| Publication number | Priority date | Publication date | Assignee | Title |
|---|---|---|---|---|
| JP2008215820A (en) * | 2007-02-28 | 2008-09-18 | Tokyo Institute Of Technology | Analysis method using spectra |
| JP5771513B2 (en) * | 2011-11-24 | 2015-09-02 | 学校法人慶應義塾 | Pathological diagnosis support apparatus, pathological diagnosis support method, and pathological diagnosis support program |
| JP5953035B2 (en) * | 2011-11-28 | 2016-07-13 | 学校法人慶應義塾 | Pathological diagnosis support apparatus, pathological diagnosis support method, and pathological diagnosis support program |
| SG11201505294SA (en) * | 2013-01-08 | 2015-08-28 | Agency Science Tech & Res | A method and system for assessing fibrosis in a tissue |
| EP2772882A1 (en) * | 2013-03-01 | 2014-09-03 | Universite D'angers | Automatic measurement of lesions on medical images |
| EP2980753A1 (en) * | 2014-08-01 | 2016-02-03 | Centre Hospitalier Universitaire d'Angers | Method for displaying easy-to-understand medical images |
| JPWO2019044579A1 (en) * | 2017-08-31 | 2020-11-05 | 国立大学法人大阪大学 | Pathological diagnostic equipment, image processing methods and programs |
-
2021
- 2021-05-25 EP EP21833599.0A patent/EP4177605A4/en active Pending
- 2021-05-25 JP JP2022533741A patent/JP7436666B2/en active Active
- 2021-05-25 WO PCT/JP2021/019793 patent/WO2022004198A1/en not_active Ceased
- 2021-05-25 CN CN202180045590.8A patent/CN115769073A/en active Pending
-
2022
- 2022-12-23 US US18/146,030 patent/US20230125525A1/en not_active Abandoned
Also Published As
| Publication number | Publication date |
|---|---|
| US20230125525A1 (en) | 2023-04-27 |
| EP4177605A4 (en) | 2023-12-06 |
| CN115769073A (en) | 2023-03-07 |
| WO2022004198A1 (en) | 2022-01-06 |
| JPWO2022004198A1 (en) | 2022-01-06 |
| JP7436666B2 (en) | 2024-02-21 |
Similar Documents
| Publication | Publication Date | Title |
|---|---|---|
| CN106462767B (en) | Inspection device for processing and analyzing images | |
| Medhi et al. | An effective fovea detection and automatic assessment of diabetic maculopathy in color fundus images | |
| US20230125525A1 (en) | Pathological diagnosis support apparatus, operation method for pathological diagnosis support apparatus, and operation program for pathological diagnosis support apparatus | |
| US20110211057A1 (en) | Image processing apparatus, image processing method, program, and program recording medium | |
| US20230117179A1 (en) | System and method for generating an indicator from an image of a histological section | |
| KR101175426B1 (en) | Ultrasound system and method for providing three-dimensional ultrasound image | |
| US20170215814A1 (en) | Method for displaying easy-to-understand medical images | |
| El Abbadi et al. | Automatic detection of exudates in retinal images | |
| WO2010131944A2 (en) | Apparatus for monitoring and grading diabetic retinopathy | |
| KR102206621B1 (en) | Programs and applications for sarcopenia analysis using deep learning algorithms | |
| JP5771513B2 (en) | Pathological diagnosis support apparatus, pathological diagnosis support method, and pathological diagnosis support program | |
| Gerber et al. | Automatic estimation of the optic nerve sheath diameter from ultrasound images | |
| Suero et al. | Locating the Optic Disc in Retinal Images Using Morphological Techniques. | |
| EP3677168A1 (en) | Pathology diagnostic apparatus, image processing method, and program | |
| Hatanaka et al. | CAD scheme to detect hemorrhages and exudates in ocular fundus images | |
| CN113038868B (en) | Medical Image Processing System | |
| McGarry et al. | Vessel Metrics: A software tool for automated analysis of vascular structure in confocal imaging | |
| US11830185B2 (en) | Medical image processing system and learning method | |
| CN114209299B (en) | A method for human physiological parameter detection channel selection based on IPPG technology | |
| KR102393661B1 (en) | Endoscope system for multi image, image providing method of the system, and a recording medium having computer readable program for executing the method | |
| TW201701836A (en) | Method and system for automatically identifying methods for obtaining classification and inductive boundaries | |
| Patil et al. | Implementation of segmentation of blood vessels in retinal images on FPGA | |
| KR101024857B1 (en) | Ultrasound system and method for performing color modeling on 3D ultrasound images | |
| JPWO2018131091A1 (en) | Image processing apparatus, image processing method, and image processing program | |
| Tan et al. | CT Image Enhancement by colorization for brain infarct detection |
Legal Events
| Date | Code | Title | Description |
|---|---|---|---|
| STAA | Information on the status of an ep patent application or granted ep patent |
Free format text: STATUS: THE INTERNATIONAL PUBLICATION HAS BEEN MADE |
|
| PUAI | Public reference made under article 153(3) epc to a published international application that has entered the european phase |
Free format text: ORIGINAL CODE: 0009012 |
|
| STAA | Information on the status of an ep patent application or granted ep patent |
Free format text: STATUS: REQUEST FOR EXAMINATION WAS MADE |
|
| 17P | Request for examination filed |
Effective date: 20221223 |
|
| AK | Designated contracting states |
Kind code of ref document: A1 Designated state(s): AL AT BE BG CH CY CZ DE DK EE ES FI FR GB GR HR HU IE IS IT LI LT LU LV MC MK MT NL NO PL PT RO RS SE SI SK SM TR |
|
| DAV | Request for validation of the european patent (deleted) | ||
| DAX | Request for extension of the european patent (deleted) | ||
| REG | Reference to a national code |
Ref country code: DE Ref legal event code: R079 Free format text: PREVIOUS MAIN CLASS: G01N0033480000 Ipc: G06T0007000000 |
|
| A4 | Supplementary search report drawn up and despatched |
Effective date: 20231108 |
|
| RIC1 | Information provided on ipc code assigned before grant |
Ipc: G01N 21/27 20060101ALI20231102BHEP Ipc: G01N 33/48 20060101ALI20231102BHEP Ipc: G06T 7/62 20170101ALI20231102BHEP Ipc: G06T 7/136 20170101ALI20231102BHEP Ipc: G06T 7/11 20170101ALI20231102BHEP Ipc: G06T 7/00 20170101AFI20231102BHEP |
|
| GRAP | Despatch of communication of intention to grant a patent |
Free format text: ORIGINAL CODE: EPIDOSNIGR1 |
|
| STAA | Information on the status of an ep patent application or granted ep patent |
Free format text: STATUS: GRANT OF PATENT IS INTENDED |
|
| RIC1 | Information provided on ipc code assigned before grant |
Ipc: G06T 7/00 20170101AFI20251117BHEP Ipc: G06T 7/11 20170101ALI20251117BHEP Ipc: G06T 7/136 20170101ALI20251117BHEP Ipc: G06T 7/62 20170101ALI20251117BHEP Ipc: G01N 21/27 20060101ALI20251117BHEP Ipc: G16H 50/30 20180101ALI20251117BHEP Ipc: G16H 30/40 20180101ALI20251117BHEP Ipc: G01N 33/68 20060101ALI20251117BHEP Ipc: G01N 33/483 20060101ALI20251117BHEP Ipc: G01N 21/25 20060101ALI20251117BHEP |
|
| INTG | Intention to grant announced |
Effective date: 20251208 |