EP4172367B1 - A method of predicting response to treatment with a disease-modifying anti-rheumatic drug, and/or classifying disease activity in a subject with rheumatoid arthritis - Google Patents
A method of predicting response to treatment with a disease-modifying anti-rheumatic drug, and/or classifying disease activity in a subject with rheumatoid arthritis Download PDFInfo
- Publication number
- EP4172367B1 EP4172367B1 EP21737038.6A EP21737038A EP4172367B1 EP 4172367 B1 EP4172367 B1 EP 4172367B1 EP 21737038 A EP21737038 A EP 21737038A EP 4172367 B1 EP4172367 B1 EP 4172367B1
- Authority
- EP
- European Patent Office
- Prior art keywords
- biomarker
- biomarkers
- treatment
- disease activity
- dmard
- Prior art date
- Legal status (The legal status is an assumption and is not a legal conclusion. Google has not performed a legal analysis and makes no representation as to the accuracy of the status listed.)
- Active
Links
Images



Classifications
-
- C—CHEMISTRY; METALLURGY
- C12—BIOCHEMISTRY; BEER; SPIRITS; WINE; VINEGAR; MICROBIOLOGY; ENZYMOLOGY; MUTATION OR GENETIC ENGINEERING
- C12Q—MEASURING OR TESTING PROCESSES INVOLVING ENZYMES, NUCLEIC ACIDS OR MICROORGANISMS; COMPOSITIONS OR TEST PAPERS THEREFOR; PROCESSES OF PREPARING SUCH COMPOSITIONS; CONDITION-RESPONSIVE CONTROL IN MICROBIOLOGICAL OR ENZYMOLOGICAL PROCESSES
- C12Q1/00—Measuring or testing processes involving enzymes, nucleic acids or microorganisms; Compositions therefor; Processes of preparing such compositions
- C12Q1/68—Measuring or testing processes involving enzymes, nucleic acids or microorganisms; Compositions therefor; Processes of preparing such compositions involving nucleic acids
- C12Q1/6876—Nucleic acid products used in the analysis of nucleic acids, e.g. primers or probes
- C12Q1/6883—Nucleic acid products used in the analysis of nucleic acids, e.g. primers or probes for diseases caused by alterations of genetic material
-
- C—CHEMISTRY; METALLURGY
- C12—BIOCHEMISTRY; BEER; SPIRITS; WINE; VINEGAR; MICROBIOLOGY; ENZYMOLOGY; MUTATION OR GENETIC ENGINEERING
- C12Q—MEASURING OR TESTING PROCESSES INVOLVING ENZYMES, NUCLEIC ACIDS OR MICROORGANISMS; COMPOSITIONS OR TEST PAPERS THEREFOR; PROCESSES OF PREPARING SUCH COMPOSITIONS; CONDITION-RESPONSIVE CONTROL IN MICROBIOLOGICAL OR ENZYMOLOGICAL PROCESSES
- C12Q2600/00—Oligonucleotides characterized by their use
- C12Q2600/106—Pharmacogenomics, i.e. genetic variability in individual responses to drugs and drug metabolism
-
- C—CHEMISTRY; METALLURGY
- C12—BIOCHEMISTRY; BEER; SPIRITS; WINE; VINEGAR; MICROBIOLOGY; ENZYMOLOGY; MUTATION OR GENETIC ENGINEERING
- C12Q—MEASURING OR TESTING PROCESSES INVOLVING ENZYMES, NUCLEIC ACIDS OR MICROORGANISMS; COMPOSITIONS OR TEST PAPERS THEREFOR; PROCESSES OF PREPARING SUCH COMPOSITIONS; CONDITION-RESPONSIVE CONTROL IN MICROBIOLOGICAL OR ENZYMOLOGICAL PROCESSES
- C12Q2600/00—Oligonucleotides characterized by their use
- C12Q2600/112—Disease subtyping, staging or classification
-
- C—CHEMISTRY; METALLURGY
- C12—BIOCHEMISTRY; BEER; SPIRITS; WINE; VINEGAR; MICROBIOLOGY; ENZYMOLOGY; MUTATION OR GENETIC ENGINEERING
- C12Q—MEASURING OR TESTING PROCESSES INVOLVING ENZYMES, NUCLEIC ACIDS OR MICROORGANISMS; COMPOSITIONS OR TEST PAPERS THEREFOR; PROCESSES OF PREPARING SUCH COMPOSITIONS; CONDITION-RESPONSIVE CONTROL IN MICROBIOLOGICAL OR ENZYMOLOGICAL PROCESSES
- C12Q2600/00—Oligonucleotides characterized by their use
- C12Q2600/158—Expression markers
Definitions
- the present invention relates to a method of predicting response to treatment with a disease-modifying anti-rheumatic drug, and/or classifying disease activity in a subject with rheumatoid arthritis.
- the method comprises determining the quantitative level of one or more biomarkers in a biological sample from the subject and either predicting response to treatment with a disease-modifying anti-rheumatic drug, classifying disease activity, and/or predicting response to treatment with a disease-modifying anti-rheumatic drug and classifying disease activity; based on the quantitative level of the or each biomarker in the biological sample.
- RA rheumatoid arthritis
- the human plasma proteome is of particular interest as it contains proteins secreted or shed by circulating cells and tissue involved in the pathogenesis of RA. When the body is under stress, for example during chronic inflammation, the plasma proteome changes as part of the immune response. This study focusses on identifying and quantifying changes in circulating plasma proteins between patients with variable treatment responses, as this approach can also improve our understanding of disease pathogenesis.
- DMARDs Disease-modifying anti-rheumatic drugs
- cDMARDs conventional DMARDs
- bDMARDs biologic DMARDs
- Commonly used conventional DMARDs include methotrexate, leflunomide, hydroxychloroquine, and sulfasalazine.
- Biologic DMARDs were introduced in the early 1990s and are usually prescribed after the failure of conventional DMARD therapy (ongoing disease activity, or clinical or radiographic disease progression).
- biologic agents include infliximab, adalimumab, etanercept, rituximab, abatacept, rituximab, tocilizumab, tofacitinib, among others.
- Biologic DMARDs are highly specific and target a specific pathway of the immune system.
- CRP C-reactive protein
- FLS fibroblast-like synoviocyte
- WO 2019/147779 relates to diagnostic methods, therapeutic methods, and kits for treating an individual having rheumatoid arthritis.
- US7935482 relates to the use of gene expression data in the identification, monitoring and treatment of rheumatoid arthritis and in characterization and evaluation of inflammatory conditions induced or related to rheumatoid arthritis.
- SEIJI NAKAMURA ET AL 2016-07-19 identified original gene expression predictive signatures uniquely underlying the therapeutic effects of DMARDs: IFX, TCZ, and ABT.
- JING CUI ET AL suggests that CD84 genotype and/or expression may prove to be a biomarker for etanercept response in RA patients.
- ANUP SINGH ET AL (2019-02-28), DIARRA DANIELLE ET AL (2007-01-21) and MARSHALL M J ET AL (2009-04-21) show that serum levels of Dkk-1 in rheumatoid arthritis patients were shown to be proportional to disease activity.
- an in vitro method of predicting response to treatment with a disease-modifying anti-rheumatic drug (DMARD), and/or classifying disease activity in a subject with rheumatoid arthritis in a subject comprising the steps of:
- the two biomarkers for predicting response to treatment with a DMARD, and/or classifying disease activity further comprises ITGB1BP2.
- the two biomarkers for predicting response to treatment with a DMARD, and/or classifying disease activity further comprises CASP-3.
- the two biomarkers for predicting response to treatment with a DMARD, and/or classifying disease activity further comprises PDFG subunit A.
- the two biomarkers for predicting response to treatment with a DMARD, and/or classifying disease activity further comprises Dkk-1.
- the two biomarkers for predicting response to treatment with a DMARD, and/or classifying disease activity further comprises SELP.
- the two biomarkers for predicting response to treatment with a DMARD, and/or classifying disease activity further comprises SOD2.
- the two biomarkers for predicting response to treatment with a DMARD, and/or classifying disease activity further comprises SORT1.
- the two biomarkers for predicting response to treatment with a DMARD, and/or classifying disease activity further comprises CD84.
- a method of predicting response to treatment with a disease-modifying anti-rheumatic drug (DMARD), and/or classifying disease activity in a subject with rheumatoid arthritis comprising the steps of:
- the two or more biomarkers is a gene.
- the two or more biomarkers is a nucleic acid.
- the two or more biomarkers is a deoxyribonucleic acid.
- the two or more biomarkers is a ribonucleic acid.
- the two or more biomarkers is a protein.
- the two or more biomarkers is a peptide.
- the two or more biomarkers for predicting response to treatment with a DMARD, and/or classifying disease activity is a gene having a GenBank Accession Version Number selected from one or more of AK300069.1, L07414.1, BC108901.2, AJ413269.1, AH002928.2, AH009834.2, AL022146.1, X07834.1, AL390252.9 and AF054816.1.
- the two or more biomarkers for predicting response to treatment with a DMARD, and/or classifying disease activity is a protein having a UniProt ID selected from one or more of Q16698, P29965, Q9UKP3, P42574, P04085, O94907, P16109, P04179, Q99523 and Q9UIB8.
- the two or more biomarkers for predicting response to treatment with a DMARD further comprises CASP-3, SELP, JAM-A, PDFG subunit A, ITGB1BP2, Dkk-1, PECAM-1, ANG-1, SOD2, DAPP1, DCTN1, PAI and CD40-L.
- the two or more biomarkers for predicting response to treatment with a DMARD is selected from one or more of DECR1, CASP-3, SELP, JAM-A, PDGF subunit A, ITGB1BP2, Dkk-1, PECAM-1, ANG-1, SOD2, DAPP1, DCTN1, PAI and CD40-L.
- the two or more biomarkers for predicting response to treatment with a DMARD further comprises HB-EGF, HCLS1, IRAK4, STK4, SH2B3, NEMO, CD84, EIF4G1, PRDX1, TANK, CXCL1, SIRT2, ZBTB16, NF2, PDGF subunit B, SPRY2, HEXIM1, PPP1R9B, PRDX3, PAR-1, ICA1, CCL17, STAMPB, MGMT, SRPK2, BML hydrolase, PLXNA4 and SORT1.
- the two or more biomarkers for predicting response to treatment with a DMARD is selected from one or more of DECR1, CASP-3, SELP, JAM-A, PDGF subunit A, ITGB1BP2, Dkk-1, PECAM-1, ANG-1, SOD2, DAPP1, DCTN1, PAI, CD40-L, HB-EGF, HCLS1, IRAK4, STK4, SH2B3, NEMO, CD84, EIF4G1, PRDX1, TANK, CXCL1, SIRT2, ZBTB16, NF2, PDGF subunit B, SPRY2, HEXIM1, PPP1R9B, PRDX3, PAR-1, ICA1, CCL17, STAMPB, MGMT, SRPK2, BML hydrolase, PLXNA4 and SORT1.
- the two or more biomarkers for predicting response to treatment with a DMARD is a gene having a GenBank Accession Version Number selected from one or more of AK300069.1, AJ413269.1, AL022146.1, AL136649.1, AH002928.2, BC108901.2, BC107046.2, JQ287500.1, AY124380.1, X07834.1, AF178987.1 AK314352.1, X04731.1, AK222896.1, AC004634.1, AK312750.1, AY340965.1, Z93016.2, BC136451.1, AJ271718.1, AF054816.1, AK131407.1, CR407652.1, AC009299.5, BT006880.1, KF032391.1, BC029812.1, Y18000.1, M12783.1, AL354668.13, BC006460.1, KF495721.1, BT020007.1, BC002464.2, U37183.1, CH47
- the two or more biomarkers for predicting response to treatment with a DMARD is a protein having a UniProt ID selected from one or more of Q16698, P42574, P16109, Q9Y624, P04085, Q9UKP3, Q9UBT3, P16284, Q15389, P04179, Q9UN19, Q14203, P05121, P25942, Q99075, P14317, Q9NWZ3, Q13043, Q9UQQ2, Q9Y6K9, Q9UIB8, Q04637, Q06830, Q92844, P09341, Q8IXJ6, Q05516, P35240, P01127, O43597, O94992, Q96SB3, P30048, P25116, Q05084, Q92583, 095630, P16455, P78362, Q13867, Q9HCM2 and Q99523.
- a UniProt ID selected from one or more of Q16698, P42574, P16109, Q9Y62
- the two or more biomarkers for predicting treatment response in a subject treated with a DMARD is selected from one or more of DECR1, CD40-L, ITGB1BP2, CASP-3, PDFG subunit A, Dkk-1, SELP, SOD2, SORT1 and CD84.
- a method of classifying disease activity in a subject with rheumatoid arthritis comprising the steps of:
- the two or more biomarkers for classifying disease activity further comprises CD40-L, ITGB1BP2, CASP-3, PDFG subunit A, Dkk-1, SELP, SOD2, SORT1 and CD84.
- the two or more biomarkers for classifying disease activity is a gene having a GenBank Accession Version Number selected from one or more of AK300069.1, L07414.1, BC108901.2, AJ413269.1, AH002928.2, AH009834.2, AL022146.1, X07834.1, AL390252.9 and AF054816.1 .
- the two or more biomarkers for classifying disease activity is a protein having a UniProt ID selected from one or more of Q16698, P29965, Q9UKP3, P42574, P04085, O94907, P16109, P04179, Q99523 and Q9UIB8 .
- the determining step (a) comprises determining the quantitative level of three, four, five, six, seven, eight, nine, ten, eleven, twelve, thirteen, fourteen, fifteen, twenty, twenty five, thirty, thirty five, forty, forty two or more biomarkers in the biological sample from the subject.
- the determining step (a) comprises determining the quantitative level of all of the biomarkers in the biological sample from the subject.
- the determining step (a) comprises determining the quantitative level of each of the biomarkers in the biological sample from the subject.
- the biological sample is selected from whole blood, serum, plasma, urine, interstitial fluid, peritoneal fluid, cervical swab, tears, saliva, buccal swab, skin, brain tissue, and cerebrospinal fluid.
- the biological sample is selected from whole blood, serum, and plasma.
- the biological sample is whole blood.
- the biological sample is plasma.
- the predicting and/or classifying step (b) comprises comparing the quantitative level of two or more biomarkers in the biological sample from the subject with the quantitative level of the or each respective biomarkers in a normal sample.
- the normal sample is a biological sample from a subject not treated with a DMARD.
- the normal sample is a biological sample from a subject not treated with a DMARD and not suffering from rheumatoid arthritis.
- the subject is treated with one or more DMARDs
- the subject is treated with one or more DMARDs, including any one or more of infliximab, adalimumab, etanercept, rituximab, abatacept, rituximab, tocilizumab, certolizumab, golimumab, anakinra, baricitinib, upadacitinab and tofacitinib.
- DMARDs including any one or more of infliximab, adalimumab, etanercept, rituximab, abatacept, rituximab, tocilizumab, certolizumab, golimumab, anakinra, baricitinib, upadacitinab and tofacitinib.
- the subject is treated with one or more DMARDs, including any one or more of infliximab, adalimumab, etanercept, rituximab, abatacept, rituximab, tocilizumab, certolizumab, golimumab, anakinra, baricitinib, upadacitinab and tofacitinib, and will respond to treatment (responder).
- DMARDs including any one or more of infliximab, adalimumab, etanercept, rituximab, abatacept, rituximab, tocilizumab, certolizumab, golimumab, anakinra, baricitinib, upadacitinab and tofacitinib, and will respond to treatment (responder).
- the subject is treated with one or more DMARDs including any one or more of infliximab, adalimumab, etanercept, rituximab, abatacept, rituximab, tocilizumab, certolizumab, golimumab, anakinra, baricitinib, upadacitinab and tofacitinib, and will not respond to treatment (non-responder).
- DMARDs including any one or more of infliximab, adalimumab, etanercept, rituximab, abatacept, rituximab, tocilizumab, certolizumab, golimumab, anakinra, baricitinib, upadacitinab and tofacitinib, and will not respond to treatment (non-responder).
- the method is a method of predicting response to treatment with a conventional disease-modifying anti-rheumatic drug (cDMARD).
- cDMARD disease-modifying anti-rheumatic drug
- the subject is treated with one or more cDMARDs.
- the subject is treated with one or more cDMARDs, including any one or more of apremilast, azathioprine, ciclosporin, cyclophosphamide, sodium aurothiomalate, mycophenolate mofetil, penicillamine, tacrolimus,, methotrexate, sulfasalazine, leflunomide and hydroxychloroquine.
- cDMARDs including any one or more of apremilast, azathioprine, ciclosporin, cyclophosphamide, sodium aurothiomalate, mycophenolate mofetil, penicillamine, tacrolimus,, methotrexate, sulfasalazine, leflunomide and hydroxychloroquine.
- the subject is treated with one or more cDMARDs, including any one or more of apremilast, azathioprine, ciclosporin, cyclophosphamide, sodium aurothiomalate, mycophenolate mofetil, penicillamine, tacrolimus, methotrexate, sulfasalazine, leflunomide and hydroxychloroquine, and will respond to treatment (responder).
- cDMARDs including any one or more of apremilast, azathioprine, ciclosporin, cyclophosphamide, sodium aurothiomalate, mycophenolate mofetil, penicillamine, tacrolimus, methotrexate, sulfasalazine, leflunomide and hydroxychloroquine
- the subject is treated with one or more cDMARDs including apremilast, azathioprine, ciclosporin, cyclophosphamide, sodium aurothiomalate, mycophenolate mofetil, penicillamine, tacrolimus, methotrexate, sulfasalazine, leflunomide and hydroxychloroquine, and will not respond to treatment (non-responder).
- cDMARDs including apremilast, azathioprine, ciclosporin, cyclophosphamide, sodium aurothiomalate, mycophenolate mofetil, penicillamine, tacrolimus, methotrexate, sulfasalazine, leflunomide and hydroxychloroquine
- the determining step (a) further comprises determining the quantitative level in a first set of two or more respective biomarkers.
- the determining step (a) further comprises determining the quantitative level in a first set of respective biomarkers(s) wherein the quantitative level of the first set of biomarkers is greater than the quantitative level of the respective biomarkers(s) in a normal sample, which is indicative of a non-responder.
- the first set of biomarkers is selected from any one or more of DECR1, CASP-3, SELP, JAM-A, PDFG subunit A, ITGB1BP2, Dkk-1, PECAM-1, ANG-1, SOD2, DAPP1, DCTN1, PAI, CD40-L, HB-EGF, HCLS1, IRAK4, STK4, SH2B3, NEMO, CD84, EIF4G1, PRDX1, TANK, CXCL1, SIRT2, ZBTB16, NF2, PDGF subunit B, SPRY2, HEXIM1, PPP1R9B, PRDX3, PAR-1, ICA1, CCL17, STAMPB, MGMT, SRPK2, BML hydrolase, PLXNA4 and SORT1.
- the determining step (a) further comprises determining the quantitative level in a second set of respective biomarkers(s).
- the determining step (a) further comprises determining the quantitative level in a second set of respective biomarkers(s) wherein the quantitative level of the second set of biomarkers is less than the quantitative level of the respective biomarkers(s) in a normal sample, which is indicative of a non-responder.
- the second set of biomarkers is selected from any one or more of DECR1, CD40-L, ITGB1BP2, CASP-3, PDGF subunit A, Dkk-1, SELP, SOD2, SORT1 and CD84.
- the quantitative level of the or each biomarker is higher than a threshold value and is indicative of a non-responder, wherein the respective threshold value of the or each biomarker is: Biomarker Threshold value DECR1 7.1320 CASP-3 10.4740 SELP 10.5279 PDGF subunit A 5.5889 ITGB1BP2 6.2200 Dkk-1 10.4467 SOD2 9.9025 CD40-L 7.4976 CD84 6.0718 SORT1 8.5585
- the quantitative level of the or each biomarker is lower than a threshold value and is indicative of a responder, wherein the respective threshold value of the or each biomarker is: Biomarker Threshold value DECR1 7.1320 CASP-3 10.4740 SELP 10.5279 PDGF subunit A 5.5889 ITGB1BP2 6.2200 Dkk-1 10.4467 SOD2 9.9025 CD40-L 7.4976 CD84 6.0718 SORT1 8.5585
- the quantitative level of the or each biomarker is between two threshold values and is indicative of high disease activity, wherein the respective threshold values of the or each biomarker are: Biomarker Threshold value DECR1 7.8984 - 11.6893 CD40-L 8.4728 - 12.7503 ITGB1BP2 6.7802 - 11.4759 CASP-3 11.4114 - 13.6768 PDFG subunit A 5.7334 - 8.4577 Dkk-1 11.2034 - 12.7568 SELP 11.3715 - 12.6136 SOD2 10.0471 - 10.5467 SORT1 8.7990 - 9.7006 CD84 6.1830 - 7.8683
- the quantitative level of the or each biomarker is between two threshold values and is indicative of moderate disease activity, wherein the respective threshold values of the or each biomarker are: Biomarker Threshold values DECR1 5.6510 - 10.5039 CD40-L 6.1622 - 10.1159 ITGB1BP2 3.1210 - 8.5301 CASP-3 8.0945 - 12.2662 PDFG subunit A 3.9517 - 7.0510 Dkk-1 9.1861 - 12.0037 SELP 9.2287 - 11.9099 SOD2 9.5039 - 10.2607 SORT1 7.5225 - 9.2595 CD84 4.9694 - 6.8399
- the quantitative level of the or each biomarker is between two threshold values and is indicative of low disease activity, wherein the respective threshold values of the or each biomarker are: Biomarker Threshold values DECR1 6.6490 - 6.7309 CD40-L 6.5871 - 6.9401 ITGB1BP2 4.1040 - 4.5746 CASP-3 8.3368 - 8.7173 PDFG subunit A 3.8283 - 4.0907 Dkk-1 9.6015 - 9.8410 SELP 8.2174 - 9.3414 SOD2 9.6542 - 9.9702 SORT1 7.7980 - 8.5272 CD84 5.2689 - 5.5881
- the quantitative level of the or each biomarker is between two threshold values and is indicative of in remission, wherein the respective threshold values of the or each biomarker are: Biomarker Threshold value DECR1 5.6064 - 6.9173 CD40-L 6.2510 - 7.3891 ITGB1BP2 3.4508 - 5.5040 CASP-3 7.9543 - 9.2353 PDFG subunit A 2.7648 - 4.9645 Dkk-1 9.2598 - 9.9684 SELP 8.8272 - 9.9551 SOD2 9.5195 - 9.7582 SORT1 7.6829 - 8.4218 CD84 4.6188 - 5.8750
- the method is a method of classifying disease activity, wherein the subject has high disease activity, moderate disease activity, low disease activity or is in remission.
- the quantitative level of the or each biomarker is higher compared to a subject with moderate disease activity, low disease activity and in remission.
- the quantitative level of the or each biomarker is higher compared to a subject with low disease activity and in remission, but the quantitative level of the or each biomarker is lower compared to a subject with high disease activity.
- the quantitative level of the or each biomarker is higher compared to a subject with in remission, but the quantitative level of the or each biomarker is lower compared to a subject with high disease activity and moderate disease activity.
- the quantitative level of the or each biomarker is lower compared to a subject with high disease activity, moderate disease activity and low disease activity.
- the method of classifying disease activity is a method of prognosing disease activity.
- the method of predicting response to treatment with a DMARD, and/or classifying disease activity is an in vitro method.
- the method of predicting response to treatment with a cDMARD, and/or classifying disease activity is an in vitro method.
- the method of predicting response to treatment with a DMARD is an in vitro method.
- the method of predicting response to treatment with a cDMARD is an in vitro method.
- the method of classifying disease activity is an in vitro method.
- the method of prognosing disease activity is an in vitro method.
- Also disclosed but not part of the invention is a method of treating rheumatoid arthritis by predicting response to treatment with a DMARD; and treating the subject.
- Also disclosed but not part of the invention is method of treating rheumatoid arthritis by predicting response to treatment with a cDMARD; and treating the subject.
- Also disclosed but not part of the invention is method of treating rheumatoid arthritis by classifying disease activity; and treating the subject.
- Also disclosed but not part of the invention is method of treating rheumatoid arthritis by predicting response to treatment with a DMARD, and/or classifying disease activity; and treating the subject.
- Also disclosed but not part of the invention is method of treating rheumatoid arthritis by predicting response to treatment with a cDMARD, and/or classifying disease activity; and treating the subject.
- ACR American College of Rheumatology
- cDMARD disease-modifying anti-rheumatic drugs
- Peripheral whole blood used for plasma extraction was collected in an EDTA coated tube (Aquilant Scientific) using a venepuncture technique. Blood tubes were stored at 4 °C for a maximum of 2 hours until processing. The blood tube was centrifuged in an Eppendorf 5804 centrifuge at 300 rcf for 10 minutes at 18 °C. The majority of the upper plasma layer was removed and stored at -80 °C for later analysis.
- PDA Proximity Extension Assay
- Plasma from each patient sample was thawed and a small volume of ⁇ 40 ⁇ l was sent to OLINK (Analysis service Uppsala, Sweden). Each sample was analysed across OLINK's CVD II, CVD III, immune response and inflammatory panels. Each high throughput multiplex immunoassay consisted of 92 proteins.
- PDA 'Proximity Extension Assay'
- matched antibody pairs containing unique DNA sequences were incubated with the sample. Sequences that were exactly matched hybridized and were extended using DNA polymerase. The elongated DNA was then amplified and a qPCR readout using Fluidigm ® BioMARKTM was used to determine the results of each protein target.
- the assay included internal controls at each stage of the reaction, negative controls to determine background values, and inter-plate controls to account for variability between plates.
- ⁇ Ct values were log normalised to what is called 'normalised protein expression' values or NPX.
- Perseus software version 1.6.0.7 was used to analyse the vast range of NPX values across patient groups.
- a Z-score was performed across the entire data set in order to standardise the NPX values.
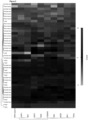
- Figure 1 illustrates a heat map showing only the proteins that were significantly different between groups, having an FDR q value of ⁇ 0.05.
- the unsupervised clustering of the heat map shows a split between a) cDMARD non-responders b) cDMARD naive (normal) and c) cDMARD responders, where just one cDMARD non-responder is clustered among the responders.
- one cDMARD non-responder shows a reduced protein expression for the majority of the 42 proteins graphed, compared to all other patient samples. The reason for this outlier is unclear from available clinical data.
- DAS28-ESR scores from clinical data recorded on the same day as sampling were classified according to EULAR criteria (NICE 2009).
- a DAS28-ESR score of ⁇ 5.1 was classified as 'high' disease activity, >3.2 and ⁇ 5.1 was 'moderate', >2.6 and ⁇ 3.2 was 'low', and ⁇ 2.6 was classified as 'remission'.
- Table. 3. Each group was analysed by ANOVA with permutation based FDR.
- Unsupervised clustering of proteins calculated to be significantly different between RA patients with high, moderate or low disease activity, or who are in remission
- Figure 2 illustrates a heat map with unsupervised clustering showing only the proteins that were significantly different between groups. Of the four protein panels analysed, only ten were statistically significantly different in normalised levels between patient groups.
- Proteins are ranked from left to right, with the best performing protein on the left, based on AUC score.
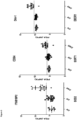
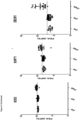
- ROC curve analysis of each protein when a cut-off (y-intercept) value is applied to distinguish RA cDMARD responders and non-responders ( Figure 3 ).
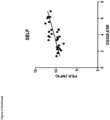
- correlation data of each NPX value with DAS28-ESR score ( Figure 4 ).
- Proteins acting in combination all achieved an AUC score of 1.
- we generated nonsense data by randomly swapping patients between the responder and non-responder groups sufficiently to obtain decorrelated nonsense data.
- optimised classifiers to the nonsense data using the same protein combinations and calculated the corresponding AUC score.
- Each column presents the results for the classifier obtained for the protein labelled in the column in combination with any proteins to the left of the column. As we move to the right of the table, incrementally more proteins are included in the classifier. AUC, sensitivity and specificity are shown for the protein combinations applied to true data. Also shown are the overfitting rate (mean benchmark AUC) and the standard error in the benchmark AUC, obtained from twenty iterations of calculating nonsense data, the mean sensitivity and specificity of the classifiers obtained for nonsense data and the thresholds identified which grow in dimension with increasing numbers of proteins.
- each of the individual 10 proteins demonstrates good sensitivity (>88%) and specificity (>88%) in distinguishing responders from non-responders.
- DECR1 and CD40-L are the most optimal individual proteins in distinguishing response. No incremental benefit was observed when combining these proteins with each other or the others on the list (Table 5).
Landscapes
- Chemical & Material Sciences (AREA)
- Life Sciences & Earth Sciences (AREA)
- Proteomics, Peptides & Aminoacids (AREA)
- Health & Medical Sciences (AREA)
- Organic Chemistry (AREA)
- Wood Science & Technology (AREA)
- Analytical Chemistry (AREA)
- Zoology (AREA)
- Genetics & Genomics (AREA)
- Engineering & Computer Science (AREA)
- Pathology (AREA)
- Immunology (AREA)
- Microbiology (AREA)
- Molecular Biology (AREA)
- Biotechnology (AREA)
- Biophysics (AREA)
- Physics & Mathematics (AREA)
- Biochemistry (AREA)
- Bioinformatics & Cheminformatics (AREA)
- General Engineering & Computer Science (AREA)
- General Health & Medical Sciences (AREA)
- Measuring Or Testing Involving Enzymes Or Micro-Organisms (AREA)
- Investigating Or Analysing Biological Materials (AREA)
Description
- The present invention relates to a method of predicting response to treatment with a disease-modifying anti-rheumatic drug, and/or classifying disease activity in a subject with rheumatoid arthritis. The method comprises determining the quantitative level of one or more biomarkers in a biological sample from the subject and either predicting response to treatment with a disease-modifying anti-rheumatic drug, classifying disease activity, and/or predicting response to treatment with a disease-modifying anti-rheumatic drug and classifying disease activity; based on the quantitative level of the or each biomarker in the biological sample.
- Many studies have highlighted the need for robust biomarkers in rheumatoid arthritis (RA) in order to assist with diagnosis, prognosis and determining treatment response. The human plasma proteome is of particular interest as it contains proteins secreted or shed by circulating cells and tissue involved in the pathogenesis of RA. When the body is under stress, for example during chronic inflammation, the plasma proteome changes as part of the immune response. This study focusses on identifying and quantifying changes in circulating plasma proteins between patients with variable treatment responses, as this approach can also improve our understanding of disease pathogenesis.
- Disease-modifying anti-rheumatic drugs (DMARDs) are immunosuppressive and immunomodulatory agents, and are classified as either conventional DMARDs (cDMARDs) or biologic DMARDs (bDMARDs). Commonly used conventional DMARDs include methotrexate, leflunomide, hydroxychloroquine, and sulfasalazine. Biologic DMARDs were introduced in the early 1990s and are usually prescribed after the failure of conventional DMARD therapy (ongoing disease activity, or clinical or radiographic disease progression). Some biologic agents include infliximab, adalimumab, etanercept, rituximab, abatacept, rituximab, tocilizumab, tofacitinib, among others. Biologic DMARDs are highly specific and target a specific pathway of the immune system.
- Currently, clinicians consider C-reactive protein (CRP) a biomarker of inflammation. Although NICE guidelines recommend regular monitoring of CRP levels throughout treatment of RA (NICE 2009), some studies suggest it can be used as a substitute of erythrocyte sedimentation rate (ESR) in composite scores used to determine treatment response such as the Disease Activity Score in 28 joints (DAS28). However, the increase in plasma CRP levels observed in RA compared to health is caused in part by the secretion of IL-6 from T-cells and macrophages during inflammation and conflicting evidence brings into question CRP's reliability as a marker of joint inflammation or disease activity. The lack of specificity of CRP to RA pathology may be a contributing factor to this contradictory evidence.
- The wide variety of proteomic techniques now available has enabled research groups to robustly analyse a number of biological sample types. The most obvious, pathologically proximal sample to study disease activity in RA patients is synovial fluid. For example, a study using isobaric tag labelling of synovial peptides identified over 500 proteins that were differentially expressed between osteoarthritis (OA) and RA patients.
- Cytosolic proteins isolated from synovial tissue and analysed by 2-dimensional gel electrophoresis discovered protein expression patterns which differentiate RA from spondyloarthropathy, enabling earlier diagnosis. Similar studies have used the same method to analyse proteins from fibroblast-like synoviocyte (FLS) cells and have also identified potential novel diagnostic proteins for RA. The analysis of proteins from synovial fluid or tissue may be useful in understanding disease pathogenesis, as this is the target of the autoimmune response in RA. However, this sampling method is rather invasive, and it is an impractical sample in comparator healthy control groups. Although the study of proteins from tissue-specific cells is advantageous in understanding the cell biology of RA, the lengthy laboratory procedures are somewhat unrealistic for regular determination of treatment response.
- An increasing number of studies have investigated potential circulating biomarkers of treatment response in RA. Some studies have looked at circulating cellular markers of response. Peripheral blood is a potentially rich source of biomarker candidates to determine treatment response in RA. However, previous studies have failed to identify robust proteins that are indicative of both disease activity and treatment response. This study focuses on the circulating plasma proteome in RA as an accessible source of potential response biomarkers.
-
WO 2019/147779 relates to diagnostic methods, therapeutic methods, and kits for treating an individual having rheumatoid arthritis.US7935482 relates to the use of gene expression data in the identification, monitoring and treatment of rheumatoid arthritis and in characterization and evaluation of inflammatory conditions induced or related to rheumatoid arthritis. SEIJI NAKAMURA ET AL (2016-07-19) identified original gene expression predictive signatures uniquely underlying the therapeutic effects of DMARDs: IFX, TCZ, and ABT. JING CUI ET AL (2013-03-28) suggests that CD84 genotype and/or expression may prove to be a biomarker for etanercept response in RA patients. ANUP SINGH ET AL (2019-02-28), DIARRA DANIELLE ET AL (2007-01-21) and MARSHALL M J ET AL (2009-04-21) show that serum levels of Dkk-1 in rheumatoid arthritis patients were shown to be proportional to disease activity. - According to a first aspect of the present invention, there is provided an in vitro method of predicting response to treatment with a disease-modifying anti-rheumatic drug (DMARD), and/or classifying disease activity in a subject with rheumatoid arthritis in a subject, the method comprising the steps of:
- (a) determining the quantitative level of two or more biomarkers in a biological sample from the subject; and
- (b) predicting response to treatment with a DMARD. and/or classifying disease activity in a subject with rheumatoid arthritis in the subject based on the quantitative level of the or each biomarker in the biological sample;
- Optionally, the two biomarkers for predicting response to treatment with a DMARD, and/or classifying disease activity further comprises ITGB1BP2.
- Optionally, the two biomarkers for predicting response to treatment with a DMARD, and/or classifying disease activity further comprises CASP-3.
- Optionally, the two biomarkers for predicting response to treatment with a DMARD, and/or classifying disease activity further comprises PDFG subunit A.
- Optionally, the two biomarkers for predicting response to treatment with a DMARD, and/or classifying disease activity further comprises Dkk-1.
- Optionally, the two biomarkers for predicting response to treatment with a DMARD, and/or classifying disease activity further comprises SELP.
- Optionally, the two biomarkers for predicting response to treatment with a DMARD, and/or classifying disease activity further comprises SOD2.
- Optionally, the two biomarkers for predicting response to treatment with a DMARD, and/or classifying disease activity further comprises SORT1.
- Optionally, the two biomarkers for predicting response to treatment with a DMARD, and/or classifying disease activity further comprises CD84.
- Optionally, there is provided a method of predicting response to treatment with a disease-modifying anti-rheumatic drug (DMARD), and/or classifying disease activity in a subject with rheumatoid arthritis, the method comprising the steps of:
- (a) determining the quantitative level of two or more biomarkers in a biological sample from the subject; and
- (b) predicting response to treatment with a DMARD, and/or classifying disease activity based on the quantitative level of the two biomarkers in the biological sample;
- Optionally, the two or more biomarkers is a gene.
- Optionally, the two or more biomarkers is a nucleic acid.
- Optionally, the two or more biomarkers is a deoxyribonucleic acid.
- Optionally, the two or more biomarkers is a ribonucleic acid.
- Preferably, the two or more biomarkers is a protein.
- Optionally, the two or more biomarkers is a peptide.
- Optionally, the two or more biomarkers for predicting response to treatment with a DMARD, and/or classifying disease activity is a gene having a GenBank Accession Version Number selected from one or more of AK300069.1, L07414.1, BC108901.2, AJ413269.1, AH002928.2, AH009834.2, AL022146.1, X07834.1, AL390252.9 and AF054816.1.
- Preferably, the two or more biomarkers for predicting response to treatment with a DMARD, and/or classifying disease activity is a protein having a UniProt ID selected from one or more of Q16698, P29965, Q9UKP3, P42574, P04085, O94907, P16109, P04179, Q99523 and Q9UIB8.
- Optionally, the two or more biomarkers for predicting response to treatment with a DMARD further comprises CASP-3, SELP, JAM-A, PDFG subunit A, ITGB1BP2, Dkk-1, PECAM-1, ANG-1, SOD2, DAPP1, DCTN1, PAI and CD40-L.
- Optionally, the two or more biomarkers for predicting response to treatment with a DMARD is selected from one or more of DECR1, CASP-3, SELP, JAM-A, PDGF subunit A, ITGB1BP2, Dkk-1, PECAM-1, ANG-1, SOD2, DAPP1, DCTN1, PAI and CD40-L.
- Optionally, the two or more biomarkers for predicting response to treatment with a DMARD further comprises HB-EGF, HCLS1, IRAK4, STK4, SH2B3, NEMO, CD84, EIF4G1, PRDX1, TANK, CXCL1, SIRT2, ZBTB16, NF2, PDGF subunit B, SPRY2, HEXIM1, PPP1R9B, PRDX3, PAR-1, ICA1, CCL17, STAMPB, MGMT, SRPK2, BML hydrolase, PLXNA4 and SORT1.
- Optionally, the two or more biomarkers for predicting response to treatment with a DMARD is selected from one or more of DECR1, CASP-3, SELP, JAM-A, PDGF subunit A, ITGB1BP2, Dkk-1, PECAM-1, ANG-1, SOD2, DAPP1, DCTN1, PAI, CD40-L, HB-EGF, HCLS1, IRAK4, STK4, SH2B3, NEMO, CD84, EIF4G1, PRDX1, TANK, CXCL1, SIRT2, ZBTB16, NF2, PDGF subunit B, SPRY2, HEXIM1, PPP1R9B, PRDX3, PAR-1, ICA1, CCL17, STAMPB, MGMT, SRPK2, BML hydrolase, PLXNA4 and SORT1.
- Optionally, the two or more biomarkers for predicting response to treatment with a DMARD is a gene having a GenBank Accession Version Number selected from one or more of AK300069.1, AJ413269.1, AL022146.1, AL136649.1, AH002928.2, BC108901.2, BC107046.2, JQ287500.1, AY124380.1, X07834.1, AF178987.1 AK314352.1, X04731.1, AK222896.1, AC004634.1, AK312750.1, AY340965.1, Z93016.2, BC136451.1, AJ271718.1, AF054816.1, AK131407.1, CR407652.1, AC009299.5, BT006880.1, KF032391.1, BC029812.1, Y18000.1, M12783.1, AL354668.13, BC006460.1, KF495721.1, BT020007.1, BC002464.2, U37183.1, CH471092.1, CH471053.2, M60761.1, AC004884.1, AK312896.1, AC009365.9 and AL390252.9.
- Preferably, the two or more biomarkers for predicting response to treatment with a DMARD is a protein having a UniProt ID selected from one or more of Q16698, P42574, P16109, Q9Y624, P04085, Q9UKP3, Q9UBT3, P16284, Q15389, P04179, Q9UN19, Q14203, P05121, P25942, Q99075, P14317, Q9NWZ3, Q13043, Q9UQQ2, Q9Y6K9, Q9UIB8, Q04637, Q06830, Q92844, P09341, Q8IXJ6, Q05516, P35240, P01127, O43597, O94992, Q96SB3, P30048, P25116, Q05084, Q92583, 095630, P16455, P78362, Q13867, Q9HCM2 and Q99523.
- Preferably, the two or more biomarkers for predicting treatment response in a subject treated with a DMARD is selected from one or more of DECR1, CD40-L, ITGB1BP2, CASP-3, PDFG subunit A, Dkk-1, SELP, SOD2, SORT1 and CD84.
- Optionally, there is provided a method of classifying disease activity in a subject with rheumatoid arthritis, the method comprising the steps of:
- (a) determining the quantitative level of two or more biomarkers in a biological sample from the subject; and
- (b) classifying disease activity based on the quantitative level of two or more biomarkers in the biological sample;
- Optionally, the two or more biomarkers for classifying disease activity further comprises CD40-L, ITGB1BP2, CASP-3, PDFG subunit A, Dkk-1, SELP, SOD2, SORT1 and CD84.
- Optionally, the two or more biomarkers for classifying disease activity is a gene having a GenBank Accession Version Number selected from one or more of AK300069.1, L07414.1, BC108901.2, AJ413269.1, AH002928.2, AH009834.2, AL022146.1, X07834.1, AL390252.9 and AF054816.1 .
- Preferably, the two or more biomarkers for classifying disease activity is a protein having a UniProt ID selected from one or more of Q16698, P29965, Q9UKP3, P42574, P04085, O94907, P16109, P04179, Q99523 and Q9UIB8 .
- Further optionally, the determining step (a) comprises determining the quantitative level of three, four, five, six, seven, eight, nine, ten, eleven, twelve, thirteen, fourteen, fifteen, twenty, twenty five, thirty, thirty five, forty, forty two or more biomarkers in the biological sample from the subject.
- Optionally, the determining step (a) comprises determining the quantitative level of all of the biomarkers in the biological sample from the subject.
- Optionally or additionally, the determining step (a) comprises determining the quantitative level of each of the biomarkers in the biological sample from the subject.
- Optionally, the biological sample is selected from whole blood, serum, plasma, urine, interstitial fluid, peritoneal fluid, cervical swab, tears, saliva, buccal swab, skin, brain tissue, and cerebrospinal fluid.
- Further optionally, the biological sample is selected from whole blood, serum, and plasma.
- Preferably, the biological sample is whole blood.
- Further preferably, the biological sample is plasma.
- Optionally, the predicting and/or classifying step (b) comprises comparing the quantitative level of two or more biomarkers in the biological sample from the subject with the quantitative level of the or each respective biomarkers in a normal sample.
- Optionally, the normal sample is a biological sample from a subject not treated with a DMARD.
- Optionally, the normal sample is a biological sample from a subject not treated with a DMARD and not suffering from rheumatoid arthritis.
- Optionally, the subject is treated with one or more DMARDs
- Optionally, the subject is treated with one or more DMARDs, including any one or more of infliximab, adalimumab, etanercept, rituximab, abatacept, rituximab, tocilizumab, certolizumab, golimumab, anakinra, baricitinib, upadacitinab and tofacitinib.
- Optionally, the subject is treated with one or more DMARDs, including any one or more of infliximab, adalimumab, etanercept, rituximab, abatacept, rituximab, tocilizumab, certolizumab, golimumab, anakinra, baricitinib, upadacitinab and tofacitinib, and will respond to treatment (responder). Optionally, in the method of predicting response to treatment with a DMARD, the subject is treated with one or more DMARDs including any one or more of infliximab, adalimumab, etanercept, rituximab, abatacept, rituximab, tocilizumab, certolizumab, golimumab, anakinra, baricitinib, upadacitinab and tofacitinib, and will not respond to treatment (non-responder).
- Optionally, the method is a method of predicting response to treatment with a conventional disease-modifying anti-rheumatic drug (cDMARD).
- Optionally, the subject is treated with one or more cDMARDs.
- Optionally, the subject is treated with one or more cDMARDs, including any one or more of apremilast, azathioprine, ciclosporin, cyclophosphamide, sodium aurothiomalate, mycophenolate mofetil, penicillamine, tacrolimus,, methotrexate, sulfasalazine, leflunomide and hydroxychloroquine.
- Optionally, the subject is treated with one or more cDMARDs, including any one or more of apremilast, azathioprine, ciclosporin, cyclophosphamide, sodium aurothiomalate, mycophenolate mofetil, penicillamine, tacrolimus, methotrexate, sulfasalazine, leflunomide and hydroxychloroquine, and will respond to treatment (responder).
- Optionally, in the method of predicting response to treatment with a cDMARD, the subject is treated with one or more cDMARDs including apremilast, azathioprine, ciclosporin, cyclophosphamide, sodium aurothiomalate, mycophenolate mofetil, penicillamine, tacrolimus, methotrexate, sulfasalazine, leflunomide and hydroxychloroquine, and will not respond to treatment (non-responder).
- Optionally, the determining step (a) further comprises determining the quantitative level in a first set of two or more respective biomarkers.
- Optionally, the determining step (a) further comprises determining the quantitative level in a first set of respective biomarkers(s) wherein the quantitative level of the first set of biomarkers is greater than the quantitative level of the respective biomarkers(s) in a normal sample, which is indicative of a non-responder.
- Optionally, the first set of biomarkers is selected from any one or more of DECR1, CASP-3, SELP, JAM-A, PDFG subunit A, ITGB1BP2, Dkk-1, PECAM-1, ANG-1, SOD2, DAPP1, DCTN1, PAI, CD40-L, HB-EGF, HCLS1, IRAK4, STK4, SH2B3, NEMO, CD84, EIF4G1, PRDX1, TANK, CXCL1, SIRT2, ZBTB16, NF2, PDGF subunit B, SPRY2, HEXIM1, PPP1R9B, PRDX3, PAR-1, ICA1, CCL17, STAMPB, MGMT, SRPK2, BML hydrolase, PLXNA4 and SORT1.
- Optionally, the determining step (a) further comprises determining the quantitative level in a second set of respective biomarkers(s).
- Optionally, the determining step (a) further comprises determining the quantitative level in a second set of respective biomarkers(s) wherein the quantitative level of the second set of biomarkers is less than the quantitative level of the respective biomarkers(s) in a normal sample, which is indicative of a non-responder.
- Optionally, the second set of biomarkers is selected from any one or more of DECR1, CD40-L, ITGB1BP2, CASP-3, PDGF subunit A, Dkk-1, SELP, SOD2, SORT1 and CD84.
- Further optionally, the quantitative level of the or each biomarker is higher than a threshold value and is indicative of a non-responder, wherein the respective threshold value of the or each biomarker is:
Biomarker Threshold value DECR1 7.1320 CASP-3 10.4740 SELP 10.5279 PDGF subunit A 5.5889 ITGB1BP2 6.2200 Dkk-1 10.4467 SOD2 9.9025 CD40-L 7.4976 CD84 6.0718 SORT1 8.5585 - Optionally, the quantitative level of the or each biomarker is lower than a threshold value and is indicative of a responder, wherein the respective threshold value of the or each biomarker is:
Biomarker Threshold value DECR1 7.1320 CASP-3 10.4740 SELP 10.5279 PDGF subunit A 5.5889 ITGB1BP2 6.2200 Dkk-1 10.4467 SOD2 9.9025 CD40-L 7.4976 CD84 6.0718 SORT1 8.5585 - Optionally, the quantitative level of the or each biomarker is between two threshold values and is indicative of high disease activity, wherein the respective threshold values of the or each biomarker are:
Biomarker Threshold value DECR1 7.8984 - 11.6893 CD40-L 8.4728 - 12.7503 ITGB1BP2 6.7802 - 11.4759 CASP-3 11.4114 - 13.6768 PDFG subunit A 5.7334 - 8.4577 Dkk-1 11.2034 - 12.7568 SELP 11.3715 - 12.6136 SOD2 10.0471 - 10.5467 SORT1 8.7990 - 9.7006 CD84 6.1830 - 7.8683 - Optionally, the quantitative level of the or each biomarker is between two threshold values and is indicative of moderate disease activity, wherein the respective threshold values of the or each biomarker are:
Biomarker Threshold values DECR1 5.6510 - 10.5039 CD40-L 6.1622 - 10.1159 ITGB1BP2 3.1210 - 8.5301 CASP-3 8.0945 - 12.2662 PDFG subunit A 3.9517 - 7.0510 Dkk-1 9.1861 - 12.0037 SELP 9.2287 - 11.9099 SOD2 9.5039 - 10.2607 SORT1 7.5225 - 9.2595 CD84 4.9694 - 6.8399 - Optionally, the quantitative level of the or each biomarker is between two threshold values and is indicative of low disease activity, wherein the respective threshold values of the or each biomarker are:
Biomarker Threshold values DECR1 6.6490 - 6.7309 CD40-L 6.5871 - 6.9401 ITGB1BP2 4.1040 - 4.5746 CASP-3 8.3368 - 8.7173 PDFG subunit A 3.8283 - 4.0907 Dkk-1 9.6015 - 9.8410 SELP 8.2174 - 9.3414 SOD2 9.6542 - 9.9702 SORT1 7.7980 - 8.5272 CD84 5.2689 - 5.5881 - Optionally, the quantitative level of the or each biomarker is between two threshold values and is indicative of in remission, wherein the respective threshold values of the or each biomarker are:
Biomarker Threshold value DECR1 5.6064 - 6.9173 CD40-L 6.2510 - 7.3891 ITGB1BP2 3.4508 - 5.5040 CASP-3 7.9543 - 9.2353 PDFG subunit A 2.7648 - 4.9645 Dkk-1 9.2598 - 9.9684 SELP 8.8272 - 9.9551 SOD2 9.5195 - 9.7582 SORT1 7.6829 - 8.4218 CD84 4.6188 - 5.8750 - Optionally, the method is a method of classifying disease activity, wherein the subject has high disease activity, moderate disease activity, low disease activity or is in remission.
- Optionally, in a subject with high disease activity, the quantitative level of the or each biomarker is higher compared to a subject with moderate disease activity, low disease activity and in remission.
- Optionally, in a subject with moderate disease activity, the quantitative level of the or each biomarker is higher compared to a subject with low disease activity and in remission, but the quantitative level of the or each biomarker is lower compared to a subject with high disease activity.
- Optionally, in a subject with low disease activity, the quantitative level of the or each biomarker is higher compared to a subject with in remission, but the quantitative level of the or each biomarker is lower compared to a subject with high disease activity and moderate disease activity.
- Optionally, in a subject in remission, the quantitative level of the or each biomarker is lower compared to a subject with high disease activity, moderate disease activity and low disease activity.
- Optionally, the method of classifying disease activity is a method of prognosing disease activity.
- Optionally, the method of predicting response to treatment with a DMARD, and/or classifying disease activity is an in vitro method.
- Optionally, the method of predicting response to treatment with a cDMARD, and/or classifying disease activity is an in vitro method.
- Optionally, the method of predicting response to treatment with a DMARD is an in vitro method.
- Optionally, the method of predicting response to treatment with a cDMARD is an in vitro method.
- Optionally, the method of classifying disease activity is an in vitro method.
- Optionally, the method of prognosing disease activity is an in vitro method.
- Also disclosed but not part of the invention is a method of treating rheumatoid arthritis by predicting response to treatment with a DMARD; and treating the subject.
- Also disclosed but not part of the invention is method of treating rheumatoid arthritis by predicting response to treatment with a cDMARD; and treating the subject.
- Also disclosed but not part of the invention is method of treating rheumatoid arthritis by classifying disease activity; and treating the subject.
- Also disclosed but not part of the invention is method of treating rheumatoid arthritis by predicting response to treatment with a DMARD, and/or classifying disease activity; and treating the subject.
- Also disclosed but not part of the invention is method of treating rheumatoid arthritis by predicting response to treatment with a cDMARD, and/or classifying disease activity; and treating the subject.
- Embodiments of the present invention will now be described with reference to the accompanying drawings and following non-limiting examples, in which:
-
Figure 1 illustrates unsupervised clustering of proteins calculated to be significantly different between DMARD naïve (normal) (N), DMARD responder (DR) and DMARD non-responder (DNR) RA patients; -
Figure 2 illustrates unsupervised clustering of proteins calculated to be significantly different between RA patients with high, moderate or low disease activity, or who are in remission. Disease activity classifications are based on EULAR guidelines; -
Figure 3 illustrates ROC curve analysis of each protein when a cut-off (y-intercept) value is applied to distinguish RA cDMARD responders and non-responders; and -
Figure 4 illustrates correlation of NPX values of top ten proteins of interest with DAS28-ESR score. - The research team at Ulster University collaborated with rheumatologists from the Western Health and Social Care Trust and the Belfast Health and Social Care Trust to design, conduct and recruit patients to the study. Informed consent to participate was obtained from all RA patients enrolled in the study (Table 1).
Table. 1. Demographics of patients treated with conventional disease-modifying anti-rheumatic drugs DN = DMARD naïve (normal), DR = DMARD responder, DNR = DMARD non-responder. DN (n=6) DR (n=24) DNR (n=32) Female, n (%) 5 (83.3) 22 (91. 7) 27 (81.8) Age, mean (SD), years 42.5 (16.7) 59.7(12.2) 57.7(10.1) Treatment duration since diagnosis, mean (SD), years N/A 5.0 (3.8) 10.8 (12.1) Erythrocyte Sedimentation Rate (ESR), mean (SD), mm in Ihr 23.5 (15.2), n=6 12.2 (7.9), n=24 24.1 (20.0), n=29 C-reactive Protein (CRP), mean (SD), mg/L 6.1 (2.9), n=6 5.3 (7.3), n=22 10.6 (9.4), n=28 Disease Activity Score in 28 joints (DAS28-ESR), mean (SD) 4.3 (0.4), n=4 2.6 (1.0), n=24 4.9 (1.1), n=19 - Diagnosis for all patients fulfilled the 2010 American College of Rheumatology (ACR) criteria (American College of Rheumatology and European League Against Rheumatism 2010). Patients were treated with one or more conventional disease-modifying anti-rheumatic drugs (cDMARD), including methotrexate, sulfasalazine, leflunomide and hydroxychloroquine.
- Patients were classified as 'responders' or 'non-responders' according to the National Institute for Health and Clinical Excellence (NICE) guidelines, where responders have exhibited a change in DAS28-ESR of >1.2 following treatment (NICE 2009). Responders and non-responders had undergone treatment for an average of 5 and 11 years respectively.
- Disease activity classifications were according to the European League Against Rheumatism (EULAR) criteria, where a DAS28-ESR score of ≥5.1 was classified as 'high' disease activity (n=9), >3.2 and ≤5.1 was 'moderate' (n=21), >2.6 and ≤3.2 was 'low' (n=2), and <2.6 was classified as 'remission' (n=11).
- Office for Research Ethics Committees Northern Ireland (ORECNI) (11/NI/0188) and Ulster University Research Ethics Committee (UREC) (REC/14/0053) approvals were obtained for the study.
- Peripheral whole blood used for plasma extraction was collected in an EDTA coated tube (Aquilant Scientific) using a venepuncture technique. Blood tubes were stored at 4 °C for a maximum of 2 hours until processing. The blood tube was centrifuged in an Eppendorf 5804 centrifuge at 300 rcf for 10 minutes at 18 °C. The majority of the upper plasma layer was removed and stored at -80 °C for later analysis.
- Plasma from each patient sample was thawed and a small volume of ~40 µl was sent to OLINK (Analysis service Uppsala, Sweden). Each sample was analysed across OLINK's CVD II, CVD III, immune response and inflammatory panels. Each high throughput multiplex immunoassay consisted of 92 proteins.
- The technology used is known as 'Proximity Extension Assay' (PEA), where matched antibody pairs containing unique DNA sequences were incubated with the sample. Sequences that were exactly matched hybridized and were extended using DNA polymerase. The elongated DNA was then amplified and a qPCR readout using Fluidigm® BioMARKTM was used to determine the results of each protein target. The assay included internal controls at each stage of the reaction, negative controls to determine background values, and inter-plate controls to account for variability between plates.
- ΔCt values were log normalised to what is called 'normalised protein expression' values or NPX. Perseus software (version 1.6.0.7) was used to analyse the vast range of NPX values across patient groups. A Z-score was performed across the entire data set in order to standardise the NPX values.
- In order to filter data based on significance of differentially expressed proteins across all patient groups, an analysis of variance (ANOVA) test was carried out with permutation-based false discovery rate (FDR). These proteins were expressed in a heat map with unsupervised clustering.
- NPX values from all four OLINK panels across each patient group were analysed using Perseus software.
Table. 2. Statistically significant differences in detected levels of plasma proteins were calculated between each patient group using an ANOVA test with permutation based FDR, where FDR = 0.05 (with the number of randomizations set at 250). Protein Difference (Non-responder -Responder) - log ANOVA p value (all patient groups) ANOVA p value FDR q value CASP-3 1.654 12.924 <0.0001 <0.001 SELP 1.571 11.523 <0.0001 <0.001 JAM-A 1.589 11.496 <0.0001 <0.001 PDGF subunit A 1.591 10.616 <0.0001 <0.001 ITGB1BP2 1.391 8.522 <0.0001 <0.001 Dkk-1 1.358 8.010 <0.0001 <0.001 PECAM-1 1.363 7.441 <0.0001 <0.001 ANG-1 1.326 7.229 <0.0001 <0.001 DECR1 1.267 6.782 <0.0001 <0.001 SOD2 1.269 6.529 <0.0001 <0.001 DAPP1 1.353 6.492 <0.0001 <0.001 DCTN1 1.288 6.278 <0.0001 <0.001 PAI 1.300 6.022 <0.0001 <0.001 CD40-L 1.220 5.899 <0.0001 <0.001 HB-EGF 1.169 5.446 <0.0001 0.001 HCLS1 1.273 5.285 <0.0001 0.002 IRAK4 1.173 5.008 <0.0001 0.002 STK4 1.214 4.892 <0.0001 0.002 SH2B3 1.196 4.743 <0.0001 0.002 NEMO 1.034 4.686 <0.0001 0.002 CD84 1.065 4.605 <0.0001 0.002 EIF4G1 1.175 4.584 <0.0001 0.002 PRDX1 -0.945 4.435 <0.0001 0.002 TANK 1.073 4.254 0.0001 0.004 CXCL1 1.036 4.251 0.0001 0.004 SIRT2 1.122 4.168 0.0001 0.005 ZBTB16 1.028 3.645 0.0002 0.010 NF2 1.112 3.639 0.0002 0.009 PDGF subunit B 1.042 3.536 0.0003 0.010 SPRY2 1.098 3.498 0.0003 0.011 HEXIM1 1.063 3.444 0.0004 0.011 PPP1R9B 1.048 3.424 0.0004 0.012 PRDX3 1.081 3.382 0.0004 0.013 PAR-1 0.866 3.241 0.0006 0.016 ICA1 0.985 3.217 0.0006 0.017 CCL17 0.837 3.183 0.0007 0.017 STAMPB 0.951 3.023 0.0009 0.021 MGMT 0.943 2.835 0.0015 0.026 SRPK2 0.972 2.757 0.0017 0.028 BLM hydrolase 0.945 2.678 0.0021 0.033 PLXNA4 0.951 2.630 0.0023 0.035 SORT1 0.790 2.612 0.0024 0.035 -
Figure 1 illustrates a heat map showing only the proteins that were significantly different between groups, having an FDR q value of <0.05. Of the 42 proteins calculated as significantly different between patient groups, the majority were upregulated in cDMARD non-responders, compared to responders and cDMARD naive (normal) patients. The unsupervised clustering of the heat map shows a split between a) cDMARD non-responders b) cDMARD naive (normal) and c) cDMARD responders, where just one cDMARD non-responder is clustered among the responders. Furthermore, one cDMARD non-responder shows a reduced protein expression for the majority of the 42 proteins graphed, compared to all other patient samples. The reason for this outlier is unclear from available clinical data. - DAS28-ESR scores from clinical data recorded on the same day as sampling were classified according to EULAR criteria (NICE 2009). A DAS28-ESR score of ≥5.1 was classified as 'high' disease activity, >3.2 and ≤5.1 was 'moderate', >2.6 and ≤3.2 was 'low', and <2.6 was classified as 'remission'.
Table. 3. Each group was analysed by ANOVA with permutation based FDR. Protein Difference (High disease activity - Remission) - log ANOVA p value (all patient groups) ANOVA p value FDR q value ITGB1BP2 2.015 5.514 <0.0001 0.200 CD84 2.005 5.375 <0.0001 0.110 Dkk-1 1.990 5.355 <0.0001 0.073 SOD2 2.039 5.200 <0.0001 0.057 SORT1 1.961 5.158 <0.0001 0.046 DECR1 1.959 4.988 <0.0001 0.051 CASP-3 1.813 4.985 <0.0001 0.044 CD40-L 1.882 4.724 <0.0001 0.044 PDGF subunit A 1.737 4.616 <0.0001 0.043 SELP 1.611 4.570 <0.0001 0.040 -
Figure 2 illustrates a heat map with unsupervised clustering showing only the proteins that were significantly different between groups. Of the four protein panels analysed, only ten were statistically significantly different in normalised levels between patient groups. - Each of the ten proteins were also significantly different between patient groups when classified by response. Statistical data of the ten proteins is summarised in Table 4 (see also
Figure 3 andFigure 4 ). Proteins were ranked from left to right with the best performing protein on the left, based on AUC score. The benchmark false discovery AUC for this analysis was 0.6251.Table. 4. Statistical analysis of top ten proteins that show significant difference across RA patients when grouped by response or DA S28-ESR. Individual Protein Performance DECR1 CD40-L ITGB1B P2 CASP-3 PDGF subunit A Dkk-1 SELP SOD2 SORT 1 CD84 p-value <0.0001 <0.0001 <0.0001 <0.0001 <0.0001 <0.0001 <0.0001 <0.0001 0.0062 0.0001 AUC 1.0000 1.0000 0.9758 0.9550 0.9481 0.9412 0.9412 0.9308 0.9308 0.9204 Sensitivity 1.0000 1.0000 0.9412 1.0000 1.0000 1.0000 1.0000 0.9412 0.9412 0.8824 Specificity 1.0000 1.0000 0.9412 0.9412 0.9412 0.9412 0.9412 0.8824 0.8824 0.8824 Threshold 7.1320 7.4976 6.2200 10.4740 5.5889 10.4467 10.5279 9.9025 8.5585 6.0718 Correlation with DAS28-ESR (p-value) 0.0004 0.0002 < 0.0001 < 0.0001 < 0.0001 < 0.0001 < 0.0001 < 0.0001 < 0.0001 < 0.0001 Correlation with DAS28-ESR (r-value) 0.6010 0.6273 0.6577 0.7118 0.6971 0.6853 0.6700 0.6515 0.6566 0.6748 - Proteins are ranked from left to right, with the best performing protein on the left, based on AUC score. ROC curve analysis of each protein when a cut-off (y-intercept) value is applied to distinguish RA cDMARD responders and non-responders (
Figure 3 ). Also shown is correlation data of each NPX value with DAS28-ESR score (Figure 4 ). We considered the effect of using combinations of proteins for classification. Proteins acting in combination all achieved an AUC score of 1. In order to establish whether this was due to overfitting, we generated nonsense data by randomly swapping patients between the responder and non-responder groups sufficiently to obtain decorrelated nonsense data. We then optimised classifiers to the nonsense data using the same protein combinations and calculated the corresponding AUC score. This was repeated twenty times and the mean AUC was calculated. The results can be seen in Table 5 where the classification AUC scores obtained using true data significantly outperforms the overfitting rate which is equal to the mean classification AUCs obtained using the nonsense data.Table. 5. Statistical analysis of the collective protein performance of the top ten proteins that show significant difference across RA patients when grouped by response or DAS28-ESR. Collective Protein Performance DECR1 CD40- L ITGB1BP 2 CASP-3 PDGF subunit A Dkk-1 SELP SOD2 SORT1 CD84 AUC 1 1 1 1 1 1 1 1 1 1 Sensitivity 1 1 1 1 1 1 1 1 1 1 Specificity 1 1 1 1 1 1 1 1 1 1 Benchmark AUC 0.625 Benchmark SE 0.013 Benchmark Sensitivity 0.541 0.5411 0.5411 0.541 0.541 0.541 0.54 0.541 0.541 0.541 Benchmark Specificity 0.617 0.6176 0.6176 0.617 0.6176 0.6176 0.617 0.6176 0.6176 0.617 Threshold -28.84 -3.120 -2.540 -1.31 -1.2572 -1.275 -1.28 -1.2760 -0.680 -0.605 205.70 -4.427 -2.3013 -0.55 -0.439 -0.472 -0.46 -0.4470 -0.315 -0.325 0 55.773 -2.0427 0.1429 0.3053 0.2642 0.283 0.3107 0.0233 -0.0574 0 0 49.256 -0.913 -0.560 -0.494 -0.332 -0.3449 -0.3096 -0.3124 0 0 0 22.535 -0.518 -0.495 -0.378 -0.3728 -0.3396 -0.3677 0 0 0 0 19.477 -0.125 -0.024 -0.0450 -0.0575 -0.0381 0 0 0 0 0 20.538 -0.292 -0.301 -0.309 -0.322 0 0 0 0 0 0 20.122 0.0805 0.0724 0.1029 0 0 0 0 0 0 0 19.349 0.6848 0.5951 0 0 0 0 0 0 0 0 9.8592 0.2706 0 0 0 0 0 0 0 0 0 8.8411 - Each column presents the results for the classifier obtained for the protein labelled in the column in combination with any proteins to the left of the column. As we move to the right of the table, incrementally more proteins are included in the classifier. AUC, sensitivity and specificity are shown for the protein combinations applied to true data. Also shown are the overfitting rate (mean benchmark AUC) and the standard error in the benchmark AUC, obtained from twenty iterations of calculating nonsense data, the mean sensitivity and specificity of the classifiers obtained for nonsense data and the thresholds identified which grow in dimension with increasing numbers of proteins.
- One of the key aims of this work was to discover circulating protein biomarkers that may aid in differentiating clinical response to cDMARD treatment in RA. Of the 4 protein panels tested from OLINK (total number = 384), 42 proteins were significantly differentially expressed between cDMARD naive (normal), cDMARD responder and cDMARD non-responder RA patients. When classifying patients based on disease activity as determined by EULAR criteria, 10 proteins were shown to be differentially expressed between patient groups. Interestingly, these 10 proteins were also included in the 42 proteins previously shown to be differentially expressed when patients were classified by response. This suggests that these 10 proteins have the potential of distinguishing both disease activity and response to cDMARD treatment.
- When a threshold is applied, each of the individual 10 proteins demonstrates good sensitivity (>88%) and specificity (>88%) in distinguishing responders from non-responders.
- Overall, considering the results of the individual protein analysis and the combined protein analysis, DECR1 and CD40-L are the most optimal individual proteins in distinguishing response. No incremental benefit was observed when combining these proteins with each other or the others on the list (Table 5).
Claims (15)
- An in vitro method of predicting response to treatment with a disease-modifying anti-rheumatic drug (DMARD), and/or classifying disease activity in a subject with rheumatoid arthritis, the method comprising the steps of:(a) determining the quantitative level of two or more biomarkers in a biological sample from the subject; and(b) predicting response to treatment with a DMARD, and/or classifying disease activity based on the quantitative level of the biomarkers in the biological sample;wherein the biomarkers are selected from DECR1 and CD40-L.
- The method according to Claim 1, wherein the biomarkers for predicting response to treatment with a DMARD, and/or classifying disease activity is a gene having a GenBank Accession Version Number selected from of AK300069.1 and L07414.1.
- The method according to Claim 1, wherein the or each biomarkers for predicting response to treatment with a DMARD, and/or classifying disease activity is a protein having a UniProt ID selected from of Q16698 and P29965.
- The method according to Claim 1, wherein the biomarkers further comprise one or more of ITGB1BP2, CASP-3, PDFG subunit A, Dkk-1, SELP, SOD2, SORT1 and CD84.
- The method according to Claim 2, wherein the biomarker for predicting response to treatment with a DMARD, and/or classifying disease activity is a gene having a GenBank Accession Version Number further comprise one or more of BC108901.2, AJ413269.1 , AH002928.2, AH009834.2, AL022146.1 , X07834.1 , AL390252.9 and AF054816.1.
- The method according to Claim 3, wherein the biomarker for predicting response to treatment with a DMARD, and/or classifying disease activity is a protein having a UniProt ID further comprise one or more of Q9UKP3, P42574, P04085, 094907, P16109, P04179, Q99523 and Q9UIB8.
- The method according to Claim 4, wherein the method is a method for predicting response to treatment with a DMARD, and biomarkers further comprise JAM-A, PECAM-1, ANG-1, DAPP1, DCTN1 and PAI.
- The method according to Claim 7, wherein the biomarker for predicting response to treatment with a DMARD further comprise HB-EGF, HCLS1, IRAK4, STK4, SH2B3, NEMO, EIF4G1, PRDX1, TANK, CXCL1, SIRT2, ZBTB16, NF2, PDGF subunit B, SPRY2, HEXIM1, PPP1R9B, PRDX3, PAR-1, ICA1, CCL17, STAMPB, MGMT, SRPK2, BML hydrolase and PLXNA4.
- The method according to Claim 8, wherein the biomarker for predicting response to treatment with a DMARD is a gene having a GenBank Accession Version Number further comprise one or more of AK300069.1, AJ413269.1, AL022146.1, AL136649.1, AH002928.2, BC108901.2, BC107046.2, JQ287500.1, AY124380.1, X07834.1, AF178987.1 AK314352.1, X04731.1, AK222896.1, AC004634.1, AK312750.1, AY340965.1, Z93016.2, BC136451.1, AJ271718.1, AF054816.1, AK131407.1, CR407652.1, AC009299.5, BT006880.1, KF032391.1, BC029812.1, Y18000.1, M12783.1, AL354668.13, BC006460.1, KF495721.1, BT020007.1, BC002464.2, U37183.1, CH471092.1, CH471053.2, M60761.1, AC004884.1, AK312896.1, AC009365.9 and AL390252.9.
- The method according to Claim 8, wherein the biomarker for predicting response to treatment with a DMARD is a protein having a UniProt ID further comprise one or more of Q16698, P42574, P16109, Q9Y624, P04085, Q9UKP3, Q9UBT3, P16284, Q15389, P04179, Q9UN19, Q14203, P05121, P25942, Q99075, P14317, Q9NWZ3, Q13043, Q9UQQ2, Q9Y6K9, Q9UIB8, Q04637, Q06830, Q92844, P09341, Q8IXJ6, Q05516, P35240, P01127, O43597, O94992, Q96SB3, P30048, P25116, Q05084, Q92583, O95630, P16455, P78362, Q13867, Q9HCM2 and Q99523.
- The method according to Claim 8, wherein the determining step (a) further comprises determining the quantitative level in a first set of respective biomarkers(s), wherein the quantitative level of the first set of biomarkers is greater than the quantitative level of the same respective biomarkers(s) in a normal sample, which is indicative of a non-responder, the first set of biomarkers is selected from any one or more of DECR1, CASP-3, SELP, JAM-A, PDFG subunit A, ITGB1BP2, Dkk-1, PECAM-1, ANG-1, SOD2, DAPP1, DCTN1, PAI, CD40-L, HB-EGF, HCLS1, IRAK4, STK4, SH2B3, NEMO, CD84, EIF4G1, PRDX1, TANK, CXCL1, SIRT2, ZBTB16, NF2, PDGF subunit B, SPRY2, HEXIM1, PPP1R9B, PRDX3, PAR-1, ICA1, CCL17, STAMPB, MGMT, SRPK2, BML hydrolase, PLXNA4 and SORT1; or wherein the determining step (a) further comprises determining the quantitative level in a second set of respective biomarkers(s), wherein the quantitative level of the second set of biomarkers is less than the quantitative level of the same respective biomarkers(s) in a normal sample, which is indicative of a non-responder, the second set of biomarkers is selected from any one or more of DECR1, CD40-L, ITGB1BP2, CASP-3, PDGF subunit A, Dkk-1, SELP, SOD2, SORT1 and CD84.
- The method according Claim 11, wherein the quantitative level of the or each biomarker is higher than a threshold value and is indicative of a non-responder, wherein the respective threshold value of the or each biomarker is:
Biomarker Threshold value DECR1 7.1320 CASP-3 10.4740 SELP 10.5279 PDGF subunit A 5.5889 ITGB1BP2 6.2200 Dkk-1 10.4467 SOD2 9.9025 CD40-L 7.4976 CD84 6.0718 SORT1 8.5585 - The method according to Claim 11, wherein the quantitative level of the or each biomarker is lower than a threshold value and is indicative of a non-responder, wherein the respective threshold value of the or each biomarker is:
Biomarker Threshold value DECR1 7.1320 CASP-3 10.4740 SELP 10.5279 PDGF subunit A 5.5889 ITGB1BP2 6.2200 Dkk-1 10.4467 SOD2 9.9025 CD40-L 7.4976 CD84 6.0718 SORT1 8.5585 - The method according to any one of Claims 1-6, wherein the quantitative level of the or each biomarker is between two threshold values and is indicative of high disease activity, wherein the respective threshold values of the or each biomarker are:
Biomarker Threshold value DECR1 7.8984 - 11.6893 CD40-L 8.4728 - 12.7503 ITGB1BP2 6.7802 - 11.4759 CASP-3 11.4114 - 13.6768 PDFG subunit A 5.7334 - 8.4577 Dkk-1 11.2034 - 12.7568 SELP 11.3715 - 12.6136 SOD2 10.0471 - 10.5467 SORT1 8.7990 - 9.7006 CD84 6.1830 - 7.8683 Biomarker Threshold values DECR1 5.6510 - 10.5039 CD40-L 6.1622- 10.1159 ITGB1BP2 3.1210 - 8.5301 CASP-3 8.0945 - 12.2662 PDFG subunit A 3.9517 - 7.0510 Dkk-1 9.1861 - 12.0037 SELP 9.2287 - 11.9099 SOD2 9.5039 - 10.2607 SORT1 7.5225 - 9.2595 CD84 4.9694 - 6.8399 Biomarker Threshold values DECR1 6.6490 - 6.7309 CD40-L 6.5871 - 6.9401 ITGB1BP2 4.1040 - 4.5746 CASP-3 8.3368 - 8.7173 PDFG subunit A 3.8283 - 4.0907 Dkk-1 9.6015 - 9.8410 SELP 8.2174 - 9.3414 SOD2 9.6542 - 9.9702 SORT1 7.7980 - 8.5272 CD84 5.2689 - 5.5881 Biomarker Threshold value DECR1 5.6064 - 6.9173 CD40-L 6.2510 - 7.3891 ITGB1BP2 3.4508 - 5.5040 CASP-3 7.9543 - 9.2353 PDFG subunit A 2.7648 - 4.9645 Dkk-1 9.2598 - 9.9684 SELP 8.8272 - 9.9551 SOD2 9.5195 - 9.7582 SORT1 7.6829 - 8.4218 CD84 4.6188 - 5.8750 - The method according to any one of Claims 1-14, wherein the biological sample is selected from whole blood, serum, plasma, urine, interstitial fluid, peritoneal fluid, cervical swab, tears, saliva, buccal swab, skin, brain tissue, and cerebrospinal fluid.
Applications Claiming Priority (2)
| Application Number | Priority Date | Filing Date | Title |
|---|---|---|---|
| GBGB2009689.7A GB202009689D0 (en) | 2020-06-25 | 2020-06-25 | A method of predicting response to treatment with a disease-modifying anti-rheumatic drug and/or classifying disease activity in a subject with rheumatoid art |
| PCT/EP2021/067497 WO2021260180A1 (en) | 2020-06-25 | 2021-06-25 | A method of predicting response to treatment with a disease-modifying anti-rheumatic drug, and/or classifying disease activity in a subject with rheumatoid arthritis |
Publications (2)
| Publication Number | Publication Date |
|---|---|
| EP4172367A1 EP4172367A1 (en) | 2023-05-03 |
| EP4172367B1 true EP4172367B1 (en) | 2025-01-15 |
Family
ID=71949804
Family Applications (1)
| Application Number | Title | Priority Date | Filing Date |
|---|---|---|---|
| EP21737038.6A Active EP4172367B1 (en) | 2020-06-25 | 2021-06-25 | A method of predicting response to treatment with a disease-modifying anti-rheumatic drug, and/or classifying disease activity in a subject with rheumatoid arthritis |
Country Status (4)
| Country | Link |
|---|---|
| US (1) | US20230257815A1 (en) |
| EP (1) | EP4172367B1 (en) |
| GB (1) | GB202009689D0 (en) |
| WO (1) | WO2021260180A1 (en) |
Families Citing this family (2)
| Publication number | Priority date | Publication date | Assignee | Title |
|---|---|---|---|---|
| WO2025228323A1 (en) * | 2024-04-29 | 2025-11-06 | 洪明奇 | Method for evaluating therapeutic response of rheumatoid arthritis patient to janus kinase inhibitor by using gene variation as biomarker |
| CN118777612B (en) * | 2024-06-12 | 2025-03-28 | 北京大学人民医院 | Application of markers in the preparation of products for predicting the efficacy of rheumatoid arthritis drugs |
Family Cites Families (2)
| Publication number | Priority date | Publication date | Assignee | Title |
|---|---|---|---|---|
| AU2006294477A1 (en) * | 2005-09-27 | 2007-04-05 | Source Mdx | Gene expression profiling for identification monitoring and treatment of rheumatoid arthritis |
| EP3728638B1 (en) * | 2018-01-24 | 2024-11-13 | Genentech, Inc. | Diagnostic and therapeutic methods for the treatment of rheumatoid arthritis (ra) |
-
2020
- 2020-06-25 GB GBGB2009689.7A patent/GB202009689D0/en not_active Ceased
-
2021
- 2021-06-25 EP EP21737038.6A patent/EP4172367B1/en active Active
- 2021-06-25 WO PCT/EP2021/067497 patent/WO2021260180A1/en not_active Ceased
- 2021-06-25 US US18/012,505 patent/US20230257815A1/en active Pending
Also Published As
| Publication number | Publication date |
|---|---|
| GB202009689D0 (en) | 2020-08-12 |
| EP4172367A1 (en) | 2023-05-03 |
| US20230257815A1 (en) | 2023-08-17 |
| WO2021260180A1 (en) | 2021-12-30 |
Similar Documents
| Publication | Publication Date | Title |
|---|---|---|
| EP2362942B1 (en) | Biomarkers | |
| EP3350345B1 (en) | Biomarkers for heart failure | |
| US10626471B2 (en) | Gene signatures of inflammatory disorders that relate to the liver | |
| CN111876478B (en) | Diagnostic marker for pulmonary nodules and application | |
| EP2909340B1 (en) | Diagnostic method for predicting response to tnf alpha inhibitor | |
| WO2011106322A2 (en) | Biomarkers for acute ischemic stroke | |
| WO2011085163A2 (en) | Protein markers for lung cancer detection and methods of using thereof | |
| EP3133399B1 (en) | Chronic kidney disease biomarker | |
| US20130210667A1 (en) | Biomarkers for Predicting Kidney and Glomerular Pathologies | |
| US20240103008A1 (en) | Treatment and detection methods for inflammatory bowel disease | |
| US20230257815A1 (en) | A method of predicting response to treatment with a disease-modifying anti-rheumatic drug, and/or classifying disease activity in a subject with rheumatoid arthritis | |
| US20210018507A1 (en) | Sall.ivary protein biomarkers for the diagnosis and prognosis of head and neck cancers, and precancers | |
| JP7392224B2 (en) | miRNA diagnostic biomarker for drug-induced interstitial pneumonia with diffuse alveolar injury | |
| JP6357420B2 (en) | In vitro diagnosis or prognosis prediction method for colorectal cancer | |
| CN115803450A (en) | Method for detecting severity of atopic dermatitis | |
| US20070141627A1 (en) | Systemic Lupus Erythematosus | |
| CN112063709A (en) | Diagnostic kit for myasthenia gravis by taking microorganisms as diagnostic marker and application | |
| CN112011604B (en) | Microbial marker for evaluating myasthenia gravis risk and application thereof | |
| US20240125766A1 (en) | Method for determining suitability of a subject to anti tnf alpha therapy | |
| CN112226501B (en) | Intestinal flora marker for myasthenia gravis and application thereof | |
| WO2026034483A1 (en) | Method for testing severity of rheumatoid arthritis | |
| KR20240173248A (en) | Predicting or diagnosing composition for the occurrence or timing of allergic rhinitis, Diagnosing kit, Method for providing information and Screening method for drugs for preventing or treating allergic rhinitis using the same | |
| JP2024161911A (en) | Method for detecting the severity of atopic dermatitis | |
| Planell-Picola et al. | Usefulness of Transcriptional Blood Biomarkers as a Non-invasive Surrogate Marker of Mucosal Healing and Endoscopic Response in Ulcerative Colitis | |
| Neupane et al. | Evaluating the Diagnostic Potential of Myxovirus Resistance Protein 1 (MX1) and Myxovirus Resistance Protein 2 (MX2) As Biomarkers in Idiopathic Inflammatory Myopathies |
Legal Events
| Date | Code | Title | Description |
|---|---|---|---|
| STAA | Information on the status of an ep patent application or granted ep patent |
Free format text: STATUS: UNKNOWN |
|
| STAA | Information on the status of an ep patent application or granted ep patent |
Free format text: STATUS: THE INTERNATIONAL PUBLICATION HAS BEEN MADE |
|
| PUAI | Public reference made under article 153(3) epc to a published international application that has entered the european phase |
Free format text: ORIGINAL CODE: 0009012 |
|
| STAA | Information on the status of an ep patent application or granted ep patent |
Free format text: STATUS: REQUEST FOR EXAMINATION WAS MADE |
|
| 17P | Request for examination filed |
Effective date: 20230103 |
|
| AK | Designated contracting states |
Kind code of ref document: A1 Designated state(s): AL AT BE BG CH CY CZ DE DK EE ES FI FR GB GR HR HU IE IS IT LI LT LU LV MC MK MT NL NO PL PT RO RS SE SI SK SM TR |
|
| DAV | Request for validation of the european patent (deleted) | ||
| DAX | Request for extension of the european patent (deleted) | ||
| GRAP | Despatch of communication of intention to grant a patent |
Free format text: ORIGINAL CODE: EPIDOSNIGR1 |
|
| STAA | Information on the status of an ep patent application or granted ep patent |
Free format text: STATUS: GRANT OF PATENT IS INTENDED |
|
| GRAJ | Information related to disapproval of communication of intention to grant by the applicant or resumption of examination proceedings by the epo deleted |
Free format text: ORIGINAL CODE: EPIDOSDIGR1 |
|
| STAA | Information on the status of an ep patent application or granted ep patent |
Free format text: STATUS: REQUEST FOR EXAMINATION WAS MADE |
|
| INTG | Intention to grant announced |
Effective date: 20240627 |
|
| GRAP | Despatch of communication of intention to grant a patent |
Free format text: ORIGINAL CODE: EPIDOSNIGR1 |
|
| STAA | Information on the status of an ep patent application or granted ep patent |
Free format text: STATUS: GRANT OF PATENT IS INTENDED |
|
| INTC | Intention to grant announced (deleted) | ||
| INTG | Intention to grant announced |
Effective date: 20240814 |
|
| GRAS | Grant fee paid |
Free format text: ORIGINAL CODE: EPIDOSNIGR3 |
|
| GRAA | (expected) grant |
Free format text: ORIGINAL CODE: 0009210 |
|
| STAA | Information on the status of an ep patent application or granted ep patent |
Free format text: STATUS: THE PATENT HAS BEEN GRANTED |
|
| AK | Designated contracting states |
Kind code of ref document: B1 Designated state(s): AL AT BE BG CH CY CZ DE DK EE ES FI FR GB GR HR HU IE IS IT LI LT LU LV MC MK MT NL NO PL PT RO RS SE SI SK SM TR |
|
| REG | Reference to a national code |
Ref country code: CH Ref legal event code: EP Ref country code: GB Ref legal event code: FG4D |
|
| REG | Reference to a national code |
Ref country code: DE Ref legal event code: R096 Ref document number: 602021024991 Country of ref document: DE |
|
| REG | Reference to a national code |
Ref country code: IE Ref legal event code: FG4D |
|
| REG | Reference to a national code |
Ref country code: NL Ref legal event code: MP Effective date: 20250115 |
|
| PG25 | Lapsed in a contracting state [announced via postgrant information from national office to epo] |
Ref country code: NL Free format text: LAPSE BECAUSE OF FAILURE TO SUBMIT A TRANSLATION OF THE DESCRIPTION OR TO PAY THE FEE WITHIN THE PRESCRIBED TIME-LIMIT Effective date: 20250115 |
|
| PG25 | Lapsed in a contracting state [announced via postgrant information from national office to epo] |
Ref country code: RS Free format text: LAPSE BECAUSE OF FAILURE TO SUBMIT A TRANSLATION OF THE DESCRIPTION OR TO PAY THE FEE WITHIN THE PRESCRIBED TIME-LIMIT Effective date: 20250415 |
|
| PG25 | Lapsed in a contracting state [announced via postgrant information from national office to epo] |
Ref country code: FI Free format text: LAPSE BECAUSE OF FAILURE TO SUBMIT A TRANSLATION OF THE DESCRIPTION OR TO PAY THE FEE WITHIN THE PRESCRIBED TIME-LIMIT Effective date: 20250115 |
|
| PG25 | Lapsed in a contracting state [announced via postgrant information from national office to epo] |
Ref country code: PL Free format text: LAPSE BECAUSE OF FAILURE TO SUBMIT A TRANSLATION OF THE DESCRIPTION OR TO PAY THE FEE WITHIN THE PRESCRIBED TIME-LIMIT Effective date: 20250115 |
|
| PGFP | Annual fee paid to national office [announced via postgrant information from national office to epo] |
Ref country code: DE Payment date: 20250618 Year of fee payment: 5 |
|
| PG25 | Lapsed in a contracting state [announced via postgrant information from national office to epo] |
Ref country code: ES Free format text: LAPSE BECAUSE OF FAILURE TO SUBMIT A TRANSLATION OF THE DESCRIPTION OR TO PAY THE FEE WITHIN THE PRESCRIBED TIME-LIMIT Effective date: 20250115 |
|
| PGFP | Annual fee paid to national office [announced via postgrant information from national office to epo] |
Ref country code: GB Payment date: 20250612 Year of fee payment: 5 |
|
| REG | Reference to a national code |
Ref country code: LT Ref legal event code: MG9D |
|
| PG25 | Lapsed in a contracting state [announced via postgrant information from national office to epo] |
Ref country code: IS Free format text: LAPSE BECAUSE OF FAILURE TO SUBMIT A TRANSLATION OF THE DESCRIPTION OR TO PAY THE FEE WITHIN THE PRESCRIBED TIME-LIMIT Effective date: 20250515 Ref country code: NO Free format text: LAPSE BECAUSE OF FAILURE TO SUBMIT A TRANSLATION OF THE DESCRIPTION OR TO PAY THE FEE WITHIN THE PRESCRIBED TIME-LIMIT Effective date: 20250415 |
|
| REG | Reference to a national code |
Ref country code: AT Ref legal event code: MK05 Ref document number: 1759903 Country of ref document: AT Kind code of ref document: T Effective date: 20250115 |
|
| PG25 | Lapsed in a contracting state [announced via postgrant information from national office to epo] |
Ref country code: HR Free format text: LAPSE BECAUSE OF FAILURE TO SUBMIT A TRANSLATION OF THE DESCRIPTION OR TO PAY THE FEE WITHIN THE PRESCRIBED TIME-LIMIT Effective date: 20250115 |
|
| PG25 | Lapsed in a contracting state [announced via postgrant information from national office to epo] |
Ref country code: PT Free format text: LAPSE BECAUSE OF FAILURE TO SUBMIT A TRANSLATION OF THE DESCRIPTION OR TO PAY THE FEE WITHIN THE PRESCRIBED TIME-LIMIT Effective date: 20250515 Ref country code: LV Free format text: LAPSE BECAUSE OF FAILURE TO SUBMIT A TRANSLATION OF THE DESCRIPTION OR TO PAY THE FEE WITHIN THE PRESCRIBED TIME-LIMIT Effective date: 20250115 |
|
| PGFP | Annual fee paid to national office [announced via postgrant information from national office to epo] |
Ref country code: FR Payment date: 20250627 Year of fee payment: 5 |
|
| PG25 | Lapsed in a contracting state [announced via postgrant information from national office to epo] |
Ref country code: BG Free format text: LAPSE BECAUSE OF FAILURE TO SUBMIT A TRANSLATION OF THE DESCRIPTION OR TO PAY THE FEE WITHIN THE PRESCRIBED TIME-LIMIT Effective date: 20250115 Ref country code: GR Free format text: LAPSE BECAUSE OF FAILURE TO SUBMIT A TRANSLATION OF THE DESCRIPTION OR TO PAY THE FEE WITHIN THE PRESCRIBED TIME-LIMIT Effective date: 20250416 |
|
| PG25 | Lapsed in a contracting state [announced via postgrant information from national office to epo] |
Ref country code: AT Free format text: LAPSE BECAUSE OF FAILURE TO SUBMIT A TRANSLATION OF THE DESCRIPTION OR TO PAY THE FEE WITHIN THE PRESCRIBED TIME-LIMIT Effective date: 20250115 |
|
| PGFP | Annual fee paid to national office [announced via postgrant information from national office to epo] |
Ref country code: IE Payment date: 20250619 Year of fee payment: 5 |
|
| PG25 | Lapsed in a contracting state [announced via postgrant information from national office to epo] |
Ref country code: SE Free format text: LAPSE BECAUSE OF FAILURE TO SUBMIT A TRANSLATION OF THE DESCRIPTION OR TO PAY THE FEE WITHIN THE PRESCRIBED TIME-LIMIT Effective date: 20250115 |
|
| PG25 | Lapsed in a contracting state [announced via postgrant information from national office to epo] |
Ref country code: SM Free format text: LAPSE BECAUSE OF FAILURE TO SUBMIT A TRANSLATION OF THE DESCRIPTION OR TO PAY THE FEE WITHIN THE PRESCRIBED TIME-LIMIT Effective date: 20250115 |
|
| PG25 | Lapsed in a contracting state [announced via postgrant information from national office to epo] |
Ref country code: DK Free format text: LAPSE BECAUSE OF FAILURE TO SUBMIT A TRANSLATION OF THE DESCRIPTION OR TO PAY THE FEE WITHIN THE PRESCRIBED TIME-LIMIT Effective date: 20250115 |
|
| PG25 | Lapsed in a contracting state [announced via postgrant information from national office to epo] |
Ref country code: IT Free format text: LAPSE BECAUSE OF FAILURE TO SUBMIT A TRANSLATION OF THE DESCRIPTION OR TO PAY THE FEE WITHIN THE PRESCRIBED TIME-LIMIT Effective date: 20250115 |
|
| REG | Reference to a national code |
Ref country code: DE Ref legal event code: R097 Ref document number: 602021024991 Country of ref document: DE |
|
| PG25 | Lapsed in a contracting state [announced via postgrant information from national office to epo] |
Ref country code: EE Free format text: LAPSE BECAUSE OF FAILURE TO SUBMIT A TRANSLATION OF THE DESCRIPTION OR TO PAY THE FEE WITHIN THE PRESCRIBED TIME-LIMIT Effective date: 20250115 Ref country code: CZ Free format text: LAPSE BECAUSE OF FAILURE TO SUBMIT A TRANSLATION OF THE DESCRIPTION OR TO PAY THE FEE WITHIN THE PRESCRIBED TIME-LIMIT Effective date: 20250115 |
|
| PG25 | Lapsed in a contracting state [announced via postgrant information from national office to epo] |
Ref country code: RO Free format text: LAPSE BECAUSE OF FAILURE TO SUBMIT A TRANSLATION OF THE DESCRIPTION OR TO PAY THE FEE WITHIN THE PRESCRIBED TIME-LIMIT Effective date: 20250115 |
|
| PG25 | Lapsed in a contracting state [announced via postgrant information from national office to epo] |
Ref country code: SK Free format text: LAPSE BECAUSE OF FAILURE TO SUBMIT A TRANSLATION OF THE DESCRIPTION OR TO PAY THE FEE WITHIN THE PRESCRIBED TIME-LIMIT Effective date: 20250115 |
|
| PLBE | No opposition filed within time limit |
Free format text: ORIGINAL CODE: 0009261 |
|
| STAA | Information on the status of an ep patent application or granted ep patent |
Free format text: STATUS: NO OPPOSITION FILED WITHIN TIME LIMIT |
|
| REG | Reference to a national code |
Ref country code: CH Ref legal event code: L10 Free format text: ST27 STATUS EVENT CODE: U-0-0-L10-L00 (AS PROVIDED BY THE NATIONAL OFFICE) Effective date: 20251126 |
|
| 26N | No opposition filed |
Effective date: 20251016 |
|
| REG | Reference to a national code |
Ref country code: CH Ref legal event code: H13 Free format text: ST27 STATUS EVENT CODE: U-0-0-H10-H13 (AS PROVIDED BY THE NATIONAL OFFICE) Effective date: 20260127 |
|
| PG25 | Lapsed in a contracting state [announced via postgrant information from national office to epo] |
Ref country code: MC Free format text: LAPSE BECAUSE OF FAILURE TO SUBMIT A TRANSLATION OF THE DESCRIPTION OR TO PAY THE FEE WITHIN THE PRESCRIBED TIME-LIMIT Effective date: 20250115 |
|
| PG25 | Lapsed in a contracting state [announced via postgrant information from national office to epo] |
Ref country code: LU Free format text: LAPSE BECAUSE OF NON-PAYMENT OF DUE FEES Effective date: 20250625 |
|
| REG | Reference to a national code |
Ref country code: BE Ref legal event code: MM Effective date: 20250630 |
|
| PG25 | Lapsed in a contracting state [announced via postgrant information from national office to epo] |
Ref country code: BE Free format text: LAPSE BECAUSE OF NON-PAYMENT OF DUE FEES Effective date: 20250630 |
|
| PG25 | Lapsed in a contracting state [announced via postgrant information from national office to epo] |
Ref country code: CH Free format text: LAPSE BECAUSE OF NON-PAYMENT OF DUE FEES Effective date: 20250630 |