EP4148582A1 - Virtual function performance analysis system and analysis method thereof - Google Patents
Virtual function performance analysis system and analysis method thereof Download PDFInfo
- Publication number
- EP4148582A1 EP4148582A1 EP21212546.2A EP21212546A EP4148582A1 EP 4148582 A1 EP4148582 A1 EP 4148582A1 EP 21212546 A EP21212546 A EP 21212546A EP 4148582 A1 EP4148582 A1 EP 4148582A1
- Authority
- EP
- European Patent Office
- Prior art keywords
- virtual
- performance
- resources
- function
- physical
- Prior art date
- Legal status (The legal status is an assumption and is not a legal conclusion. Google has not performed a legal analysis and makes no representation as to the accuracy of the status listed.)
- Withdrawn
Links
Images




Classifications
-
- H—ELECTRICITY
- H04—ELECTRIC COMMUNICATION TECHNIQUE
- H04L—TRANSMISSION OF DIGITAL INFORMATION, e.g. TELEGRAPHIC COMMUNICATION
- H04L43/00—Arrangements for monitoring or testing data switching networks
- H04L43/08—Monitoring or testing based on specific metrics, e.g. QoS, energy consumption or environmental parameters
- H04L43/091—Measuring contribution of individual network components to actual service level
-
- G—PHYSICS
- G06—COMPUTING OR CALCULATING; COUNTING
- G06F—ELECTRIC DIGITAL DATA PROCESSING
- G06F11/00—Error detection; Error correction; Monitoring
- G06F11/30—Monitoring
- G06F11/34—Recording or statistical evaluation of computer activity, e.g. of down time, of input/output operation ; Recording or statistical evaluation of user activity, e.g. usability assessment
- G06F11/3409—Recording or statistical evaluation of computer activity, e.g. of down time, of input/output operation ; Recording or statistical evaluation of user activity, e.g. usability assessment for performance assessment
- G06F11/3433—Recording or statistical evaluation of computer activity, e.g. of down time, of input/output operation ; Recording or statistical evaluation of user activity, e.g. usability assessment for performance assessment for load management
-
- G—PHYSICS
- G06—COMPUTING OR CALCULATING; COUNTING
- G06F—ELECTRIC DIGITAL DATA PROCESSING
- G06F11/00—Error detection; Error correction; Monitoring
- G06F11/30—Monitoring
- G06F11/3003—Monitoring arrangements specially adapted to the computing system or computing system component being monitored
- G06F11/301—Monitoring arrangements specially adapted to the computing system or computing system component being monitored where the computing system is a virtual computing platform, e.g. logically partitioned systems
-
- G—PHYSICS
- G06—COMPUTING OR CALCULATING; COUNTING
- G06F—ELECTRIC DIGITAL DATA PROCESSING
- G06F11/00—Error detection; Error correction; Monitoring
- G06F11/30—Monitoring
- G06F11/34—Recording or statistical evaluation of computer activity, e.g. of down time, of input/output operation ; Recording or statistical evaluation of user activity, e.g. usability assessment
- G06F11/3409—Recording or statistical evaluation of computer activity, e.g. of down time, of input/output operation ; Recording or statistical evaluation of user activity, e.g. usability assessment for performance assessment
- G06F11/3428—Benchmarking
-
- G—PHYSICS
- G06—COMPUTING OR CALCULATING; COUNTING
- G06F—ELECTRIC DIGITAL DATA PROCESSING
- G06F11/00—Error detection; Error correction; Monitoring
- G06F11/30—Monitoring
- G06F11/34—Recording or statistical evaluation of computer activity, e.g. of down time, of input/output operation ; Recording or statistical evaluation of user activity, e.g. usability assessment
- G06F11/3466—Performance evaluation by tracing or monitoring
-
- G—PHYSICS
- G06—COMPUTING OR CALCULATING; COUNTING
- G06F—ELECTRIC DIGITAL DATA PROCESSING
- G06F9/00—Arrangements for program control, e.g. control units
- G06F9/06—Arrangements for program control, e.g. control units using stored programs, i.e. using an internal store of processing equipment to receive or retain programs
- G06F9/46—Multiprogramming arrangements
- G06F9/50—Allocation of resources, e.g. of the central processing unit [CPU]
- G06F9/5005—Allocation of resources, e.g. of the central processing unit [CPU] to service a request
- G06F9/5027—Allocation of resources, e.g. of the central processing unit [CPU] to service a request the resource being a machine, e.g. CPUs, Servers, Terminals
- G06F9/505—Allocation of resources, e.g. of the central processing unit [CPU] to service a request the resource being a machine, e.g. CPUs, Servers, Terminals considering the load
-
- H—ELECTRICITY
- H04—ELECTRIC COMMUNICATION TECHNIQUE
- H04L—TRANSMISSION OF DIGITAL INFORMATION, e.g. TELEGRAPHIC COMMUNICATION
- H04L41/00—Arrangements for maintenance, administration or management of data switching networks, e.g. of packet switching networks
- H04L41/50—Network service management, e.g. ensuring proper service fulfilment according to agreements
- H04L41/5032—Generating service level reports
-
- H—ELECTRICITY
- H04—ELECTRIC COMMUNICATION TECHNIQUE
- H04L—TRANSMISSION OF DIGITAL INFORMATION, e.g. TELEGRAPHIC COMMUNICATION
- H04L43/00—Arrangements for monitoring or testing data switching networks
- H04L43/08—Monitoring or testing based on specific metrics, e.g. QoS, energy consumption or environmental parameters
- H04L43/0805—Monitoring or testing based on specific metrics, e.g. QoS, energy consumption or environmental parameters by checking availability
- H04L43/0817—Monitoring or testing based on specific metrics, e.g. QoS, energy consumption or environmental parameters by checking availability by checking functioning
-
- H—ELECTRICITY
- H04—ELECTRIC COMMUNICATION TECHNIQUE
- H04L—TRANSMISSION OF DIGITAL INFORMATION, e.g. TELEGRAPHIC COMMUNICATION
- H04L43/00—Arrangements for monitoring or testing data switching networks
- H04L43/08—Monitoring or testing based on specific metrics, e.g. QoS, energy consumption or environmental parameters
- H04L43/0876—Network utilisation, e.g. volume of load or congestion level
-
- G—PHYSICS
- G06—COMPUTING OR CALCULATING; COUNTING
- G06F—ELECTRIC DIGITAL DATA PROCESSING
- G06F2201/00—Indexing scheme relating to error detection, to error correction, and to monitoring
- G06F2201/815—Virtual
Definitions
- the present disclosure relates in general to a virtual function performance analysis system and an analysis method thereof, and relates to an analysis system for execution performance of virtual function in a virtual platform infrastructure and an analysis method thereof.
- each physical computing resource or each storage resource may be virtually operated on a virtual platform infrastructure.
- a terminal application of a user i.e., a virtual network function application
- the execution of the virtual network function application and the access of the virtual resources in an environment of virtual platform are far more complicated than that in a physical environment.
- the virtual network function application may be a free of charge open-source software or a package provided by a third party. If the virtual network function application has abnormalities, overall system performance on the virtual platform will deteriorate. However, it is very difficult for the user to identify which functional component (e.g., virtual function) of the virtual network function application has abnormalities.
- a virtual function performance analysis system includes a monitoring unit, a performance analysis unit and a resource adjusting unit.
- the monitoring unit is configured to monitor performance of at least one virtual function of a virtual network function application on a virtual platform, wherein the virtual platform has at least one physical resource and at least one virtual resource, each physical resource, each virtual resource and each virtual function is evaluated with at least one performance indicator respectively; each of the performance indicators is associated with an expected value and/or a threshold value for each target virtual resource or virtual function; the monitoring unit monitors and records an actual value of each of the performance indicators on the virtual platform.
- the performance analysis unit is configured to compare the actual value of each of the performance indicators with the associated expected value and/or threshold value to obtain a comparison result of each of the performance indicators and to analyze system performance according to the comparison result.
- a virtual function performance analysis method includes: monitoring performance of at least one virtual function of a virtual network function application on a virtual platform, wherein the virtual platform has at least one physical resource and at least one virtual resource, each physical resource, each virtual resource and each virtual function is evaluated with at least one performance indicator respectively; each of the performance indicators is associated with an expected value and/or a threshold value respectively. Monitoring and recording an actual value of each performance indicator on the virtual platform. Comparing the actual value of each performance indicator with the associated expected value and/or threshold value to obtain a comparison result of each of the performance indicators and analyzing system performance according to the comparison result.
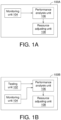
- FIG. 1A is a block diagram of an embodiment of virtual function performance analysis system 100A of the present disclosure.
- the virtual function performance analysis system 100A includes a monitoring unit 104, a performance analysis unit 106, and a resource adjusting unit 108.
- the virtual function performance analysis system 100A analyzes and monitors performance of the virtual network function (VNF) application and each virtual function executed in a network function virtualization infrastructure (NFVI).
- VNF virtual network function
- NFVI network function virtualization infrastructure
- the monitoring unit 104 may monitor performance of at least one virtual function of the virtual network function application. More specifically, the virtual network function application and each virtual function respectively are evaluated with one or more than one performance indicator; each performance indicator may reflect performance of the virtual network function application and each virtual function executed on the virtual platform. For a target virtual function, each performance indicator is associated with an expected value, which may be system default or user defined. Besides, long-term status of each virtual function operated on the virtual platform may be observed and analyzed through machine learning to create an expected value associated with each performance indicator. Moreover, an usage status of each physical resource and/or each virtual resource used by the virtual network function application on the virtual platform may also serve as a performance indicator of the virtual function performance analysis system 100A.
- the monitoring unit 104 monitors the execution of each virtual function and accordingly records actual performance of each virtual function on the virtual platform to obtain an actual value of each performance indicator with which each virtual function is evaluated. Moreover, the monitoring unit 104 also monitors the status of each virtual resource and/or each physical resource used by each virtual network function application on the virtual platform and accordingly records the actual value of each performance indicator with which each virtual resource and/or each physical resource is evaluated.
- the performance analysis unit 106 analyzes and compares the actual value of each performance indicator of each virtual resource and/or each physical resource and each virtual function with associated expected values, analyzes and compares the status of each virtual resource and/or each physical resource used by each virtual network function application to obtain a comparison result, and analyzes system performance according to the comparison result, so as to determine whether the virtual network function application and each virtual function have abnormalities which deteriorate overall system performance on the virtual platform.
- the performance analysis unit 106 further precisely locates particular virtual function, virtual resource or physical resource, which deteriorates performance, and identifies possible abnormalities leading to bottleneck of system performance.
- the resource adjusting unit 108 may perform system resource adjustment according to the execution status of the virtual network function application or each virtual function, for example, by expanding service of the virtual network function application to reduce the workload of the virtual function that causes performance bottleneck. Or, the resource adjusting unit 108 may adjust the allocation of physical resources and/or virtual resources on the virtual platform, for example, by expanding the allocation of physical resources and/or virtual resources to assure that sufficient physical resources and/or virtual resources may be allocated to the virtual network function application which has the virtual function as a bottleneck.
- FIG. 1B is a block diagram of another embodiment of virtual function performance analysis system 100B of the present disclosure.
- the virtual function performance analysis system 100B of the present embodiment further includes a testing unit 102.
- the testing unit 102 may test each virtual function of the virtual network function application on the testing platform to evaluate the expected performance of each virtual function (that is, if the physical resources and/or virtual resources are sufficient, the normal performance of each virtual function will meet the expectation) and create the expected value associated with each performance indicator of each virtual function according to the expected performance.
- the expected value associated with each performance indicator in the virtual function performance analysis system 100A which may be system default or user defined
- the expected value associated with each performance indicator in the virtual function performance analysis system 100B is created by the testing unit 102 on the testing platforming or through machine learning beforehand.
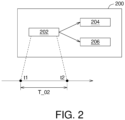
- FIG. 2 is a schematic diagram of an embodiment of performance indicator of virtual function of the present disclosure.
- the virtual network function application 200 is the main target monitored and analyzed by the virtual function performance analysis system 100A (or 100B).
- the virtual network function application 200 may be referred as a "target virtual network function application”.
- the virtual network function application 200 may be a process or a virtual machine executed on a virtual platform.
- the virtual network function application 200 may include several virtual functions.
- the virtual network function application 200 at least includes a virtual function 202, a virtual function 204, and a virtual function 206. Each of each virtual function 202, 204, and 206 may be evaluated with one or more than one performance indicator.
- the performance indicators may reflect performance of each of the virtual functions 202, 204 and 206 in various execution aspects on the virtual platform.
- the performance indicators of each of the virtual functions 202, 204 and 206 include but are not limited to the "execution time”, “execution frequency”, “error rate” and “queue length” of each of the virtual functions 202, 204 and 206.
- execution time the performance indicator "execution time" of each of the virtual functions 202, 204 and 206 be taken for example.
- the execution time directly reflects the performance of each of the virtual functions 202, 204 and 206. If the execution time is too long, this indicates that one of the following scenarios may occur: the execution of each of the virtual functions 202, 204 and 206 is blocked; the workload of each of the virtual functions 202, 204 and 206 is overloaded; the physical resources are competed on the virtual platform; or the physical resources and/or virtual resources allocated to the virtual network function application 200 (which has the virtual functions 202, 204 and 206) are insufficient.
- the execution time T_02 of the virtual function 202 is the time interval between the starting time point t1 and the end time point t2 of the execution of the virtual function 202.
- the starting time point t1 may be the time point when the virtual function 202 is called; the end time point t2 may be the time point when the virtual function 202 returns the result.
- the execution time T_02 of the virtual function 202 is the respective execution time of the virtual function 202 corresponding to each thread of multi-thread.
- FIG. 3A is a schematic diagram of an operation embodiment of the testing unit 102 of the present disclosure.
- the testing unit 102 may test the virtual functions 202, 204 and 206 of the virtual network function application 200 on the testing platform 300 beforehand.
- the testing platform 300 is a platform with a clean room, such as a laboratory.
- the clean room of the testing platform 300 is a simplified environment in which the environmental variables or external factors that may affect the execution of each of the virtual functions 202, 204 and 206 is minimized.
- performance of each of the virtual functions 202, 204 and 206 on the testing platform 300 basically may meet users' expectation.
- the value of each performance indicator of each of the virtual functions 202, 204 and 206 collected by the testing unit 102 may be used as an expected value associated with each performance indicator (or may be referred as "baseline").
- the collected values of the execution time T_02, T_04 and T_06 of each of the virtual functions 202, 204 and 206 on the testing platform 300 may be used as expected values of the execution time of each of the virtual functions 202, 204 and 206 respectively.
- the testing unit 102 may observe the execution time T_02 using eBPF.
- observation points may be created in the programming code of the virtual function 202 to record the time points (starting time point t1 and end time point t2) at which the virtual function 202 is called and returns the result respectively, such that the execution time T_02 may be calculated according to the log of the observation points created in the programming code.
- the testing unit 102 may collect the statistics of the execution time T_02, T_04 and T_06 of each of the virtual functions 202, 204 and 206 under different environmental scenarios to obtain the minimum value, mean value and maximum value of the execution time T_02, T_04, T06.
- the expected values of the execution time T_02, T_04 and T_06 of each of the virtual functions 202, 204 and 206 built by the testing unit 102 are as follows.
- the minimum is 50us, the mean is 100us, and the maximum is 200us.
- the minimum is 30us, the mean is 50us, and the maximum is 150us.
- the minimum is 100us, the mean is 130us, and the maximum is 250us.
- Table 1 Expected value or threshold value associated with performance indicators with which virtual functions are evaluated Expected value associated with performance indicator "execution time” Threshold value associated with performance indicator "queue length”
- Virtual function 202 Execution time T_02 Minimum 50us Queue 202a queue length: 200 Mean 100us Maximum 200us Virtual function 204 Execution time T_04 Minimum 30us Queue 204a queue length: 200 Mean 50us Maximum 150us Virtual function 206 Execution time T_06 Minimum 100us N/A Mean 130us Maximum 250us
- each of the virtual functions 202, 204 and 206 may have queue.
- the input end (input mechanism) of the virtual function 202 may have queue 202a; and the output end (output mechanism) of the virtual function 204 also may have queue 204a.
- the "queue length" of the queues 202a and 204a of each virtual function 202 and 204 is another important performance indicator.
- the virtual function performance analysis system 100A may set a threshold value for the queue length of the queue 202a and queue 204a respectively, wherein the threshold value may be system defaulted or user defined.
- the user virtual function developer
- the threshold value of the queue length of the queue 202a at the input end of the virtual function 202 may be set to 200.
- the virtual function 202 is executed, if the queue length of the queue 202a is over the threshold value, this indicates the virtual function 202 has abnormalities.
- the queue length of the queue 204a is too long, this indicates that the other virtual function 302 using the queue 204a as the input end possibly may have abnormalities.
- each of the virtual functions 202, 204 and 206 may be evaluated with other performance indicators, such as "execution frequency” and "error rate", wherein the "execution frequency” of each of the virtual functions 202, 204 and 206 is the number of times for which each of the virtual functions 202, 204 and 206 is executed within a unit time (i.e., number of executions being performed per unit time).
- the performance indicators "queue length”, “execution frequency” and “error rate” respectively are the queue length, execution frequency and error rate of each of the virtual functions 202, 204 and 206 corresponding to each thread of multi-thread.
- the expected value or threshold value associated with each performance indicator of each of the virtual functions 202, 204 and 206 may be estimated by the testing unit 102 on the testing platform 300 through test or evaluation, may be user defined, may be system default, or may be created. For example, the actual value of each performance indicator of each of the virtual functions 202, 204 and 206 may be recorded over a long period of operation time, and the expected value or threshold value associated with each performance indicator may be obtained by statistical analysis through machine learning.
- FIG. 4A is a schematic diagram of an embodiment of physical resources and virtual resources of a virtual platform 400 of the present disclosure. Refer to FIG. 4A .
- the virtual platform 400 is an actual field in which the virtual network function application 200 is executed.
- Physical resources on the virtual platform 400 at least include a physical central processing unit (CPU) 402, a physical memory 404, a physical network bandwidth 406, and a physical disc input/output (disk I/O) 408.
- the physical resources may be virtualized as corresponding virtual resources on a virtual layer 410.
- the physical CPU 402, the physical memory 404, the physical network bandwidth 406, and the physical disc input/output 408 respectively correspond to a virtual CPU 412, a virtual memory 414, a virtual network bandwidth 416, and a virtual disc input/output 418.
- the virtual platform 400 may allocate the virtual resources to the virtual network function application 200 and other virtual network function applications. Also referring to FIG. 4B , which illustrates a schematic diagram of an embodiment of allocation of virtual resources of a virtual platform 400 of the present disclosure.
- the virtual CPU 412 at least includes a virtual resource 412a, a virtual resource 412b and a virtual resource 412c, wherein the virtual resource 412a is allocated to the virtual network function application 200; the virtual resource 412b is allocated to the virtual network function application 230; and the virtual resource 412c is allocated to the virtual network function application 260.
- the performance indicator with which each physical resource and/or each virtual resource is evaluated may comprise the "usage status" of each physical resource and/or each virtual resource.
- the performance indicator type related to the "usage status" of each physical resource and/or each virtual resource may include "value of usage status", "error event” and "resource saturation” of each physical resource and/or each virtual resource. Let the type of performance indicator be "value of usage status”.
- Performance indicators with which the physical resources and virtual resources of virtual platform 400 are evaluated physical resources and virtual resources Type of performance indicators Details of performance indicators CPU value of usage status value of usage status of single CPU, average value of usage status of overall system Error event Correctable error correction code (ECC) event in cache, error event in CPU Resource saturation Queue length, waiting time of scheduler Memory value of usage status available memory Resource saturation Unknown page transfer, unknown thread exchange Network bandwidth value of usage status Transmitted/received data flow and maximum bandwidth Resource saturation Saturated network interface or operating system Disc input/output value of usage status Percentage of busy in device Resource saturation Queue length Error event error in device
- the virtual function performance analysis system 100A may create the expected value and/or threshold value associated with each performance indicator according to system default value or user defined value.
- the virtual network function application 200 may set the expected value of the "value of usage status" of the virtual resource 412a of the virtual CPU 412 to 22%; the virtual network function application 230 may set the expected value of the "value of usage status" of the virtual resource 412b of the virtual CPU 412 to 25%; the virtual network function application 260 may set the expected value of the "value of usage status" of the virtual resource 412c of the virtual CPU 412 to 15%.
- the virtual network function applications 200, 230 and 260 may set the expected value of the total value of usage status of the physical CPU 402 to 62%.
- Table 2-1 Expected value of "value of usage status" of the virtual resources and the physical resources of virtual platform 400 used by virtual network function applications 200, 230 and 260 Expected value associated with performance indicator "value of usage status" of virtual CPU 412 Expected value associated with performance indicator "value of usage status" (total usage) of physical CPU 402
- Virtual network function application 230 25% Virtual network function application 260 15%
- FIG. 5 is a schematic diagram of an operation embodiment of the monitoring unit 104 of the present disclosure.
- the monitoring unit 10 monitors and collects actual value of each performance indicator of each of the virtual functions 202, 204 and 206.
- the performance indicator "execution time" be taken for example.
- Actual values of the execution time T_02, execution time T_04 and execution time T_06 of the virtual functions 202, 204 and 206 are listed in Table 3.
- the minimum is 55us
- the mean is 103us
- the maximum is 205us.
- the minimum is 27us, the mean is 49us, and the maximum is 130us.
- the minimum is 110us, the mean is 135us, and the maximum is 270us.
- the performance indicator "queue length" be taken for example.
- the actual value of the queue length of the queue 202a of the virtual function 202 monitored by monitoring unit 104 is 250; the actual value of the queue length of queue 204a of the virtual function 204 is 250.
- Table 3 Actual values of performance indicators of virtual functions Actual value of performance indicator "execution time” Actual value of performance indicator "queue length” Virtual function 202 Execution time T_02 Minimum 55us Queue 202a queue length: 250 Mean 103us Maximum 205us Virtual function 204 Execution time T_04 Minimum 27us Queue 204a queue length: 250 Mean 49us Maximum 130us Virtual function 206 Execution time T_06 Minimum 110us N/A Mean 135us Maximum 270us
- the monitoring unit 104 also monitors and records actual value of usage status of each virtual resource and/or each physical resource used by the virtual network function application 200 (that is, target virtual network function application) and other virtual network function applications 230 and 260 on the virtual platform 400 to obtain actual value of each performance indicator of each physical resource and/or each virtual resource.
- performance indicator value of usage status
- Actual values of the values of usage status of the virtual CPU 412 and/or physical CPU 402 of the virtual network function applications 200, 230 and 260 recorded by the monitoring unit 104 are listed in Table 4.
- Table 4 Actual value of "value of usage status" of the virtual resources and the physical resources of virtual platform 400 used by virtual network function applications 200, 230 and 260 Actual value of performance indicator "value of usage status" of virtual CPU 412 Actual value of performance indicator "value of usage status" (total usage) of physical CPU 402 Virtual network function application 200 20% 60% Virtual network function application 230 22% Virtual network function application 260 18%
- actual value of usage status of the virtual CPU 412 (virtual resource 412a) set on or allocated to the virtual network function application 200 is 20%; actual value of usage status of the virtual CPU 412 (virtual resource 412b) set on or allocated to the virtual network function application 230 is 22%; actual value of usage status of the virtual CPU 412 (virtual resource 412c) set on or allocated to the virtual network function application 260 is 18%.
- actual total value of usage status of the physical CPU 402 of the virtual network function applications 200, 230 and 260 is 60%.
- the monitoring unit 104 may monitor and record actual value of each performance indicator (such as “execution time”, “queue length”, “execution frequency”, or “error rate”) of each of the virtual functions 202, 204 and 206 of the virtual network function application 200 (target virtual network function application). Moreover, the monitoring unit 104 also may monitor and record the usage status of each physical resource and/or each virtual resource used by the virtual network function application 200 and other virtual network function applications 230 and 260 on the virtual platform 400 to record actual value of each performance indicator (such as "value of usage status", “error event”, or “resource saturation") of each physical resource and/or each virtual resource.
- each performance indicator such as “execution time”, “queue length”, “execution frequency”, or “error rate”
- the performance analysis unit 106 may compare actual value of each performance indicator of each of the virtual functions 202, 204 and 206 of the virtual network function application 200 and actual value of each performance indicator of each physical resource and/or each virtual resource on the virtual platform 400 with associated expected value and/or threshold value to determine whether the virtual functions 202, 204 and 206 of the virtual network function application 200 have abnormalities or whether the usage status of each physical resource/each virtual resource is abnormal, so as to analyze performance bottleneck which causes abnormalities. Then, the resource adjusting unit 108 may adjust service of the virtual network function application 200 or the virtual functions 202, 204 and 206, adjust the virtual resources allocated to the virtual network function application 200 and/or other virtual network function applications 230 and 260, or expand the physical resources on the virtual platform 400. Detailed operations of the performance analysis unit 106 and the resource adjusting unit 108 are disclosed below with embodiments of the virtual function performance analysis method.
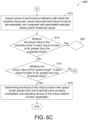
- FIGS. 6A-6C are flowcharts of an embodiment of virtual function performance analysis method 600 of the present disclosure.
- the method begins at step 601, according to system default value or user defined value, setting expected value and/or threshold value associated with each performance indicator of the virtual functions 202, 204 and 206 of the main target to be monitored and analyzed, that is, the virtual network function application 200 (i.e., target virtual network function application), and setting expected value and/or threshold value associated with each performance indicator of each physical resource (physical CPU 402, physical memory 404, physical network bandwidth 406, and physical disc input/output 408) and each virtual resource (virtual CPU 412, virtual memory 414, virtual network bandwidth 416, and virtual disc input/output 418) of a virtual platform 400.
- the virtual network function application 200 i.e., target virtual network function application
- setting expected value and/or threshold value associated with each performance indicator of each physical resource physical CPU 402, physical memory 404, physical network bandwidth 406, and physical disc input/output 408
- each virtual resource virtual CPU 412
- Examples of performance indicators of the virtual functions 202, 204 and 206 include: “execution time”, “queue length”, “execution frequency” and “error rate”. Examples of performance indicators of each physical resource and each virtual resource of the virtual platform 400 include “value of usage status", “error event”, and “resource saturation”.
- step 606 the virtual functions 202, 204 and 206 of the virtual network function application 200 are monitored in an actual environment on the virtual platform 400, wherein the virtual network function application 200 uses each virtual resource and each physical resource on the virtual platform 400.
- step 608 actual value of each performance indicator of each of the virtual functions 202, 204 and 206 is monitored and recorded by the monitoring unit 104 of the virtual function performance analysis system 100A (or 100B) on the virtual platform 400.
- step 610 actual condition of use (such as "value of usage status") of each physical resource and each virtual resource by the virtual network function application 200 and other virtual network function applications 230 and 260 are monitored and recorded by the monitoring unit 104 on the virtual platform 400 to build actual value of each performance indicator of each physical resource and each virtual resource.
- step 613 of FIG. 6C is performed.
- expected value associated with each performance indicator of each physical resource and/or each virtual resource, and expected value and/or threshold value associated with each performance indicator of each of the virtual functions 202, 204 and 206 is predetermined according to system default value or user defined value.
- the expected value associated with each performance indicator of each of the virtual functions 202, 204 and 206 may be created by the testing unit 102 on the testing platform 300 beforehand.
- step 602 and step 604 may perform prior to step 606.
- the virtual functions 202, 204 and 206 of the target virtual network function application 200 are executed in a clean room of the testing platform 300.
- step 604 based on the execution result obtained from the execution of each of the virtual functions 202, 204 and 206 on the testing platform 300, the value of each performance indicator of each of the virtual functions 202, 204 and 206 is collected by the testing unit 102, and the expected value associated with each performance indicator is created according to the collected values. Details of step 606 to step 610 of method 600B of FIG. 6B are completely identical to that of the method 600 of FIG. 6A , and the similarities are not repeated here.
- step 613 an actual value of each performance indicator (such as "value of usage status") of each physical resource and/or each virtual resource and each performance indicator (such as “execution time", “queue length”) of each of the virtual functions 202, 204 and 206 is compared with the associated expected value and/or threshold value by the performance analysis unit 106 of the virtual function performance analysis system 100A (or 100B) to obtain a comparison result, and determining whether the virtual functions 202, 204 and 206 have abnormalities according to the comparison result.
- each performance indicator such as "value of usage status”
- each performance indicator such as "execution time", “queue length”
- the comparison result between the actual value and the expected value and/or threshold value associated with performance indicator indicates that the actual value of the performance indicator "execution time" of each of the virtual functions 202, 204 and 206 basically meets the expected value, wherein the actual value is not far greater than the expected value.
- the actual value (includes the minimum, the mean and the maximum) of the execution time of each of the virtual functions 202, 204 and 206 basically meets the expected value of the execution time as listed in Table 1, this indicates that the actual value of the execution time of each of the virtual functions 202, 204 and 206 on a virtual platform 400 basically meets the expected value. Therefore, it is determined that the workload of each of the virtual functions 202, 204 and 206 is not overloaded.
- step 616 may be performed to analyze whether actual values of other performance indicators are over the expected value and/or threshold value.
- step 616 the actual value of another performance indicator "queue length" is compared with the threshold value by the performance analysis unit 106.
- the comparison result obtained in step 616 indicates that the actual value of "queue length” is far greater than the threshold value (as listed in Table 3, actual value of the queue length of the virtual function 202 is 250, which is far greater than the threshold value of the queue length listed in Table 1, that is, 200). Based on the comparison result, it may be confirmed that the virtual function 202 has abnormalities, and performance bottleneck on the virtual platform 400 may be defined as the virtual function 202 whose actual value of queue length is far greater than the threshold value.
- the method proceeds to step 618, the workload of the virtual function 202 whose queue length is greater than the threshold value is determined as being overloaded by the performance analysis unit 106, and the resource adjusting unit 108 may adopt the following solutions to resolve the abnormalities of the virtual function 202, for example, by adjusting service of the virtual network function application 200 or by adjusting the allocation of the physical resources and/or virtual resources on the virtual platform 400.
- the resource adjusting unit 108 adjusts service of the virtual network function application 200 by expanding other virtual network function applications similar to the virtual network function application 200 to share the workload of the virtual function 202 of the virtual network function application 200.
- FIG. 7 is a flowchart of another embodiment of virtual function performance analysis method 700 of the present disclosure.
- the present embodiment of virtual function performance analysis method 700 succeeds to step 601 to step 613 of the afore-mentioned embodiment of virtual function performance analysis method 600, therefore step 601 to step 613 are omitted in FIG. 7 .
- step 614 of the present embodiment 700 based on the comparison result between the actual value of each performance indicator and the expected value and/or threshold value which shows that the actual value of the performance indicator "execution time” is far greater than the expected value (referring to Table 5: the mean and maximum of the actual values of execution time T_04 of the virtual function 204, that is, 238us and 2530us respectively, are far greater than the mean and maximum of the expected values of the execution time T_04, that is, 50us and 150us, as listed in Table 1), the performance analysis unit 106 determines that the virtual function 204 has abnormalities, and the virtual function 204 is located as the bottleneck which deteriorates system performance.
- the virtual function 204 becomes bottleneck due to the usage status of the physical resources and/or virtual resources being near an upper limit of the allocation of corresponding resources or almost overload.
- the physical resources and/or virtual resources allocated to the virtual network function application 200 (which has the virtual function 204) are insufficient, making the usage status almost overloaded.
- other virtual functions 202 or 206 of the virtual network function application 200 compete with the virtual function 204 for virtual resources.
- other virtual network function applications 230 and 260 compete with the virtual network function application 200 (target virtual network function application) for physical resources.
- step 620 may be performed to further clarify the causes.
- Table 5 Actual value of performance indicator of virtual functions Actual value of performance indicator "execution time” Actual value of performance indicator "queue length” Virtual function 202 Execution time T_02 Minimum 55us Queue 202a queue length: Mean 103us Maximum 205us 250 Virtual function 204 Execution time T_04 Minimum 27us Queue 204a queue length: 250 Mean 238us Maximum 2530us Virtual function 206 Execution time T_06 Minimum 110us N/A Mean 135us Maximum 270us
- step 620 whether the usage status of each physical resource and/or each virtual resource is near an upper limit of the allocation of corresponding resources or almost overloaded is determined by the performance analysis unit 106 according to the recorded actual value of each performance indicator of each physical resource and/or each virtual resource.
- the analysis result is listed in Table 6.
- the actual value of usage status of the virtual CPU 412 used by the virtual network function application 200 (that is, target virtual network function application, which has the virtual function 204) is 54%, being far greater than the expected value as listed in Table 2-1, that is, 20%.
- Table 6 Actual value of "value of usage status" of the virtual resources and the physical resources of virtual platform 400 used by virtual network function applications 200, 230 and 260 Actual value of performance indicator "value of usage status" of virtual CPU 412 Actual value of performance indicator "value of usage status" (total usage) of physical CPU 402
- Virtual network function application 200 54% 89% Virtual network function application 230 20% Virtual network function application 260 15%
- the allocation of each virtual resource of the network function application 200 is adjusted by the resource adjusting unit 108.
- the allocation of the virtual CPU 412 may be adjusted, that is, more virtual resource 412a of the virtual CPU 412 is allocated to the virtual network function application 200.
- the resource adjusting unit 108 may expand the physical resources and/or virtual resources on the virtual platform 400.
- the resource adjusting unit 108 may adjust service of the virtual network function application 200, for example, by expanding to execute other virtual network function applications with the same functions of the virtual network function application 200 to share the workload of the virtual network function application 200.
- FIG. 8 is a flowchart of still another embodiment of virtual function performance analysis method 800 of the present disclosure.
- the present embodiment of virtual function performance analysis method 800 succeeds to step 601 to step 613 of the afore-mentioned embodiment of virtual function performance analysis method 600 and step 614 of the afore-mentioned embodiment of virtual function performance analysis method 700, therefore step 601 to step 614 are omitted in FIG. 8 .
- the performance analysis unit 106 determines that the usage status of the virtual resource of the virtual network function application 200 is not near the upper limit of the allocation of the virtual resource, and the virtual resource of the virtual network function application 200 is not almost overloaded.
- step 624 is performed to further analyze whether the total value of usage status of the physical resources used by the virtual network function applications 200, 230 and 260 on the virtual platform 400 is near the upper limit of the allocation of the physical resources or almost overloaded.
- Table 7 Actual value of the "value of usage status" of the virtual resources and the physical resources of virtual platform 400 used by virtual network function applications 200, 230 and 260 Actual value of performance indicator "value of usage status" of virtual CPU 412 Actual value of performance indicator "value of usage status" (total usage) of physical CPU 402
- Virtual network function application 200 25% 95% Virtual network function application 230 52%
- Virtual network function application 260 18%
- step 624 the analysis result recorded by the performance analysis unit 106 as listed in Table 7 shows that the actual value of total value of usage status (i.e., total actual value of usage status ) of the physical CPU 402, that is, 95%, is near an upper limit of the allocation of the physical CPU 402 and almost overloaded, therefore it is determined that the virtual network function applications 230 and 260 other than the virtual network function application 200 are competing for the physical CPU 402, and the value of usage status of the physical CPU 402 used by the other virtual network function applications 230 and 260 is too high and results in overloading.
- the value of usage status of the resource of the virtual CPU used by the virtual network function application 230 is 52% (52% is too high), this indicates the virtual network function application 230 is competing for the resource of the physical CPU 402.
- the allocation of each virtual resource of the virtual network function application 200 is adjusted by the resource adjusting unit 108.
- the allocation of the virtual CPU 412 may be adjusted, that is, more virtual resource 412a of the virtual CPU 412 is allocated to the virtual network function application 200, such that the virtual network function application 200 has sufficient virtual resource allocations.
- the resource adjusting unit 108 may expand the physical resources and/or virtual resources on the virtual platform 400.
- the resource adjusting unit 108 may adjust the physical CPU 402 whose usage status is near an upper limit of the allocation of the physical CPU 402 or almost overloaded, for example, by expanding the physical resources and/or virtual resources on the virtual platform 400, such that more physical CPU may be provided.
- FIG. 9 is a flowchart of yet another embodiment of virtual function performance analysis method 900 of the present disclosure.
- the present embodiment of virtual function performance analysis method 900 succeeds to step 601 to step 610 of the afore-mentioned embodiment of virtual function performance analysis method 600, step 614 of the afore-mentioned embodiment of virtual function performance analysis method 700 and step 620 of the afore-mentioned embodiment of virtual function performance analysis method 800, therefore step 601 to step 620 are omitted in FIG. 9 .
- step 624 of the present method 900 based on the analysis result of the performance analysis unit 106 which indicates that the usage status of each virtual resource used by the virtual network function application 200 is not near an upper limit of the allocation of the virtual resource, and the usage status of each virtual resource used by the virtual network function application 200 is not almost overloaded.
- the total value of usage status of each physical resource is not near an upper limit of the allocation of the physical resource, and the total usage status of each physical resource is not almost overloaded (as listed in Table 4, the actual value of usage status of the virtual CPU 412 used by the virtual network function application 200 is 20%, which is lower than the expected value of 22% as listed in Table 2-1, furthermore, the actual total value of usage status of the physical CPU 402 is 60%, which is lower than the expected value of 62% as listed in Table 2-1). Therefore, it is determined that, other virtual network function applications 230 and 260 may not compete with the virtual network function application 200 for physical resources, and the virtual functions 202, 204 and 206 of the virtual network function application 200 may not compete for virtual resources. Therefore, the performance analysis unit 106 determines that, the reason for which the execution time of the virtual function 204 is much greater than the expected value (and hence virtual function 204 becomes a performance bottleneck) is irrelevant to the allocation of the physical resources and/or virtual resource.
- the performance analysis unit 106 determines that performance bottleneck of the virtual function 204 is possibly caused by logic error of programming in the programming code of the virtual function 204 (such as error in the lock mechanism of the programming code of the virtual function 204) or caused by abnormalities in packet processing.
- a case for the abnormality in packet processing may be, for example, packet loss of the virtual function 204 will cause the re-transmission mechanism of the software protocol to re-transmit the packets, and the delay in service of the virtual function 204 will be too long.
- the virtual function performance analysis system 100A (or 100B) of the present disclosure monitors several performance indicators (such as “execution time”, “execution frequency”, “queue length and “error rate”) of each of the virtual functions 202, 204 and 206 of the virtual network function application 200 (that is, target virtual network function application) and analyzes several performance indicators (such as "value of usage status", "error event” and “resource saturation") of each physical resource and/or each virtual resource on the virtual platform 400. Moreover, actual value of each performance indicator of each physical resource and/or each virtual resource of each of the virtual functions 202, 204 and 206 of the virtual network function application 200 is monitored on the virtual platform 400 of an actual environment.
- performance indicators such as “execution time”, “execution frequency”, “queue length and “error rate”
- each performance indicator is far greater than the expected value and/or threshold value. If the actual value of each performance indicator is far greater than the associated expected value and/or threshold value, this indicates: the virtual function (such as virtual function 202) is overloaded; the physical resources and/or virtual resources allocated to the virtual network function application 200 (which has the virtual function that is overloaded ) are insufficient; other virtual network function applications 230 and 260 are competing with the virtual network function application 200 for physical resources; or the virtual functions 202, 204 and 206 of the virtual network function application 200 are completing for virtual resources.
- the virtual function such as virtual function 202
- the virtual function performance analysis system 100A (or 100B) automatically defines the "virtual function", or the "physical resource” or “virtual resource” whose usage status is near the upper limit of the allocation of corresponding resources or almost overloaded as a bottleneck which deteriorates performance of the virtual network function application 200.
- the virtual function performance analysis system 100A (or 100B) of the present disclosure connects and analyzes the data of each performance indicator in an automatic manner and therefore has the advantage in terms of timeliness and speed.
- maintenance personnel on the virtual platform do not analyze the performance indicator "execution time" of the virtual function, and therefore may not accurately analyze the causes of abnormalities.
- the virtual function performance analysis system 100A (or 100B) of the disclosure may accurately analyze the execution time of each virtual function.
- the virtual function performance analysis system 100A (or 100B) of the present disclosure may more accurately ascribe bottleneck to a particular function of the virtual network function application and accurately analyze which function deteriorates system performance on the virtual platform 400.
- the virtual function performance analysis system 100A (or 100B) of the present disclosure may automatically adjust the virtual network function application 200 and/or service of each of the virtual functions 202, 204 and 206 or automatically expand the physical resources and/or virtual resources or adjust the allocation on the virtual platform 400 to improve system performance on the virtual platform 400 in an automatic manner.
Landscapes
- Engineering & Computer Science (AREA)
- Theoretical Computer Science (AREA)
- General Engineering & Computer Science (AREA)
- Physics & Mathematics (AREA)
- General Physics & Mathematics (AREA)
- Signal Processing (AREA)
- Computer Networks & Wireless Communication (AREA)
- Quality & Reliability (AREA)
- Environmental & Geological Engineering (AREA)
- Computer Hardware Design (AREA)
- Software Systems (AREA)
- Computing Systems (AREA)
- Mathematical Physics (AREA)
- Debugging And Monitoring (AREA)
Abstract
Description
- The present disclosure relates in general to a virtual function performance analysis system and an analysis method thereof, and relates to an analysis system for execution performance of virtual function in a virtual platform infrastructure and an analysis method thereof.
- Along with the evolution of network communication infrastructure and software technology, each physical computing resource or each storage resource may be virtually operated on a virtual platform infrastructure. On the virtualized infrastructure, a terminal application of a user (i.e., a virtual network function application) may flexibly access the virtual computing resources or storage resources in the virtual platform infrastructure.
- However, the execution of the virtual network function application and the access of the virtual resources in an environment of virtual platform are far more complicated than that in a physical environment. Moreover, the virtual network function application may be a free of charge open-source software or a package provided by a third party. If the virtual network function application has abnormalities, overall system performance on the virtual platform will deteriorate. However, it is very difficult for the user to identify which functional component (e.g., virtual function) of the virtual network function application has abnormalities.
- Therefore, research and development personnel in relevant industries of the present technology field are engaged in analyzing performance of internal functional components (i.e., virtual functions as programmatic function calls) of the virtual network function application with an aim to more accurately analyze what factors deteriorate system performance on the virtual platform and to identify the bottleneck of system performance on the virtual platform.
- According to one embodiment of the present disclosure, a virtual function performance analysis system is disclosed. The virtual function performance analysis system, characterized in that, the system includes a monitoring unit, a performance analysis unit and a resource adjusting unit. The monitoring unit is configured to monitor performance of at least one virtual function of a virtual network function application on a virtual platform, wherein the virtual platform has at least one physical resource and at least one virtual resource, each physical resource, each virtual resource and each virtual function is evaluated with at least one performance indicator respectively; each of the performance indicators is associated with an expected value and/or a threshold value for each target virtual resource or virtual function; the monitoring unit monitors and records an actual value of each of the performance indicators on the virtual platform. The performance analysis unit is configured to compare the actual value of each of the performance indicators with the associated expected value and/or threshold value to obtain a comparison result of each of the performance indicators and to analyze system performance according to the comparison result.
- According to another embodiment of the present disclosure, a virtual function performance analysis method is disclosed. The virtual function performance analysis method, characterized in that, the method includes: monitoring performance of at least one virtual function of a virtual network function application on a virtual platform, wherein the virtual platform has at least one physical resource and at least one virtual resource, each physical resource, each virtual resource and each virtual function is evaluated with at least one performance indicator respectively; each of the performance indicators is associated with an expected value and/or a threshold value respectively. Monitoring and recording an actual value of each performance indicator on the virtual platform. Comparing the actual value of each performance indicator with the associated expected value and/or threshold value to obtain a comparison result of each of the performance indicators and analyzing system performance according to the comparison result.
- The above and other aspects of the invention will become better understood with regard to the following detailed description of the preferred but non-limiting embodiment (s). The following description is made with reference to the accompanying drawings.
-
-
FIG. 1A is a block diagram of an embodiment of virtual function performance analysis system of the present disclosure. -
FIG. 1B is a block diagram of another embodiment of virtual function performance analysis system of the present disclosure. -
FIG. 2 is a schematic diagram of an embodiment of performance indicator of virtual function of the present disclosure. -
FIG. 3A is a schematic diagram of an operation embodiment of the testing unit of the present disclosure. -
FIG. 3B is a schematic diagram of an embodiment of performance indicator of virtual function of the present disclosure. -
FIG. 4A is a schematic diagram of an embodiment of physical resources and virtual resources of a virtual platform of the present disclosure. -
FIG. 4B is a schematic diagram of an embodiment of allocation of virtual resources of a virtual platform of the present disclosure -
FIG. 5 is a schematic diagram of an operation embodiment of the monitoring unit of the present disclosure. -
FIGS. 6A-6C are flowcharts of an embodiment of virtual function performance analysis method of the present disclosure. -
FIG. 7 is a flowchart of another embodiment of virtual function performance analysis method of the present disclosure. -
FIG. 8 is a flowchart of still another embodiment of virtual function performance analysis method of the present disclosure. -
FIG. 9 is a flowchart of yet another embodiment of virtual function performance analysis method of the present disclosure. - Technical terms are used in the specification with reference to generally-known terminologies used in the technology field. For any terms described or defined in the specification, the descriptions and definitions in the specification shall prevail. Each embodiment of the present disclosure has one or more technical features. Given that each embodiment is implementable, a person ordinarily skilled in the art may selectively implement or combine some or all of the technical features of any embodiment of the present disclosure.
-
FIG. 1A is a block diagram of an embodiment of virtual functionperformance analysis system 100A of the present disclosure. Refer toFIG. 1A . The virtual functionperformance analysis system 100A includes amonitoring unit 104, aperformance analysis unit 106, and a resource adjusting unit 108. The virtual functionperformance analysis system 100A analyzes and monitors performance of the virtual network function (VNF) application and each virtual function executed in a network function virtualization infrastructure (NFVI). - On the virtual platform of an actual environment where the virtual network function application is executed, the
monitoring unit 104 may monitor performance of at least one virtual function of the virtual network function application. More specifically, the virtual network function application and each virtual function respectively are evaluated with one or more than one performance indicator; each performance indicator may reflect performance of the virtual network function application and each virtual function executed on the virtual platform. For a target virtual function, each performance indicator is associated with an expected value, which may be system default or user defined. Besides, long-term status of each virtual function operated on the virtual platform may be observed and analyzed through machine learning to create an expected value associated with each performance indicator. Moreover, an usage status of each physical resource and/or each virtual resource used by the virtual network function application on the virtual platform may also serve as a performance indicator of the virtual functionperformance analysis system 100A. - The
monitoring unit 104 monitors the execution of each virtual function and accordingly records actual performance of each virtual function on the virtual platform to obtain an actual value of each performance indicator with which each virtual function is evaluated. Moreover, themonitoring unit 104 also monitors the status of each virtual resource and/or each physical resource used by each virtual network function application on the virtual platform and accordingly records the actual value of each performance indicator with which each virtual resource and/or each physical resource is evaluated. - The
performance analysis unit 106 analyzes and compares the actual value of each performance indicator of each virtual resource and/or each physical resource and each virtual function with associated expected values, analyzes and compares the status of each virtual resource and/or each physical resource used by each virtual network function application to obtain a comparison result, and analyzes system performance according to the comparison result, so as to determine whether the virtual network function application and each virtual function have abnormalities which deteriorate overall system performance on the virtual platform. Theperformance analysis unit 106 further precisely locates particular virtual function, virtual resource or physical resource, which deteriorates performance, and identifies possible abnormalities leading to bottleneck of system performance. - Based on the identified abnormalities, the resource adjusting unit 108 may perform system resource adjustment according to the execution status of the virtual network function application or each virtual function, for example, by expanding service of the virtual network function application to reduce the workload of the virtual function that causes performance bottleneck. Or, the resource adjusting unit 108 may adjust the allocation of physical resources and/or virtual resources on the virtual platform, for example, by expanding the allocation of physical resources and/or virtual resources to assure that sufficient physical resources and/or virtual resources may be allocated to the virtual network function application which has the virtual function as a bottleneck.
-
FIG. 1B is a block diagram of another embodiment of virtual functionperformance analysis system 100B of the present disclosure. Refer toFIG. 1B . In comparison to the virtual functionperformance analysis system 100A ofFIG. 1A , the virtual functionperformance analysis system 100B of the present embodiment further includes atesting unit 102. Thetesting unit 102 may test each virtual function of the virtual network function application on the testing platform to evaluate the expected performance of each virtual function (that is, if the physical resources and/or virtual resources are sufficient, the normal performance of each virtual function will meet the expectation) and create the expected value associated with each performance indicator of each virtual function according to the expected performance. - In other words, unlike the expected value associated with each performance indicator in the virtual function
performance analysis system 100A which may be system default or user defined, the expected value associated with each performance indicator in the virtual functionperformance analysis system 100B is created by thetesting unit 102 on the testing platforming or through machine learning beforehand. - Descriptions of the virtual function
performance analysis system FIGS. 1A and 1B . Detailed descriptions of each unit of the virtual functionperformance analysis system FIGS. 2 ,3A ,3B ,4 and5 . -
FIG. 2 is a schematic diagram of an embodiment of performance indicator of virtual function of the present disclosure. Refer toFIG. 2 . The virtualnetwork function application 200 is the main target monitored and analyzed by the virtual functionperformance analysis system 100A (or 100B). The virtualnetwork function application 200 may be referred as a "target virtual network function application". The virtualnetwork function application 200 may be a process or a virtual machine executed on a virtual platform. The virtualnetwork function application 200 may include several virtual functions. For example, the virtualnetwork function application 200 at least includes avirtual function 202, avirtual function 204, and avirtual function 206. Each of eachvirtual function virtual functions virtual functions virtual functions - Firstly, let the performance indicator "execution time" of each of the
virtual functions virtual functions virtual functions virtual functions virtual functions - More specifically, taking the
virtual function 202 as an example, the execution time T_02 of thevirtual function 202 is the time interval between the starting time point t1 and the end time point t2 of the execution of thevirtual function 202. The starting time point t1 may be the time point when thevirtual function 202 is called; the end time point t2 may be the time point when thevirtual function 202 returns the result. In another implementation, if thevirtual function 202 may be executed in a multi-thread environment, then the execution time T_02 of thevirtual function 202 is the respective execution time of thevirtual function 202 corresponding to each thread of multi-thread. - As disclosed above, in the virtual function
performance analysis system 100B ofFIG. 1B , the expected value associated with each performance indicator of the virtual function may be created by thetesting unit 102 beforehand.FIG. 3A is a schematic diagram of an operation embodiment of thetesting unit 102 of the present disclosure. Refer toFIG. 3A . Thetesting unit 102 may test thevirtual functions network function application 200 on thetesting platform 300 beforehand. Thetesting platform 300 is a platform with a clean room, such as a laboratory. The clean room of thetesting platform 300 is a simplified environment in which the environmental variables or external factors that may affect the execution of each of thevirtual functions virtual functions testing platform 300 basically may meet users' expectation. On thetesting platform 300, the value of each performance indicator of each of thevirtual functions testing unit 102 may be used as an expected value associated with each performance indicator (or may be referred as "baseline"). For example, the collected values of the execution time T_02, T_04 and T_06 of each of thevirtual functions testing platform 300 may be used as expected values of the execution time of each of thevirtual functions - More specifically, let the execution time T_02 of the
virtual function 202 be taken for example. Thetesting unit 102 may observe the execution time T_02 using eBPF. Or, in another implementation, when the user programs the programming code of thevirtual function 202, observation points may be created in the programming code of thevirtual function 202 to record the time points (starting time point t1 and end time point t2) at which thevirtual function 202 is called and returns the result respectively, such that the execution time T_02 may be calculated according to the log of the observation points created in the programming code. - Under different environmental scenarios, the execution time T_02, T_04 and T_06 of each of the
virtual functions testing unit 102 may collect the statistics of the execution time T_02, T_04 and T_06 of each of thevirtual functions testing platform 300, the expected values of the execution time T_02, T_04 and T_06 of each of thevirtual functions testing unit 102 are as follows. For the expected value of the execution time T_02 of thevirtual function 202 , the minimum is 50us, the mean is 100us, and the maximum is 200us. For the expected value of the execution time T_04 of thevirtual function 204, the minimum is 30us, the mean is 50us, and the maximum is 150us. Moreover, For the expected value of the execution time T_06 of thevirtual function 206, the minimum is 100us, the mean is 130us, and the maximum is 250us.Table 1: Expected value or threshold value associated with performance indicators with which virtual functions are evaluated Expected value associated with performance indicator "execution time" Threshold value associated with performance indicator "queue length" Virtual function 202Execution time T_02 Minimum 50us Queue 202a queue length: 200 Mean 100us Maximum 200us Virtual function 204Execution time T_04 Minimum 30us Queue 204a queue length: 200 Mean 50us Maximum 150us Virtual function 206Execution time T_06 Minimum 100us N/A Mean 130us Maximum 250us - On the other hand, refer to
FIG. 3B . The programming logic of each of thevirtual functions virtual function 202 may havequeue 202a; and the output end (output mechanism) of thevirtual function 204 also may havequeue 204a. The "queue length" of thequeues virtual function - The virtual function
performance analysis system 100A (or 100B) may set a threshold value for the queue length of thequeue 202a andqueue 204a respectively, wherein the threshold value may be system defaulted or user defined. For example, the user (virtual function developer) may collect statistics and evaluate a reasonable queue length for thequeue 202a and thequeue 204 respectively according to the historical data of use, and set the reasonable queue length as a threshold value associated with the performance indicator "queue length". As listed in Table 1, the threshold value of the queue length of thequeue 202a at the input end of thevirtual function 202 may be set to 200. When thevirtual function 202 is executed, if the queue length of thequeue 202a is over the threshold value, this indicates thevirtual function 202 has abnormalities. On the other hand, for thequeue 204a at the output end of thevirtual function 204, if the queue length of thequeue 204a is too long, this indicates that the othervirtual function 302 using thequeue 204a as the input end possibly may have abnormalities. - Moreover, each of the
virtual functions virtual functions virtual functions virtual functions virtual functions - The expected value or threshold value associated with each performance indicator of each of the
virtual functions testing unit 102 on thetesting platform 300 through test or evaluation, may be user defined, may be system default, or may be created. For example, the actual value of each performance indicator of each of thevirtual functions - Except for the performance indicators "execution time", "queue length", "execution frequency" and "error rate", the "usage status" of physical resources and virtual resources of virtual platform used by the virtual network function application 200 (which has the
virtual functions network function application 200. Therefore, the "usage status" of the physical resources and/or virtual resources used by the virtualnetwork function application 200 is a performance indicator which the virtual functionperformance analysis system 100A (or 100B) would like to analyze.FIG. 4A is a schematic diagram of an embodiment of physical resources and virtual resources of avirtual platform 400 of the present disclosure. Refer toFIG. 4A . Thevirtual platform 400 is an actual field in which the virtualnetwork function application 200 is executed. Physical resources on thevirtual platform 400 at least include a physical central processing unit (CPU) 402, aphysical memory 404, aphysical network bandwidth 406, and a physical disc input/output (disk I/O) 408. - On the other hand, on a
virtual platform 400, the physical resources may be virtualized as corresponding virtual resources on avirtual layer 410. Thephysical CPU 402, thephysical memory 404, thephysical network bandwidth 406, and the physical disc input/output 408 respectively correspond to avirtual CPU 412, avirtual memory 414, avirtual network bandwidth 416, and a virtual disc input/output 418. Moreover, thevirtual platform 400 may allocate the virtual resources to the virtualnetwork function application 200 and other virtual network function applications. Also referring toFIG. 4B , which illustrates a schematic diagram of an embodiment of allocation of virtual resources of avirtual platform 400 of the present disclosure. Taking thevirtual CPU 412 of the virtual resource for example, thevirtual CPU 412 at least includes avirtual resource 412a, avirtual resource 412b and avirtual resource 412c, wherein thevirtual resource 412a is allocated to the virtualnetwork function application 200; thevirtual resource 412b is allocated to the virtualnetwork function application 230; and thevirtual resource 412c is allocated to the virtualnetwork function application 260. - Referring to Table 2, several performance indicators of the "usage status" of each physical resource and/or each virtual resource on the
virtual platform 400 are listed. In a broad sense, the performance indicator with which each physical resource and/or each virtual resource is evaluated may comprise the "usage status" of each physical resource and/or each virtual resource. More particularly, the performance indicator type related to the "usage status" of each physical resource and/or each virtual resource may include "value of usage status", "error event" and "resource saturation" of each physical resource and/or each virtual resource. Let the type of performance indicator be "value of usage status". Details of the performance indicator "value of usage status" of each physical resource and/or each virtual resource may include value of usage status of single CPU, memory and disc respectively and average value of usage status of the overall system, and transmitted/received data flow and bandwidth of a network interface.Table 2: Performance indicators with which the physical resources and virtual resources of virtual platform 400 are evaluatedphysical resources and virtual resources Type of performance indicators Details of performance indicators CPU value of usage status value of usage status of single CPU, average value of usage status of overall system Error event Correctable error correction code (ECC) event in cache, error event in CPU Resource saturation Queue length, waiting time of scheduler Memory value of usage status available memory Resource saturation Unknown page transfer, unknown thread exchange Network bandwidth value of usage status Transmitted/received data flow and maximum bandwidth Resource saturation Saturated network interface or operating system Disc input/output value of usage status Percentage of busy in device Resource saturation Queue length Error event error in device - Based on the performance indicators listed in Table 2, the virtual function
performance analysis system 100A (or 100B) may create the expected value and/or threshold value associated with each performance indicator according to system default value or user defined value. Refer to Table 2-1. The virtualnetwork function application 200 may set the expected value of the "value of usage status" of thevirtual resource 412a of thevirtual CPU 412 to 22%; the virtualnetwork function application 230 may set the expected value of the "value of usage status" of thevirtual resource 412b of thevirtual CPU 412 to 25%; the virtualnetwork function application 260 may set the expected value of the "value of usage status" of thevirtual resource 412c of thevirtual CPU 412 to 15%. Moreover, the virtualnetwork function applications physical CPU 402 to 62%.Table 2-1: Expected value of "value of usage status" of the virtual resources and the physical resources of virtual platform 400 used by virtualnetwork function applications Expected value associated with performance indicator "value of usage status" of virtual CPU 412Expected value associated with performance indicator "value of usage status" (total usage) of physical CPU 402Virtual network function application 20022% 62% Virtual network function application 23025% Virtual network function application 26015% -
FIG. 5 is a schematic diagram of an operation embodiment of themonitoring unit 104 of the present disclosure. Refer toFIG. 5 . When thevirtual functions network function application 200 are actually executed on avirtual platform 400, the monitoring unit 10 monitors and collects actual value of each performance indicator of each of thevirtual functions virtual functions virtual function 202, the minimum is 55us, the mean is 103us, and the maximum is 205us. For the actual value of the execution time T_04 of thevirtual function 204, the minimum is 27us, the mean is 49us, and the maximum is 130us. For the actual value of the execution time T_06 of thevirtual function 206, the minimum is 110us, the mean is 135us, and the maximum is 270us. On the other hand, let the performance indicator "queue length" be taken for example. The actual value of the queue length of thequeue 202a of thevirtual function 202 monitored by monitoringunit 104 is 250; the actual value of the queue length ofqueue 204a of thevirtual function 204 is 250.Table 3: Actual values of performance indicators of virtual functions Actual value of performance indicator "execution time" Actual value of performance indicator "queue length" Virtual function 202Execution time T_02 Minimum 55us Queue 202a queue length: 250 Mean 103us Maximum 205us Virtual function 204Execution time T_04 Minimum 27us Queue 204a queue length: 250 Mean 49us Maximum 130us Virtual function 206Execution time T_06 Minimum 110us N/A Mean 135us Maximum 270us - As disclosed above, the
monitoring unit 104 also monitors and records actual value of usage status of each virtual resource and/or each physical resource used by the virtual network function application 200 (that is, target virtual network function application) and other virtualnetwork function applications virtual platform 400 to obtain actual value of each performance indicator of each physical resource and/or each virtual resource. Let performance indicator "value of usage status" be taken for example. Actual values of the values of usage status of thevirtual CPU 412 and/orphysical CPU 402 of the virtualnetwork function applications monitoring unit 104 are listed in Table 4.Table 4: Actual value of "value of usage status" of the virtual resources and the physical resources of virtual platform 400 used by virtualnetwork function applications Actual value of performance indicator "value of usage status" of virtual CPU 412Actual value of performance indicator "value of usage status" (total usage) of physical CPU 402Virtual network function application 20020% 60% Virtual network function application 23022% Virtual network function application 26018% - As listed in Table 4, actual value of usage status of the virtual CPU 412 (
virtual resource 412a) set on or allocated to the virtualnetwork function application 200 is 20%; actual value of usage status of the virtual CPU 412 (virtual resource 412b) set on or allocated to the virtualnetwork function application 230 is 22%; actual value of usage status of the virtual CPU 412 (virtual resource 412c) set on or allocated to the virtualnetwork function application 260 is 18%. Besides, actual total value of usage status of thephysical CPU 402 of the virtualnetwork function applications - To summarize, the
monitoring unit 104 may monitor and record actual value of each performance indicator (such as "execution time", "queue length", "execution frequency", or "error rate") of each of thevirtual functions monitoring unit 104 also may monitor and record the usage status of each physical resource and/or each virtual resource used by the virtualnetwork function application 200 and other virtualnetwork function applications virtual platform 400 to record actual value of each performance indicator (such as "value of usage status", "error event", or "resource saturation") of each physical resource and/or each virtual resource. - Thus, the
performance analysis unit 106 may compare actual value of each performance indicator of each of thevirtual functions network function application 200 and actual value of each performance indicator of each physical resource and/or each virtual resource on thevirtual platform 400 with associated expected value and/or threshold value to determine whether thevirtual functions network function application 200 have abnormalities or whether the usage status of each physical resource/each virtual resource is abnormal, so as to analyze performance bottleneck which causes abnormalities. Then, the resource adjusting unit 108 may adjust service of the virtualnetwork function application 200 or thevirtual functions network function application 200 and/or other virtualnetwork function applications virtual platform 400. Detailed operations of theperformance analysis unit 106 and the resource adjusting unit 108 are disclosed below with embodiments of the virtual function performance analysis method. -
FIGS. 6A-6C are flowcharts of an embodiment of virtual functionperformance analysis method 600 of the present disclosure. Refer toFIG. 6A . Firstly, the method begins atstep 601, according to system default value or user defined value, setting expected value and/or threshold value associated with each performance indicator of thevirtual functions physical CPU 402,physical memory 404,physical network bandwidth 406, and physical disc input/output 408) and each virtual resource (virtual CPU 412,virtual memory 414,virtual network bandwidth 416, and virtual disc input/output 418) of avirtual platform 400. Examples of performance indicators of thevirtual functions virtual platform 400 include "value of usage status", "error event", and "resource saturation". - Then, the method proceeds to step 606, the
virtual functions network function application 200 are monitored in an actual environment on thevirtual platform 400, wherein the virtualnetwork function application 200 uses each virtual resource and each physical resource on thevirtual platform 400. - Then, the method proceeds to step 608, actual value of each performance indicator of each of the
virtual functions monitoring unit 104 of the virtual functionperformance analysis system 100A (or 100B) on thevirtual platform 400. - Then, the method proceeds to step 610, actual condition of use (such as "value of usage status") of each physical resource and each virtual resource by the virtual
network function application 200 and other virtualnetwork function applications monitoring unit 104 on thevirtual platform 400 to build actual value of each performance indicator of each physical resource and each virtual resource. Then, step 613 ofFIG. 6C is performed. - In the
method 600 ofFIG. 6A , expected value associated with each performance indicator of each physical resource and/or each virtual resource, and expected value and/or threshold value associated with each performance indicator of each of thevirtual functions method 600B ofFIG. 6B , the expected value associated with each performance indicator of each of thevirtual functions testing unit 102 on thetesting platform 300 beforehand. As indicated inFIG. 6B ,step 602 and step 604 may may perform prior to step 606. Instep 602, thevirtual functions network function application 200 are executed in a clean room of thetesting platform 300. Then, the method proceeds to step 604, based on the execution result obtained from the execution of each of thevirtual functions testing platform 300, the value of each performance indicator of each of thevirtual functions testing unit 102, and the expected value associated with each performance indicator is created according to the collected values. Details ofstep 606 to step 610 ofmethod 600B ofFIG. 6B are completely identical to that of themethod 600 ofFIG. 6A , and the similarities are not repeated here. - Refer to
FIG. 6C . Instep 613, an actual value of each performance indicator (such as "value of usage status") of each physical resource and/or each virtual resource and each performance indicator (such as "execution time", "queue length") of each of thevirtual functions performance analysis unit 106 of the virtual functionperformance analysis system 100A (or 100B) to obtain a comparison result, and determining whether thevirtual functions - For example, in
step 614, the comparison result between the actual value and the expected value and/or threshold value associated with performance indicator indicates that the actual value of the performance indicator "execution time" of each of thevirtual functions virtual functions virtual functions virtual platform 400 basically meets the expected value. Therefore, it is determined that the workload of each of thevirtual functions - In
step 616, the actual value of another performance indicator "queue length" is compared with the threshold value by theperformance analysis unit 106. The comparison result obtained instep 616 indicates that the actual value of "queue length" is far greater than the threshold value (as listed in Table 3, actual value of the queue length of thevirtual function 202 is 250, which is far greater than the threshold value of the queue length listed in Table 1, that is, 200). Based on the comparison result, it may be confirmed that thevirtual function 202 has abnormalities, and performance bottleneck on thevirtual platform 400 may be defined as thevirtual function 202 whose actual value of queue length is far greater than the threshold value. - Then, the method proceeds to step 618, the workload of the
virtual function 202 whose queue length is greater than the threshold value is determined as being overloaded by theperformance analysis unit 106, and the resource adjusting unit 108 may adopt the following solutions to resolve the abnormalities of thevirtual function 202, for example, by adjusting service of the virtualnetwork function application 200 or by adjusting the allocation of the physical resources and/or virtual resources on thevirtual platform 400. - In the present embodiment, the resource adjusting unit 108 adjusts service of the virtual
network function application 200 by expanding other virtual network function applications similar to the virtualnetwork function application 200 to share the workload of thevirtual function 202 of the virtualnetwork function application 200. -
FIG. 7 is a flowchart of another embodiment of virtual functionperformance analysis method 700 of the present disclosure. The present embodiment of virtual functionperformance analysis method 700 succeeds to step 601 to step 613 of the afore-mentioned embodiment of virtual functionperformance analysis method 600, therefore step 601 to step 613 are omitted inFIG. 7 . - Refer to
FIG. 7 . Instep 614 of thepresent embodiment 700, based on the comparison result between the actual value of each performance indicator and the expected value and/or threshold value which shows that the actual value of the performance indicator "execution time" is far greater than the expected value (referring to Table 5: the mean and maximum of the actual values of execution time T_04 of thevirtual function 204, that is, 238us and 2530us respectively, are far greater than the mean and maximum of the expected values of the execution time T_04, that is, 50us and 150us, as listed in Table 1), theperformance analysis unit 106 determines that thevirtual function 204 has abnormalities, and thevirtual function 204 is located as the bottleneck which deteriorates system performance. - Possibly, the
virtual function 204 becomes bottleneck due to the usage status of the physical resources and/or virtual resources being near an upper limit of the allocation of corresponding resources or almost overload. For example, the physical resources and/or virtual resources allocated to the virtual network function application 200 (which has the virtual function 204) are insufficient, making the usage status almost overloaded. Or, in a multi-thread environment, othervirtual functions network function application 200 compete with thevirtual function 204 for virtual resources. Or, other virtualnetwork function applications Table 5: Actual value of performance indicator of virtual functions Actual value of performance indicator "execution time" Actual value of performance indicator "queue length" Virtual function 202Execution time T_02 Minimum 55us Queue 202a queue length: Mean 103us Maximum 205us 250 Virtual function 204Execution time T_04 Minimum 27us Queue 204a queue length: 250 Mean 238us Maximum 2530us Virtual function 206Execution time T_06 Minimum 110us N/A Mean 135us Maximum 270us - In
step 620, whether the usage status of each physical resource and/or each virtual resource is near an upper limit of the allocation of corresponding resources or almost overloaded is determined by theperformance analysis unit 106 according to the recorded actual value of each performance indicator of each physical resource and/or each virtual resource. The analysis result is listed in Table 6. The actual value of usage status of thevirtual CPU 412 used by the virtual network function application 200 (that is, target virtual network function application, which has the virtual function 204) is 54%, being far greater than the expected value as listed in Table 2-1, that is, 20%. This indicates that the usage status of thevirtual CPU 412 used by the virtualnetwork function application 200 is already near an upper limit of the allocation of thevirtual resource 412a allocated to the virtualnetwork function application 200, or the usage status is near the upper limit of the allocation or almost overloaded. Therefore, performance bottleneck of thevirtual function 204 could possibly occur due to the following: resource (i.e.,virtual resource 412a) of thevirtual CPU 412, which is allocated by thevirtual platform 400 to the virtual network function application 200 (which has the virtual function 204), is insufficient.Table 6: Actual value of "value of usage status" of the virtual resources and the physical resources of virtual platform 400 used by virtualnetwork function applications Actual value of performance indicator "value of usage status" of virtual CPU 412Actual value of performance indicator "value of usage status" (total usage) of physical CPU 402Virtual network function application 20054% 89% Virtual network function application 23020% Virtual network function application 26015% - Then, the method proceeds to step 622, the allocation of each virtual resource of the
network function application 200 is adjusted by the resource adjusting unit 108. For example, the allocation of thevirtual CPU 412 may be adjusted, that is, morevirtual resource 412a of thevirtual CPU 412 is allocated to the virtualnetwork function application 200. Or, the resource adjusting unit 108 may expand the physical resources and/or virtual resources on thevirtual platform 400. Or, the resource adjusting unit 108 may adjust service of the virtualnetwork function application 200, for example, by expanding to execute other virtual network function applications with the same functions of the virtualnetwork function application 200 to share the workload of the virtualnetwork function application 200. -
FIG. 8 is a flowchart of still another embodiment of virtual functionperformance analysis method 800 of the present disclosure. The present embodiment of virtual functionperformance analysis method 800 succeeds to step 601 to step 613 of the afore-mentioned embodiment of virtual functionperformance analysis method 600 and step 614 of the afore-mentioned embodiment of virtual functionperformance analysis method 700, therefore step 601 to step 614 are omitted inFIG. 8 . - Refer to
FIG. 8 . In thestep 620 of thepresent method 800, based on the analysis that the usage status of each virtual resource used by the virtualnetwork function application 200 is within a normal range (as listed in Table 7, the actual value of usage status of thevirtual CPU 412 used by the virtualnetwork function application 200, that is, 25%, is only slightly greater than the expected value as listed in Table 2-1, that is, 22%, and is not far greater than the expected value, that is, 22%), theperformance analysis unit 106 determines that the usage status of the virtual resource of the virtualnetwork function application 200 is not near the upper limit of the allocation of the virtual resource, and the virtual resource of the virtualnetwork function application 200 is not almost overloaded. - Next,
step 624 is performed to further analyze whether the total value of usage status of the physical resources used by the virtualnetwork function applications virtual platform 400 is near the upper limit of the allocation of the physical resources or almost overloaded.Table 7: Actual value of the "value of usage status" of the virtual resources and the physical resources of virtual platform 400 used by virtualnetwork function applications Actual value of performance indicator "value of usage status" of virtual CPU 412Actual value of performance indicator "value of usage status" (total usage) of physical CPU 402Virtual network function application 20025% 95% Virtual network function application 23052% Virtual network function application 26018% - In
step 624, the analysis result recorded by theperformance analysis unit 106 as listed in Table 7 shows that the actual value of total value of usage status (i.e., total actual value of usage status ) of thephysical CPU 402, that is, 95%, is near an upper limit of the allocation of thephysical CPU 402 and almost overloaded, therefore it is determined that the virtualnetwork function applications network function application 200 are competing for thephysical CPU 402, and the value of usage status of thephysical CPU 402 used by the other virtualnetwork function applications network function application 230 is 52% (52% is too high), this indicates the virtualnetwork function application 230 is competing for the resource of thephysical CPU 402. - Then, the method proceeds to step 626, the allocation of each virtual resource of the virtual
network function application 200 is adjusted by the resource adjusting unit 108. For example, the allocation of thevirtual CPU 412 may be adjusted, that is, morevirtual resource 412a of thevirtual CPU 412 is allocated to the virtualnetwork function application 200, such that the virtualnetwork function application 200 has sufficient virtual resource allocations. Or, the resource adjusting unit 108 may expand the physical resources and/or virtual resources on thevirtual platform 400. Or, the resource adjusting unit 108 may adjust thephysical CPU 402 whose usage status is near an upper limit of the allocation of thephysical CPU 402 or almost overloaded, for example, by expanding the physical resources and/or virtual resources on thevirtual platform 400, such that more physical CPU may be provided. -
FIG. 9 is a flowchart of yet another embodiment of virtual functionperformance analysis method 900 of the present disclosure. The present embodiment of virtual functionperformance analysis method 900 succeeds to step 601 to step 610 of the afore-mentioned embodiment of virtual functionperformance analysis method 600, step 614 of the afore-mentioned embodiment of virtual functionperformance analysis method 700 and step 620 of the afore-mentioned embodiment of virtual functionperformance analysis method 800, therefore step 601 to step 620 are omitted inFIG. 9 . - Refer to
FIG. 9 . Instep 624 of thepresent method 900, based on the analysis result of theperformance analysis unit 106 which indicates that the usage status of each virtual resource used by the virtualnetwork function application 200 is not near an upper limit of the allocation of the virtual resource, and the usage status of each virtual resource used by the virtualnetwork function application 200 is not almost overloaded. Furthermore, the total value of usage status of each physical resource is not near an upper limit of the allocation of the physical resource, and the total usage status of each physical resource is not almost overloaded (as listed in Table 4, the actual value of usage status of thevirtual CPU 412 used by the virtualnetwork function application 200 is 20%, which is lower than the expected value of 22% as listed in Table 2-1, furthermore, the actual total value of usage status of thephysical CPU 402 is 60%, which is lower than the expected value of 62% as listed in Table 2-1). Therefore, it is determined that, other virtualnetwork function applications network function application 200 for physical resources, and thevirtual functions network function application 200 may not compete for virtual resources. Therefore, theperformance analysis unit 106 determines that, the reason for which the execution time of thevirtual function 204 is much greater than the expected value (and hencevirtual function 204 becomes a performance bottleneck) is irrelevant to the allocation of the physical resources and/or virtual resource. - Then, the method proceeds to step 628, the
performance analysis unit 106 determines that performance bottleneck of thevirtual function 204 is possibly caused by logic error of programming in the programming code of the virtual function 204 (such as error in the lock mechanism of the programming code of the virtual function 204) or caused by abnormalities in packet processing. A case for the abnormality in packet processing may be, for example, packet loss of thevirtual function 204 will cause the re-transmission mechanism of the software protocol to re-transmit the packets, and the delay in service of thevirtual function 204 will be too long. - According to the embodiments of different implementations disclosed above, the virtual function
performance analysis system 100A (or 100B) of the present disclosure monitors several performance indicators (such as "execution time", "execution frequency", "queue length and "error rate") of each of thevirtual functions virtual platform 400. Moreover, actual value of each performance indicator of each physical resource and/or each virtual resource of each of thevirtual functions network function application 200 is monitored on thevirtual platform 400 of an actual environment. Then, whether the actual value of each performance indicator is far greater than the expected value and/or threshold value is determined. If the actual value of each performance indicator is far greater than the associated expected value and/or threshold value, this indicates: the virtual function (such as virtual function 202) is overloaded; the physical resources and/or virtual resources allocated to the virtual network function application 200 (which has the virtual function that is overloaded ) are insufficient; other virtualnetwork function applications network function application 200 for physical resources; or thevirtual functions network function application 200 are completing for virtual resources. The virtual functionperformance analysis system 100A (or 100B) automatically defines the "virtual function", or the "physical resource" or "virtual resource" whose usage status is near the upper limit of the allocation of corresponding resources or almost overloaded as a bottleneck which deteriorates performance of the virtualnetwork function application 200. - In comparison to the art in which the data of each performance indicator is manually collected by maintenance personnel on the virtual platform, the virtual function
performance analysis system 100A (or 100B) of the present disclosure connects and analyzes the data of each performance indicator in an automatic manner and therefore has the advantage in terms of timeliness and speed. In the art, maintenance personnel on the virtual platform do not analyze the performance indicator "execution time" of the virtual function, and therefore may not accurately analyze the causes of abnormalities. Conversely, the virtual functionperformance analysis system 100A (or 100B) of the disclosure may accurately analyze the execution time of each virtual function. In comparison to the art which merely ascribes performance bottleneck to the virtual network function application, the virtual functionperformance analysis system 100A (or 100B) of the present disclosure may more accurately ascribe bottleneck to a particular function of the virtual network function application and accurately analyze which function deteriorates system performance on thevirtual platform 400. - Besides, with respect to the factor that deteriorates system performance on the virtual platform, the virtual function
performance analysis system 100A (or 100B) of the present disclosure may automatically adjust the virtualnetwork function application 200 and/or service of each of thevirtual functions virtual platform 400 to improve system performance on thevirtual platform 400 in an automatic manner. - While the invention has been described by way of example and in terms of the preferred embodiment (s), it is to be understood that the invention is not limited thereto. On the contrary, it is intended to cover various modifications and similar arrangements and procedures, and the scope of the appended claims therefore should be accorded the broadest interpretation so as to encompass all such modifications and similar arrangements and procedures.
Claims (14)
- A virtual function performance analysis system for analyzing performance of at least one virtual function (202-206) of a virtual network function application (200) on a virtual platform (400), the virtual platform (400) has at least one physical resource (402-408) and at least one virtual resource (412-418), characterized in that, the system comprising:a monitoring unit (104), configured to monitor performance of the at least one virtual function (202-206) on the virtual platform (400), and each of the physical resources (402-408), each of the virtual resources (412-418) and each of the virtual functions (202-206) is evaluated with at least one performance indicator respectively, each of the performance indicators is associated with an expected value and/or a threshold value respectively, and the monitoring unit (104) monitors and records an actual value of each of the performance indicators on the virtual platform (400); anda performance analysis unit (106), configured to compare the actual value of each of the performance indicators with the associated expected value and/or threshold value to obtain a comparison result of each of the performance indicators and to analyze system performance according to the comparison result.
- The virtual function performance analysis system according to claim 1, further comprising:
a testing unit (102), configured to monitor each of the virtual functions (202-206) of the virtual network function application (200) on a testing platform (300) and build the expected value and/or the threshold value associated with each of the performance indicators with which each of the virtual functions (202-206) is evaluated. - The virtual function performance analysis system according to claim 1, wherein the performance indicators with which each of the virtual functions (202-206) is evaluated comprise at least one of an execution time, an execution frequency, an error rate or a queue length of each of the virtual functions, or at least one of the respective execution time, execution frequency, error rate or queue length of each of the virtual functions (202-206) corresponding to each thread of multi-thread, and the performance indicator with which each of the physical resources (402-408) and/or each of the virtual resources (412-418) is evaluated comprises a value of an usage status respectively.
- The virtual function performance analysis system according to claim 1, wherein if the comparison result indicates that the actual values of the performance indicators are higher than the associated expected value and/or threshold value, then the performance analysis unit (106) determines that the physical resources (402-408) and/or the virtual resources (412-418) or the virtual functions (202-206) evaluated with the performance indicators are performance bottleneck on the virtual platform (400), and using a resource adjusting unit (108) to perform at least one of the following operations according to the comparison result: adjusting service of the virtual network function application (200), adjusting an allocation of the physical resources (402-408), or adjusting an allocation of the virtual resources (412-418) of the virtual network function application (200).
- The virtual function performance analysis system according to claim 4, wherein if the comparison result indicates that an usage status of at least one of each of the physical resources (402-408) and/or each of the virtual resources (412-418) is near an upper limit of the allocation of corresponding resources or almost overloaded, then using the resource adjusting unit (108) to perform at least one of the following operations according to the comparison result: expanding the allocation of the physical resources (402-408) which are possibly overloaded, or adjusting the allocation of the virtual resources (412-418) of the virtual network function application (200), to make the virtual network function application (200) and each of the virtual functions (202-206) have sufficient resource allocations.
- The virtual function performance analysis system according to claim 4, wherein if the comparison result indicates that, an usage status of each of the physical resources (402-408) is not near an upper limit of the allocation of the physical resources (402-408) and is not almost overloaded, and an usage status of each of the virtual resources (412-418) is not near an upper limit of the allocation of the virtual resources (412-418) and is not almost overloaded, then the performance analysis unit (106) determines that the virtual functions (202-206) evaluated with the performance indicators have logic error in programming or abnormalities in packet processing.
- The virtual function performance analysis system according to claim 1, wherein the physical resources (402-408) of the virtual platform (400) at least comprise at least one of a physical CPU (402), a physical memory (404), a physical network bandwidth (406) and a physical disc input/output (408), and the virtual resources (412-418) of the virtual platform (400) at least comprise at least one of a virtual CPU (412), a virtual memory (414), a virtual network bandwidth (416) and a virtual disc input/output (418).
- A virtual function performance analysis method for analyzing performance of at least one virtual function (202-206) of a virtual network function application (200) on a virtual platform (400), the virtual platform (400) has at least one physical resource (402-408) and at least one virtual resource (412-418), characterized in that, the method comprising:monitoring performance of the at least one virtual function (202-206) on the virtual platform (400), each of the physical resources (402-408), each of the virtual resources (412-418) and each of the virtual functions (202-206) is evaluated with at least one performance indicator respectively, each of the performance indicators is associated with an expected value and/or a threshold value;monitoring and recording an actual value of each of the performance indicators on the virtual platform (400); andcomparing the actual value of each of the performance indicators with the associated expected value and/or threshold value to obtain a comparison result of each of the performance indicators and analyzing system performance according to the comparison result.
- The virtual function performance analysis method according to claim 8, further comprising:monitoring each of the virtual functions (202-206) of the virtual network function application (200) on a testing platform (300); andbuilding, on the testing platform (300), the expected value and/or the threshold value associated with each of the performance indicators with which each of the virtual functions (202-206) is evaluated.
- The virtual function performance analysis method according to claim 8, wherein the performance indicators with which each of the virtual functions (202-206) is evaluated comprise at least one of an execution time, an execution frequency, an error rate or a queue length of each of the virtual functions (202-206), or at least one of the respective execution time, execution frequency, error rate or queue length of each of the virtual functions (202-206) corresponding to each thread of multi-thread, and the performance indicator with which each of the physical resources (402-408) and/or each of the virtual resources (412-418) is evaluated comprises a value of an usage status respectively.
- The virtual function performance analysis method according to claim 8, wherein if the comparison result indicates that the actual values of the performance indicators are higher than the associated expected value and/or threshold value, then the virtual function performance analysis method further comprises:determining that the physical resources (402-408) and/or the virtual resources (412-418) or the virtual functions (202-206) evaluated with the performance indicators are performance bottleneck on the virtual platform (400); andaccording to the comparison result, adjusting service of the virtual network function application (200), adjusting an allocation of the physical resources (402-408), or adjusting an allocation of the virtual resources (412-418) of the virtual network function application (200).
- The virtual function performance analysis method according to claim 11, wherein if the comparison result indicates that an usage status of at least one of each of the physical resources (402-408) and/or each of the virtual resources (412-418) is near an upper limit of the allocation of corresponding resources or almost overloaded, then the virtual function performance analysis method further comprises:according to the comparison result, expanding the allocation of the physical resources (402-408) which are possibly overloaded, or adjusting the allocation of the virtual resources (412-418) of the virtual network function application (200), to make the virtual network function application (200) and each of the virtual functions (202-206) have sufficient resource allocations.
- The virtual function performance analysis method according to claim 11, wherein if the comparison result indicates that, an usage status of each of the physical resources (402-408) is not near an upper limit of the allocation of the physical resources (402-408) and is not almost overloaded, and an usage status of each of the virtual resources (412-418) is not near an upper limit of the allocation of the virtual resources (412-418) and is not almost overloaded, then the virtual function performance analysis method further comprises:determining that the virtual functions (202-206) evaluated with the performance indicators have logic error in programming or abnormalities in packet processing.
- The virtual function performance analysis method according to claim 8, wherein the physical resources (402-408) of the virtual platform (400) at least comprise at least one of a physical CPU (402), a physical memory (404), a physical network bandwidth (406), and a physical disc input/output (408); and the virtual resources (412-418) of the virtual platform (400) at least comprise at least one of a virtual CPU (412), a virtual memory (414), a virtual network bandwidth (416), and a virtual disc input/output (418).
Applications Claiming Priority (1)
| Application Number | Priority Date | Filing Date | Title |
|---|---|---|---|
| TW110133368A TWI827974B (en) | 2021-09-08 | 2021-09-08 | Virtual function performance analyzing system and analyzing method thereof |
Publications (1)
| Publication Number | Publication Date |
|---|---|
| EP4148582A1 true EP4148582A1 (en) | 2023-03-15 |
Family
ID=79231127
Family Applications (1)
| Application Number | Title | Priority Date | Filing Date |
|---|---|---|---|
| EP21212546.2A Withdrawn EP4148582A1 (en) | 2021-09-08 | 2021-12-06 | Virtual function performance analysis system and analysis method thereof |
Country Status (6)
| Country | Link |
|---|---|
| US (1) | US20230071976A1 (en) |
| EP (1) | EP4148582A1 (en) |
| JP (1) | JP2023039385A (en) |
| CN (1) | CN115776448A (en) |
| PH (1) | PH12022050077A1 (en) |
| TW (1) | TWI827974B (en) |
Families Citing this family (2)
| Publication number | Priority date | Publication date | Assignee | Title |
|---|---|---|---|---|
| US12462019B2 (en) * | 2023-06-27 | 2025-11-04 | Dell Products L.P. | Utilization of the least code principle to structure workflows |
| CN120371549B (en) * | 2025-06-27 | 2026-01-23 | 山东云海国创云计算装备产业创新中心有限公司 | Methods, devices, computer equipment and storage media for dynamic allocation of storage resources |
Citations (4)
| Publication number | Priority date | Publication date | Assignee | Title |
|---|---|---|---|---|
| US20160179582A1 (en) * | 2014-12-23 | 2016-06-23 | Intel Corporation | Techniques to dynamically allocate resources for local service chains of configurable computing resources |
| EP3410301A1 (en) * | 2017-05-30 | 2018-12-05 | Hewlett-Packard Enterprise Development LP | Virtual network function resource allocation |
| US20190042297A1 (en) * | 2018-09-13 | 2019-02-07 | Intel Corporation | Technologies for deploying virtual machines in a virtual network function infrastructure |
| US20200213205A1 (en) * | 2018-12-27 | 2020-07-02 | At&T Intellectual Property I, L.P. | Adjusting triggers for automatic scaling of virtual network functions |
Family Cites Families (49)
| Publication number | Priority date | Publication date | Assignee | Title |
|---|---|---|---|---|
| US7020698B2 (en) * | 2000-05-31 | 2006-03-28 | Lucent Technologies Inc. | System and method for locating a closest server in response to a client domain name request |
| JP2004302751A (en) * | 2003-03-31 | 2004-10-28 | Hitachi Ltd | Performance management method for computer system and computer system for managing performance of storage device |
| JP4071668B2 (en) * | 2003-04-16 | 2008-04-02 | 富士通株式会社 | Apparatus and method for adjusting system resources |
| US20060005184A1 (en) * | 2004-06-30 | 2006-01-05 | Vijay Tewari | Virtualizing management hardware for a virtual machine |
| JP2006178374A (en) * | 2004-12-24 | 2006-07-06 | Brother Ind Ltd | Image forming apparatus |
| TW200826086A (en) * | 2005-12-21 | 2008-06-16 | Koninkl Philips Electronics Nv | A method of operating a data recording device |
| EP2023245B1 (en) * | 2006-04-26 | 2016-02-17 | Nippon Telegraph And Telephone Corporation | Load control device and its method |
| JP4872615B2 (en) * | 2006-11-14 | 2012-02-08 | 株式会社デンソー | Diagnostic device for internal combustion engine |
| CN101247277A (en) * | 2007-02-15 | 2008-08-20 | 华为技术有限公司 | A method and device for warning |
| CN102056538B (en) * | 2008-06-06 | 2014-10-15 | 柯惠有限合伙公司 | Systems and methods for determining patient effort and/or breathing parameters in a ventilation system |
| JP5458308B2 (en) * | 2010-06-11 | 2014-04-02 | 株式会社日立製作所 | Virtual computer system, virtual computer system monitoring method, and network device |
| US20120079229A1 (en) * | 2010-09-28 | 2012-03-29 | Craig Jensen | Data storage optimization for a virtual platform |
| US8694728B2 (en) * | 2010-11-09 | 2014-04-08 | Vmware, Inc. | Efficient online construction of miss rate curves |
| CN102156665B (en) * | 2011-04-13 | 2012-12-05 | 杭州电子科技大学 | Differential serving method for virtual system competition resources |
| CN102495784A (en) * | 2011-11-16 | 2012-06-13 | 浪潮(北京)电子信息产业有限公司 | Hard disc monitor and management method and system |
| US9357021B2 (en) * | 2013-03-14 | 2016-05-31 | Comcast Cable Communications, Llc | Delivery of content |
| JP6248560B2 (en) * | 2013-11-13 | 2017-12-20 | 富士通株式会社 | Management program, management method, and management apparatus |
| TWI603266B (en) * | 2014-03-03 | 2017-10-21 | 廣達電腦股份有限公司 | Resource adjustment methods and systems for virtual machines |
| US9800651B2 (en) * | 2014-04-04 | 2017-10-24 | Ca, Inc. | Application-specific assessment of cloud hosting suitability |
| WO2016022698A1 (en) * | 2014-08-07 | 2016-02-11 | Intel IP Corporation | Virtualized network function management |
| JP2016062506A (en) * | 2014-09-19 | 2016-04-25 | 株式会社東芝 | Monitoring system, monitor and monitoring method |
| JP6500489B2 (en) * | 2015-02-24 | 2019-04-17 | 日本電気株式会社 | Display system, display method, display program and virtual system |
| JP6403621B2 (en) * | 2015-03-31 | 2018-10-10 | 株式会社日立製作所 | Network system, resource management method, and control apparatus |
| US10680896B2 (en) * | 2015-06-16 | 2020-06-09 | Hewlett Packard Enterprise Development Lp | Virtualized network function monitoring |
| JP2017049643A (en) * | 2015-08-31 | 2017-03-09 | 富士通株式会社 | Information processing apparatus, license management program, and license management method |
| JP6440203B2 (en) * | 2015-09-02 | 2018-12-19 | Kddi株式会社 | Network monitoring system, network monitoring method and program |
| WO2017067567A1 (en) * | 2015-10-19 | 2017-04-27 | Nokia Solutions And Networks Oy | Dormant vdus in vnfd |
| WO2017092823A1 (en) * | 2015-12-04 | 2017-06-08 | Telefonaktiebolaget Lm Ericsson (Publ) | Technique for optimizing the scaling of an application having a set of virtual machines |
| JP2017184168A (en) * | 2016-03-31 | 2017-10-05 | 日本電気株式会社 | Communication system, control unit, communication control method, and program |
| WO2017189015A1 (en) * | 2016-04-29 | 2017-11-02 | Intel IP Corporation | Network function virtualization |
| WO2017222613A1 (en) * | 2016-06-20 | 2017-12-28 | Intel IP Corporation | End-to-end techniques to create pm (performance measurement) thresholds at nfv (network function virtualization) infrastructure |
| JP6885403B2 (en) * | 2016-07-21 | 2021-06-16 | 日本電気株式会社 | Resource management device, resource management method and program |
| US20180069749A1 (en) * | 2016-09-07 | 2018-03-08 | Netscout Systems, Inc | Systems and methods for performing computer network service chain analytics |
| US11063844B2 (en) * | 2017-02-10 | 2021-07-13 | Apple Inc. | Systems, methods and devices for virtual resource metric management |
| JP2018180773A (en) * | 2017-04-07 | 2018-11-15 | 富士通株式会社 | Management device and management method |
| US10977575B2 (en) * | 2017-05-04 | 2021-04-13 | Servicenow, Inc. | Machine learning auto completion of fields |
| US20190095796A1 (en) * | 2017-09-22 | 2019-03-28 | Intel Corporation | Methods and arrangements to determine physical resource assignments |
| FR3074542B1 (en) * | 2017-12-06 | 2019-12-20 | IFP Energies Nouvelles | METHOD FOR CONTROLLING AN INTERNAL COMBUSTION ENGINE WITH CONTROLLED IGNITION USING A CLICK ESTIMATOR |
| CN111937012A (en) * | 2018-03-30 | 2020-11-13 | 日本电气方案创新株式会社 | Indicator computing equipment, forecasting system, progress forecasting evaluation method and program |
| WO2019211713A1 (en) * | 2018-04-30 | 2019-11-07 | Telefonaktiebolaget Lm Ericsson (Publ) | Automated augmented reality rendering platform for providing remote expert assistance |
| JP6973300B2 (en) * | 2018-06-04 | 2021-11-24 | 日本電信電話株式会社 | Service chain design equipment, service chain design method, and service chain design program |
| CN119485764A (en) * | 2018-08-07 | 2025-02-18 | 交互数字专利控股公司 | NR V2X approach for congestion control |
| US11490366B2 (en) * | 2019-05-07 | 2022-11-01 | Hewlett Packard Enterprise Development Lp | Network function virtualisation |
| US10992542B2 (en) * | 2019-06-25 | 2021-04-27 | Sciencelogic, Inc. | System and method for the collection, generation, and distribution of synthetic metrics for computer system management |
| US11719451B2 (en) * | 2019-12-23 | 2023-08-08 | Johnson Controls Tyco IP Holdings LLP | Building system with early fault detection |
| US11556791B2 (en) * | 2020-04-01 | 2023-01-17 | Sas Institute Inc. | Predicting and managing requests for computing resources or other resources |
| US11057274B1 (en) * | 2020-04-09 | 2021-07-06 | Verizon Patent And Licensing Inc. | Systems and methods for validation of virtualized network functions |
| US20200287813A1 (en) * | 2020-04-16 | 2020-09-10 | Patrick KUTCH | Method and apparatus for workload feedback mechanism facilitating a closed loop architecture |
| US12242475B2 (en) * | 2020-09-30 | 2025-03-04 | Snowflake Inc. | Autoscaling external function requests |
-
2021
- 2021-09-08 TW TW110133368A patent/TWI827974B/en active
- 2021-11-12 JP JP2021185129A patent/JP2023039385A/en active Pending
- 2021-12-02 US US17/540,537 patent/US20230071976A1/en not_active Abandoned
- 2021-12-06 EP EP21212546.2A patent/EP4148582A1/en not_active Withdrawn
-
2022
- 2022-01-04 CN CN202210001353.8A patent/CN115776448A/en active Pending
- 2022-02-28 PH PH1/2022/050077A patent/PH12022050077A1/en unknown
Patent Citations (4)
| Publication number | Priority date | Publication date | Assignee | Title |
|---|---|---|---|---|
| US20160179582A1 (en) * | 2014-12-23 | 2016-06-23 | Intel Corporation | Techniques to dynamically allocate resources for local service chains of configurable computing resources |
| EP3410301A1 (en) * | 2017-05-30 | 2018-12-05 | Hewlett-Packard Enterprise Development LP | Virtual network function resource allocation |
| US20190042297A1 (en) * | 2018-09-13 | 2019-02-07 | Intel Corporation | Technologies for deploying virtual machines in a virtual network function infrastructure |
| US20200213205A1 (en) * | 2018-12-27 | 2020-07-02 | At&T Intellectual Property I, L.P. | Adjusting triggers for automatic scaling of virtual network functions |
Non-Patent Citations (1)
| Title |
|---|
| ZAREIAN SAEED ET AL: "K-Feed - A Data-Oriented Approach to Application Performance Management in Cloud", 2015 IEEE 8TH INTERNATIONAL CONFERENCE ON CLOUD COMPUTING, IEEE, 27 June 2015 (2015-06-27), pages 1045 - 1048, XP033207540, DOI: 10.1109/CLOUD.2015.148 * |
Also Published As
| Publication number | Publication date |
|---|---|
| PH12022050077A1 (en) | 2024-06-19 |
| TWI827974B (en) | 2024-01-01 |
| JP2023039385A (en) | 2023-03-20 |
| TW202311943A (en) | 2023-03-16 |
| CN115776448A (en) | 2023-03-10 |
| US20230071976A1 (en) | 2023-03-09 |
Similar Documents
| Publication | Publication Date | Title |
|---|---|---|
| JP5474982B2 (en) | Evaluating the effectiveness of memory management techniques that use selective mitigation to reduce errors | |
| US10747451B2 (en) | Auto allocation of storage system resources to heterogeneous categories of resource consumer | |
| US8209684B2 (en) | Monitoring system for virtual application environments | |
| US9529694B2 (en) | Techniques for adaptive trace logging | |
| US20160034328A1 (en) | Systems and methods for spatially displaced correlation for detecting value ranges of transient correlation in machine data of enterprise systems | |
| US8132170B2 (en) | Call stack sampling in a data processing system | |
| US8756307B1 (en) | Translating service level objectives to system metrics | |
| US20170206107A1 (en) | Systems And Methods For Provisioning Of Storage For Virtualized Applications | |
| US20220413708A1 (en) | Optimized I/O Performance Regulation for Non-Volatile Storage | |
| US8028201B2 (en) | Leveled logging data automation for virtual tape server applications | |
| US20230071976A1 (en) | Virtual function performance analysis system and analysis method thereof | |
| Ambati et al. | Waiting game: optimally provisioning fixed resources for cloud-enabled schedulers | |
| CN112379935A (en) | Spark performance optimization control method, device, equipment and storage medium | |
| CN119806925A (en) | A hardware-based service component testing system | |
| JP5694170B2 (en) | Memory management technology that uses selective mitigation to reduce errors | |
| CN114741218A (en) | Method, device, equipment, system and medium for extracting abnormal index of operating system | |
| JP2019012477A (en) | Diagnostic program, diagnostic method, and diagnostic apparatus | |
| CN118689859B (en) | Log landing method and device, storage medium and electronic equipment | |
| CN116185631B (en) | Load balancing method, device, equipment and medium for solid state disk with multi-core structure | |
| CN114153561A (en) | Resource configuration method, apparatus, device and readable storage medium | |
| WO2009014493A1 (en) | Monitoring system for virtual application environments | |
| CN119629125B (en) | Flow control method, device, electronic device and readable storage medium | |
| US20120317580A1 (en) | Apportioning Summarized Metrics Based on Unsummarized Metrics in a Computing System | |
| CN114641024B (en) | Method and device for determining resource utilization rate of network function network element | |
| CN121187909A (en) | Disk isolation methods and devices, storage media, electronic devices |
Legal Events
| Date | Code | Title | Description |
|---|---|---|---|
| PUAI | Public reference made under article 153(3) epc to a published international application that has entered the european phase |
Free format text: ORIGINAL CODE: 0009012 |
|
| STAA | Information on the status of an ep patent application or granted ep patent |
Free format text: STATUS: REQUEST FOR EXAMINATION WAS MADE |
|
| 17P | Request for examination filed |
Effective date: 20211206 |
|
| AK | Designated contracting states |
Kind code of ref document: A1 Designated state(s): AL AT BE BG CH CY CZ DE DK EE ES FI FR GB GR HR HU IE IS IT LI LT LU LV MC MK MT NL NO PL PT RO RS SE SI SK SM TR |
|
| STAA | Information on the status of an ep patent application or granted ep patent |
Free format text: STATUS: EXAMINATION IS IN PROGRESS |
|
| 17Q | First examination report despatched |
Effective date: 20230828 |
|
| STAA | Information on the status of an ep patent application or granted ep patent |
Free format text: STATUS: THE APPLICATION HAS BEEN WITHDRAWN |
|
| 18W | Application withdrawn |
Effective date: 20231222 |