EP4145151A1 - Signal processing module and measurement instrument - Google Patents
Signal processing module and measurement instrument Download PDFInfo
- Publication number
- EP4145151A1 EP4145151A1 EP22185484.7A EP22185484A EP4145151A1 EP 4145151 A1 EP4145151 A1 EP 4145151A1 EP 22185484 A EP22185484 A EP 22185484A EP 4145151 A1 EP4145151 A1 EP 4145151A1
- Authority
- EP
- European Patent Office
- Prior art keywords
- error quantity
- signal
- measurement
- complex
- error
- Prior art date
- Legal status (The legal status is an assumption and is not a legal conclusion. Google has not performed a legal analysis and makes no representation as to the accuracy of the status listed.)
- Granted
Links
Images


Classifications
-
- G—PHYSICS
- G01—MEASURING; TESTING
- G01R—MEASURING ELECTRIC VARIABLES; MEASURING MAGNETIC VARIABLES
- G01R35/00—Testing or calibrating of apparatus covered by the other groups of this subclass
- G01R35/005—Calibrating; Standards or reference devices, e.g. voltage or resistance standards, "golden" references
-
- G—PHYSICS
- G01—MEASURING; TESTING
- G01R—MEASURING ELECTRIC VARIABLES; MEASURING MAGNETIC VARIABLES
- G01R31/00—Arrangements for testing electric properties; Arrangements for locating electric faults; Arrangements for electrical testing characterised by what is being tested not provided for elsewhere
- G01R31/28—Testing of electronic circuits, e.g. by signal tracer
- G01R31/317—Testing of digital circuits
- G01R31/3181—Functional testing
- G01R31/319—Tester hardware, i.e. output processing circuits
- G01R31/31903—Tester hardware, i.e. output processing circuits tester configuration
- G01R31/31907—Modular tester, e.g. controlling and coordinating instruments in a bus based architecture
-
- G—PHYSICS
- G01—MEASURING; TESTING
- G01R—MEASURING ELECTRIC VARIABLES; MEASURING MAGNETIC VARIABLES
- G01R13/00—Arrangements for displaying electric variables or waveforms
- G01R13/02—Arrangements for displaying electric variables or waveforms for displaying measured electric variables in digital form
- G01R13/0218—Circuits therefor
- G01R13/0236—Circuits therefor for presentation of more than one variable
-
- G—PHYSICS
- G01—MEASURING; TESTING
- G01R—MEASURING ELECTRIC VARIABLES; MEASURING MAGNETIC VARIABLES
- G01R19/00—Arrangements for measuring currents or voltages or for indicating presence or sign thereof
- G01R19/0046—Arrangements for measuring currents or voltages or for indicating presence or sign thereof characterised by a specific application or detail not covered by any other subgroup of G01R19/00
- G01R19/0053—Noise discrimination; Analog sampling; Measuring transients
-
- G—PHYSICS
- G01—MEASURING; TESTING
- G01R—MEASURING ELECTRIC VARIABLES; MEASURING MAGNETIC VARIABLES
- G01R31/00—Arrangements for testing electric properties; Arrangements for locating electric faults; Arrangements for electrical testing characterised by what is being tested not provided for elsewhere
- G01R31/28—Testing of electronic circuits, e.g. by signal tracer
- G01R31/317—Testing of digital circuits
- G01R31/3181—Functional testing
- G01R31/319—Tester hardware, i.e. output processing circuits
- G01R31/3193—Tester hardware, i.e. output processing circuits with comparison between actual response and known fault free response
-
- G—PHYSICS
- G01—MEASURING; TESTING
- G01R—MEASURING ELECTRIC VARIABLES; MEASURING MAGNETIC VARIABLES
- G01R35/00—Testing or calibrating of apparatus covered by the other groups of this subclass
-
- G—PHYSICS
- G01—MEASURING; TESTING
- G01R—MEASURING ELECTRIC VARIABLES; MEASURING MAGNETIC VARIABLES
- G01R35/00—Testing or calibrating of apparatus covered by the other groups of this subclass
- G01R35/02—Testing or calibrating of apparatus covered by the other groups of this subclass of auxiliary devices, e.g. of instrument transformers according to prescribed transformation ratio, phase angle, or wattage rating
-
- G—PHYSICS
- G01—MEASURING; TESTING
- G01R—MEASURING ELECTRIC VARIABLES; MEASURING MAGNETIC VARIABLES
- G01R29/00—Arrangements for measuring or indicating electric quantities not covered by groups G01R19/00 - G01R27/00
- G01R29/26—Measuring noise figure; Measuring signal-to-noise ratio
Definitions
- the invention generally relates to a signal processing module for a measurement instrument.
- the invention further relates to a measurement instrument.
- EVM error vector magnitude
- the measurement instrument cannot distinguish between noise that originates from the device under test (DUT) and noise added by the measurement instrument itself.
- the measurement instrument has an intrinsic noise level that is of the same magnitude or even higher than the noise level of the device under test, certain parameters like the EVM cannot be reliably measured.
- the object of the present invention is to provide a signal processing module as well as a measurement instrument that provide additional information about the dominating origin of the noise.
- the problem is solved by a signal processing module for a measurement instrument.
- the signal processing module comprises an analysis module, a measurement input, and at least two parallel measurement channels.
- the at least two parallel measurement channels are each connected to the measurement input, such that an input signal received via the measurement input is forwarded to the at least two parallel measurement channels.
- a first one of the two parallel measurement channels is configured to process the input signal, thereby generating a first complex-valued measurement signal.
- a second one of the two parallel measurement channels is configured to process the input signal, thereby generating a second complex-valued measurement signal.
- the analysis module is configured to determine a first error quantity associated with the first complex-valued measurement signal.
- the analysis module is configured to determine a second error quantity associated with the second complex-valued measurement signal.
- the analysis module is configured to determine a complex-valued average signal, wherein the complex-valued average signal corresponds to a combined average of the first complex-valued measurement signal and of a complex conjugate of the second complex-valued measurement signal.
- the analysis module is configured to determine a combined error quantity based on the complex-valued average signal.
- the analysis module is configured to determine a comparison quantity based on the combined error quantity as well as based on the first error quantity and/or the second error quantity, wherein the comparison quantity is indicative of a relative magnitude of the combined error quantity compared to the first error quantity and/or the second error quantity.
- the first complex-valued measurement signal and the second complex-valued measurement signal both are associated with the same input signal received from a device under test.
- error quantity is understood to denote a parameter that is indicative of a deviation of the respective signal value from the corresponding ideal value, e.g. the one under ideal conditions which may also relate to a theoretical value neglecting noise.
- error quantity may denote an error vector describing the deviation of the amplitude and phase of the respective signal from the ideal amplitude and the ideal phase, respectively.
- the error quantity may denote a root mean square of several error vectors associated with the respective signal.
- error quantities may be any other suitable error measure.
- the signal processing module is based on the idea to determine a corresponding error quantity for the complex-valued average signal on one hand, and for the first complex-valued measurement signal and/or the second complex-values measurement signal on the other hand.
- Both the first complex-valued measurement signal and the second complex-valued measurement signal comprise noise, namely phase noise and amplitude noise, originating from the device under test, such that these portions of the complex-valued measurement signals are correlated with each other and do not cancel out when performing the combined average.
- noise originating in the parallel measurement channels processing the input signal in parallel is not correlated with each other and at least partially cancels out when performing the combined average.
- the amount of noise contributed by the measurement channels can be assessed in relation to the amount of noise contributed by the device under test.
- the processing module provides an easy to understand measure for whether the noise in the (processed) input signal is dominated by a noise contribution of the device under test or by noise originating in the measurement channels, namely the comparison quantity.
- a user can conveniently assess whether a measured parameter, for example a measured error vector magnitude, is trustworthy, or in other words what the measurement uncertainty on the measured parameter is.
- a measured parameter for example a measured error vector magnitude
- the analysis module may be configured to determine the comparison quantity by comparing the combined error quantity with the first error quantity and/or with the second error quantity.
- the comparison quantity is indicative of whether the combined error quantity differs from the first error quantity and/or the second error quantity by more or less than at least one predefined threshold value.
- the combined error quantity is smaller than the first error quantity and the second error quantity, as noise originating in the parallel measurement channels cancels at least partially. Thus, if the noise contribution is dominated by the measurement channels, the combined error quantity will be significantly smaller than the first error quantity and/or the second error quantity.
- the measurement channels contribute a significant or even dominant amount of noise such that a measured parameter, for example an EVM, is not the (correct) corresponding parameter of the device under test and is wrong.
- the combined error quantity differs from the first error quantity and/or the second error quantity by less than the at least one predefined threshold value, it may be concluded that the noise is dominated by the noise contribution of the device under test and the result is true.
- the at least one predefined threshold value may be between 0.2 dB and 5 dB, particularly between 0.5 dB and 3 dB, for example between 1 dB and 2 dB.
- a plurality of threshold values may be provided. Accordingly, the comparison quantity may be indicative of whether the combined error quantity differs from the first error quantity and/or the second error quantity by more or less than one or several of the plurality of threshold values.
- the plurality of threshold values may be associated with different categories of the relative magnitude of the combined error quantity compared to the first error quantity and/or the second error quantity.
- the categories may, for example, be "dominated by measurement channel noise”, “similar magnitude of measurement channel noise and DUT noise”, and "dominated by DUT noise”.
- the comparison quantity is value-discrete.
- the comparison quantity may be binary, i.e. the comparison quantity may have one of two possible values.
- the comparison quantity may have more than two possible discrete values, e.g. three, four or five possible discrete values.
- the value of the comparison quantity may be determined based on the at least one predefined threshold value.
- the comparison quantity has a first value if the combined error quantity differs from the first error quantity and/or the second error quantity by more than the at least one predefined threshold value.
- the comparison quantity has a second value if the combined error quantity differs from the first error quantity and/or the second error quantity by less than the at least one predefined threshold value.
- the first error quantity and/or the second error quantity are/is associated with an error vector magnitude.
- the first error quantity and/or the second error quantity are a measure for the deviation of the amplitude and phase of the respective signal from the ideal amplitude and the ideal phase, respectively.
- the first complex-valued measurement signal and/or the second complex-valued measurement signal may be established as an IQ signal, respectively.
- the first error quantity and/or the second error quantity may be a measure for the deviation of the respective complex-valued measurement signal from the corresponding ideal constellation points.
- the signal processing module further comprises a visualization sub-module, wherein the visualization sub-module is configured to generate visualization data associated with the comparison quantity.
- the visualization data may be displayed, particularly on a display of a measurement instrument.
- the comparison quantity may be displayed in an illustrative way, such that a user can easily understand whether the noise in the (processed) input signal is dominated by a noise contribution of the device under test or by noise originating in the measurement channels.
- the visualization data comprises a color, a text message and/or a symbol indicating the value of the comparison quantity. Accordingly, different colors, text messages and/or symbols may be displayed depending on the value of the comparison quantity. Thus, it is particularly easy to understand for a user whether the noise in the (processed) input signal is dominated by a noise contribution of the device under test or by noise originating in the measurement channels.
- a box and/or labels having a first color may be displayed if the value of the comparison quantity indicates that the noise in the (processed) input signal is dominated by a noise contribution of the device under test.
- a box and/or labels having a second color e.g. red, may be displayed if the value of the comparison quantity indicates that the noise in the (processed) input signal is dominated by a noise contribution of the measurement channels.
- a displayed measurement graph i.e. a measurement trace
- a measurement trace may be colored differently depending on the value of the comparison quantity.
- the measurement graph may have a first color, e.g. green, if the value of the comparison quantity indicates that the noise in the (processed) input signal is dominated by a noise contribution of the device under test.
- the measurement graph may have a second color, e.g. red, if the value of the comparison quantity indicates that the noise in the (processed) input signal is dominated by a noise contribution of the measurement channels.
- a warning symbol may be displayed if the value of the comparison quantity indicates that the noise in the (processed) input signal is dominated by a noise contribution of the measurement channels.
- the visualization data may comprise the first error quantity, the second error quantity, and/or the combined error quantity.
- the first error quantity, the second error quantity, and/or the combined error quantity may be displayed together with the visualization of the value of the comparison quantity.
- all information relevant for the user for assessing the individual noise contributions is displayed simultaneously.
- the visualization data comprises values of the first error quantity, values of the second error quantity, and/or values of the combined error quantity over time.
- the value of the first error quantity, the value of the second error quantity, and/or the value of the combined error quantity may be displayed together over time.
- values of the first error quantity and values of the second error quantity obtained at the same time are averaged.
- values of the first error quantity and values of the second error quantity that are associated with the same sample of the input signal may be averaged, thereby obtaining a plurality of one-sample averages of the first error quantity and the second error quantity.
- the plurality of one-sample averages of the first error quantity and the second error quantity may be averaged over a predetermined number of samples, thereby obtaining a general error quantity.
- the analysis module may be configured to determine the comparison quantity based on the combined error quantity and based on the general error quantity.
- the visualization data comprises values of the first error quantity, values of the second error quantity, and/or values of the combined error quantity over frequency.
- the value of the first error quantity, the value of the second error quantity, and/or the value of the combined error quantity may be displayed together over frequency.
- values of the first error quantity and values of the second error quantity obtained at the same frequency are averaged.
- values of the first error quantity and values of the second error quantity that are associated with the same frequency of the input signal may be averaged, thereby obtaining a plurality of one-sample averages of the first error quantity and the second error quantity.
- the plurality of one-sample averages of the first error quantity and the second error quantity may be averaged over a predetermined number of frequency bins, thereby obtaining a general error quantity.
- the analysis module may be configured to determine the comparison quantity based on the combined error quantity and based on the general error quantity.
- the analysis module is configured to average the first error quantity over a predetermined number of samples, thereby obtaining a first averaged error quantity.
- the analysis module is configured to average the second error quantity over a predetermined number of samples, thereby obtaining a second averaged error quantity.
- the analysis module is configured to determine the comparison quantity based on the combined error quantity and based on the first averaged error quantity and/or the second averaged error quantity. By averaging the first error quantity and/or the second error quantity, a more reliable comparison quantity can be determined, as fluctuations average out at least partially.
- the analysis module is configured to average the first error quantity and the second error quantity over a predetermined number of samples, thereby obtaining a general error quantity, wherein the analysis module is configured to determine the comparison quantity based on the combined error quantity and based on the general error quantity.
- the error quantities associated with the measurement channels are merged into a single error quantity, namely the general error quantity.
- a further aspect of the present invention provides that the complex-valued average signal corresponds to a combined average of the first complex-valued measurement signal and of the complex conjugate of the second complex-valued measurement signal averaged over a predetermined number of samples.
- the resulting complex-valued average signal comprises significantly reduced noise from sources other than the device under test.
- both the first complex-valued measurement signal and the second complex-valued measurement signal comprise noise originating from the device under test, such that these portions of the complex-valued measurement signals are correlated with each other and do not cancel out when performing the combined average.
- noise originating from other sources e.g. from measurement channels processing the input signal in parallel, is not correlated with each other and at least partially cancels out when performing the combined average.
- a measured parameter for example an EVM
- the "correct" parameter namely the corresponding parameter of the DUT at the input of the measurement instrument.
- the predetermined number of samples is adjustable.
- increasing the predetermined number of samples leads to an enhanced noise suppression, as the non-correlated portions of the noise, i.e. the unwanted noise portions, are suppressed more the larger the number of the predetermined samples is.
- the analysis module can be adapted for different requirements, ranging from high resolution to high noise suppression.
- the complex-valued average signal corresponds to a cross-correlation between the first complex-valued measurement signal and the second complex-valued measurement signal averaged over the predetermined number of samples. This is due to the fact that a multiplication of the complex-valued measurement signals in frequency domain corresponds to a convolution of the complex-valued measurement signals in time domain.
- the complex-valued average signal may correspond to the trace of the cross-correlation matrix of the first complex-valued measurement signal and the second complex-valued measurement signal, divided by the predetermined number of samples.
- the combined average may, colloquially, also be called a "cross correlation" of the complex-valued measurement signals.
- the problem further is solved by a measurement instrument, comprising a signal processing module described above.
- the measurement instrument may be established as a signal analyzer, particularly as a vector signal analyzer.
- the measurement instrument may be established as any other suitable measurement instrument, e.g. as a spectrum analyzer, as an electromagnetic interference (EMI) test receiver, as an EMI measuring receiver, as an oscilloscope, as a digital oscilloscope, or as a power sensor
- EMI electromagnetic interference
- the measurement instrument may be established as any other suitable measurement instrument, e.g. as a spectrum analyzer, as an electromagnetic interference (EMI) test receiver, as an EMI measuring receiver, as an oscilloscope, as a digital oscilloscope, or as a power sensor
- the phrase "at least one of A, B, and C", for example, means (A), (B), (C), (A and B), (A and C), (B and C), or (A, B, and C), including all further possible permutations when more than three elements are listed.
- the term “at least one of A and B” generally means “A and/or B", namely "A” alone, “B” alone or "A and B”.
- Figure 1 schematically shows a measurement system 10 comprising a measurement instrument 12 and a device under test 14.
- the measurement instrument 12 is configured to analyze an input signal received from the device under test 14 in order to analyze certain properties of the device under test 14.
- the measurement instrument 12 may be a signal analyzer, a spectrum analyzer, an electromagnetic interference (EMI) test receiver, an EMI measuring receiver, an oscilloscope, a digital oscilloscope, or a power sensor.
- EMI electromagnetic interference
- the measurement instrument 12 may be a signal analyzer, a spectrum analyzer, an electromagnetic interference (EMI) test receiver, an EMI measuring receiver, an oscilloscope, a digital oscilloscope, or a power sensor.
- EMI electromagnetic interference
- the measurement instrument 12 may be established as any other type of measurement instrument, depending on which aspects of the performance of the device under test 14 are to be tested.
- the device under test 14 may be established as any electronic device that is configured to generate a radio-frequency (RF) signal.
- the device under test 14 comprises one or several electronic circuits generating an RF signal, wherein the performance of the electronic circuit(s) is assessed by means of the measurement instrument 12.
- the device under test 14 is connected with the measurement instrument 12 in a signal-transmitting manner.
- connection in a signal transmitting manner is understood to denote a cable-based or wireless connection that is configured to transmit signals between the respective devices or components.
- the device under test 14 is connected to a measurement input 16 of the measurement instrument 12 via a suitable cable and suitable connectors, such that an electric signal output by the device under test 14 is transmitted from the device under test 14 to the measurement instrument via the cable.
- the device under test 14 may transmit a wireless electromagnetic signal, which is received via an RF antenna connected to the measurement input 16.
- a measurement probe may be connected to the measurement input 16, wherein the measurement probe is configured to pick up an electric signal from the device under test 14 by contacting corresponding contact points of the device under test 14.
- the measurement instrument 12 comprises a signal processing module 18 having an RF frontend 20, a digital backend 22, and an analysis module 24.
- module and “unit” are understood to describe suitable hardware, suitable software, or a combination of hardware and software that is configured to have a certain functionality.
- the hardware may, inter alia, comprise a CPU, a GPU, an FPGA, an ASIC, or other types of electronic circuitry.
- the measurement instrument 12 comprises a first measurement channel 26 and a second measurement channel 28 that are each connected to the measurement input 16.
- the measurement instrument 12 may comprise more than two measurement channels, for example four, six, eight, or more measurement channels.
- the case of the measurement instrument 12 comprising two measurement channels, namely the first measurement channel 26 and the second measurement channel 28 is described in the following.
- the measurement channels 26, 28 are arranged in parallel, such that an input signal received from the device under test 14 via the measurement input 16 is forwarded to and processed by both measurement channels 26, 28 in parallel.
- the measurement channels 26, 28 are functionally identical, i.e. the electronic components of the first measurement channel 26 are identical in construction to the electronic components of the second measurement channel 28.
- the first measurement channel 26 comprises a first mixer sub-module 30 that is associated with the RF frontend 20 of the measurement instrument 12.
- the first mixer sub-module 30 is configured to down-convert the input signal received from the device under test 14 to an intermediate frequency being suitable for processing by the electronic components downstream of the first mixer sub-module 30.
- the first mixer sub-module 30 comprises a local oscillator input 32 that is configured to receive a local oscillator signal.
- the first mixer sub-module 30 further comprises a mixer unit 34 that is configured to mix the input signal received from the device under test 14 with the local oscillator signal, and a band-pass filter 36 that is configured to appropriately filter the resulting mixed signal in order to down-convert the input signal to the intermediate frequency.
- the frequency of the local oscillator signal may be constant.
- the frequency of the local oscillator signal may be time-variant, i.e. a frequency sweep may be applied to the local oscillator signal.
- the first measurement channel 26 further comprises an analog-to-digital converter (ADC) 38 that is configured to digitize the signal output by the first mixer sub-module 30.
- ADC analog-to-digital converter
- the first measurement channel 26 further comprises a digital IQ mixer 40 that is associated with the digital backend 22 of the measurement instrument 12.
- the digital IQ mixer 40 is configured to generate an IQ signal based on the digitized signal received from the ADC 38 by means of any suitable technique known in the art.
- the digital IQ mixer 40 may be established as one or several field-programmable gate arrays (FPGAs) that is/are configured to generate an IQ signal based on the digitized signal received from the ADC 38.
- FPGAs field-programmable gate arrays
- the digital IQ mixer 40 may be established as any other suitable electronic component or group of electronic components being configured to generate the IQ signal based on the digitized signal received from the ADC 38.
- an IQ signal may be represented as a two-dimensional real vector having two components, namely the in-phase component and the quadrature component.
- the IQ signal may be represented as a complex number, wherein the in-phase component may correspond to the real part of the complex number, and the quadrature component may correspond to the imaginary part of the complex number.
- an input signal received from the device under test 14 is processed by the electronic components of the first measurement channel 26 described above, thereby generating a first complex-valued measurement signal.
- the input signal received from the device under test 14 is processed by the electronic components of the second measurement channel 28, thereby generating a second complex-valued measurement signal.
- the two parallel measurement channels 26, 28 may be synchronized. In other words, the same portions of the input signal are processed by the two parallel measurement channels 26, 28 simultaneously.
- the first complex-valued measurement signal is forwarded to a first signal input 42 of the analysis module 24.
- the first complex-valued measurement signal is saved in a measurement memory 44 of the measurement instrument 12.
- the second complex-valued measurement signal is forwarded to a second signal input 46 of the analysis module 24.
- the second complex-valued measurement signal is saved in the measurement memory 44.
- the analysis module 24 is configured to apply mathematical operations to the complex-valued measurement signals in order to transform the complex-valued measurement signals into an output signal, e.g. into a measurement trace to be displayed on a display 48.
- the display 48 may be integrated into the measurement instrument 12.
- the display 48 may be an external display that is connected to the measurement instrument 12.
- the input signal may be received from the device under test 14 and processed by the signal processing module 18, particularly by the analysis module 24 in real time.
- the input signal may be received from the device under test 14, processed by the measurement channels 26, 28 as described above, and the complex-valued measurement signals may be saved in the measurement memory 44.
- the saved complex-valued measurement signals may later be forwarded to the signal inputs 42, 46 for further processing by the analysis module 24.
- the type of the mathematical operations applied to the measurement signals depends on a analysis mode of the analysis module 24.
- the analysis module 24 may be switchable between different analysis modes, wherein the analysis modes comprise a cross correlation mode (also called "x-corr"), a sample mode, a minimum mode, a maximum mode, an auto peak mode, an average mode, a root mean square mode, and/or an error vector magnitude (EVM) mode.
- a cross correlation mode also called "x-corr”
- EVM error vector magnitude
- At least one of the complex-valued measurement signals may be converted into a real-valued measurement signal before processing by the analysis module 24.
- At least one conversion unit may be arranged upstream of the first signal input 42 and/or upstream of the second signal input 46, wherein the at least one conversion unit is configured to convert the first complex-valued measurement signal and/or the second complex-valued measurement signal into a real-valued measurement signal.
- the analysis module 24 may comprise the conversion unit.
- only one of the complex-valued measurement signals may be converted into a real-valued measurement signal and processed by the analysis module 24.
- a user may select one or several analysis modes to be applied to the complex-valued measurement signals via a user interface 50 of the measurement instrument 12.
- FIG 2 shows an exemplary embodiment of the user interface 50. As is illustrated in Figure 2 , the user may select the one or several analysis modes ("Trace 1" to "Trace 6" in Figure 2 )) from a drop-down menu 52.
- the user may adjust other operational parameters of the analysis module 24, of the signal processing module 18, and/or of the measurement instrument 12 by means of the user interface 50.
- Figure 3 shows a table of the mathematical operations.
- y det denotes the measurement trace
- x(k) denotes the k-th sample of the respective measurement signal(s).
- N denotes a predetermined number of samples over which the real-valued measurement signal is averaged in the average mode, and in the root mean square mode.
- N denotes a predetermined number of samples over which the complex-valued measurement signals x 1 ( k ) and x 2 ⁇ k are averaged in the cross correlation mode.
- the EVM mode corresponds to the root mean square mode applied to the respective complex-valued measurement signal, but with the individual values of the samples or rather symbols x(k) replaced by x(k) - x id ( k ), wherein x id ( k ) denotes the corresponding ideal value of the respective symbol.
- Figure 4 shows a measured IQ vector x(k), an ideal constellation point x id ( k ), and the corresponding error vector x(k) - x id ( k ).
- Measurements performed by the measurement instrument 12 are typically influenced by a noise contribution of the device under test 14 and by noise generated in the measurement channels 26.
- the measurement instrument 12 has an intrinsic noise level that is of the same magnitude or even higher than the noise level of the device under test 14, certain parameters of the device under test 14 cannot be reliably measured.
- the EVM determined and displayed as described above may not be reliable.
- the measurement instrument 12 is configured to visually indicate whether the measurements performed are trustworthy, as will be described in more detail hereinafter with reference to Figure 1 .
- the analysis module 24 comprises a processing sub-module 54 and a visualization sub-module 56.
- the processing sub-module 54 is configured to determine a first error quantity associated with the first complex-valued measurement signal.
- error quantity is understood to denote a parameter that is indicative of a deviation of the respective signal value from the ideal value.
- error quantity may denote an error vector describing the deviation of the amplitude and phase of the respective signal from the ideal amplitude and the ideal phase, respectively.
- the error quantity may denote a root mean square of several error vectors associated with the respective signal.
- the error quantity may be an error vector magnitude, such that the error quantity describes a deviation of the constellation points of the respective IQ signal from the corresponding ideal constellation points.
- error quantities may be any other suitable error measure.
- the first error quantity may be averaged over a predetermined number of samples, thereby obtaining a first averaged error quantity.
- the processing sub-module 54 is configured to determine a second error quantity associated with the second complex-valued measurement signal.
- the second error quantity may be averaged over a predetermined number of samples, thereby obtaining a second averaged error quantity.
- the analysis module 24 may be configured to average the first error quantity and the second error quantity over a predetermined number of samples, thereby obtaining a general error quantity.
- the error quantities associated with the first measurement channel 26 and with the second measurement channel 28 may be merged into a single error quantity, namely the general error quantity, by averaging over both the first error quantity and the second error quantity over the predetermined number of samples.
- values of the first error quantity and values of the second error quantity obtained at the same time are averaged.
- values of the first error quantity and values of the second error quantity that are associated with the same sample of the input signal may be averaged, thereby obtaining a plurality of one-sample averages of the first error quantity and the second error quantity.
- the plurality of one-sample averages of the first error quantity and the second error quantity may be averaged over a predetermined number of samples, thereby obtaining the general error quantity.
- values of the first error quantity and values of the second error quantity obtained at the same frequency are averaged.
- values of the first error quantity and values of the second error quantity that are associated with the same frequency of the input signal may be averaged, thereby obtaining a plurality of one-sample averages of the first error quantity and the second error quantity.
- the plurality of one-sample averages of the first error quantity and the second error quantity may be averaged over a predetermined number of frequency bins, thereby obtaining the general error quantity.
- the processing sub-module 54 further is configured to determine a complex-valued average signal, wherein the complex-valued average signal corresponds to a combined average of the first complex-valued measurement signal and of a complex conjugate of the second complex-valued measurement signal.
- the processing sub-module 54 may further be configured average the complex-valued multiplication signal over a predetermined number of samples N, thereby obtaining the complex-valued average signal.
- the processing sub-module 54 may further be configured to determine the absolute value of the complex-valued average signal or the real part of the complex-valued average signal.
- noise originating in the measurement channels 26, 28 cancels at least partially, while the wanted signal (including noise) from the device under test 14 are preserved.
- the first term i.e. 1/N ⁇
- the further terms correspond to multiplications of uncorrelated signals, and thus cancel at least partially. More precisely, the further terms correspond to noise originating in the measurement channels 26, 28.
- the predetermined number of samples N may be adjustable, e.g. via the user interface 50.
- the predetermined number of samples may be the same for the first error quantity, for the second error quantity, and for the complex-valued average signal.
- the predetermined number of samples may be 10, 100, 1000, or 5000. However, the predetermined number of samples may have any other suitable value.
- the analysis module 24 or rather the processing sub-module 54 further is configured to determine a combined error quantity based on the complex-valued average signal.
- the combined error quantity may be the absolute value of the complex-valued average signal or the real part of the complex-valued average signal described above.
- the analysis module 24 or rather the processing sub-module 54 further is configured to determine a comparison quantity based on the combined error quantity, as well as based on the first error quantity, the first averaged error quantity, the second error quantity, the second averaged error quantity, and/or the general error quantity.
- the first error quantity, the first averaged error quantity, the second error quantity, the second averaged error quantity, and/or the general error quantity will be collectively denoted as "channel error quantity" in the following.
- the comparison quantity is indicative of a relative magnitude of the combined error quantity compared to the channel error quantity.
- the comparison quantity may be value-discrete.
- the comparison quantity may have a first value if the combined error quantity differs from the channel error quantity by more than the at least one predefined threshold value.
- the measurement channels 26, 28 contribute a significant or even dominant amount of noise.
- the comparison quantity may have a second value if the combined error quantity differs from the channel error quantity by less than the at least one predefined threshold value.
- the measurement channels 26, 28 contribute a small or even negligible amount of noise.
- the value of the at least one predefined threshold value may be between 0.2 dB and 5 dB, particularly between 0.5 dB and 3 dB, for example between 1 dB and 2 dB.
- the comparison quantity may be indicative of whether the combined error quantity differs from the channel error quantity by more or less than one or several of the plurality of threshold values.
- the plurality of threshold values may be associated with different categories of the relative magnitude of the combined error quantity compared to the channel error quantity.
- the categories may, for example, be "dominated by measurement channel noise”, “similar magnitude of measurement channel noise and DUT noise”, and “dominated by DUT noise”.
- the visualization sub-module 56 is configured to generate visualization data associated with the determined comparison quantity, wherein the visualization data is displayed on the display 48.
- the visualization data may comprise a color, a text message and/or a symbol indicating the value of the comparison quantity.
- the visualization data comprises a colored box 58 having a first color, e.g. green, which is displayed if the value of the comparison quantity indicates that the noise in the (processed) input signal is dominated by a noise contribution of the device under test 14.
- the visualization data comprises the colored box 58 having a second color, e.g. red, which is displayed if the value of the comparison quantity indicates that the noise in the (processed) input signal is dominated by the measurement channels 26, 28.
- a warning sign 60 may be displayed, which warns a user that the noise in the (processed) input signal is dominated by the measurement channels 26, 28.
- the visualization data may further comprise a text field 62 indicating the value of the combined error quantity.
- the text field 62 may be colored differently depending on the value of the comparison quantity.
- the displayed measurement trace y det may be colored differently depending on the value of the comparison quantity.
- the visualization data may further comprise a text field 62 indicating the value of the channel error quantity.
- circuitry e.g., one or more circuits
- circuitry operably couple two or more components, generate information, process information, analyze information, generate signals, encode/decode signals, convert signals, transmit and/or receive signals, control other devices, etc.
- Circuitry of any type can be used.
- circuitry includes, among other things, one or more computing devices such as a processor (e.g., a microprocessor), a central processing unit (CPU), a digital signal processor (DSP), an application-specific integrated circuit (ASIC), a field-programmable gate array (FPGA), a system on a chip (SoC), or the like, or any combinations thereof, and can include discrete digital or analog circuit elements or electronics, or combinations thereof.
- a processor e.g., a microprocessor
- CPU central processing unit
- DSP digital signal processor
- ASIC application-specific integrated circuit
- FPGA field-programmable gate array
- SoC system on a chip
- circuitry includes hardware circuit implementations (e.g., implementations in analog circuitry, implementations in digital circuitry, and the like, and combinations thereof).
- circuitry includes combinations of circuits and computer program products having software or firmware instructions stored on one or more computer readable memories that work together to cause a device to perform one or more protocols, methodologies or technologies described herein.
- circuitry includes circuits, such as, for example, microprocessors or portions of microprocessor, that require software, firmware, and the like for operation.
- circuitry includes one or more processors or portions thereof and accompanying software, firmware, hardware, and the like.
- the present application may reference quantities and numbers. Unless specifically stated, such quantities and numbers are not to be considered restrictive, but exemplary of the possible quantities or numbers associated with the present application. Also in this regard, the present application may use the term “plurality” to reference a quantity or number. In this regard, the term “plurality” is meant to be any number that is more than one, for example, two, three, four, five, etc. The terms “about”, “approximately”, “near” etc., mean plus or minus 5% of the stated value.
Landscapes
- Physics & Mathematics (AREA)
- General Physics & Mathematics (AREA)
- Engineering & Computer Science (AREA)
- General Engineering & Computer Science (AREA)
- Power Engineering (AREA)
- Digital Transmission Methods That Use Modulated Carrier Waves (AREA)
- Measurement Of Mechanical Vibrations Or Ultrasonic Waves (AREA)
Abstract
Description
- The invention generally relates to a signal processing module for a measurement instrument. The invention further relates to a measurement instrument.
- In order to analyze the modulation quality of a device under test (DUT), measurement instruments usually determine error measures associated with an output signal of the DUT, for example an error vector magnitude (EVM). Beside other effects, the analysis of these error measures is limited by the signal-to-noise-ratio (S/N ratio) of the signal to be measured.
- However, the measurement instrument cannot distinguish between noise that originates from the device under test (DUT) and noise added by the measurement instrument itself.
- Accordingly, if the measurement instrument has an intrinsic noise level that is of the same magnitude or even higher than the noise level of the device under test, certain parameters like the EVM cannot be reliably measured.
- For a user of a measurement instrument, it is hard to tell whether the noise in a measured signal is dominated by a noise contribution of the device under test or by noise originating from the measurement instrument.
- Thus, the object of the present invention is to provide a signal processing module as well as a measurement instrument that provide additional information about the dominating origin of the noise.
- According to the invention, the problem is solved by a signal processing module for a measurement instrument. The signal processing module comprises an analysis module, a measurement input, and at least two parallel measurement channels. The at least two parallel measurement channels are each connected to the measurement input, such that an input signal received via the measurement input is forwarded to the at least two parallel measurement channels. A first one of the two parallel measurement channels is configured to process the input signal, thereby generating a first complex-valued measurement signal. A second one of the two parallel measurement channels is configured to process the input signal, thereby generating a second complex-valued measurement signal. The analysis module is configured to determine a first error quantity associated with the first complex-valued measurement signal. The analysis module is configured to determine a second error quantity associated with the second complex-valued measurement signal. The analysis module is configured to determine a complex-valued average signal, wherein the complex-valued average signal corresponds to a combined average of the first complex-valued measurement signal and of a complex conjugate of the second complex-valued measurement signal. The analysis module is configured to determine a combined error quantity based on the complex-valued average signal. The analysis module is configured to determine a comparison quantity based on the combined error quantity as well as based on the first error quantity and/or the second error quantity, wherein the comparison quantity is indicative of a relative magnitude of the combined error quantity compared to the first error quantity and/or the second error quantity.
- Therein, the first complex-valued measurement signal and the second complex-valued measurement signal both are associated with the same input signal received from a device under test.
- In the context of the present disclosure, the term "error quantity" is understood to denote a parameter that is indicative of a deviation of the respective signal value from the corresponding ideal value, e.g. the one under ideal conditions which may also relate to a theoretical value neglecting noise.
- For example, the term "error quantity" may denote an error vector describing the deviation of the amplitude and phase of the respective signal from the ideal amplitude and the ideal phase, respectively.
- As another example, the error quantity may denote a root mean square of several error vectors associated with the respective signal.
- However, it is to be understood that the error quantities may be any other suitable error measure.
- The signal processing module according to the present invention is based on the idea to determine a corresponding error quantity for the complex-valued average signal on one hand, and for the first complex-valued measurement signal and/or the second complex-values measurement signal on the other hand.
- Both the first complex-valued measurement signal and the second complex-valued measurement signal comprise noise, namely phase noise and amplitude noise, originating from the device under test, such that these portions of the complex-valued measurement signals are correlated with each other and do not cancel out when performing the combined average.
- On the other hand, noise originating in the parallel measurement channels processing the input signal in parallel is not correlated with each other and at least partially cancels out when performing the combined average.
- Thus, by comparing the combined error quantity with the first error quantity and/or with the second error quantity, the amount of noise contributed by the measurement channels can be assessed in relation to the amount of noise contributed by the device under test.
- Thus, the processing module according to the present invention provides an easy to understand measure for whether the noise in the (processed) input signal is dominated by a noise contribution of the device under test or by noise originating in the measurement channels, namely the comparison quantity.
- Accordingly, a user can conveniently assess whether a measured parameter, for example a measured error vector magnitude, is trustworthy, or in other words what the measurement uncertainty on the measured parameter is.
- Particularly, the analysis module may be configured to determine the comparison quantity by comparing the combined error quantity with the first error quantity and/or with the second error quantity.
- According to an aspect of the present invention, the comparison quantity is indicative of whether the combined error quantity differs from the first error quantity and/or the second error quantity by more or less than at least one predefined threshold value. In general, the combined error quantity is smaller than the first error quantity and the second error quantity, as noise originating in the parallel measurement channels cancels at least partially. Thus, if the noise contribution is dominated by the measurement channels, the combined error quantity will be significantly smaller than the first error quantity and/or the second error quantity.
- Accordingly, if the combined error quantity differs from the first error quantity and/or the second error quantity by more than the at least one predefined threshold value, it may be concluded that the measurement channels contribute a significant or even dominant amount of noise such that a measured parameter, for example an EVM, is not the (correct) corresponding parameter of the device under test and is wrong.
- On the other hand, if the combined error quantity differs from the first error quantity and/or the second error quantity by less than the at least one predefined threshold value, it may be concluded that the noise is dominated by the noise contribution of the device under test and the result is true.
- For example, the at least one predefined threshold value may be between 0.2 dB and 5 dB, particularly between 0.5 dB and 3 dB, for example between 1 dB and 2 dB.
- Particularly, a plurality of threshold values may be provided. Accordingly, the comparison quantity may be indicative of whether the combined error quantity differs from the first error quantity and/or the second error quantity by more or less than one or several of the plurality of threshold values.
- The plurality of threshold values may be associated with different categories of the relative magnitude of the combined error quantity compared to the first error quantity and/or the second error quantity. The categories may, for example, be "dominated by measurement channel noise", "similar magnitude of measurement channel noise and DUT noise", and "dominated by DUT noise".
- In an embodiment of the present invention, the comparison quantity is value-discrete. Particularly, the comparison quantity may be binary, i.e. the comparison quantity may have one of two possible values. However, the comparison quantity may have more than two possible discrete values, e.g. three, four or five possible discrete values.
- The value of the comparison quantity may be determined based on the at least one predefined threshold value.
- Particularly, the comparison quantity has a first value if the combined error quantity differs from the first error quantity and/or the second error quantity by more than the at least one predefined threshold value. The comparison quantity has a second value if the combined error quantity differs from the first error quantity and/or the second error quantity by less than the at least one predefined threshold value. Thus, the comparison quantity is an easy to understand measure for whether the noise in the (processed) input signal is dominated by a noise contribution of the device under test or by noise originating in the measurement channels.
- According to another aspect of the present invention, the first error quantity and/or the second error quantity are/is associated with an error vector magnitude. In other words, the first error quantity and/or the second error quantity are a measure for the deviation of the amplitude and phase of the respective signal from the ideal amplitude and the ideal phase, respectively.
- For example, the first complex-valued measurement signal and/or the second complex-valued measurement signal may be established as an IQ signal, respectively.
- Accordingly, the first error quantity and/or the second error quantity may be a measure for the deviation of the respective complex-valued measurement signal from the corresponding ideal constellation points.
- In an embodiment of the present invention, the signal processing module further comprises a visualization sub-module, wherein the visualization sub-module is configured to generate visualization data associated with the comparison quantity. The visualization data may be displayed, particularly on a display of a measurement instrument. Thus, the comparison quantity may be displayed in an illustrative way, such that a user can easily understand whether the noise in the (processed) input signal is dominated by a noise contribution of the device under test or by noise originating in the measurement channels.
- Particularly, the visualization data comprises a color, a text message and/or a symbol indicating the value of the comparison quantity. Accordingly, different colors, text messages and/or symbols may be displayed depending on the value of the comparison quantity. Thus, it is particularly easy to understand for a user whether the noise in the (processed) input signal is dominated by a noise contribution of the device under test or by noise originating in the measurement channels.
- For example, a box and/or labels having a first color, e.g. green, may be displayed if the value of the comparison quantity indicates that the noise in the (processed) input signal is dominated by a noise contribution of the device under test. A box and/or labels having a second color, e.g. red, may be displayed if the value of the comparison quantity indicates that the noise in the (processed) input signal is dominated by a noise contribution of the measurement channels.
- Alternatively or additionally, a displayed measurement graph (i.e. a measurement trace) may be colored differently depending on the value of the comparison quantity.
- For example, the measurement graph may have a first color, e.g. green, if the value of the comparison quantity indicates that the noise in the (processed) input signal is dominated by a noise contribution of the device under test. The measurement graph may have a second color, e.g. red, if the value of the comparison quantity indicates that the noise in the (processed) input signal is dominated by a noise contribution of the measurement channels.
- Alternatively or additionally, a warning symbol may be displayed if the value of the comparison quantity indicates that the noise in the (processed) input signal is dominated by a noise contribution of the measurement channels.
- The visualization data may comprise the first error quantity, the second error quantity, and/or the combined error quantity. Thus, the first error quantity, the second error quantity, and/or the combined error quantity may be displayed together with the visualization of the value of the comparison quantity. Thus, all information relevant for the user for assessing the individual noise contributions is displayed simultaneously.
- According to an aspect of the present invention, the visualization data comprises values of the first error quantity, values of the second error quantity, and/or values of the combined error quantity over time. In other words, the value of the first error quantity, the value of the second error quantity, and/or the value of the combined error quantity may be displayed together over time. Thus, all information relevant for the user for assessing the individual noise contributions is displayed simultaneously in a detailed way over time.
- Particularly, values of the first error quantity and values of the second error quantity obtained at the same time are averaged. In other words, values of the first error quantity and values of the second error quantity that are associated with the same sample of the input signal may be averaged, thereby obtaining a plurality of one-sample averages of the first error quantity and the second error quantity.
- The plurality of one-sample averages of the first error quantity and the second error quantity may be averaged over a predetermined number of samples, thereby obtaining a general error quantity. The analysis module may be configured to determine the comparison quantity based on the combined error quantity and based on the general error quantity.
- Therein, the explanations regarding the comparison quantity given above likewise apply, but with the first error quantity and the second error quantity replaced by the general error quantity.
- According to a further aspect of the present invention, the visualization data comprises values of the first error quantity, values of the second error quantity, and/or values of the combined error quantity over frequency. In other words, the value of the first error quantity, the value of the second error quantity, and/or the value of the combined error quantity may be displayed together over frequency. Thus, all information relevant for the user for assessing the individual noise contributions is displayed simultaneously in a detailed way over frequency.
- Particularly, values of the first error quantity and values of the second error quantity obtained at the same frequency are averaged. In other words, values of the first error quantity and values of the second error quantity that are associated with the same frequency of the input signal may be averaged, thereby obtaining a plurality of one-sample averages of the first error quantity and the second error quantity.
- The plurality of one-sample averages of the first error quantity and the second error quantity may be averaged over a predetermined number of frequency bins, thereby obtaining a general error quantity. The analysis module may be configured to determine the comparison quantity based on the combined error quantity and based on the general error quantity.
- Therein, the explanations regarding the comparison quantity given above likewise apply, but with the first error quantity and the second error quantity replaced by the general error quantity.
- In an embodiment of the present invention, the analysis module is configured to average the first error quantity over a predetermined number of samples, thereby obtaining a first averaged error quantity. Alternatively or additionally, the analysis module is configured to average the second error quantity over a predetermined number of samples, thereby obtaining a second averaged error quantity. The analysis module is configured to determine the comparison quantity based on the combined error quantity and based on the first averaged error quantity and/or the second averaged error quantity. By averaging the first error quantity and/or the second error quantity, a more reliable comparison quantity can be determined, as fluctuations average out at least partially.
- Therein, the explanations regarding the comparison quantity given above likewise apply, but with the first error quantity and the second error quantity replaced by the first averaged error quantity and/or the second averaged error quantity, respectively.
- In a further embodiment of the present invention, the analysis module is configured to average the first error quantity and the second error quantity over a predetermined number of samples, thereby obtaining a general error quantity, wherein the analysis module is configured to determine the comparison quantity based on the combined error quantity and based on the general error quantity. In other words, the error quantities associated with the measurement channels are merged into a single error quantity, namely the general error quantity.
- By averaging the first error quantity and the second error quantity over the predetermined number of samples, a more reliable comparison quantity can be determined, as fluctuations average out at least partially.
- The explanations regarding the comparison quantity given above likewise apply, but with the first error quantity and the second error quantity replaced by the general error quantity.
- A further aspect of the present invention provides that the complex-valued average signal corresponds to a combined average of the first complex-valued measurement signal and of the complex conjugate of the second complex-valued measurement signal averaged over a predetermined number of samples. By performing this type of combined averaging, the resulting complex-valued average signal comprises significantly reduced noise from sources other than the device under test.
- This is due to the fact that both the first complex-valued measurement signal and the second complex-valued measurement signal comprise noise originating from the device under test, such that these portions of the complex-valued measurement signals are correlated with each other and do not cancel out when performing the combined average.
- On the other hand, noise originating from other sources, e.g. from measurement channels processing the input signal in parallel, is not correlated with each other and at least partially cancels out when performing the combined average.
- If the predetermined number of samples is large enough, essentially all noise contributions originating in the measurement channels cancel. Assuming that the measurement channels respectively represent the entire measurement path from an input of the measurement instrument to the analysis module, a measured parameter, for example an EVM, can be derived that corresponds to the "correct" parameter, namely the corresponding parameter of the DUT at the input of the measurement instrument.
- According to another aspect of the present invention, the predetermined number of samples is adjustable. In general, increasing the predetermined number of samples leads to an enhanced noise suppression, as the non-correlated portions of the noise, i.e. the unwanted noise portions, are suppressed more the larger the number of the predetermined samples is. As the predetermined number of samples is adjustable, the analysis module can be adapted for different requirements, ranging from high resolution to high noise suppression.
- It has turned out that the unwanted noise contributions are reduced approximately by 5 . log10(N) dB or by

- If the first complex-valued measurement signal and the second complex-valued measurement signal are in the frequency domain, the complex-valued average signal corresponds to a cross-correlation between the first complex-valued measurement signal and the second complex-valued measurement signal averaged over the predetermined number of samples. This is due to the fact that a multiplication of the complex-valued measurement signals in frequency domain corresponds to a convolution of the complex-valued measurement signals in time domain.
- In other words, the complex-valued average signal may correspond to the trace of the cross-correlation matrix of the first complex-valued measurement signal and the second complex-valued measurement signal, divided by the predetermined number of samples.
- Thus, the combined average may, colloquially, also be called a "cross correlation" of the complex-valued measurement signals.
- According to the invention, the problem further is solved by a measurement instrument, comprising a signal processing module described above.
- Regarding the advantages and further properties of the measurement instrument, reference is made to the explanations given above with respect to the signal processing module, which also hold for the measurement instrument and vice versa.
- The measurement instrument may be established as a signal analyzer, particularly as a vector signal analyzer.
- However, it is to be understood that the measurement instrument may be established as any other suitable measurement instrument, e.g. as a spectrum analyzer, as an electromagnetic interference (EMI) test receiver, as an EMI measuring receiver, as an oscilloscope, as a digital oscilloscope, or as a power sensor
- The foregoing aspects and many of the attendant advantages of the claimed subject matter will become more readily appreciated as the same become better understood by reference to the following detailed description, when taken in conjunction with the accompanying drawings, wherein:
-
Figure 1 schematically shows a measurement instrument according to the present invention; -
Figure 2 schematically shows a user interface of the measurement instrument ofFigure 1 ; -
Figure 3 shows a table illustrating mathematical operations performed by an analysis module of the measurement instrument ofFigure 1 ; -
Figure 4 shows a diagram illustrating the determination of an error vector magnitude; -
Figure 5 shows an exemplary visualization of measurement results obtained by the measurement instrument ofFigure 1 ; and -
Figure 6 shows a further exemplary visualization of measurement results obtained by the measurement instrument ofFigure 1 . - The detailed description set forth below in connection with the appended drawings, where like numerals reference like elements, is intended as a description of various embodiments of the disclosed subject matter and is not intended to represent the only embodiments. Each embodiment described in this disclosure is provided merely as an example or illustration and should not be construed as preferred or advantageous over other embodiments. The illustrative examples provided herein are not intended to be exhaustive or to limit the claimed subject matter to the precise forms disclosed.
- For the purposes of the present disclosure, the phrase "at least one of A, B, and C", for example, means (A), (B), (C), (A and B), (A and C), (B and C), or (A, B, and C), including all further possible permutations when more than three elements are listed. In other words, the term "at least one of A and B" generally means "A and/or B", namely "A" alone, "B" alone or "A and B".
-
Figure 1 schematically shows ameasurement system 10 comprising ameasurement instrument 12 and a device undertest 14. - In general, the
measurement instrument 12 is configured to analyze an input signal received from the device undertest 14 in order to analyze certain properties of the device undertest 14. - For example, the
measurement instrument 12 may be a signal analyzer, a spectrum analyzer, an electromagnetic interference (EMI) test receiver, an EMI measuring receiver, an oscilloscope, a digital oscilloscope, or a power sensor. - However, the
measurement instrument 12 may be established as any other type of measurement instrument, depending on which aspects of the performance of the device undertest 14 are to be tested. - The device under
test 14 may be established as any electronic device that is configured to generate a radio-frequency (RF) signal. For example, the device undertest 14 comprises one or several electronic circuits generating an RF signal, wherein the performance of the electronic circuit(s) is assessed by means of themeasurement instrument 12. - The device under
test 14 is connected with themeasurement instrument 12 in a signal-transmitting manner. - Therein and in the following, the term "connected in a signal transmitting manner" is understood to denote a cable-based or wireless connection that is configured to transmit signals between the respective devices or components.
- For example, the device under
test 14 is connected to ameasurement input 16 of themeasurement instrument 12 via a suitable cable and suitable connectors, such that an electric signal output by the device undertest 14 is transmitted from the device undertest 14 to the measurement instrument via the cable. - Alternatively, the device under
test 14 may transmit a wireless electromagnetic signal, which is received via an RF antenna connected to themeasurement input 16. - Alternatively, a measurement probe may be connected to the
measurement input 16, wherein the measurement probe is configured to pick up an electric signal from the device undertest 14 by contacting corresponding contact points of the device undertest 14. - The
measurement instrument 12 comprises asignal processing module 18 having anRF frontend 20, adigital backend 22, and ananalysis module 24. - Therein and in the following, the terms "module" and "unit" are understood to describe suitable hardware, suitable software, or a combination of hardware and software that is configured to have a certain functionality.
- The hardware may, inter alia, comprise a CPU, a GPU, an FPGA, an ASIC, or other types of electronic circuitry.
- The
measurement instrument 12 comprises afirst measurement channel 26 and asecond measurement channel 28 that are each connected to themeasurement input 16. - It is noted that the
measurement instrument 12 may comprise more than two measurement channels, for example four, six, eight, or more measurement channels. - Without restriction of generality, the case of the
measurement instrument 12 comprising two measurement channels, namely thefirst measurement channel 26 and thesecond measurement channel 28 is described in the following. - The
measurement channels test 14 via themeasurement input 16 is forwarded to and processed by bothmeasurement channels - The
measurement channels first measurement channel 26 are identical in construction to the electronic components of thesecond measurement channel 28. - Thus, only the
first measurement channel 26 is described in the following, as the explanations given hereinafter likewise apply to thesecond measurement channel 28. - The
first measurement channel 26 comprises afirst mixer sub-module 30 that is associated with theRF frontend 20 of themeasurement instrument 12. - In general, the
first mixer sub-module 30 is configured to down-convert the input signal received from the device undertest 14 to an intermediate frequency being suitable for processing by the electronic components downstream of thefirst mixer sub-module 30. - As usual, the
first mixer sub-module 30 comprises alocal oscillator input 32 that is configured to receive a local oscillator signal. - The
first mixer sub-module 30 further comprises amixer unit 34 that is configured to mix the input signal received from the device undertest 14 with the local oscillator signal, and a band-pass filter 36 that is configured to appropriately filter the resulting mixed signal in order to down-convert the input signal to the intermediate frequency. - Therein, the frequency of the local oscillator signal may be constant. Alternatively, the frequency of the local oscillator signal may be time-variant, i.e. a frequency sweep may be applied to the local oscillator signal.
- The
first measurement channel 26 further comprises an analog-to-digital converter (ADC) 38 that is configured to digitize the signal output by thefirst mixer sub-module 30. - The
first measurement channel 26 further comprises adigital IQ mixer 40 that is associated with thedigital backend 22 of themeasurement instrument 12. - In general, the
digital IQ mixer 40 is configured to generate an IQ signal based on the digitized signal received from theADC 38 by means of any suitable technique known in the art. - Particularly, the
digital IQ mixer 40 may be established as one or several field-programmable gate arrays (FPGAs) that is/are configured to generate an IQ signal based on the digitized signal received from theADC 38. - However, it is to be understood that the
digital IQ mixer 40 may be established as any other suitable electronic component or group of electronic components being configured to generate the IQ signal based on the digitized signal received from theADC 38. - It is noted that an IQ signal may be represented as a two-dimensional real vector having two components, namely the in-phase component and the quadrature component. Alternatively, the IQ signal may be represented as a complex number, wherein the in-phase component may correspond to the real part of the complex number, and the quadrature component may correspond to the imaginary part of the complex number.
- Both representations are completely equivalent. Without restriction of generality, the functionality of the measurement instrument is described using the complex-valued description of the IQ signals in the following.
- Summarizing, an input signal received from the device under
test 14 is processed by the electronic components of thefirst measurement channel 26 described above, thereby generating a first complex-valued measurement signal. - Likewise, the input signal received from the device under
test 14 is processed by the electronic components of thesecond measurement channel 28, thereby generating a second complex-valued measurement signal. - Therein, the two
parallel measurement channels parallel measurement channels - The first complex-valued measurement signal is forwarded to a
first signal input 42 of theanalysis module 24. - Alternatively or additionally, the first complex-valued measurement signal is saved in a
measurement memory 44 of themeasurement instrument 12. - The second complex-valued measurement signal is forwarded to a
second signal input 46 of theanalysis module 24. - Alternatively or additionally, the second complex-valued measurement signal is saved in the
measurement memory 44. - In general, the
analysis module 24 is configured to apply mathematical operations to the complex-valued measurement signals in order to transform the complex-valued measurement signals into an output signal, e.g. into a measurement trace to be displayed on adisplay 48. - It is noted that the
display 48 may be integrated into themeasurement instrument 12. Alternatively, thedisplay 48 may be an external display that is connected to themeasurement instrument 12. - The input signal may be received from the device under
test 14 and processed by thesignal processing module 18, particularly by theanalysis module 24 in real time. - Alternatively, the input signal may be received from the device under
test 14, processed by themeasurement channels measurement memory 44. - The saved complex-valued measurement signals may later be forwarded to the
signal inputs analysis module 24. - The type of the mathematical operations applied to the measurement signals depends on a analysis mode of the
analysis module 24. - The
analysis module 24 may be switchable between different analysis modes, wherein the analysis modes comprise a cross correlation mode (also called "x-corr"), a sample mode, a minimum mode, a maximum mode, an auto peak mode, an average mode, a root mean square mode, and/or an error vector magnitude (EVM) mode. - In fact, for the sample mode, the minimum mode, the maximum mode, the auto peak mode, the average mode, and the root mean square mode, at least one of the complex-valued measurement signals may be converted into a real-valued measurement signal before processing by the
analysis module 24. - For example, at least one conversion unit may be arranged upstream of the
first signal input 42 and/or upstream of thesecond signal input 46, wherein the at least one conversion unit is configured to convert the first complex-valued measurement signal and/or the second complex-valued measurement signal into a real-valued measurement signal. - Alternatively, the
analysis module 24 may comprise the conversion unit. - In fact, in the sample mode, the minimum mode, the maximum mode, the auto peak mode, the average mode, and the root mean square mode, only one of the complex-valued measurement signals may be converted into a real-valued measurement signal and processed by the
analysis module 24. - For example, a user may select one or several analysis modes to be applied to the complex-valued measurement signals via a
user interface 50 of themeasurement instrument 12. -
Figure 2 shows an exemplary embodiment of theuser interface 50. As is illustrated inFigure 2 , the user may select the one or several analysis modes ("Trace 1" to "Trace 6" inFigure 2 )) from a drop-down menu 52. - Further, the user may adjust other operational parameters of the
analysis module 24, of thesignal processing module 18, and/or of themeasurement instrument 12 by means of theuser interface 50. - However, it is to be understood that any other type of user interface may be used.
- The mathematical operations applied to the measurement signal(s) in the different analysis modes are illustrated in
Figure 3 , which shows a table of the mathematical operations. - Therein, ydet denotes the measurement trace, while x(k) denotes the k-th sample of the respective measurement signal(s). Further, N denotes a predetermined number of samples over which the real-valued measurement signal is averaged in the average mode, and in the root mean square mode.
- In the last row, N denotes a predetermined number of samples over which the complex-valued measurement signals x 1(k) and

- It is noted that the EVM mode corresponds to the root mean square mode applied to the respective complex-valued measurement signal, but with the individual values of the samples or rather symbols x(k) replaced by x(k) - xid (k), wherein xid (k) denotes the corresponding ideal value of the respective symbol.
- This is illustrated in
Figure 4 , which shows a measured IQ vector x(k), an ideal constellation point xid (k), and the corresponding error vector x(k) - xid (k). - An exemplary result of a EVM determined over time is shown in
Figure 5 , wherein the curve ydet represents the determined EVM. - Measurements performed by the
measurement instrument 12 are typically influenced by a noise contribution of the device undertest 14 and by noise generated in themeasurement channels 26. - Particularly, if the
measurement instrument 12 has an intrinsic noise level that is of the same magnitude or even higher than the noise level of the device undertest 14, certain parameters of the device undertest 14 cannot be reliably measured. - For example, in this case the EVM determined and displayed as described above may not be reliable.
- For a user of a
measurement instrument 12, it is hard to tell whether the noise in a measured signal is dominated by a noise contribution of the device undertest 14 or by noise originating in themeasurement instrument 12. - In order to alleviate this problem, the
measurement instrument 12 is configured to visually indicate whether the measurements performed are trustworthy, as will be described in more detail hereinafter with reference toFigure 1 . - The
analysis module 24 comprises aprocessing sub-module 54 and avisualization sub-module 56. - The
processing sub-module 54 is configured to determine a first error quantity associated with the first complex-valued measurement signal. - Therein and in the following, the term "error quantity" is understood to denote a parameter that is indicative of a deviation of the respective signal value from the ideal value.
- For example, the term "error quantity" may denote an error vector describing the deviation of the amplitude and phase of the respective signal from the ideal amplitude and the ideal phase, respectively.
- As another example, the error quantity may denote a root mean square of several error vectors associated with the respective signal.
- As a further example, the error quantity may be an error vector magnitude, such that the error quantity describes a deviation of the constellation points of the respective IQ signal from the corresponding ideal constellation points.
- However, it is to be understood that the error quantities may be any other suitable error measure.
- The first error quantity may be averaged over a predetermined number of samples, thereby obtaining a first averaged error quantity.
- Alternatively or additionally, the
processing sub-module 54 is configured to determine a second error quantity associated with the second complex-valued measurement signal. - The second error quantity may be averaged over a predetermined number of samples, thereby obtaining a second averaged error quantity.
- Alternatively or additionally, the
analysis module 24 may be configured to average the first error quantity and the second error quantity over a predetermined number of samples, thereby obtaining a general error quantity. - In other words, the error quantities associated with the
first measurement channel 26 and with thesecond measurement channel 28 may be merged into a single error quantity, namely the general error quantity, by averaging over both the first error quantity and the second error quantity over the predetermined number of samples. - Alternatively, values of the first error quantity and values of the second error quantity obtained at the same time are averaged. In other words, values of the first error quantity and values of the second error quantity that are associated with the same sample of the input signal may be averaged, thereby obtaining a plurality of one-sample averages of the first error quantity and the second error quantity.
- The plurality of one-sample averages of the first error quantity and the second error quantity may be averaged over a predetermined number of samples, thereby obtaining the general error quantity.
- Alternatively, values of the first error quantity and values of the second error quantity obtained at the same frequency are averaged. In other words, values of the first error quantity and values of the second error quantity that are associated with the same frequency of the input signal may be averaged, thereby obtaining a plurality of one-sample averages of the first error quantity and the second error quantity.
- The plurality of one-sample averages of the first error quantity and the second error quantity may be averaged over a predetermined number of frequency bins, thereby obtaining the general error quantity.
- The
processing sub-module 54 further is configured to determine a complex-valued average signal, wherein the complex-valued average signal corresponds to a combined average of the first complex-valued measurement signal and of a complex conjugate of the second complex-valued measurement signal. - The
processing sub-module 54 may be configured to multiply the first complex-valued measurement signal y1(k) with a complex conjugate of the second complex-valuedmeasurement signal 

- The
processing sub-module 54 may further be configured average the complex-valued multiplication signal over a predetermined number of samples N, thereby obtaining the complex-valued average signal. - The
processing sub-module 54 may further be configured to determine the absolute value of the complex-valued average signal or the real part of the complex-valued average signal. - In the complex-valued average signal, noise originating in the
measurement channels test 14 are preserved. - This can be seen as follows. The complex-valued measurement signals output by the
digital backend 22 can be split into a correlated part from the device under test 14 (α) and two uncorrelated noise parts (n 1 and n 2) from themeasurement channels 26, 28:

- For example, the absolute value of the complex-valued average signal (Det) then is
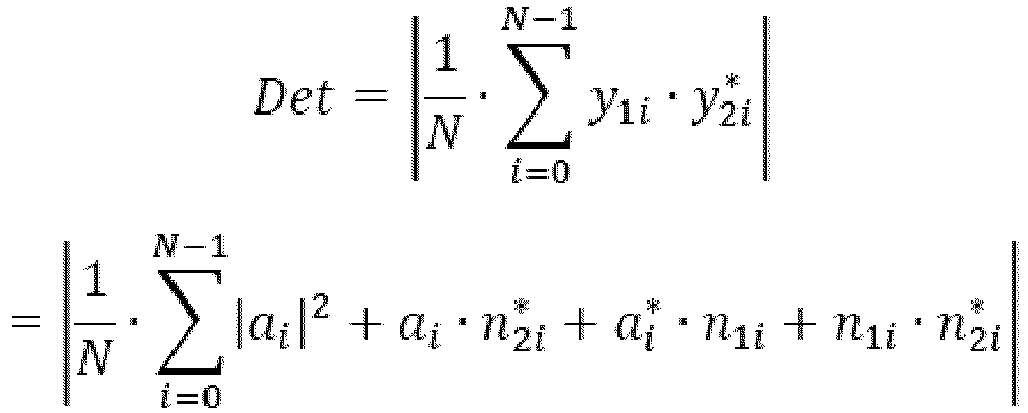
- The first term, i.e. 1/N∑|ai |2, corresponds to the average power of the input signal received from the device under
test 14 over time, which may correspond to the desired analysis result. - The further terms correspond to multiplications of uncorrelated signals, and thus cancel at least partially. More precisely, the further terms correspond to noise originating in the
measurement channels - In fact, it has turned out that these unwanted noise contributions are reduced approximately by 5 . log10(N) dB or by

- The result for the signal Det given above corresponds to the absolute value of the complex-valued average signal.
- Alternatively, the signal Det may be given by

- As can be seen from a comparison of the two possible results for the signal Det, the two results are the same for N → ∞.
- The predetermined number of samples N may be adjustable, e.g. via the
user interface 50. - The predetermined number of samples may be the same for the first error quantity, for the second error quantity, and for the complex-valued average signal.
- For example, the predetermined number of samples may be 10, 100, 1000, or 5000. However, the predetermined number of samples may have any other suitable value.
- The
analysis module 24 or rather theprocessing sub-module 54 further is configured to determine a combined error quantity based on the complex-valued average signal. - For example, the combined error quantity may be the absolute value of the complex-valued average signal or the real part of the complex-valued average signal described above.
- The
analysis module 24 or rather theprocessing sub-module 54 further is configured to determine a comparison quantity based on the combined error quantity, as well as based on the first error quantity, the first averaged error quantity, the second error quantity, the second averaged error quantity, and/or the general error quantity. - In order to enhance legibility, the first error quantity, the first averaged error quantity, the second error quantity, the second averaged error quantity, and/or the general error quantity will be collectively denoted as "channel error quantity" in the following.
- In general, the comparison quantity is indicative of a relative magnitude of the combined error quantity compared to the channel error quantity.
- For example, the comparison quantity may be value-discrete.
- The comparison quantity may have a first value if the combined error quantity differs from the channel error quantity by more than the at least one predefined threshold value. In this case, the
measurement channels - The comparison quantity may have a second value if the combined error quantity differs from the channel error quantity by less than the at least one predefined threshold value. In this case, the
measurement channels - For example, the value of the at least one predefined threshold value may be between 0.2 dB and 5 dB, particularly between 0.5 dB and 3 dB, for example between 1 dB and 2 dB.
- However, it is to be understood that a plurality of threshold values may be provided. Accordingly, the comparison quantity may be indicative of whether the combined error quantity differs from the channel error quantity by more or less than one or several of the plurality of threshold values.
- The plurality of threshold values may be associated with different categories of the relative magnitude of the combined error quantity compared to the channel error quantity. The categories may, for example, be "dominated by measurement channel noise", "similar magnitude of measurement channel noise and DUT noise", and "dominated by DUT noise".
- The
visualization sub-module 56 is configured to generate visualization data associated with the determined comparison quantity, wherein the visualization data is displayed on thedisplay 48. - As is illustrated in
Figure 5 , the visualization data may comprise a color, a text message and/or a symbol indicating the value of the comparison quantity. - In the particular example shown on the left hand side of
Figure 5 , the visualization data comprises acolored box 58 having a first color, e.g. green, which is displayed if the value of the comparison quantity indicates that the noise in the (processed) input signal is dominated by a noise contribution of the device undertest 14. - In the example shown on the right hand side of
Figure 5 , the visualization data comprises thecolored box 58 having a second color, e.g. red, which is displayed if the value of the comparison quantity indicates that the noise in the (processed) input signal is dominated by themeasurement channels - Additionally, a
warning sign 60 may be displayed, which warns a user that the noise in the (processed) input signal is dominated by themeasurement channels - The visualization data may further comprise a
text field 62 indicating the value of the combined error quantity. - The
text field 62 may be colored differently depending on the value of the comparison quantity. - Alternatively or additionally, the displayed measurement trace ydet may be colored differently depending on the value of the comparison quantity.
- As is illustrated in
Figure 6 , the visualization data may further comprise atext field 62 indicating the value of the channel error quantity. - Thus, all information relevant for the user for assessing the individual noise contributions may be displayed on the
display 48 simultaneously in an easy to understand and illustrative manner. - Certain embodiments disclosed herein, particularly the respective module(s) and/or unit(s), utilize circuitry (e.g., one or more circuits) in order to implement standards, protocols, methodologies or technologies disclosed herein, operably couple two or more components, generate information, process information, analyze information, generate signals, encode/decode signals, convert signals, transmit and/or receive signals, control other devices, etc. Circuitry of any type can be used.
- In an embodiment, circuitry includes, among other things, one or more computing devices such as a processor (e.g., a microprocessor), a central processing unit (CPU), a digital signal processor (DSP), an application-specific integrated circuit (ASIC), a field-programmable gate array (FPGA), a system on a chip (SoC), or the like, or any combinations thereof, and can include discrete digital or analog circuit elements or electronics, or combinations thereof. In an embodiment, circuitry includes hardware circuit implementations (e.g., implementations in analog circuitry, implementations in digital circuitry, and the like, and combinations thereof).
- In an embodiment, circuitry includes combinations of circuits and computer program products having software or firmware instructions stored on one or more computer readable memories that work together to cause a device to perform one or more protocols, methodologies or technologies described herein. In an embodiment, circuitry includes circuits, such as, for example, microprocessors or portions of microprocessor, that require software, firmware, and the like for operation. In an embodiment, circuitry includes one or more processors or portions thereof and accompanying software, firmware, hardware, and the like.
- The present application may reference quantities and numbers. Unless specifically stated, such quantities and numbers are not to be considered restrictive, but exemplary of the possible quantities or numbers associated with the present application. Also in this regard, the present application may use the term "plurality" to reference a quantity or number. In this regard, the term "plurality" is meant to be any number that is more than one, for example, two, three, four, five, etc. The terms "about", "approximately", "near" etc., mean plus or minus 5% of the stated value.
Claims (15)
- A signal processing module for a measurement instrument (12), comprising an analysis module (24), a measurement input (16), and at least two parallel measurement channels (26, 28),wherein the at least two parallel measurement channels (26, 28) are each connected to the measurement input (16), such that an input signal received via the measurement input (16) is forwarded to the two parallel measurement channels (26, 28),wherein a first one of the at least two parallel measurement channels (26, 28) is configured to process the input signal, thereby generating a first complex-valued measurement signal,wherein a second one of the at least two parallel measurement channels (26, 28) is configured to process the input signal, thereby generating a second complex-valued measurement signal,wherein the analysis module (24) is configured to determine a first error quantity associated with the first complex-valued measurement signal,wherein the analysis module (24) is configured to determine a second error quantity associated with the second complex-valued measurement signal,wherein the analysis module (24) is configured to determine a complex-valued average signal, wherein the complex-valued average signal corresponds to a combined average of the first complex-valued measurement signal and of a complex conjugate of the second complex-valued measurement signal,wherein the analysis module (24) is configured to determine a combined error quantity based on the complex-valued average signal, andwherein the analysis module (24) is configured to determine a comparison quantity based on the combined error quantity as well as based on the first error quantity and/or the second error quantity, wherein the comparison quantity is indicative of a relative magnitude of the combined error quantity compared to the first error quantity and/or the second error quantity.
- The signal processing module according to claim 1, wherein the comparison quantity is indicative of whether the combined error quantity differs from the first error quantity and/or the second error quantity by more or less than at least one predefined threshold value.
- The signal processing module according to any one of the preceding claims, wherein the comparison quantity is value-discrete.
- The signal processing module of claim 2 and claim 3, wherein the comparison quantity has a first value if the combined error quantity differs from the first error quantity and/or the second error quantity by more than the at least one predefined threshold value, and wherein the comparison quantity has a second value if the combined error quantity differs from the first error quantity and/or the second error quantity by less than the at least one predefined threshold value.
- The signal processing module according to any one of the preceding claims, wherein the first error quantity and/or the second error quantity are/is associated with an error vector magnitude.
- The signal processing module according to any one of the preceding claims, wherein the signal processing module further comprises a visualization sub-module (56), wherein the visualization sub-module (56) is configured to generate visualization data associated with the comparison quantity.
- The signal processing module of claim 6, wherein the visualization data comprises a color, a text message and/or a symbol indicating the value of the comparison quantity.
- The signal processing module of claim 6 or 7, wherein the visualization data comprises the first error quantity, the second error quantity, and/or the combined error quantity.
- The signal processing module of claim 8, wherein the visualization data comprises values of the first error quantity, values of the second error quantity, and/or values of the combined error quantity over time, particularly wherein values of the first error quantity and values of the second error quantity obtained at the same time are averaged.
- The signal processing module of claim 8 or 9, wherein the visualization data comprises values of the first error quantity, values of the second error quantity, and/or values of the combined error quantity over frequency, particularly wherein values of the first error quantity and values of the second error quantity obtained at the same frequency are averaged.
- The signal processing module according to any one of the preceding claims, wherein the analysis module (24) is configured to average the first error quantity over a predetermined number of samples, thereby obtaining a first averaged error quantity, and/or wherein the analysis module (24) is configured to average the second error quantity over a predetermined number of samples, thereby obtaining a second averaged error quantity, and
wherein the analysis module (24) is configured to determine the comparison quantity based on the combined error quantity and based on the first averaged error quantity and/or the second averaged error quantity. - The signal processing module according to any one of the preceding claims, wherein the analysis module (24) is configured to average the first error quantity and the second error quantity over a predetermined number of samples, thereby obtaining a general error quantity, and wherein the analysis module (24) is configured to determine the comparison quantity based on the combined error quantity and based on the general error quantity.
- The signal processing module according to any one of the preceding claims, wherein the complex-valued average signal corresponds to a combined average of the first complex-valued measurement signal and of the complex conjugate of the second complex-valued measurement signal averaged over a predetermined number of samples.
- The signal processing module according to claim 13, wherein the predetermined number of samples is adjustable.
- A measurement instrument, comprising a signal processing module (18) according to any one of claims 1 to 14.
Priority Applications (3)
| Application Number | Priority Date | Filing Date | Title |
|---|---|---|---|
| EP22185484.7A EP4145151B1 (en) | 2022-07-18 | 2022-07-18 | Signal processing module and measurement instrument |
| US18/178,051 US12253554B2 (en) | 2022-07-18 | 2023-03-03 | Signal processing circuit and measurement instrument |
| CN202310222231.6A CN117420486B (en) | 2022-07-18 | 2023-03-09 | Signal processing modules and measuring instruments |
Applications Claiming Priority (1)
| Application Number | Priority Date | Filing Date | Title |
|---|---|---|---|
| EP22185484.7A EP4145151B1 (en) | 2022-07-18 | 2022-07-18 | Signal processing module and measurement instrument |
Publications (2)
| Publication Number | Publication Date |
|---|---|
| EP4145151A1 true EP4145151A1 (en) | 2023-03-08 |
| EP4145151B1 EP4145151B1 (en) | 2024-05-08 |
Family
ID=82655193
Family Applications (1)
| Application Number | Title | Priority Date | Filing Date |
|---|---|---|---|
| EP22185484.7A Active EP4145151B1 (en) | 2022-07-18 | 2022-07-18 | Signal processing module and measurement instrument |
Country Status (3)
| Country | Link |
|---|---|
| US (1) | US12253554B2 (en) |
| EP (1) | EP4145151B1 (en) |
| CN (1) | CN117420486B (en) |
Cited By (1)
| Publication number | Priority date | Publication date | Assignee | Title |
|---|---|---|---|---|
| US12372561B2 (en) | 2023-08-25 | 2025-07-29 | Keysight Technologies, Inc. | System and method for measuring modulation distortion error vector magnitude (EVM) of a device under test (DUT) |
Citations (4)
| Publication number | Priority date | Publication date | Assignee | Title |
|---|---|---|---|---|
| US20070225927A1 (en) * | 2004-04-21 | 2007-09-27 | Agilent Technologies, Inc. | Method and an apparatus for measuring noise |
| US20080109179A1 (en) * | 2006-11-08 | 2008-05-08 | Yokogawa Electric Corporation | Signal measuring apparatus and semiconductor testing apparatus |
| US10756829B1 (en) * | 2019-12-03 | 2020-08-25 | Teradyne, Inc. | Determining error vector magnitude using cross-correlation |
| EP3936877A1 (en) * | 2021-01-22 | 2022-01-12 | Rohde & Schwarz GmbH & Co. KG | Measurement instrument, measurement system, and signal processing method |
Family Cites Families (12)
| Publication number | Priority date | Publication date | Assignee | Title |
|---|---|---|---|---|
| US6977600B2 (en) | 2004-02-20 | 2005-12-20 | Fujitsu Limited | Determining analog error using parallel path sampling |
| US20100156437A1 (en) * | 2008-12-22 | 2010-06-24 | Terry Cobb | Apparatus and Methods of Demonstrating Cabling Performance in Real Time |
| US9506996B2 (en) * | 2013-10-17 | 2016-11-29 | Infineon Technologies Ag | Apparatus and method for detecting an error in a measurement of a quantity |
| CA2945154C (en) | 2014-04-07 | 2021-04-13 | Environmentally Conscious Recycling, Inc. | Devices and methods for recycling mattress box springs |
| US9306782B2 (en) | 2014-04-07 | 2016-04-05 | Analog Devices, Inc. | Systems and methods for narrowband signal quadrature error correction |
| EP3486666B8 (en) | 2017-11-16 | 2021-09-08 | Rohde & Schwarz GmbH & Co. KG | Measuring device and measuring method for noise-corrected transmitter performance measurement |
| CN108710027B (en) | 2018-05-23 | 2020-05-15 | 成都玖锦科技有限公司 | High-precision measurement method for phase difference and amplitude difference between channels |
| US11112447B1 (en) * | 2018-06-11 | 2021-09-07 | Anritsu Company | Method for differential/common-mode noise figure measurements |
| US11255893B2 (en) | 2018-08-22 | 2022-02-22 | Keysight Technologies, Inc. | Measuring error in signal under test (SUT) using multiple channel measurement device |
| US10761134B2 (en) | 2018-10-25 | 2020-09-01 | Rohde & Schwarz Gmbh & Co. Kg | Method and measurement system for identifying the noise figure of a device under test |
| US11255892B2 (en) | 2019-06-05 | 2022-02-22 | Cirrus Logic, Inc. | Phase compensation in a resonant phase detector |
| US11796621B2 (en) * | 2019-09-12 | 2023-10-24 | National Instruments Corporation | Fast convergence method for cross-correlation based modulation quality measurements |
-
2022
- 2022-07-18 EP EP22185484.7A patent/EP4145151B1/en active Active
-
2023
- 2023-03-03 US US18/178,051 patent/US12253554B2/en active Active
- 2023-03-09 CN CN202310222231.6A patent/CN117420486B/en active Active
Patent Citations (4)
| Publication number | Priority date | Publication date | Assignee | Title |
|---|---|---|---|---|
| US20070225927A1 (en) * | 2004-04-21 | 2007-09-27 | Agilent Technologies, Inc. | Method and an apparatus for measuring noise |
| US20080109179A1 (en) * | 2006-11-08 | 2008-05-08 | Yokogawa Electric Corporation | Signal measuring apparatus and semiconductor testing apparatus |
| US10756829B1 (en) * | 2019-12-03 | 2020-08-25 | Teradyne, Inc. | Determining error vector magnitude using cross-correlation |
| EP3936877A1 (en) * | 2021-01-22 | 2022-01-12 | Rohde & Schwarz GmbH & Co. KG | Measurement instrument, measurement system, and signal processing method |
Cited By (1)
| Publication number | Priority date | Publication date | Assignee | Title |
|---|---|---|---|---|
| US12372561B2 (en) | 2023-08-25 | 2025-07-29 | Keysight Technologies, Inc. | System and method for measuring modulation distortion error vector magnitude (EVM) of a device under test (DUT) |
Also Published As
| Publication number | Publication date |
|---|---|
| EP4145151B1 (en) | 2024-05-08 |
| CN117420486A (en) | 2024-01-19 |
| US12253554B2 (en) | 2025-03-18 |
| US20240019477A1 (en) | 2024-01-18 |
| CN117420486B (en) | 2024-11-22 |
Similar Documents
| Publication | Publication Date | Title |
|---|---|---|
| EP4070483B1 (en) | Determining error vector magnitude using cross-correlation | |
| EP4107533B1 (en) | Method as well as test system for testing a device under test | |
| US11796621B2 (en) | Fast convergence method for cross-correlation based modulation quality measurements | |
| EP3951405B1 (en) | Measurement system and measurement method | |
| EP4145151B1 (en) | Signal processing module and measurement instrument | |
| US10841019B1 (en) | Cross-correlation measurements for modulation quality measurements | |
| CN119846333A (en) | Signal processing circuit and measuring system | |
| US12235299B2 (en) | Measurement system and method of determining a corrected averaged power signal | |
| EP4119954B1 (en) | Measurement system | |
| CN116744180A (en) | Signal processing method and signal processing system | |
| EP4478056B1 (en) | Signal processing method and measurement system | |
| US20240027524A1 (en) | Electronic instrument and signal analysis method | |
| US10958362B1 (en) | Method and system for determining group delay between periodic radio frequency (RF) signals | |
| US20240319248A1 (en) | Signal processing method, measurement instrument and measurement system | |
| EP4145152B1 (en) | Detector module, signal processing module, and measurement instrument | |
| US10374728B1 (en) | Test system as well as method for over-the-air testing | |
| EP4549960A1 (en) | Measurement system and method for eliminating image portions | |
| US20250316258A1 (en) | Signal processing method of processing a digital input signal, and measurement instrument | |
| US12416665B2 (en) | Measurement system and method of determining a noise figure of a device under test | |
| US10120008B2 (en) | Method and apparatus for estimating the noise introduced by a device | |
| EP4585935A1 (en) | Measurement instrument | |
| EP4657089A1 (en) | Test and/or measurement system | |
| US20250164546A1 (en) | Measurement instrument and system for enhanced constellation diagrams and method thereof | |
| US20250383388A1 (en) | Test and/or measurement instrument and test and/or measurement system | |
| EP4617676A1 (en) | A measurement instrument for measuring radio frequency signals and a measurement method |
Legal Events
| Date | Code | Title | Description |
|---|---|---|---|
| PUAI | Public reference made under article 153(3) epc to a published international application that has entered the european phase |
Free format text: ORIGINAL CODE: 0009012 |
|
| STAA | Information on the status of an ep patent application or granted ep patent |
Free format text: STATUS: REQUEST FOR EXAMINATION WAS MADE |
|
| 17P | Request for examination filed |
Effective date: 20230123 |
|
| AK | Designated contracting states |
Kind code of ref document: A1 Designated state(s): AL AT BE BG CH CY CZ DE DK EE ES FI FR GB GR HR HU IE IS IT LI LT LU LV MC MK MT NL NO PL PT RO RS SE SI SK SM TR |
|
| P01 | Opt-out of the competence of the unified patent court (upc) registered |
Effective date: 20230525 |
|
| GRAP | Despatch of communication of intention to grant a patent |
Free format text: ORIGINAL CODE: EPIDOSNIGR1 |
|
| STAA | Information on the status of an ep patent application or granted ep patent |
Free format text: STATUS: GRANT OF PATENT IS INTENDED |
|
| INTG | Intention to grant announced |
Effective date: 20240208 |
|
| GRAS | Grant fee paid |
Free format text: ORIGINAL CODE: EPIDOSNIGR3 |
|
| GRAA | (expected) grant |
Free format text: ORIGINAL CODE: 0009210 |
|
| STAA | Information on the status of an ep patent application or granted ep patent |
Free format text: STATUS: THE PATENT HAS BEEN GRANTED |
|
| RBV | Designated contracting states (corrected) |
Designated state(s): AL AT BE BG CY CZ DE DK EE ES FI FR GB GR HR HU IS IT LT LU LV MC MK MT NL NO PL PT RO RS SE SI SK SM TR |
|
| AK | Designated contracting states |
Kind code of ref document: B1 Designated state(s): AL AT BE BG CY CZ DE DK EE ES FI FR GB GR HR HU IS IT LT LU LV MC MK MT NL NO PL PT RO RS SE SI SK SM TR |
|
| REG | Reference to a national code |
Ref country code: GB Ref legal event code: FG4D |
|
| REG | Reference to a national code |
Ref country code: DE Ref legal event code: R096 Ref document number: 602022003322 Country of ref document: DE |
|
| REG | Reference to a national code |
Ref country code: LT Ref legal event code: MG9D |
|
| REG | Reference to a national code |
Ref country code: NL Ref legal event code: MP Effective date: 20240508 |
|
| PG25 | Lapsed in a contracting state [announced via postgrant information from national office to epo] |
Ref country code: IS Free format text: LAPSE BECAUSE OF FAILURE TO SUBMIT A TRANSLATION OF THE DESCRIPTION OR TO PAY THE FEE WITHIN THE PRESCRIBED TIME-LIMIT Effective date: 20240908 |
|
| PG25 | Lapsed in a contracting state [announced via postgrant information from national office to epo] |
Ref country code: BG Free format text: LAPSE BECAUSE OF FAILURE TO SUBMIT A TRANSLATION OF THE DESCRIPTION OR TO PAY THE FEE WITHIN THE PRESCRIBED TIME-LIMIT Effective date: 20240508 |
|
| PG25 | Lapsed in a contracting state [announced via postgrant information from national office to epo] |
Ref country code: FI Free format text: LAPSE BECAUSE OF FAILURE TO SUBMIT A TRANSLATION OF THE DESCRIPTION OR TO PAY THE FEE WITHIN THE PRESCRIBED TIME-LIMIT Effective date: 20240508 Ref country code: HR Free format text: LAPSE BECAUSE OF FAILURE TO SUBMIT A TRANSLATION OF THE DESCRIPTION OR TO PAY THE FEE WITHIN THE PRESCRIBED TIME-LIMIT Effective date: 20240508 |
|
| PG25 | Lapsed in a contracting state [announced via postgrant information from national office to epo] |
Ref country code: GR Free format text: LAPSE BECAUSE OF FAILURE TO SUBMIT A TRANSLATION OF THE DESCRIPTION OR TO PAY THE FEE WITHIN THE PRESCRIBED TIME-LIMIT Effective date: 20240809 |
|
| PG25 | Lapsed in a contracting state [announced via postgrant information from national office to epo] |
Ref country code: PT Free format text: LAPSE BECAUSE OF FAILURE TO SUBMIT A TRANSLATION OF THE DESCRIPTION OR TO PAY THE FEE WITHIN THE PRESCRIBED TIME-LIMIT Effective date: 20240909 |
|
| REG | Reference to a national code |
Ref country code: AT Ref legal event code: MK05 Ref document number: 1685418 Country of ref document: AT Kind code of ref document: T Effective date: 20240508 |
|
| PG25 | Lapsed in a contracting state [announced via postgrant information from national office to epo] |
Ref country code: NL Free format text: LAPSE BECAUSE OF FAILURE TO SUBMIT A TRANSLATION OF THE DESCRIPTION OR TO PAY THE FEE WITHIN THE PRESCRIBED TIME-LIMIT Effective date: 20240508 |
|
| PG25 | Lapsed in a contracting state [announced via postgrant information from national office to epo] |
Ref country code: ES Free format text: LAPSE BECAUSE OF FAILURE TO SUBMIT A TRANSLATION OF THE DESCRIPTION OR TO PAY THE FEE WITHIN THE PRESCRIBED TIME-LIMIT Effective date: 20240508 |
|
| PG25 | Lapsed in a contracting state [announced via postgrant information from national office to epo] |
Ref country code: AT Free format text: LAPSE BECAUSE OF FAILURE TO SUBMIT A TRANSLATION OF THE DESCRIPTION OR TO PAY THE FEE WITHIN THE PRESCRIBED TIME-LIMIT Effective date: 20240508 |
|
| PG25 | Lapsed in a contracting state [announced via postgrant information from national office to epo] |
Ref country code: PL Free format text: LAPSE BECAUSE OF FAILURE TO SUBMIT A TRANSLATION OF THE DESCRIPTION OR TO PAY THE FEE WITHIN THE PRESCRIBED TIME-LIMIT Effective date: 20240508 |
|
| PG25 | Lapsed in a contracting state [announced via postgrant information from national office to epo] |
Ref country code: LV Free format text: LAPSE BECAUSE OF FAILURE TO SUBMIT A TRANSLATION OF THE DESCRIPTION OR TO PAY THE FEE WITHIN THE PRESCRIBED TIME-LIMIT Effective date: 20240508 |
|
| PG25 | Lapsed in a contracting state [announced via postgrant information from national office to epo] |
Ref country code: PT Free format text: LAPSE BECAUSE OF FAILURE TO SUBMIT A TRANSLATION OF THE DESCRIPTION OR TO PAY THE FEE WITHIN THE PRESCRIBED TIME-LIMIT Effective date: 20240909 Ref country code: PL Free format text: LAPSE BECAUSE OF FAILURE TO SUBMIT A TRANSLATION OF THE DESCRIPTION OR TO PAY THE FEE WITHIN THE PRESCRIBED TIME-LIMIT Effective date: 20240508 Ref country code: NO Free format text: LAPSE BECAUSE OF FAILURE TO SUBMIT A TRANSLATION OF THE DESCRIPTION OR TO PAY THE FEE WITHIN THE PRESCRIBED TIME-LIMIT Effective date: 20240808 Ref country code: NL Free format text: LAPSE BECAUSE OF FAILURE TO SUBMIT A TRANSLATION OF THE DESCRIPTION OR TO PAY THE FEE WITHIN THE PRESCRIBED TIME-LIMIT Effective date: 20240508 Ref country code: LV Free format text: LAPSE BECAUSE OF FAILURE TO SUBMIT A TRANSLATION OF THE DESCRIPTION OR TO PAY THE FEE WITHIN THE PRESCRIBED TIME-LIMIT Effective date: 20240508 Ref country code: IS Free format text: LAPSE BECAUSE OF FAILURE TO SUBMIT A TRANSLATION OF THE DESCRIPTION OR TO PAY THE FEE WITHIN THE PRESCRIBED TIME-LIMIT Effective date: 20240908 Ref country code: HR Free format text: LAPSE BECAUSE OF FAILURE TO SUBMIT A TRANSLATION OF THE DESCRIPTION OR TO PAY THE FEE WITHIN THE PRESCRIBED TIME-LIMIT Effective date: 20240508 Ref country code: GR Free format text: LAPSE BECAUSE OF FAILURE TO SUBMIT A TRANSLATION OF THE DESCRIPTION OR TO PAY THE FEE WITHIN THE PRESCRIBED TIME-LIMIT Effective date: 20240809 Ref country code: FI Free format text: LAPSE BECAUSE OF FAILURE TO SUBMIT A TRANSLATION OF THE DESCRIPTION OR TO PAY THE FEE WITHIN THE PRESCRIBED TIME-LIMIT Effective date: 20240508 Ref country code: ES Free format text: LAPSE BECAUSE OF FAILURE TO SUBMIT A TRANSLATION OF THE DESCRIPTION OR TO PAY THE FEE WITHIN THE PRESCRIBED TIME-LIMIT Effective date: 20240508 Ref country code: BG Free format text: LAPSE BECAUSE OF FAILURE TO SUBMIT A TRANSLATION OF THE DESCRIPTION OR TO PAY THE FEE WITHIN THE PRESCRIBED TIME-LIMIT Effective date: 20240508 Ref country code: AT Free format text: LAPSE BECAUSE OF FAILURE TO SUBMIT A TRANSLATION OF THE DESCRIPTION OR TO PAY THE FEE WITHIN THE PRESCRIBED TIME-LIMIT Effective date: 20240508 Ref country code: RS Free format text: LAPSE BECAUSE OF FAILURE TO SUBMIT A TRANSLATION OF THE DESCRIPTION OR TO PAY THE FEE WITHIN THE PRESCRIBED TIME-LIMIT Effective date: 20240808 |
|
| PG25 | Lapsed in a contracting state [announced via postgrant information from national office to epo] |
Ref country code: DK Free format text: LAPSE BECAUSE OF FAILURE TO SUBMIT A TRANSLATION OF THE DESCRIPTION OR TO PAY THE FEE WITHIN THE PRESCRIBED TIME-LIMIT Effective date: 20240508 |
|
| PG25 | Lapsed in a contracting state [announced via postgrant information from national office to epo] |
Ref country code: EE Free format text: LAPSE BECAUSE OF FAILURE TO SUBMIT A TRANSLATION OF THE DESCRIPTION OR TO PAY THE FEE WITHIN THE PRESCRIBED TIME-LIMIT Effective date: 20240508 |
|
| PG25 | Lapsed in a contracting state [announced via postgrant information from national office to epo] |
Ref country code: CZ Free format text: LAPSE BECAUSE OF FAILURE TO SUBMIT A TRANSLATION OF THE DESCRIPTION OR TO PAY THE FEE WITHIN THE PRESCRIBED TIME-LIMIT Effective date: 20240508 |
|
| PG25 | Lapsed in a contracting state [announced via postgrant information from national office to epo] |
Ref country code: RO Free format text: LAPSE BECAUSE OF FAILURE TO SUBMIT A TRANSLATION OF THE DESCRIPTION OR TO PAY THE FEE WITHIN THE PRESCRIBED TIME-LIMIT Effective date: 20240508 Ref country code: SK Free format text: LAPSE BECAUSE OF FAILURE TO SUBMIT A TRANSLATION OF THE DESCRIPTION OR TO PAY THE FEE WITHIN THE PRESCRIBED TIME-LIMIT Effective date: 20240508 |
|
| PG25 | Lapsed in a contracting state [announced via postgrant information from national office to epo] |
Ref country code: SM Free format text: LAPSE BECAUSE OF FAILURE TO SUBMIT A TRANSLATION OF THE DESCRIPTION OR TO PAY THE FEE WITHIN THE PRESCRIBED TIME-LIMIT Effective date: 20240508 |
|
| PG25 | Lapsed in a contracting state [announced via postgrant information from national office to epo] |
Ref country code: SM Free format text: LAPSE BECAUSE OF FAILURE TO SUBMIT A TRANSLATION OF THE DESCRIPTION OR TO PAY THE FEE WITHIN THE PRESCRIBED TIME-LIMIT Effective date: 20240508 Ref country code: SK Free format text: LAPSE BECAUSE OF FAILURE TO SUBMIT A TRANSLATION OF THE DESCRIPTION OR TO PAY THE FEE WITHIN THE PRESCRIBED TIME-LIMIT Effective date: 20240508 Ref country code: RO Free format text: LAPSE BECAUSE OF FAILURE TO SUBMIT A TRANSLATION OF THE DESCRIPTION OR TO PAY THE FEE WITHIN THE PRESCRIBED TIME-LIMIT Effective date: 20240508 Ref country code: EE Free format text: LAPSE BECAUSE OF FAILURE TO SUBMIT A TRANSLATION OF THE DESCRIPTION OR TO PAY THE FEE WITHIN THE PRESCRIBED TIME-LIMIT Effective date: 20240508 Ref country code: DK Free format text: LAPSE BECAUSE OF FAILURE TO SUBMIT A TRANSLATION OF THE DESCRIPTION OR TO PAY THE FEE WITHIN THE PRESCRIBED TIME-LIMIT Effective date: 20240508 Ref country code: CZ Free format text: LAPSE BECAUSE OF FAILURE TO SUBMIT A TRANSLATION OF THE DESCRIPTION OR TO PAY THE FEE WITHIN THE PRESCRIBED TIME-LIMIT Effective date: 20240508 |
|
| PG25 | Lapsed in a contracting state [announced via postgrant information from national office to epo] |
Ref country code: MC Free format text: LAPSE BECAUSE OF FAILURE TO SUBMIT A TRANSLATION OF THE DESCRIPTION OR TO PAY THE FEE WITHIN THE PRESCRIBED TIME-LIMIT Effective date: 20240508 Ref country code: IT Free format text: LAPSE BECAUSE OF FAILURE TO SUBMIT A TRANSLATION OF THE DESCRIPTION OR TO PAY THE FEE WITHIN THE PRESCRIBED TIME-LIMIT Effective date: 20240508 |
|
| REG | Reference to a national code |
Ref country code: DE Ref legal event code: R097 Ref document number: 602022003322 Country of ref document: DE |
|
| PLBE | No opposition filed within time limit |
Free format text: ORIGINAL CODE: 0009261 |
|
| STAA | Information on the status of an ep patent application or granted ep patent |
Free format text: STATUS: NO OPPOSITION FILED WITHIN TIME LIMIT |
|
| PG25 | Lapsed in a contracting state [announced via postgrant information from national office to epo] |
Ref country code: LU Free format text: LAPSE BECAUSE OF NON-PAYMENT OF DUE FEES Effective date: 20240718 |
|
| PG25 | Lapsed in a contracting state [announced via postgrant information from national office to epo] |
Ref country code: LU Free format text: LAPSE BECAUSE OF NON-PAYMENT OF DUE FEES Effective date: 20240718 |
|
| 26N | No opposition filed |
Effective date: 20250211 |
|
| PG25 | Lapsed in a contracting state [announced via postgrant information from national office to epo] |
Ref country code: SI Free format text: LAPSE BECAUSE OF FAILURE TO SUBMIT A TRANSLATION OF THE DESCRIPTION OR TO PAY THE FEE WITHIN THE PRESCRIBED TIME-LIMIT Effective date: 20240508 Ref country code: BE Free format text: LAPSE BECAUSE OF NON-PAYMENT OF DUE FEES Effective date: 20240731 |
|
| REG | Reference to a national code |
Ref country code: BE Ref legal event code: MM Effective date: 20240731 |
|
| PG25 | Lapsed in a contracting state [announced via postgrant information from national office to epo] |
Ref country code: SE Free format text: LAPSE BECAUSE OF FAILURE TO SUBMIT A TRANSLATION OF THE DESCRIPTION OR TO PAY THE FEE WITHIN THE PRESCRIBED TIME-LIMIT Effective date: 20240508 |
|
| PGFP | Annual fee paid to national office [announced via postgrant information from national office to epo] |
Ref country code: DE Payment date: 20250722 Year of fee payment: 4 |
|
| PGFP | Annual fee paid to national office [announced via postgrant information from national office to epo] |
Ref country code: FR Payment date: 20250723 Year of fee payment: 4 |
|
| PG25 | Lapsed in a contracting state [announced via postgrant information from national office to epo] |
Ref country code: CY Free format text: LAPSE BECAUSE OF FAILURE TO SUBMIT A TRANSLATION OF THE DESCRIPTION OR TO PAY THE FEE WITHIN THE PRESCRIBED TIME-LIMIT; INVALID AB INITIO Effective date: 20220718 |
|
| PG25 | Lapsed in a contracting state [announced via postgrant information from national office to epo] |
Ref country code: HU Free format text: LAPSE BECAUSE OF FAILURE TO SUBMIT A TRANSLATION OF THE DESCRIPTION OR TO PAY THE FEE WITHIN THE PRESCRIBED TIME-LIMIT; INVALID AB INITIO Effective date: 20220718 |
|
| PG25 | Lapsed in a contracting state [announced via postgrant information from national office to epo] |
Ref country code: TR Free format text: LAPSE BECAUSE OF FAILURE TO SUBMIT A TRANSLATION OF THE DESCRIPTION OR TO PAY THE FEE WITHIN THE PRESCRIBED TIME-LIMIT Effective date: 20240508 |
|
| PG25 | Lapsed in a contracting state [announced via postgrant information from national office to epo] |
Ref country code: LT Free format text: LAPSE BECAUSE OF FAILURE TO SUBMIT A TRANSLATION OF THE DESCRIPTION OR TO PAY THE FEE WITHIN THE PRESCRIBED TIME-LIMIT Effective date: 20240508 |