EP4124850A1 - Sted microscopy method with improved signal to noise ratio in low photon count imaging conditions - Google Patents
Sted microscopy method with improved signal to noise ratio in low photon count imaging conditions Download PDFInfo
- Publication number
- EP4124850A1 EP4124850A1 EP22189501.4A EP22189501A EP4124850A1 EP 4124850 A1 EP4124850 A1 EP 4124850A1 EP 22189501 A EP22189501 A EP 22189501A EP 4124850 A1 EP4124850 A1 EP 4124850A1
- Authority
- EP
- European Patent Office
- Prior art keywords
- image
- sted
- filtered
- intensity
- sample
- Prior art date
- Legal status (The legal status is an assumption and is not a legal conclusion. Google has not performed a legal analysis and makes no representation as to the accuracy of the status listed.)
- Withdrawn
Links
Images
Classifications
-
- G—PHYSICS
- G06—COMPUTING OR CALCULATING; COUNTING
- G06T—IMAGE DATA PROCESSING OR GENERATION, IN GENERAL
- G06T5/00—Image enhancement or restoration
- G06T5/70—Denoising; Smoothing
-
- G—PHYSICS
- G01—MEASURING; TESTING
- G01N—INVESTIGATING OR ANALYSING MATERIALS BY DETERMINING THEIR CHEMICAL OR PHYSICAL PROPERTIES
- G01N21/00—Investigating or analysing materials by the use of optical means, i.e. using sub-millimetre waves, infrared, visible or ultraviolet light
- G01N21/62—Systems in which the material investigated is excited whereby it emits light or causes a change in wavelength of the incident light
- G01N21/63—Systems in which the material investigated is excited whereby it emits light or causes a change in wavelength of the incident light optically excited
- G01N21/64—Fluorescence; Phosphorescence
- G01N21/6408—Fluorescence; Phosphorescence with measurement of decay time, time resolved fluorescence
-
- G—PHYSICS
- G01—MEASURING; TESTING
- G01N—INVESTIGATING OR ANALYSING MATERIALS BY DETERMINING THEIR CHEMICAL OR PHYSICAL PROPERTIES
- G01N21/00—Investigating or analysing materials by the use of optical means, i.e. using sub-millimetre waves, infrared, visible or ultraviolet light
- G01N21/62—Systems in which the material investigated is excited whereby it emits light or causes a change in wavelength of the incident light
- G01N21/63—Systems in which the material investigated is excited whereby it emits light or causes a change in wavelength of the incident light optically excited
- G01N21/64—Fluorescence; Phosphorescence
- G01N21/6428—Measuring fluorescence of fluorescent products of reactions or of fluorochrome labelled reactive substances, e.g. measuring quenching effects, using measuring "optrodes"
-
- G—PHYSICS
- G01—MEASURING; TESTING
- G01N—INVESTIGATING OR ANALYSING MATERIALS BY DETERMINING THEIR CHEMICAL OR PHYSICAL PROPERTIES
- G01N21/00—Investigating or analysing materials by the use of optical means, i.e. using sub-millimetre waves, infrared, visible or ultraviolet light
- G01N21/62—Systems in which the material investigated is excited whereby it emits light or causes a change in wavelength of the incident light
- G01N21/63—Systems in which the material investigated is excited whereby it emits light or causes a change in wavelength of the incident light optically excited
- G01N21/64—Fluorescence; Phosphorescence
- G01N21/645—Specially adapted constructive features of fluorimeters
- G01N21/6456—Spatial resolved fluorescence measurements; Imaging
- G01N21/6458—Fluorescence microscopy
-
- G—PHYSICS
- G06—COMPUTING OR CALCULATING; COUNTING
- G06T—IMAGE DATA PROCESSING OR GENERATION, IN GENERAL
- G06T5/00—Image enhancement or restoration
- G06T5/10—Image enhancement or restoration using non-spatial domain filtering
-
- G—PHYSICS
- G06—COMPUTING OR CALCULATING; COUNTING
- G06T—IMAGE DATA PROCESSING OR GENERATION, IN GENERAL
- G06T5/00—Image enhancement or restoration
- G06T5/20—Image enhancement or restoration using local operators
-
- G—PHYSICS
- G06—COMPUTING OR CALCULATING; COUNTING
- G06T—IMAGE DATA PROCESSING OR GENERATION, IN GENERAL
- G06T5/00—Image enhancement or restoration
- G06T5/50—Image enhancement or restoration using two or more images, e.g. averaging or subtraction
-
- G—PHYSICS
- G01—MEASURING; TESTING
- G01N—INVESTIGATING OR ANALYSING MATERIALS BY DETERMINING THEIR CHEMICAL OR PHYSICAL PROPERTIES
- G01N21/00—Investigating or analysing materials by the use of optical means, i.e. using sub-millimetre waves, infrared, visible or ultraviolet light
- G01N21/62—Systems in which the material investigated is excited whereby it emits light or causes a change in wavelength of the incident light
- G01N21/63—Systems in which the material investigated is excited whereby it emits light or causes a change in wavelength of the incident light optically excited
- G01N21/64—Fluorescence; Phosphorescence
- G01N21/6428—Measuring fluorescence of fluorescent products of reactions or of fluorochrome labelled reactive substances, e.g. measuring quenching effects, using measuring "optrodes"
- G01N2021/6439—Measuring fluorescence of fluorescent products of reactions or of fluorochrome labelled reactive substances, e.g. measuring quenching effects, using measuring "optrodes" with indicators, stains, dyes, tags, labels, marks
-
- G—PHYSICS
- G06—COMPUTING OR CALCULATING; COUNTING
- G06T—IMAGE DATA PROCESSING OR GENERATION, IN GENERAL
- G06T2207/00—Indexing scheme for image analysis or image enhancement
- G06T2207/10—Image acquisition modality
- G06T2207/10056—Microscopic image
-
- G—PHYSICS
- G06—COMPUTING OR CALCULATING; COUNTING
- G06T—IMAGE DATA PROCESSING OR GENERATION, IN GENERAL
- G06T2207/00—Indexing scheme for image analysis or image enhancement
- G06T2207/10—Image acquisition modality
- G06T2207/10064—Fluorescence image
-
- G—PHYSICS
- G06—COMPUTING OR CALCULATING; COUNTING
- G06T—IMAGE DATA PROCESSING OR GENERATION, IN GENERAL
- G06T2207/00—Indexing scheme for image analysis or image enhancement
- G06T2207/20—Special algorithmic details
- G06T2207/20024—Filtering details
- G06T2207/20032—Median filtering
-
- G—PHYSICS
- G06—COMPUTING OR CALCULATING; COUNTING
- G06T—IMAGE DATA PROCESSING OR GENERATION, IN GENERAL
- G06T2207/00—Indexing scheme for image analysis or image enhancement
- G06T2207/20—Special algorithmic details
- G06T2207/20048—Transform domain processing
-
- G—PHYSICS
- G06—COMPUTING OR CALCULATING; COUNTING
- G06T—IMAGE DATA PROCESSING OR GENERATION, IN GENERAL
- G06T2207/00—Indexing scheme for image analysis or image enhancement
- G06T2207/20—Special algorithmic details
- G06T2207/20048—Transform domain processing
- G06T2207/20064—Wavelet transform [DWT]
Definitions
- a STED (stimulated emission depletion) fluorescence light microscope as described e.g. in EP 0 801 759 B1 , at least one image of a sample being stained with fluorescent molecules or a fluorescent dye is acquired by exciting the fluorescent molecules or the fluorescent dye by pulses of light in a focal region of a microscope objective.
- de-excitation light is applied to the sample to de-excite an area outside a center of the focal region or focal area.
- the de-excitation can originate from a pulsed or continuous wave (CW) light source. Both light sources are usually lasers and are called the excitation and depletion laser.
- US 9,551,658 B2 describes a method and a device for the extraction of light pulses originating from the sample with even better spatial resolution with the aid of a time-gated detection.
- the de-excitation light causes a reduction of the fluorescence lifetime. Therefore, the temporal decay of the fluorescence signal is shorter outside the center of the focal area than in the center.
- a time-gate excludes the signal within a short period after the excitation pulse.
- acquiring the STED image comprises the steps of:
- two-dimensional (but also three-dimensional) STED images of the sample or parts of the sample are acquired using a scanning microscope having a STED functionality.
- an acquired two-dimensional STED image comprises pixels in x- and y- direction (e.g. 512 x 512 pixels), depending on the acquisition parameters of the scanning microscope.
- the arrival times of the photons relative to the laser pulse are recorded for each pixel.
- the fluorescence lifetime of the typical fluorescence dyes is in the range of 1 to 4 ns.
- Many STED dyes have multiple lifetime components. In the center of the focal region is no or low de-excitation light and there the natural lifetime is observed. The lifetime is reduced / is lower outside the center of the focal region, but e.g.
- the de-excitation light in the region where the de-excitation light is applied, typically below 1 ns due to the de-excitation process.
- the reduction on lifetime outside of the center of the focal region is inversely proportional to the depletion energy from the depletion laser.
- For a typical STED image about 100 photon counts are recorded in bright pixels.
- the calculation of the Fourier coefficients of the photon arrival times is performed on a pixel basis, preferably for all pixels of the image. Because every pixel has a real Fourier coefficient and an imaginary Fourier coefficient, the real (Fourier) coefficients can be regarded as the first image and the imaginary (Fourier) coefficients can be regarded as the second image. However, it is of minor importance if the first image or the second image actually forms e.g.
- the first image and the second image can be represented or regarded as a data structure having e.g. just a linear or another suitable data storage arrangement. Something similar applies to at least one of the following: result image, filtered images, intensity image, image G and image S.
- acquiring a STED image further comprises registering an arrival time of each of the detected fluorescence photons relative to an excitation pulse for each pixel separately.
- arrival times are registered by at least two time-gates.
- the calculation of the Fourier coefficients comprises the calculation of the n-th order Fourier coefficients, wherein n is a pre-selected value (a natural number).
- the intensity image is derived from the STED image acquisition or from a calculation of intensity values from the number of registered photons for the pixels.
- the image G is calculated based on dividing the filtered first image by the filtered intensity image.
- the image S is calculated based on dividing the filtered second image by the filtered intensity image.
- the spatial filter is at least one of Anisotropic Diffusion, Total Variation de-noising, Maximum Entropy de-noising, Non-local-means and Wavelet de-noising.
- the object mentioned above is further solved by a computer program performing the method mentioned above.
- the first and/or second image in the sense of the present application can be represented in the form of a two-dimensional array of the respective Fourier coefficients.
- the filters / the spatial filtering of the first image, the second image and the intensity image are applied before the Fourier coefficients are divided through the filtered intensity.
- the filter was applied after the method step when the images were divided.
- the (divided) phasor coordinates of neighbor pixels have similar values while the raw Fourier coefficients vary depending on the intensity, especially under low photon count conditions.
- the term phasor coordinates in the present context is used in a comparable manner as described in Lanzan ⁇ et. al. For lower number of photon counts the Fourier coefficients of neighbor pixel show higher variation than for high photon counts. The different variation for similar mean value contradicts the preconditions of advanced filter methods.
- a median filter was chosen in prior art which performs reasonable when there is little variation of the photon counts in neighbor pixels.
- STED images show high variations that have to be preserved.
- the preconditions for advanced filters are given.
- the filtered images might contain the information form different regions with different weight and the division step might therefore lead to a wider distribution of the phasor coordinates.
- the means can e.g. contain a recording device according to the time correlated single photon counting principle (TCSPC-principle) or a recording device based on time gates.
- TCSPC-principle time correlated single photon counting principle
- the recorded data can be represented as number N of detected photons at the arrival time t for pixel i: N i (t) .
- n is the pre-selected order of the Fourier coefficients.
- f is the pulse repetition rate of the excitation light.
- the three images Freal, Fimag and I are filtered with a spatial filter, in particular with a de-noising filter.
- a spatial filter in particular with a de-noising filter.
- de-noising filter a wide variety of advanced de-noising algorithms can maintain spatial resolution and can therefore be used in this step.
- the following algorithms can be applied: Anisotropic Diffusion, Total Variation de-noising, Maximum Entropy de-noising, Non-local-means and Wavelet de-noising.
- a wavelet filter is chosen.
- the basic principle is similar to a Fourier filter for de-noising. Gaussian distributed noise causes an additional offset to the amplitude of all Fourier coefficients.
- the image is transformed into the Fourier space. The offset is subtracted and the image is back-transformed. This process is also called shrinkage.
- Wavelet space distinguishes from Fourier space by the fact that Wavelet coefficients represent frequency information for regions in the image.
- For Wavelet de-noising the same principle of shrinkage of the coefficients is used. The simplest method is to shrink all coefficients by the same offset. More advanced methods have been developed which can be applied to the present invention e.g. Sendur, L. & Selesnick, I., (2003), Bivariate Shrinkage with Local Variance Estimation, Signal Processing Letters, IEEE. Vol. 9. 438 - 441, 10.1109/LSP.2002.806054 .
- the shrinkage approach assumes a Gaussian distribution of the noise.
- the noise distribution is Poissonian.
- the standard deviation of the noise after the Anscombe transform is 1.0.
- all three images Freal, Fimag and I are transformed by the Anscombe transform (3), then the noise is estimated for all three images by the Median Absolute Deviation method (4).
- the Anscombe transformed images are transformed into wavelet space.
- the coefficients are shrinked by a value derived from the estimated standard deviation of the noise. Then the shrinked images are back-transformed from wavelet space and Anscombe back-transformed.
- the results are the filtered images Freal_filtered, Fimag_filtered and I_filtered.
- G i Freal _ filtered i / I _ filtered i
- S i Fimag _ filtered i / I _ filtered i .
- a result image is calculated from the phasor coefficients.
- the calculation can be implemented similar to the SPLIT method in Lanzano et. al. (2015), Encoding and decoding spatio-temporal information for super-resolution microscopy, Nature Communications, 10.1038/ncomms7701 .
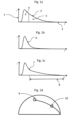
- Figure 1a shows a decay diagram with intensity I along the ordinate 1 and arrival time t along the abscissa 2 with the graph 3 for the photons originating from the center region of the focus of the excitation light.
- Figure 1b shows the graph 6 for the photons originating from the region outside the center of the focus, where the de-excitation light is applied. The average arrival time of the photons originating from the region outside the center of the focus is lower than the average arrival time of the photons originating from the focus.
- Figure 1c shows the graph 7 for all detected photons. In time gated STED an arrival time interval 8 is chosen (e.g.
- Pixels with a decay only from the center region are located at e.g. position 9 in the phasor plot (see Fig. 1d ). Photons from the outside are located at a distinct position 10 in the phasor plot.
- the idea behind the SPLIT method is to apply a weight to the intensity of individual pixels depending on their location in the phasor plot. This results in a spatial resolution comparable to the time gated STED method but less noise since no counted photons are lost.
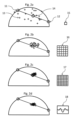
- Figure 2a visualizes simulated data for an average of 10 photon counts in an image pixel.
- the simulation assumes a mixture of 50% photons from the center area with 4n (4 nanoseconds) lifetime 11 and 50% photons from the outside with 200 ps (200 picoseconds) lifetime 12.
- the phasor coordinates 13 of 20 pixels are drawn.
- For high photon counts the position of the phasors has to be half way between the positions of the two components 11 and 12, i.e. at 14.
- the situation for low photon counts without filtering symbolized by 15 is so that due to the wide distribution in absence of a filter no improvement compared to the gating method is possible.
- Figure 2b shows the same simulated data when a 5 x 5 median filter symbolized by 16 is applied according to prior art.
- a 7 x 7 median filter symbolized by 17 has been used.
- figure 2d shows the result when a wavelet filter according to an embodiment of the present invention is used (symbolized by 18). To achieve a comparable signal to noise ratio a 7 x 7 median filter is necessary.
- a filter must in addition preserve the spatial resolution to be useful in STED applications.
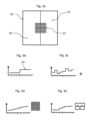
- a simulation with two mixtures shows the behavior of the filters along an edge.
- an image 19 was created with a mixture of 2/3 low resolved component and 1/3 high resolved component in the left half 20.
- 2/3 high resolved component are simulated.
- 7 lines of 8 pixels in the center region 22 have been accumulated vertically and have been weighted with an intensity gradient along the line between the 4 ns and 200 ps position in the phasor.
- Figure 3b shows the intensity 23 for the 8 averaged pixels for optimal condition of very high photon counts. For the case of 10 counts per pixel the intensity for the 8 averaged pixels is shown for no filtering in Figure 3c , median filter 7 x7 in Figure 3d and wavelet filter according the present invention in Figure 2e.
- the wavelet filter according the present invention better preserves the spatial resolution ( Fig. 3e ) than the median filter according prior art ( Fig. 3d ) with comparable signal to noise ratio ( Fig. 2c and Fig. 2d ).
- Advanced filters have been designed for similar noise characteristic in neighbor pixels. Such a filter fails when applied directly to the phasor components according prior art. Due to the division through the intensity in the phasor formulas the noise varies too much.
- Some or all of the method steps may be executed by (or using) a hardware apparatus, like for example, a processor, a microprocessor, a programmable computer or an electronic circuit.
- a hardware apparatus like for example, a processor, a microprocessor, a programmable computer or an electronic circuit.
- one or more of the most important method steps may be executed by such an apparatus.
- embodiments of the invention can be implemented in hardware or in software.
- the implementation can be performed using a non-transitory storage medium such as a digital storage medium, for example a floppy disc, a DVD, a Blu-Ray, a CD, a ROM, a PROM, and EPROM, an EEPROM or a FLASH memory, having electronically readable control signals stored thereon, which cooperate (or are capable of cooperating) with a programmable computer system such that the respective method is performed. Therefore, the digital storage medium may be computer readable.
- Some embodiments according to the invention comprise a data carrier having electronically readable control signals, which are capable of cooperating with a programmable computer system, such that one of the methods described herein is performed.
- embodiments of the present invention can be implemented as a computer program product with a program code, the program code being operative for performing one of the methods when the computer program product runs on a computer.
- the program code may, for example, be stored on a machine readable carrier.
- inventions comprise the computer program for performing one of the methods described herein, stored on a machine readable carrier.
- an embodiment of the present invention is, therefore, a computer program having a program code for performing one of the methods described herein, when the computer program runs on a computer.
- a further embodiment of the present invention is, therefore, a storage medium (or a data carrier, or a computer-readable medium) comprising, stored thereon, the computer program for performing one of the methods described herein when it is performed by a processor.
- the data carrier, the digital storage medium or the recorded medium are typically tangible and/or non-transitionary.
- a further embodiment of the present invention is an apparatus as described herein comprising a processor and the storage medium.
- a further embodiment of the invention is, therefore, a data stream or a sequence of signals representing the computer program for performing one of the methods described herein.
- the data stream or the sequence of signals may, for example, be configured to be transferred via a data communication connection, for example, via the internet.
- a further embodiment comprises a processing means, for example, a computer or a programmable logic device, configured to, or adapted to, perform one of the methods described herein.
- a processing means for example, a computer or a programmable logic device, configured to, or adapted to, perform one of the methods described herein.
- a further embodiment comprises a computer having installed thereon the computer program for performing one of the methods described herein.
- a further embodiment according to the invention comprises an apparatus or a system configured to transfer (for example, electronically or optically) a computer program for performing one of the methods described herein to a receiver.
- the receiver may, for example, be a computer, a mobile device, a memory device or the like.
- the apparatus or system may, for example, comprise a file server for transferring the computer program to the receiver.
- a programmable logic device for example, a field programmable gate array
- a field programmable gate array may cooperate with a microprocessor in order to perform one of the methods described herein.
- the methods are preferably performed by any hardware apparatus.
- a method for generating a result image comprising the steps of:
- acquiring the STED image further comprises: registering arrival times of detected fluorescence photons relative to an excitation pulse for each pixel separately and/or registering arrival times by at least two time-gates.
- the intensity image is derived from the STED image acquisition or from a calculation of intensity values from the number of registered photons for the pixels.
- step d) of claim 1 further comprising the step of transforming the acquired STED image, the first image, the second image and/or the intensity image having a first noise distribution, e.g. a Poisson noise distribution, to a transformed image having a second noise distribution, e.g. a Gauss noise distribution, preferably before step d) of claim 1 is executed and in particular executing the remaining method steps of claim 1 based on the transformed image.
- a first noise distribution e.g. a Poisson noise distribution
- a second noise distribution e.g. a Gauss noise distribution
- the spatial filter is at least one of Anisotropic Diffusion, Total Variation de-noising, Maximum Entropy de-noising, Non-local-means and Wavelet de-noising.
- a device being adapted to carry out the method according to one of the preceding embodiments, wherein the device is preferably a STED microscope or a STED scanning microscope.
- a computer program comprising program code for, when executed on a processor, performing the method according to one of the embodiments 1 to 10.
Landscapes
- Physics & Mathematics (AREA)
- Health & Medical Sciences (AREA)
- General Physics & Mathematics (AREA)
- Immunology (AREA)
- Chemical & Material Sciences (AREA)
- Engineering & Computer Science (AREA)
- Theoretical Computer Science (AREA)
- Biochemistry (AREA)
- Nuclear Medicine, Radiotherapy & Molecular Imaging (AREA)
- Life Sciences & Earth Sciences (AREA)
- Analytical Chemistry (AREA)
- General Health & Medical Sciences (AREA)
- Pathology (AREA)
- Optics & Photonics (AREA)
- Chemical Kinetics & Catalysis (AREA)
- Microscoopes, Condenser (AREA)
- Investigating, Analyzing Materials By Fluorescence Or Luminescence (AREA)
Abstract
Description
- In a STED (stimulated emission depletion) fluorescence light microscope, as described e.g. in
EP 0 801 759 B1 , at least one image of a sample being stained with fluorescent molecules or a fluorescent dye is acquired by exciting the fluorescent molecules or the fluorescent dye by pulses of light in a focal region of a microscope objective. In addition, de-excitation light is applied to the sample to de-excite an area outside a center of the focal region or focal area. Such a microscope can therefore generate images with a spatial resolution below the usual diffraction limit of light. The de-excitation can originate from a pulsed or continuous wave (CW) light source. Both light sources are usually lasers and are called the excitation and depletion laser. -
US 9,551,658 B2 
- The publication Lanzanò et. al. (2015), Encoding and decoding spatio-temporal information for super-resolution microscopy, Nature Communications, 6:6701, 10.1038/ncomms7701 , describes a method SPLIT which can save the signal of the early photons by applying the Phasor approach. Here the lifetime decay for each pixel is translated into a polar plot, called a phasor plot. In this plot the coordinates, called a phasor, of each pixel are a linear combination of the coordinates of the three components high resolved signal, low resolved signal and background. The weight of the high resolved component is used as intensity for the resulting image and contains the information from all photons detected. Although the signal of all photons is used, the method has the limitation that a high number of photons have to be acquired. Under low photon count conditions the distribution in the phasor plot is so wide that an improvement of the signal to noise ratio cannot be accomplished.
- To achieve a narrower distribution the phasor coordinates have to be filtered. The book chapter Digman et. al. (2012), The phasor approach to fluorescence lifetime imaging: exploiting phasor linear properties, in Fluorescence Lifetime Spectroscopy and Imaging: Principles and Applications in Biomedical Diagnostics (ed. L Marcu, PMW French, and DS Elson), CRC Press , describes a filtering method for phasor plots with the goal to maintain the spatial information by the use of a median filter. However, in the context of super-resolution even this filter method leads to unwanted degradation of the spatial resolution.
- In digital image processing more advanced filtering methods are known. As an example the publication Sendur, L. & Selesnick, I., (2003), Bivariate Shrinkage with Local Variance Estimation, Signal Processing Letters, IEEE. 9, 438-441, 10.1109/LSP.2002.806054 . describes an advanced de-noising filter based on a wavelet transform which better preserves the spatial resolution when applied to images. An attempt to apply this filter or a similar filter on phasor components the same way as the median filter fails due to the strong variations in the noise in the phasor component images.
- It is an object of the present invention to provide a method to increase the signal to noise ratio in STED images under a low photon count condition while maintaining the spatial resolution of the gated STED approach. This goal is achieved by a method comprising at least some of the following steps:
- acquiring a STED image of a sample, the STED image comprising pixels;
- calculating Fourier coefficients of photon arrival times or of photon arrival time data for pixels of the image, resulting in real coefficients and in imaginary coefficients;
- the real coefficients representing a first image and the imaginary coefficients representing a second image;
- deriving an intensity image from the STED image;
- applying a spatial filter to the first image, the second image and the intensity image resulting in respective filtered images;
- calculating an image G based on the filtered first image and the filtered intensity image; calculating an image S based on the filtered second image and the filtered intensity image; and
- calculating the result image based on the two images G and S.
- Preferably, acquiring the STED image comprises the steps of:
- irradiating the sample with pulsed excitation light, wherein the pulsed excitation light comprises a focus when irradiating the sample;
- irradiating the sample with de-excitation light surrounding the central region of the focus.
- Usually, two-dimensional (but also three-dimensional) STED images of the sample or parts of the sample are acquired using a scanning microscope having a STED functionality. For example, an acquired two-dimensional STED image comprises pixels in x- and y- direction (e.g. 512 x 512 pixels), depending on the acquisition parameters of the scanning microscope. The arrival times of the photons relative to the laser pulse are recorded for each pixel. The fluorescence lifetime of the typical fluorescence dyes is in the range of 1 to 4 ns. Many STED dyes have multiple lifetime components. In the center of the focal region is no or low de-excitation light and there the natural lifetime is observed. The lifetime is reduced / is lower outside the center of the focal region, but e.g. in the region where the de-excitation light is applied, typically below 1 ns due to the de-excitation process. The reduction on lifetime outside of the center of the focal region is inversely proportional to the depletion energy from the depletion laser. For a typical STED image about 100 photon counts are recorded in bright pixels. The calculation of the Fourier coefficients of the photon arrival times is performed on a pixel basis, preferably for all pixels of the image. Because every pixel has a real Fourier coefficient and an imaginary Fourier coefficient, the real (Fourier) coefficients can be regarded as the first image and the imaginary (Fourier) coefficients can be regarded as the second image. However, it is of minor importance if the first image or the second image actually forms e.g. a two-dimensional image. The first image and the second image can be represented or regarded as a data structure having e.g. just a linear or another suitable data storage arrangement. Something similar applies to at least one of the following: result image, filtered images, intensity image, image G and image S.
- In a preferred embodiment, wherein acquiring a STED image further comprises registering an arrival time of each of the detected fluorescence photons relative to an excitation pulse for each pixel separately.
- Alternatively or additionally, arrival times are registered by at least two time-gates.
- Preferably, the calculation of the Fourier coefficients comprises the calculation of the n-th order Fourier coefficients, wherein n is a pre-selected value (a natural number).
- Preferably, the intensity image is derived from the STED image acquisition or from a calculation of intensity values from the number of registered photons for the pixels.
- In a preferred embodiment, the image G is calculated based on dividing the filtered first image by the filtered intensity image.
- In another preferred embodiment, the image S is calculated based on dividing the filtered second image by the filtered intensity image.
- In a further preferred embodiment, the spatial filter is at least one of Anisotropic Diffusion, Total Variation de-noising, Maximum Entropy de-noising, Non-local-means and Wavelet de-noising.
- The object mentioned above is further solved by a device being adapted to carry out the method mentioned above.
- Furthermore, the object mentioned above is further solved by a computer program performing the method mentioned above. The first and/or second image in the sense of the present application can be represented in the form of a two-dimensional array of the respective Fourier coefficients.
- In a particularly preferred embodiment of the invention, the filters / the spatial filtering of the first image, the second image and the intensity image are applied before the Fourier coefficients are divided through the filtered intensity. Previously, the filter was applied after the method step when the images were divided. The (divided) phasor coordinates of neighbor pixels have similar values while the raw Fourier coefficients vary depending on the intensity, especially under low photon count conditions. The term phasor coordinates in the present context is used in a comparable manner as described in Lanzanò et. al. For lower number of photon counts the Fourier coefficients of neighbor pixel show higher variation than for high photon counts. The different variation for similar mean value contradicts the preconditions of advanced filter methods. A median filter was chosen in prior art which performs reasonable when there is little variation of the photon counts in neighbor pixels. However, STED images show high variations that have to be preserved. When the images are filtered before they are divided, according to the present invention the preconditions for advanced filters are given. Furthermore, when filtered images are divided there is a prejudice that the filtered images might contain the information form different regions with different weight and the division step might therefore lead to a wider distribution of the phasor coordinates.
- However, the results achieved by the procedure according to the particularly preferred embodiment surprisingly outperform the classical / previous approach in such an extent that the goal can actually be achieved. It was found that advanced filtering algorithms are much more sensitive for the strong variations in the statistics in neighboring pixels.
-
-
Figure 1 shows the effect of the STED de-excitation on the lifetime decay and the phasor plot with a typical lifetime decay of the data from the center region of the focus inFigure 1a , the region outside the center inFigure 1b. Figure 1c shows the combined lifetime decay and a typical selection of a time gate. The location of these components in the phasor plot is depicted inFigure 1.d . -
Figure 2 shows the distribution of phasors from twenty image pixels when different filtering methods are applied:Figure 2a no filter,Figure 2b median filter 5x5,Figure 2c median filter 7x7 andFigure 2d wavelet filter according a preferred embodiment of the present invention. The used data have been simulated for an average of ten photon counts per pixel. -
Figure 3 shows the effect of the filter regarding unwanted smoothing edges for an optimal filter inFigure 3b , no filter inFigure 3c , a median filter 7x7 inFigure 3d and a filter according a preferred embodiment of the present invention inFigure 3e . - In addition to a standard STED microscope - usually being implemented in a confocal laser scanning microscope - means for detection of arrival times of photons relative to excitation pulses of the excitation light are mandatory for the method according to the present invention. The means can e.g. contain a recording device according to the time correlated single photon counting principle (TCSPC-principle) or a recording device based on time gates.
- The recorded data can be represented as number N of detected photons at the arrival time t for pixel i: Ni(t). For each pixel the Fourier coefficients Freal and Fimag are calculated:

- The integer value n is the pre-selected order of the Fourier coefficients. Typically, the first order (1) is selected, i.e. n = 1. f is the pulse repetition rate of the excitation light. In addition, the intensity I is calculated for each pixel:
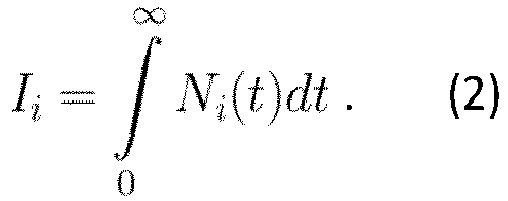
- In the next step the three images Freal, Fimag and I are filtered with a spatial filter, in particular with a de-noising filter. Preferably, a wide variety of advanced de-noising algorithms can maintain spatial resolution and can therefore be used in this step. For example, the following algorithms can be applied: Anisotropic Diffusion, Total Variation de-noising, Maximum Entropy de-noising, Non-local-means and Wavelet de-noising.
- In a preferred embodiment a wavelet filter is chosen. The basic principle is similar to a Fourier filter for de-noising. Gaussian distributed noise causes an additional offset to the amplitude of all Fourier coefficients. The image is transformed into the Fourier space. The offset is subtracted and the image is back-transformed. This process is also called shrinkage. Wavelet space distinguishes from Fourier space by the fact that Wavelet coefficients represent frequency information for regions in the image. For Wavelet de-noising the same principle of shrinkage of the coefficients is used. The simplest method is to shrink all coefficients by the same offset. More advanced methods have been developed which can be applied to the present invention e.g. Sendur, L. & Selesnick, I., (2003), Bivariate Shrinkage with Local Variance Estimation, Signal Processing Letters, IEEE. Vol. 9. 438 - 441, 10.1109/LSP.2002.806054 .
- The shrinkage approach assumes a Gaussian distribution of the noise. For the intensity image I it is known the noise distribution is Poissonian. A way to use filters designed for Gaussian distributed noise with Poisson distributed noise is e.g. to transform the data by the Anscombe transform:

- The situation is different for the two images Freal and Fimag. After the integral operation the noise is not exactly Poisson distributed and depends on the fluorescence lifetime.
- However, the situation is not as dramatic as for an attempt to filter the phasor components. In first order on can assume that the distribution is almost Poisson and the noise variance for these images can be estimated by a statistical robust method like the Median Absolute Deviation (MAD):

formula 5, Section II contains the derivation. - In the preferred embodiment all three images Freal, Fimag and I are transformed by the Anscombe transform (3), then the noise is estimated for all three images by the Median Absolute Deviation method (4). The Anscombe transformed images are transformed into wavelet space. The coefficients are shrinked by a value derived from the estimated standard deviation of the noise. Then the shrinked images are back-transformed from wavelet space and Anscombe back-transformed. The results are the filtered images Freal_filtered, Fimag_filtered and I_filtered.
- In the next step the phasor coefficients for all image pixels are calculated:

- In the last step a result image is calculated from the phasor coefficients. The calculation can be implemented similar to the SPLIT method in Lanzano et. al. (2015), Encoding and decoding spatio-temporal information for super-resolution microscopy, Nature Communications, 10.1038/ncomms7701 .
- It follows an explanation why the method according the present invention behaves superior to the prior art where the phasor G and S components are filtered.
Figure 1a shows a decay diagram with intensity I along theordinate 1 and arrival time t along theabscissa 2 with thegraph 3 for the photons originating from the center region of the focus of the excitation light.Figure 1b shows thegraph 6 for the photons originating from the region outside the center of the focus, where the de-excitation light is applied. The average arrival time of the photons originating from the region outside the center of the focus is lower than the average arrival time of the photons originating from the focus.Figure 1c shows thegraph 7 for all detected photons. In time gated STED anarrival time interval 8 is chosen (e.g. by gating) where the photons from the center region dominate. The photons detected before this interval are ignored. The signal 4 (seeFig. 1a ) with information about the center region is therefore lost. Only the part 5 (seeFig. 1a ) of the signal is used to generate the image. The time gated approach results in spatially better resolved but noisy images compared to the classical STED method. - Pixels with a decay only from the center region are located at
e.g. position 9 in the phasor plot (seeFig. 1d ). Photons from the outside are located at adistinct position 10 in the phasor plot. The idea behind the SPLIT method (prior art) is to apply a weight to the intensity of individual pixels depending on their location in the phasor plot. This results in a spatial resolution comparable to the time gated STED method but less noise since no counted photons are lost. -
Figure 2a visualizes simulated data for an average of 10 photon counts in an image pixel. The simulation assumes a mixture of 50% photons from the center area with 4n (4 nanoseconds)lifetime 11 and 50% photons from the outside with 200 ps (200 picoseconds)lifetime 12. The phasor coordinates 13 of 20 pixels are drawn. For high photon counts the position of the phasors has to be half way between the positions of the twocomponents -
Figure 2b shows the same simulated data when a 5 x 5 median filter symbolized by 16 is applied according to prior art. ForFigure 2c a 7 x 7 median filter symbolized by 17 has been used. Finallyfigure 2d shows the result when a wavelet filter according to an embodiment of the present invention is used (symbolized by 18). To achieve a comparable signal to noise ratio a 7 x 7 median filter is necessary. - A filter must in addition preserve the spatial resolution to be useful in STED applications. A simulation with two mixtures shows the behavior of the filters along an edge. In the simulation according
Figure 3a animage 19 was created with a mixture of 2/3 low resolved component and 1/3 high resolved component in theleft half 20. In the right half 211/3 low resolvedcomponent 2/3 high resolved component are simulated. 7 lines of 8 pixels in thecenter region 22 have been accumulated vertically and have been weighted with an intensity gradient along the line between the 4 ns and 200 ps position in the phasor. -
Figure 3b shows theintensity 23 for the 8 averaged pixels for optimal condition of very high photon counts. For the case of 10 counts per pixel the intensity for the 8 averaged pixels is shown for no filtering inFigure 3c ,median filter 7 x7 inFigure 3d and wavelet filter according the present invention in Figure 2e. - The wavelet filter according the present invention better preserves the spatial resolution (
Fig. 3e ) than the median filter according prior art (Fig. 3d ) with comparable signal to noise ratio (Fig. 2c and Fig. 2d ). - Advanced filters have been designed for similar noise characteristic in neighbor pixels. Such a filter fails when applied directly to the phasor components according prior art. Due to the division through the intensity in the phasor formulas the noise varies too much.
- Some or all of the method steps may be executed by (or using) a hardware apparatus, like for example, a processor, a microprocessor, a programmable computer or an electronic circuit.
- In some embodiments, one or more of the most important method steps may be executed by such an apparatus.
- Depending on certain implementation requirements, embodiments of the invention can be implemented in hardware or in software. The implementation can be performed using a non-transitory storage medium such as a digital storage medium, for example a floppy disc, a DVD, a Blu-Ray, a CD, a ROM, a PROM, and EPROM, an EEPROM or a FLASH memory, having electronically readable control signals stored thereon, which cooperate (or are capable of cooperating) with a programmable computer system such that the respective method is performed. Therefore, the digital storage medium may be computer readable.
- Some embodiments according to the invention comprise a data carrier having electronically readable control signals, which are capable of cooperating with a programmable computer system, such that one of the methods described herein is performed.
- Generally, embodiments of the present invention can be implemented as a computer program product with a program code, the program code being operative for performing one of the methods when the computer program product runs on a computer. The program code may, for example, be stored on a machine readable carrier.
- Other embodiments comprise the computer program for performing one of the methods described herein, stored on a machine readable carrier.
- In other words, an embodiment of the present invention is, therefore, a computer program having a program code for performing one of the methods described herein, when the computer program runs on a computer.
- A further embodiment of the present invention is, therefore, a storage medium (or a data carrier, or a computer-readable medium) comprising, stored thereon, the computer program for performing one of the methods described herein when it is performed by a processor. The data carrier, the digital storage medium or the recorded medium are typically tangible and/or non-transitionary. A further embodiment of the present invention is an apparatus as described herein comprising a processor and the storage medium.
- A further embodiment of the invention is, therefore, a data stream or a sequence of signals representing the computer program for performing one of the methods described herein. The data stream or the sequence of signals may, for example, be configured to be transferred via a data communication connection, for example, via the internet.
- A further embodiment comprises a processing means, for example, a computer or a programmable logic device, configured to, or adapted to, perform one of the methods described herein.
- A further embodiment comprises a computer having installed thereon the computer program for performing one of the methods described herein.
- A further embodiment according to the invention comprises an apparatus or a system configured to transfer (for example, electronically or optically) a computer program for performing one of the methods described herein to a receiver. The receiver may, for example, be a computer, a mobile device, a memory device or the like. The apparatus or system may, for example, comprise a file server for transferring the computer program to the receiver.
- In some embodiments, a programmable logic device (for example, a field programmable gate array) may be used to perform some or all of the functionalities of the methods described herein. In some embodiments, a field programmable gate array may cooperate with a microprocessor in order to perform one of the methods described herein. Generally, the methods are preferably performed by any hardware apparatus.
- In the following, preferred embodiments of the present application are provided:
A method for generating a result image, the method comprising the steps of: - a. acquiring a STED image of a sample, the STED image comprising pixels;
- b. calculating Fourier coefficients of photon arrival times for pixels of the STED image, resulting in real coefficients representing a first image and in imaginary coefficients representing a second image;
- c. deriving an intensity image from the STED image;
- d. applying a spatial filter to the first image, the second image and the intensity image resulting in respective filtered images;
- e. calculating an image G based on the filtered first image and the filtered intensity image;
- f. calculating an image S based on the filtered second image and the filtered intensity image; and
- g. calculating the result image based on the two images G and S.
- 2. The method of
embodiment 1, wherein acquiring the STED image comprises the steps of: - irradiating the sample with pulsed excitation light having a focus; and
- irradiating the sample with de-excitation light surrounding the central region of a focus.
- 3. The method of
embodiment
registering arrival times by at least two time-gates. - 4. The method according to one of the preceding embodiments, wherein the calculation of the Fourier coefficients comprises the calculation of the n-th order Fourier coefficients, wherein n is a pre-selected value.
- 5. The method according to one of the preceding embodiments, wherein the intensity image is derived from the STED image acquisition or from a calculation of intensity values from the number of registered photons for the pixels.
- 6. The method according to one of the preceding embodiments, wherein the image G is calculated based on dividing the filtered first image by the filtered intensity image.
- 7. The method according to one of the preceding embodiments, wherein the image S is calculated based on dividing the filtered second image by the filtered intensity image.
- 8. The method according to one of the preceding embodiments, further comprising the step of transforming the acquired STED image, the first image, the second image and/or the intensity image having a first noise distribution, e.g. a Poisson noise distribution, to a transformed image having a second noise distribution, e.g. a Gauss noise distribution, preferably before step d) of
claim 1 is executed and in particular executing the remaining method steps ofclaim 1 based on the transformed image. - 9. The method according to
embodiment 8, further comprising the step of back transforming the acquired STED image, the filtered first image, the filtered second image and/or the filtered intensity image after step d) ofclaim 1 is executed. - 10. The method according to one of the preceding embodiments, wherein the spatial filter is at least one of Anisotropic Diffusion, Total Variation de-noising, Maximum Entropy de-noising, Non-local-means and Wavelet de-noising.
- 11. A device being adapted to carry out the method according to one of the preceding embodiments, wherein the device is preferably a STED microscope or a STED scanning microscope.
- 12. A computer program comprising program code for, when executed on a processor, performing the method according to one of the
embodiments 1 to 10.
Claims (14)
- Method for generating a result image, the method comprising the steps of:a. acquiring a STED image of a sample, the STED image comprising pixels;b. calculating Fourier coefficients of photon arrival times for pixels of the STED image, resulting in real coefficients representing a first image and in imaginary coefficients representing a second image;c. deriving an intensity image from the STED image;d. preferably transforming the acquired STED image, the first image, the second image and/or the intensity image having a first noise distribution, e.g. a Poisson noise distribution, to a transformed image having a second noise distribution, e.g. a Gauss noise distribution, wherein the remaining method steps of claim 1 are executed based on the transformed image or transformed images;e. applying a spatial filter to the first image, the second image and the intensity image resulting in respective filtered images;f. after step e.) has been applied, calculating an image G based on the filtered first image and the filtered intensity image;g. after step e.) has been applied, calculating an image S based on the filtered second image and the filtered intensity image; andh. calculating the result image based on the two images G and S.
- Method of claim 1, wherein acquiring the STED image comprises the steps of:irradiating the sample with pulsed excitation light having a focus; andirradiating the sample with de-excitation light surrounding the central region of a focus.
- Method of claim 1 or 2, wherein acquiring the STED image further comprises:registering arrival times of detected fluorescence photons relative to an excitation pulse for each pixel separately and/orregistering arrival times by at least two time-gates.
- Method according to one of the preceding claims, wherein the calculation of the Fourier coefficients comprises the calculation of the n-th order Fourier coefficients, wherein n is a pre-selected value.
- Method according to one of the preceding claims, wherein the intensity image is derived from the STED image acquisition or from a calculation of intensity values from the number of registered photons for the pixels.
- Method according to one of the preceding claims, wherein the image G is calculated based on dividing the filtered first image by the filtered intensity image.
- Method according to one of the preceding claims, wherein the image S is calculated based on dividing the filtered second image by the filtered intensity image.
- Method according to one of the preceding claims, further comprising the step of back transforming the acquired STED image, the filtered first image, the filtered second image and/or the filtered intensity image after step e) of claim 1 is executed.
- Method according to one of the preceding claims, wherein the spatial filter is a de-noising filter.
- Method according to one of the preceding claims, wherein the spatial filter is at least one of Anisotropic Diffusion, Total Variation de-noising, Maximum Entropy de-noising, Non-local-means and Wavelet de-noising.
- Method according to one of the preceding claims, wherein the STED image of the sample is acquired by irradiating the sample with pulsed excitation light having a focus, and irradiating the sample with de-excitation light surrounding the central region of a focus.
- Method according to one of the preceding claims, comprising the additional step of detecting photon arrival times relative to excitation pulses of the excitation light.
- Device being adapted to carry out the method according to one of the preceding claims, wherein the device is preferably a STED microscope or a STED scanning microscope.
- Computer program comprising program code for, when executed on a processor, performing the method according to one of the claims 1 to 12.
Applications Claiming Priority (3)
| Application Number | Priority Date | Filing Date | Title |
|---|---|---|---|
| EP19202285 | 2019-10-09 | ||
| PCT/EP2020/078317 WO2021069611A1 (en) | 2019-10-09 | 2020-10-08 | Sted microscopy method with improved signal to noise ratio in low photon count imaging conditions |
| EP20796485.9A EP3987275B1 (en) | 2019-10-09 | 2020-10-08 | Sted microscopy method with improved signal to noise ratio in low photon count imaging conditions |
Related Parent Applications (1)
| Application Number | Title | Priority Date | Filing Date |
|---|---|---|---|
| EP20796485.9A Division EP3987275B1 (en) | 2019-10-09 | 2020-10-08 | Sted microscopy method with improved signal to noise ratio in low photon count imaging conditions |
Publications (1)
| Publication Number | Publication Date |
|---|---|
| EP4124850A1 true EP4124850A1 (en) | 2023-02-01 |
Family
ID=68295938
Family Applications (2)
| Application Number | Title | Priority Date | Filing Date |
|---|---|---|---|
| EP22189501.4A Withdrawn EP4124850A1 (en) | 2019-10-09 | 2020-10-08 | Sted microscopy method with improved signal to noise ratio in low photon count imaging conditions |
| EP20796485.9A Active EP3987275B1 (en) | 2019-10-09 | 2020-10-08 | Sted microscopy method with improved signal to noise ratio in low photon count imaging conditions |
Family Applications After (1)
| Application Number | Title | Priority Date | Filing Date |
|---|---|---|---|
| EP20796485.9A Active EP3987275B1 (en) | 2019-10-09 | 2020-10-08 | Sted microscopy method with improved signal to noise ratio in low photon count imaging conditions |
Country Status (6)
| Country | Link |
|---|---|
| US (1) | US12243194B2 (en) |
| EP (2) | EP4124850A1 (en) |
| JP (1) | JP7638976B2 (en) |
| CN (1) | CN114556090B (en) |
| DE (1) | DE202020005737U1 (en) |
| WO (1) | WO2021069611A1 (en) |
Cited By (1)
| Publication number | Priority date | Publication date | Assignee | Title |
|---|---|---|---|---|
| CN116862919A (en) * | 2023-09-05 | 2023-10-10 | 武汉工程大学 | Line structure light center extraction method and device based on Gaussian super Laplace distribution |
Families Citing this family (3)
| Publication number | Priority date | Publication date | Assignee | Title |
|---|---|---|---|---|
| CN114119400B (en) * | 2021-11-22 | 2024-09-24 | 武汉大学 | Single photon counting image combined denoising and super-resolution convolution network method |
| EP4643303A1 (en) * | 2022-12-27 | 2025-11-05 | 10X Genomics, Inc. | Systems and methods for tissue bounds detection |
| CN117783070B (en) * | 2023-12-27 | 2025-01-14 | 深圳大学 | Fluorescent signal coding super-resolution microscopic imaging method |
Citations (2)
| Publication number | Priority date | Publication date | Assignee | Title |
|---|---|---|---|---|
| EP0801759B1 (en) | 1994-02-01 | 2001-08-08 | Stefan Dr. Hell | Process and device for optically measuring a point on a sample with high local resolution |
| US9551658B2 (en) | 2010-11-22 | 2017-01-24 | Max-Planck-Gesellschaft Zur Foerderung Der Wissenschaften E.V. | STED microscopy with pulsed excitation, continuous stimulation, and gated registration of spontaneously emitted fluorescence light |
Family Cites Families (11)
| Publication number | Priority date | Publication date | Assignee | Title |
|---|---|---|---|---|
| US9551A (en) | 1853-01-18 | Improvement in seed-planters | ||
| US658A (en) | 1838-03-26 | Machine fob pricking leatpier preparatory to stitching | ||
| US7590801B1 (en) | 2004-02-12 | 2009-09-15 | Netapp, Inc. | Identifying suspect disks |
| US20090175535A1 (en) * | 2008-01-09 | 2009-07-09 | Lockheed Martin Corporation | Improved processing of multi-color images for detection and classification |
| US10222335B2 (en) | 2010-10-27 | 2019-03-05 | The Regents Of The University Of California | Phasor method to fluorescence lifetime microscopy to discriminate metabolic state of cells in living tissue |
| CN102313723B (en) * | 2011-06-20 | 2014-06-25 | 河海大学 | Imaging method and device combining polarized light excitation microscopy with super-resolution reconstruction |
| AU2012258412A1 (en) | 2012-11-30 | 2014-06-19 | Canon Kabushiki Kaisha | Combining differential images by inverse Riesz transformation |
| CN105631820A (en) * | 2015-12-25 | 2016-06-01 | 浙江工业大学 | Medical ultrasonic image denoising method based on wavelet transform and trilateral filter |
| WO2018089383A1 (en) * | 2016-11-08 | 2018-05-17 | University Of Southern California | A hyperspectral imaging system |
| CN106772430B (en) * | 2016-12-30 | 2019-05-07 | 南京理工大学 | Single-pixel photon counting 3D imaging system and method based on multi-resolution wavelet approximation |
| CN109523488A (en) * | 2018-11-23 | 2019-03-26 | 南京邮电大学 | A kind of radioscopic image noise-reduction method carrying out blind source separating in Anscombe transform domain based on image sequence |
-
2020
- 2020-10-08 EP EP22189501.4A patent/EP4124850A1/en not_active Withdrawn
- 2020-10-08 EP EP20796485.9A patent/EP3987275B1/en active Active
- 2020-10-08 WO PCT/EP2020/078317 patent/WO2021069611A1/en not_active Ceased
- 2020-10-08 US US17/636,035 patent/US12243194B2/en active Active
- 2020-10-08 CN CN202080070738.9A patent/CN114556090B/en active Active
- 2020-10-08 DE DE202020005737.1U patent/DE202020005737U1/en active Active
- 2020-10-08 JP JP2022521556A patent/JP7638976B2/en active Active
Patent Citations (2)
| Publication number | Priority date | Publication date | Assignee | Title |
|---|---|---|---|---|
| EP0801759B1 (en) | 1994-02-01 | 2001-08-08 | Stefan Dr. Hell | Process and device for optically measuring a point on a sample with high local resolution |
| US9551658B2 (en) | 2010-11-22 | 2017-01-24 | Max-Planck-Gesellschaft Zur Foerderung Der Wissenschaften E.V. | STED microscopy with pulsed excitation, continuous stimulation, and gated registration of spontaneously emitted fluorescence light |
Non-Patent Citations (4)
| Title |
|---|
| DIGMAN: "Fluorescence Lifetime Spectroscopy and Imaging: Principles and Applications in Biomedical Diagnostics", 2012, CRC PRESS, article "The phasor approach to fluorescence lifetime imaging: exploiting phasor linear properties" |
| LANZANO: "Encoding and decoding spatio-temporal information for super-resolution microscopy", NATURE COMMUNICATIONS, vol. 6, 2015, pages 6701, XP055481110, DOI: 10.1038/ncomms7701 |
| SENDUR, L.SELESNICK, I., BIVARIATE SHRINKAGE WITH LOCAL VARIANCE ESTIMATION, SIGNAL PROCESSING LETTERS, IEEE., vol. 9, 2003, pages 438 - 441 |
| SUN YUANSHENG ET AL: "A novel pulsed STED microscopy method using FastFLIM and the phasor plots", PROGRESS IN BIOMEDICAL OPTICS AND IMAGING, SPIE - INTERNATIONAL SOCIETY FOR OPTICAL ENGINEERING, BELLINGHAM, WA, US, vol. 10069, 21 February 2017 (2017-02-21), pages 100691C - 100691C, XP060086016, ISSN: 1605-7422, ISBN: 978-1-5106-0027-0, DOI: 10.1117/12.2267880 * |
Cited By (2)
| Publication number | Priority date | Publication date | Assignee | Title |
|---|---|---|---|---|
| CN116862919A (en) * | 2023-09-05 | 2023-10-10 | 武汉工程大学 | Line structure light center extraction method and device based on Gaussian super Laplace distribution |
| CN116862919B (en) * | 2023-09-05 | 2023-12-05 | 武汉工程大学 | Line structure light center extraction method and device based on Gaussian super Laplace distribution |
Also Published As
| Publication number | Publication date |
|---|---|
| EP3987275B1 (en) | 2022-08-10 |
| US20220343467A1 (en) | 2022-10-27 |
| JP2022551174A (en) | 2022-12-07 |
| US12243194B2 (en) | 2025-03-04 |
| WO2021069611A1 (en) | 2021-04-15 |
| CN114556090B (en) | 2025-12-30 |
| EP3987275A1 (en) | 2022-04-27 |
| CN114556090A (en) | 2022-05-27 |
| DE202020005737U1 (en) | 2022-04-20 |
| JP7638976B2 (en) | 2025-03-04 |
Similar Documents
| Publication | Publication Date | Title |
|---|---|---|
| US12243194B2 (en) | STED microscopy method with improved signal to noise ratio in low photon count imaging conditions | |
| AU2019350918B2 (en) | Apparatus and method for image processing, and system for training neural network | |
| Julliand et al. | Image noise and digital image forensics | |
| DeForest | Noise-gating to clean astrophysical image data | |
| CN103098089A (en) | Method for generating super-resolution images and nonlinear digital filter for implementing the method | |
| EP3994516B1 (en) | System and method for generating an image | |
| US11927659B2 (en) | Method and apparatus for frequency drift correction of magnetic resonance CEST imaging, and medium and imaging device | |
| EP3115931B1 (en) | Method and device for detecting road dividing object as well as relevant program and non-transitory computer-readable medium | |
| Liu et al. | Continuous background correction using effective points selected in third-order minima segments in low-cost laser-induced breakdown spectroscopy without intensified CCD | |
| Sahu et al. | Minimum time delay and more efficient image filtering brain tumour detection with the help of MATLAB | |
| CA3062318C (en) | Electron imaging method and system | |
| Nanmaran et al. | Design and development of decorrelation stretch technique for enhancing the quality of satellite images with improved MSE and UIQI in comparison with wiener filter | |
| EP3782136B1 (en) | Method for the verification of a luminescent-material-based security feature | |
| Hung et al. | An utilization of edge detection in a modified bicubic interpolation used for frame enhancement in a camera-based traffic monitoring | |
| Qin | Blind image restoration based on Wiener filtering and defocus point spread function estimation | |
| Li et al. | High order extrapolation using Taylor series for color filter array demosaicing | |
| Zhang et al. | High-resolution three-dimensional active imaging with uniform distance resolution | |
| Kockentiedt et al. | Poisson shot noise parameter estimation from a single scanning electron microscopy image | |
| Dogan et al. | Auto-focusing with multi focus color image fusion based on curvelet transform on microscopic imaging | |
| EP2408210A2 (en) | Cross-color image processing systems and methods for sharpness enhancement | |
| Azizi et al. | Cross‐channel regularisation for joint demosaicking and intrinsic lens deblurring | |
| CN113272897A (en) | Noise reduction filter for signal processing | |
| Tang et al. | An Adaptive Fuzzy Contrast Enhancement Algorithm with Details Preserving. | |
| EP4675551A1 (en) | Device and method for unmixing images | |
| Kerouh et al. | A blur kernel estimation method based on the multiplicative multiresolution decomposition (mmd) |
Legal Events
| Date | Code | Title | Description |
|---|---|---|---|
| PUAI | Public reference made under article 153(3) epc to a published international application that has entered the european phase |
Free format text: ORIGINAL CODE: 0009012 |
|
| STAA | Information on the status of an ep patent application or granted ep patent |
Free format text: STATUS: THE APPLICATION HAS BEEN PUBLISHED |
|
| AC | Divisional application: reference to earlier application |
Ref document number: 3987275 Country of ref document: EP Kind code of ref document: P |
|
| AK | Designated contracting states |
Kind code of ref document: A1 Designated state(s): AL AT BE BG CH CY CZ DE DK EE ES FI FR GB GR HR HU IE IS IT LI LT LU LV MC MK MT NL NO PL PT RO RS SE SI SK SM TR |
|
| P01 | Opt-out of the competence of the unified patent court (upc) registered |
Effective date: 20230414 |
|
| STAA | Information on the status of an ep patent application or granted ep patent |
Free format text: STATUS: REQUEST FOR EXAMINATION WAS MADE |
|
| 17P | Request for examination filed |
Effective date: 20230801 |
|
| RBV | Designated contracting states (corrected) |
Designated state(s): AL AT BE BG CH CY CZ DE DK EE ES FI FR GB GR HR HU IE IS IT LI LT LU LV MC MK MT NL NO PL PT RO RS SE SI SK SM TR |
|
| STAA | Information on the status of an ep patent application or granted ep patent |
Free format text: STATUS: EXAMINATION IS IN PROGRESS |
|
| 17Q | First examination report despatched |
Effective date: 20240227 |
|
| STAA | Information on the status of an ep patent application or granted ep patent |
Free format text: STATUS: THE APPLICATION IS DEEMED TO BE WITHDRAWN |
|
| 18D | Application deemed to be withdrawn |
Effective date: 20240828 |