EP4120158B1 - Control system for optimizing energy management in production processes of plants or industrial sites or measuring system for automated measuring of co2e quantification measures - Google Patents
Control system for optimizing energy management in production processes of plants or industrial sites or measuring system for automated measuring of co2e quantification measures Download PDFInfo
- Publication number
- EP4120158B1 EP4120158B1 EP21185050.8A EP21185050A EP4120158B1 EP 4120158 B1 EP4120158 B1 EP 4120158B1 EP 21185050 A EP21185050 A EP 21185050A EP 4120158 B1 EP4120158 B1 EP 4120158B1
- Authority
- EP
- European Patent Office
- Prior art keywords
- industrial site
- control device
- product
- industrial
- footprint
- Prior art date
- Legal status (The legal status is an assumption and is not a legal conclusion. Google has not performed a legal analysis and makes no representation as to the accuracy of the status listed.)
- Active
Links
Images


Classifications
-
- G—PHYSICS
- G06—COMPUTING OR CALCULATING; COUNTING
- G06Q—INFORMATION AND COMMUNICATION TECHNOLOGY [ICT] SPECIALLY ADAPTED FOR ADMINISTRATIVE, COMMERCIAL, FINANCIAL, MANAGERIAL OR SUPERVISORY PURPOSES; SYSTEMS OR METHODS SPECIALLY ADAPTED FOR ADMINISTRATIVE, COMMERCIAL, FINANCIAL, MANAGERIAL OR SUPERVISORY PURPOSES, NOT OTHERWISE PROVIDED FOR
- G06Q10/00—Administration; Management
- G06Q10/06—Resources, workflows, human or project management; Enterprise or organisation planning; Enterprise or organisation modelling
- G06Q10/063—Operations research, analysis or management
- G06Q10/0639—Performance analysis of employees; Performance analysis of enterprise or organisation operations
-
- G—PHYSICS
- G05—CONTROLLING; REGULATING
- G05B—CONTROL OR REGULATING SYSTEMS IN GENERAL; FUNCTIONAL ELEMENTS OF SUCH SYSTEMS; MONITORING OR TESTING ARRANGEMENTS FOR SUCH SYSTEMS OR ELEMENTS
- G05B19/00—Program-control systems
- G05B19/02—Program-control systems electric
- G05B19/04—Program control other than numerical control, i.e. in sequence controllers or logic controllers
- G05B19/05—Programmable logic controllers, e.g. simulating logic interconnections of signals according to ladder diagrams or function charts
- G05B19/058—Safety, monitoring
-
- G—PHYSICS
- G05—CONTROLLING; REGULATING
- G05B—CONTROL OR REGULATING SYSTEMS IN GENERAL; FUNCTIONAL ELEMENTS OF SUCH SYSTEMS; MONITORING OR TESTING ARRANGEMENTS FOR SUCH SYSTEMS OR ELEMENTS
- G05B19/00—Program-control systems
- G05B19/02—Program-control systems electric
- G05B19/04—Program control other than numerical control, i.e. in sequence controllers or logic controllers
- G05B19/05—Programmable logic controllers, e.g. simulating logic interconnections of signals according to ladder diagrams or function charts
- G05B19/054—Input/output
-
- G—PHYSICS
- G06—COMPUTING OR CALCULATING; COUNTING
- G06Q—INFORMATION AND COMMUNICATION TECHNOLOGY [ICT] SPECIALLY ADAPTED FOR ADMINISTRATIVE, COMMERCIAL, FINANCIAL, MANAGERIAL OR SUPERVISORY PURPOSES; SYSTEMS OR METHODS SPECIALLY ADAPTED FOR ADMINISTRATIVE, COMMERCIAL, FINANCIAL, MANAGERIAL OR SUPERVISORY PURPOSES, NOT OTHERWISE PROVIDED FOR
- G06Q10/00—Administration; Management
- G06Q10/06—Resources, workflows, human or project management; Enterprise or organisation planning; Enterprise or organisation modelling
- G06Q10/063—Operations research, analysis or management
- G06Q10/0637—Strategic management or analysis, e.g. setting a goal or target of an organisation; Planning actions based on goals; Analysis or evaluation of effectiveness of goals
- G06Q10/06375—Prediction of business process outcome or impact based on a proposed change
-
- G—PHYSICS
- G06—COMPUTING OR CALCULATING; COUNTING
- G06Q—INFORMATION AND COMMUNICATION TECHNOLOGY [ICT] SPECIALLY ADAPTED FOR ADMINISTRATIVE, COMMERCIAL, FINANCIAL, MANAGERIAL OR SUPERVISORY PURPOSES; SYSTEMS OR METHODS SPECIALLY ADAPTED FOR ADMINISTRATIVE, COMMERCIAL, FINANCIAL, MANAGERIAL OR SUPERVISORY PURPOSES, NOT OTHERWISE PROVIDED FOR
- G06Q30/00—Commerce
- G06Q30/018—Certifying business or products
-
- G—PHYSICS
- G06—COMPUTING OR CALCULATING; COUNTING
- G06Q—INFORMATION AND COMMUNICATION TECHNOLOGY [ICT] SPECIALLY ADAPTED FOR ADMINISTRATIVE, COMMERCIAL, FINANCIAL, MANAGERIAL OR SUPERVISORY PURPOSES; SYSTEMS OR METHODS SPECIALLY ADAPTED FOR ADMINISTRATIVE, COMMERCIAL, FINANCIAL, MANAGERIAL OR SUPERVISORY PURPOSES, NOT OTHERWISE PROVIDED FOR
- G06Q50/00—Information and communication technology [ICT] specially adapted for implementation of business processes of specific business sectors, e.g. utilities or tourism
- G06Q50/04—Manufacturing
-
- Y—GENERAL TAGGING OF NEW TECHNOLOGICAL DEVELOPMENTS; GENERAL TAGGING OF CROSS-SECTIONAL TECHNOLOGIES SPANNING OVER SEVERAL SECTIONS OF THE IPC; TECHNICAL SUBJECTS COVERED BY FORMER USPC CROSS-REFERENCE ART COLLECTIONS [XRACs] AND DIGESTS
- Y02—TECHNOLOGIES OR APPLICATIONS FOR MITIGATION OR ADAPTATION AGAINST CLIMATE CHANGE
- Y02P—CLIMATE CHANGE MITIGATION TECHNOLOGIES IN THE PRODUCTION OR PROCESSING OF GOODS
- Y02P90/00—Enabling technologies with a potential contribution to greenhouse gas [GHG] emissions mitigation
- Y02P90/80—Management or planning
- Y02P90/84—Greenhouse gas [GHG] management systems
Definitions
- the present invention relates in general to control devices optimizing of energy management in production processes of plants or industrial sites by optimizing both electric and thermal energy in such a manner as to achieve desirable overall performance and in particular to control devices, optimizing evaluation of energy management in production processes of the plants or industrial sites, that improve energy facility efficiency and are applicable in technical areas (e.g., production processes), manufacturing industry (e.g., factories, plants, process lines), and tertiary areas ( e.g., buildings, transportation etc.) for which it is desirable to reduce at least one of energy supply cost, CO 2 ( carbon dioxide) emission, and primary energy consumption. Further, it relates to control and measuring systems directed to the measurement of CO 2 e quantification measures.
- the fluxes of greenhouse gases are responsible for the increase in temperature, which will lead to higher drought stress for crops due to increased evapo-transpiration combined with a more uneven distribution of rainfall events.
- SM competitive sustainable manufacturing
- Increasing energy and commodity prices with resource scarcity, government legislation and consumer pressure are driving environmentally conscious business strategy to gain sustainable advantage through effective energy product management. Rising energy and labour costs further continue to increase the pressure to innovate.
- GOG energy consumption and greenhouse gas
- the food industry is divided into several sectors.
- the wheat processing sector is considered as one of the most energy-intensive industry consumer because it requires high and regular energy supply.
- electricity accounts for almost 75% of total energy use and over 90% of energy costs with a consumption that varies between 361 MJ/t and 1186 MJ/t.
- inefficient energy use could lead to huge economic losses as excessive energy consumption adds to the costs of the goods produced.
- There are huge efforts for energy efficiency on food industry and wheat production focus mainly on marketing, production planning or quality of product.
- prior art systems related to optimizing energy consumption in this industry do not provide an adequate tool for energy management.
- grain legumes such as peas or beans
- Grain legumes such as peas with a carbon footprint of 0.49 kg CO 2 e/kg pea
- GOG greenhouse gas
- Pea-based protein has proved to be very well suited for the fortification of pasta products and the improvement of techno-functional and sensorial properties, and thus could very well substitute animal-based ingredients of processed foods.
- GWP global warming potential
- CO 2 carbon dioxide
- GOG greenhouse gas
- the primary greenhouse gases in Earth's atmosphere are water vapor (H 2 O), carbon dioxide (CO 2 ), methane (CH 4 ), nitrous oxide (N 2 O, i.e. laughing gas), and ozone (03). Without greenhouse gases, the average temperature of Earth's surface would be about -18 °C, rather than the present average of 15 °C.
- US 2011/0144791 A1 shows a system for control, monitoring and recording of incoming chemical and power use, and emissions of electronic device manufacturing systems. According to US 2011/0144791 A1 , the system is focused on so called sub-fab equipment which shall typically do not have monitoring data for energy consumption and/or energy savings.
- the sub-fab equipment can comprise auxiliary devices as abatement tools, AC power distributors, primary vacuum pumps, spare vacuum pumps, water pumps, chillers, heat exchangers, process cooling water supplies and delivery sys-tems, electrical power supplies and delivery systems, inert gas dumps, valves, device controllers, clean dry air supplies and delivery systems, ambient air supplies and delivery sys-tems, inert gas supplies and delivery systems, fuel supplies and delivery systems, touch screens, process logic control-lers, reagent supplies and delivery systems, etc.
- auxiliary devices as abatement tools
- AC power distributors primary vacuum pumps
- spare vacuum pumps water pumps
- chillers chillers
- heat exchangers process cooling water supplies and delivery sys-tems
- electrical power supplies and delivery systems electrical power supplies and delivery systems
- inert gas dumps valves, device controllers
- clean dry air supplies and delivery systems ambient air supplies and delivery sys-tems
- inert gas supplies and delivery systems fuel supplies and delivery systems, touch screens, process logic control-
- the system is able to capture different depths of energy savings modes such as idle (shallow energy savings where production equipment can recover to normal production with no quality or throughput impact in seconds), sleep (deeper energy sav-ings where production equipment can recover in minutes), or hibernate (where production equipment may require hours to recover not to have impact on quality, or throughput).
- the system is also able to monitor and display all gas emissions in a sub-fab as well as the Semi S23 method reporting of CO2 equivalent emission.
- the system can monitor effluent process gases and energy use from a certain process tool and sub-fab equipment. Therefore, in principle, the system of US 2011/0144791 A1 proposes distinct measurements and monitoring at the different sub-fab equipment, to capture or measure the overall monitoring and recording of incoming chemical and power use of the complete fab-system.
- the above-mentioned objects related to optimizing energy consumption control and monitoring of an industrial site and measurement of a CO 2 -footprint of an industrial site and/or of a product manufactured or processed by said industrial site by means of a control device are achieved, particularly, in that the industrial site comprises one or more processing units for processing or manufacturing one or more products, said control device comprising an input section comprising measuring devices and sensors capturing measuring parameters at the processing units and/or environmental measuring parameters associated with the industrial site, input/output interfaces and data transmission lines/networks to transfer the measured parameters to the control device, in that the input section is configured to capture and/or monitor and/or record predefined measuring parameters triggering in the data-pathways of the measuring devices and sensors for the generation of value settings for optimizing the control and steering of the energy management of the industrial site, in that the monitored measuring parameters comprise parameter vectors wherein the parameter values of the parameter vectors are time series of parameter values changeable over an entire predetermined operation period, and/or parameter scalars, wherein the parameter values of the
- the invention has, inter alia, the advantage that it enables to provide an intelligent control system with all the data required providing automated and certified CO 2 e quantification that allows to integrate competitor and/or partner equipment, alike.
- the system automatically collects the required data, processes the measured and captured data and generates a site CO 2 footprint.
- the system further is able to process the captured and measured data and generates a product and/or plant and/or industrial site CO 2 intensity.
- the system further can automatically provide improvement appropriate measures considering cost and/or measures and/or impacts.
- the system is further able to generate added values through combination of sensors, intelligent control system, CO 2 e quantification with process and sustainability knowledge. Further, it is able to provide third party certificates, as e.g. ISO Certificate.
- the system can provide controlled and secured access for customers/users to certificates e.g. based on an identification number or other authentication mechanisms.
- the system can provide a dynamic line configuration for the industrial site to optimize energy management.
- the system is able to ink to raw material database, logistics and key process parameters in a new inventive way.
- the system may also provide quality / CO 2 e an unique, protected label that proves CO 2 e certification.
- it allows certified measurements in accordance with any technical requirements or regulatory standards, as e.g., given by the standards of the Greenhouse Gas Protocol initiated by the World Resources Institute (WRI) and the World Business Council for Sustainable Development (WBCSD).
- WRI Greenhouse Gas Protocol initiated by the World Resources Institute
- WBCSD World Business Council for Sustainable Development
- the system can integrate block-chain technology to provide said certifications or a trusted lawyer interaction.
- the integration of the block-chain technology allows the implementation of a controlled multi-layer trust structure in order to operate the inventive control system as a system of trust.
- the design of the used blockchain technology allows to incorporate three interacting trust layers: a social layer capturing the way actors interact with one another and determine how much information they need, and in what form in order to be able to trust and take action on the basis of the trusted information, e.g.
- the CO 2 e certification a records or data layer that supplies the information that the actors have decided they need to obtain from the control system to give them confidence to act; and a technical layer, capturing the technical means by which the actors interact and create, store and obtain information about those interactions as tamper-resistant and non-repudiable proof of facts about acts, i.e. the CO 2 e measurement.
- the primary focus of the present invention is on the records layer; however, to understand this layer, and the means by which the CO 2 e certification can be managed by the implemented blockchain-based records effectively, it is important to understand the other two layers and, to some extent, how the layers interact with one another in the design and operation of blockchain systems.
- Figure 1 illustrates, schematically, an architecture for a possible implementation of the inventive method and system, in particular for the claimed inventive control device 10 for optimizing energy consumption control and monitoring of an industrial site 1 and/or measurement of a CO 2 -footprint of an industrial site 1 and of a product 2 manufactured or processed by said industrial site 1.
- the CO 2 -footprint can capture not only the manufacturing or processing process at a specific site, but can comprises and cover the complete production chain of an industrial product 2, e.g. from the sowing, crop, raw material processing, transport, industrial processing, or manufacturing, up to the delivery transport, thus covering all aspects of the production of an industrial product including transport and packing etc.
- the term industrial site 1 is used in a wider definition comprising all technical means for processing and providing an industrial product the mining or cultivation of raw material to the end product 2.
- the measurement of the CO 2 -footprint can also be limited to a specific industrial plant, production line, or manufacturing process providing only a partial step in the overall industrial production chain of the product 2.
- the industrial site can e.g. comprise at least one industrial plant and/or processing line and/or production facility/equipment.
- the industrial site 1 comprises one or more processing units 12 for processing or manufacturing one or more products 2
- the control device 10 comprises an input section 101 comprising measuring devices and sensors 13 capturing measuring parameters at the processing units 12 and/or environmental measuring parameters associated with the industrial site 1, input/output interfaces 1011 and data transmission lines/networks 1012 to transfer the measured parameters to the control device 10.
- the industrial site 1 can further also comprise one or more process lines 11 comprising at least one processing unit 12 for processing or manufacturing the products 2. It is important to note that the optimization of energy consumption of an industrial site 1 and the measurement of the CO 2 -footprint of the respective industrial site 1 and/or of a product 2 manufactured or processed by the industrial site 1, can be decoupled technical aspects.
- the measured CO 2 -footprint and optimizing of the energy consumption do not need to have a direct relationship.
- the control device 10 can e.g. comprise at least one programmable logic controller (PLC) or programmable controller associated with the industrial site as automation controllers adapted for the control of a manufacturing process or product processing process at the industrial site, the PLC input and output devices (I/O) realized as in-house integral with a data processor or rack-mounted as modular devices with I/O devices.
- PLC programmable logic controller
- I/O input and output devices
- the PLCs of the industrial site can e.g. be connected over a data transmission network 4 to a supervisory control and data acquisition (SCADA) system of the control device providing programming and process fault diagnosis of processing units of the industrial site.
- SCADA supervisory control and data acquisition
- the input section 101 captures and/or monitors and/or records predefined measuring parameters 134 triggering in the data-pathways of the measuring devices and sensors 13 for the generation of value settings for optimizing the control and steering of the energy management of the industrial site 1.
- the monitored measuring parameters 134 comprise parameter vectors wherein the parameter values of the parameter vectors are time series of parameter values changeable over an entire predetermined operation period, and/or parameter scalars, wherein the parameter values of the parameter scalars do not change throughout the entire operation period, and constructional parameters, wherein the constructional parameter values represent structural characteristics of the industrial site 1.
- a product CO 2 e quantification measure value 21 is generated measuring a CO 2 e intensity 22 of a product 2 processed or manufactured by the industrial site 1 and/or an industrial site CO 2 e quantification measure value 141 is generated measuring a quantified CO 2 e footprint 14 of the industrial site 1.
- the CO 2 e quantification measure value 21 can e.g. be generated by the control device 10 or by a dedicated CO 2 e quantification module 107 of the control device 10.
- the term "module,” as used herein, refers to logic embodied in hardware or firmware, or to a collection of software instructions, written in a programming language. In one embodiment, the program language may be Java, C, or assembly.
- One or more software instructions in the modules may be embedded in firmware, such as in an EPROM.
- the modules described herein may be implemented as either software and/or hardware modules and may be stored in any type of non-transitory computer-readable storage medium or other storage device. Some nonlimiting examples of non-transi-tory computer-readable storage medium include CDs, DVDs, flash memory, and hard disk drives.
- the control device 10 can e.g. provide optimized improvement measures by mutual weighing impact of varying cost parameters and possible improvement measures.
- the control device 10 can e.g. provide a dynamically adapted line configuration based on the optimized improvement measures.
- the control device 10 can further comprise a carbon footprint inventory system 108.
- the carbon footprint inventory system 108 can further includes an interface and/or data capturing module, a setting module, a selecting module, a determining module, a notifying module, a data processing module, a displaying module, and a verifying module.
- the modules may comprise computerized instructions in the form of one or more programs that are stored in the storage device and executed by the at least one processor.
- the storage device may be an internal storage system, such as a random-access memory (RAM) for temporary storage of information, and/or a read only memory (ROM) for permanent storage of information.
- the storage device may also be an external storage system, such as an external hard disk, a storage card, or a data storage medium.
- the interface receives an inventory procedure of the product or industrial plant/site e.g. selected via a graphical user interface (GUI), and executes an inventory process of the product or industrial plant/site.
- the inventory procedure can e.g. include a first inventory, a reference template inventory, and/or a historical reference inventory of the product or industrial plant/site.
- the first setting module can e.g.
- the interface receives the standard units, such as a quality unit and a volume unit, for example, and the parameters, such as life cycle assessment (LCA) parameters and GWP parameters, for example, which are input in the inventory procedures.
- the interface receives a template selected by the user. Different industries may apply different templates.
- the interface loads the standard units and the parameters of the reference template inventory e.g. from the storage device to offer the user various reference selections in the inventory processes.
- the interface receives a historical reference inventory and inventory structure selected by the user.
- the interface copies the standard units and the parameters of the historical reference inventory and inventory structure providing the same reference selections for approval by the user and/or as predefined or start setting.
- the first setting module sets inventory targets of the carbon footprint inventory of the product.
- the inventory targets can e.g. comprise an inventory project, certain inventory criteria, an organization of the product or industrial plant/site, an inventory period.
- the inventory project is "alloy production”
- one of the inventory criteria is denoted by the reference "Carat 400 Cell” i.e. the die casting machine, and given by its structure
- the inventory target may e.g.
- the organization may be a steel company.
- a specific product of a production site can e.g. be selected by means of the selecting module according to the inventory targets, and loads material data of the product.
- the selecting module can e.g. select a particular alloy as the product e.g. according to a demand of the user.
- the selecting module loads the material data of the product from a dedicated database.
- the material data may include a list of materials in the product, and, in relation to each material, e.g.
- All the materials of the product can e.g. be displayed by the selecting module displays on a display device according to a tree diagram or another suitable graphical representation.
- the selecting module may further load an image of the product for a reference.
- the determining module determines materials of the product e.g. according to a weight analysis of each material and a CO 2 e analysis of each material.
- the product includes a plurality of materials, and the weight of each material may be different.
- the determining module determines a weight proportion which is a proportion of the weight of each material to the total weight of the product according to the weight analysis of each material and picks the materials with greater weight proportions to avoid wasting time on materials with less, or insignificant, weight proportions.
- the determining module can e.g. perform the same steps for the production cycle in situ etc..
- the determining module determines a CO 2 e proportion which is a proportion of the CO 2 e exhausted from each material to the total CO 2 e exhausted from the product in the life cycle according to the CO 2 e analysis of each material and the production process.
- the notifying module may generate an appropriate notice to a vendor of a material participating in the carbon footprint inventory, if the required data are not available, and requests the vendor to inventory the CO 2 e data of the material.
- the materials may include more or less relevant materials, where a more relevant material is a material whose CO 2 e proportion reaches a larger proportion, one percent, for example, than a less relevant material.
- the CO 2 e proportion is a proportion of the CO 2 e exhausted from each material in relation to the total CO 2 e exhausted from the product in the life cycle.
- the priority of more relevant materials is higher than the priority of less relevant materials.
- the priority of a material with greater CO 2 e proportion is higher than the priority of a material with less CO 2 e proportion.
- the control device 10 generates the CO2e of a product or an industrial plat/site according to the condition and characteristics parameters of the setting of the process line 11 and/or processing units 12 of the carbon footprint inventory and/or the priority of the used materials.
- the control device 10 generates any uncertainties or imponderables of the CO 2 e of the product or industrial plant/site according to a generation structure generating such uncertainties or imponderables.
- This structure can e.g. comprise machine-learning-based or artificial-intelligence based units being trained based on historical data e.g. of optimized running processing units 12.
- the generation structure for generating the carbon footprint can e.g.
- the activity level data includes material activity level data, power activity level data, and waste activity level data.
- the units of the activity level data may be a kilogram, a cubic meter, a kilowatt, a kilometer, for example.
- the exhausting factor is the CO 2 e of the activity level data in each unit.
- the CO 2 e of the product in life cycle is one point five kilogram, the result of multiplying fifteen by zero point one.
- Generating uncertainties in relation to the CO 2 e of the product or industrial plat/site is to take account of any uncertainties in a result of a CO 2 e value generation and minimize the effects of such uncertainties, to raise confidence in the result of the CO 2 e value generation.
- the Monte Carlo simulation can be used.
- the displaying module can e.g.
- the displaying module can e.g. combine the inventory report with a process chart of each stage in life cycle of the product or industrial plant/site or process line 11 and/or processing unit 12, and displays the inventory report and the process chart on the display device.
- the process chart can e.g. comprise the C0 2 e measuring values and any uncertainties corresponding to each stage in the life cycle of the product or industrial plant/site.
- the system can be realized to allow to generate C0 2 e outputs of each stage in the life cycle of the product or industrial plant/site. It is to be noted that CO 2 e emissions and/or energy consumption is used herein in the example, although the output parameters of the control device 10 may convey other information.
- the organization can e.g. enter target levels to the control device 10, such as CO 2 e levels, for future emissions for a defined time period, as e.g. years.
- the target levels will typically be a line that may increase, decrease, or stay the same over time.
- the organization's targets for future emissions will be lower than extrapolated predicted future emissions (baseline emissions) determined by the control device 10, where the baseline emissions are predicted future emissions assuming no strategies are implemented to reduce emissions.
- the control device 10 can e.g. measure that the organization's future emissions will increase by 10% per year due to the anticipated growth of the organization.
- the control device 10 can the create a graphical representation as a chart indicating the past, current, and predicted baseline emissions for the defined period of time, as e.g. span of years, along with the target line.
- the baseline emissions and target line will normally diverge to form a wedge-shaped gap.
- the organization must then devise ways to close the gap using one or more strategies. These strategies may include, for example, progressively adapting or renewing or optimizing process units 12, using other energy resources, using other materials in the production process, changing transportation means or ways or structures, reducing employee travel, replacing bulbs with LEDs, using more efficient windows, using green power sources, etc. Each strategy can be associated with a different implementation time.
- the strategies may be generated as expert devices by means of the control device 10 acting as an expert system.
- control device 10 is able to provide information for each unit of an industrial site/plant 1 relevant to environmental impact. Some of the information may be related to resource consumption of the industrial site 1, such as types of energy used (e.g., electricity, natural gas, diesel, oil, coal, etc.), quantities of energy used (e.g., kwh, gallons, etc.), dates of energy used, costs of energy used, airline travel, lighting usage, types/amounts of products manufactured and types/amounts of emissions, effi-ciencies, waste products, water usage, raw input product usage (e.g., paper, metals, etc.), costs of various pertinent resources, and other types of data pertinent to resource consumption.
- types of energy used e.g., electricity, natural gas, diesel, oil, coal, etc.
- quantities of energy used e.g., kwh, gallons, etc.
- dates of energy used e.g., dates of energy used
- costs of energy used e.g., airline travel, lighting usage, types/amounts
- the control device 10 can save the individual resource consumption entries as resource consumption items for the industrial site 10 in the carbon footprint inventory system 108.
- Some of the information may also be related to demographics of the organizational unit, such as facility area (e.g., square footage), facility revenue, facility produced units, facility type ( e.g., office, manufacturing, etc.), facility age, facility operating hours, facility employee count, facility HVAC type, facility location, and other types of data pertinent to demographics.
- the control device can e.g. estimate the resource consumption based on comparable units/facilities within the entity or from a database comprising historic data or data from other industrial sites 1 comparable units/ facilities outside of the entity.
- the control device executes the measuring value generation structure, matches the comparable facilities based on their demographic data in the database or carbon footprint inventory system 108.
- the control device can then automatically select a comparable facility, and determine resource consumption items of the selected comparable facility from database.
- the control device then can select a specific resource consumption item, as a processing unit 12, and determine a measured resource consumption of the target facility, and determines a measure of environmental impact from the measurement. Any report listing the estimated resource consumption, or the measure of environmental impact clearly designates the value as an estimate.
- emission factors are classified and monitored by life cycle stage, wherein the classification of the emission factors comprise (a) for emitted raw material: acid, alkali, aluminum, argon, base oil, carton, ceramic abrasive, citric acid, demi water, ethanol, flocculant, glass abrasive, hydraulic fluid, isopropanol, Lubricant, magnesium, nitrogen, oxygen, paper, penetrant, polyester, refractory, salt, sodium fluoride, steel, sulphur dioxide, surfactant, water, or any other raw material as e.g.
- waste materials for emitted waste materials: (i) energy emission: acetylene, diesel, electricity, solar power, fuel oil, natural gas, petrol, propane, (ii) waste material emission: aluminium incineration, aluminium recycling, electronics dismantling, hazardous waste incineration, mercury treatment, mineral oil incineration with energy recovery, municipal waste incineration, paperboard incineration, PET incineration, sludge incineration with energy recovery, and wood incineration; and (c) for transport emissions: transport by truck, and transport by ship.
- energy emission acetylene, diesel, electricity, solar power, fuel oil, natural gas, petrol, propane
- waste material emission aluminium incineration, aluminium recycling, electronics dismantling, hazardous waste incineration, mercury treatment, mineral oil incineration with energy recovery, municipal waste incineration, paperboard incineration, PET incineration, sludge incineration with energy recovery, and wood incineration
- transport emissions transport by truck, and transport by ship.
- control device 10 further provides third party certificates based on the generated product CO 2 e quantification measure value 21 and/or the generated industrial site CO 2 e quantification measure value 141.
- the third party certificates comprise ISO certificates.
- the third-party certificates can also be provided based on block-chain technology.
Landscapes
- Business, Economics & Management (AREA)
- Engineering & Computer Science (AREA)
- Human Resources & Organizations (AREA)
- Physics & Mathematics (AREA)
- General Physics & Mathematics (AREA)
- Economics (AREA)
- Strategic Management (AREA)
- Entrepreneurship & Innovation (AREA)
- Theoretical Computer Science (AREA)
- Marketing (AREA)
- Development Economics (AREA)
- General Business, Economics & Management (AREA)
- Educational Administration (AREA)
- Tourism & Hospitality (AREA)
- Automation & Control Theory (AREA)
- Game Theory and Decision Science (AREA)
- Operations Research (AREA)
- Quality & Reliability (AREA)
- Accounting & Taxation (AREA)
- Finance (AREA)
- Manufacturing & Machinery (AREA)
- Health & Medical Sciences (AREA)
- General Health & Medical Sciences (AREA)
- Primary Health Care (AREA)
- Management, Administration, Business Operations System, And Electronic Commerce (AREA)
Description
- The present invention relates in general to control devices optimizing of energy management in production processes of plants or industrial sites by optimizing both electric and thermal energy in such a manner as to achieve desirable overall performance and in particular to control devices, optimizing evaluation of energy management in production processes of the plants or industrial sites, that improve energy facility efficiency and are applicable in technical areas ( e.g., production processes), manufacturing industry (e.g., factories, plants, process lines), and tertiary areas ( e.g., buildings, transportation etc.) for which it is desirable to reduce at least one of energy supply cost, CO2( carbon dioxide) emission, and primary energy consumption. Further, it relates to control and measuring systems directed to the measurement of CO2e quantification measures.
- The emission of greenhouse gasses, such as carbon dioxide (CO2), methane (CH4), and nitrous oxide (N2O) due to human activities, in particular industrial production and manufacturing processes, is one of the major causes of climatic changes with impacts on food security and safety for their effects on agricultural crops. The fluxes of greenhouse gases are responsible for the increase in temperature, which will lead to higher drought stress for crops due to increased evapo-transpiration combined with a more uneven distribution of rainfall events. In addition, growing economic, social and environmental challenges are further driving new paradigms of sustainable development, in which competitive sustainable manufacturing (SM) plays a core role. Increasing energy and commodity prices with resource scarcity, government legislature and consumer pressure are driving environmentally conscious business strategy to gain sustainable advantage through effective energy product management. Rising energy and labour costs further continue to increase the pressure to innovate. Thus, the reduction of energy consumption and greenhouse gas (GHG) emissions, mainly carbon dioxide (CO2) emissions, are at the top of the global agenda.
- In this context, it is a known fact that feed and food production contribute substantially to the emissions of greenhouse gases, which are known to cause said global warming with serious environmental and economic threads. In particular, industrial food and feed production processes, raw material processing and linked manufacturing operations are energy intensive where also used electricity is often generated by fossil fuels which is a major contributor of CO2 emissions. However, the enhancement of energy management in an industrial process requires robust, physical measuring parameter driven monitoring, measuring and modelling, as well as an appropriate selection of energy performance indicators (EnPI) providing a measure for the energy performance of the plant, process line or industrial process. Today, an effective energy management system (EMS) is recognized as a potential competitive advantage by many industries because it provides many benefits, such as energy consumption and cost reductions, improve company's image and environmental impact reduction.
- The food industry is divided into several sectors. Among these, the wheat processing sector is considered as one of the most energy-intensive industry consumer because it requires high and regular energy supply. In flour milling, electricity accounts for almost 75% of total energy use and over 90% of energy costs with a consumption that varies between 361 MJ/t and 1186 MJ/t. Thus, inefficient energy use could lead to huge economic losses as excessive energy consumption adds to the costs of the goods produced. There are huge efforts for energy efficiency on food industry and wheat production, however, most of them focus mainly on marketing, production planning or quality of product. However, prior art systems related to optimizing energy consumption in this industry do not provide an adequate tool for energy management. Some of them are limited to monitor the energy requirement for operations involved in the processing of wheat while in others try to optimize the process of how to reduce the peak load and its associated costs. Other systems have been focusing on the recognition of the development of energy consumption patterns of the various unit operations required for the wheat processing plant. Further in all the prior art corresponding to milling plants, the EnPls are based on simple models of energy consumption versus production without considering variables of the wheat production process that affect the energy consumption.
- Many factors influence on energy requirements for the raw material transformation of wheat. Thus, systems, providing an efficient energy management should be able the take into account the correlation between energy consumption and the class of wheat, moisture content, feed rate, fast roll speed, roll speed differential and roll gap. Further, since wheat flour relies on proper conditioning to facilitate endosperm and bran separation, many mills add moisture to soften the grain improving efficiency in terms of the energy required to produce the flour. It is clear, that processing of natural resources depends on their composition, Therefore, it is important to an energy management system should be enabled to consider the relationship between energy efficiency and the properties of the raw material. The physical properties of wheat and technical exploitation parameters of grinding rolls have a direct influence on energy consumption of grinding as well. However, most prior art systems controlling the plant processes focus in the effect on product quality instead of the energy consumption. Thus, these systems typically consider the effects of normal and hard milling and different conditioning times on flour properties of wheat were studied, without considering the energy consumption.
- Unseen the above discussed wheat processing sector, it has to be noted that in general that feed and food production can contribute substantially to the emissions of greenhouse gases. For example, livestock has a major share, causing 18% of the global greenhouse gas emissions. Subsequently, food with animal protein components, such as dairy (cheese: 8.8 kg CO2e/kg cheese) and meat products (beef: 29.0 kg CO2e/kg beef), show high greenhouse gas emissions. However, besides animal products, vegetables and cereals (tomato: 5.3 kg CO2e/kg tomato; rice: 1.2 kg CO2e/kg rice) can also generate high emissions. Greenhouse gas emissions could be reduced by the replacement of animal with plant components in foods. It is conceivable to use grain legumes, such as peas or beans, as such plant replacement components. Grain legumes, such as peas with a carbon footprint of 0.49 kg CO2e/kg pea, have been suggested as a very efficient source of protein in terms of greenhouse gas (GHG) emissions per kg. Pea-based protein has proved to be very well suited for the fortification of pasta products and the improvement of techno-functional and sensorial properties, and thus could very well substitute animal-based ingredients of processed foods.
- Not every emissions of any greenhouse gases has the same effect. The different impacts of various greenhouse gases are measured in their global warming potential (GWP) which is the heat absorbed by a greenhouse gas in the atmosphere, as a multiple of the heat that would be absorbed by the same mass of carbon dioxide (CO2). GWP is 1 for CO2. For other gases, The GWP depends on the gas and the time frame. Carbon dioxide is used as the general reference. It has a GWP of 1 regardless of the time period used. CO2 emissions cause increases in atmospheric concentrations of CO2 that will last thousands of years. To compare the effects of the various greenhouse gases, a carbon dioxide equivalent (CO2e (also referred to as CO2eq or CO2-e)) is defined from GWP. It is measured in weight or concentration. For any amount of any gas, it is the amount of CO2 which would warm the earth as much as that amount of that gas. Thus it provides a common scale for measuring the climate effects of different gases. It is calculated as GWP times amount of the other gas. For example if a gas has GWP of 100, two tonnes of the gas have CO2e of 200 tonnes, and 1 part per million of the gas in the atmosphere has CO2e of 100 parts per million. As greenhouse gas (GHG) is a gas that absorbs and emits radiant energy within the thermal infrared range, causing the greenhouse effect. The primary greenhouse gases in Earth's atmosphere are water vapor (H2O), carbon dioxide (CO2), methane (CH4), nitrous oxide (N2O, i.e. laughing gas), and ozone (03). Without greenhouse gases, the average temperature of Earth's surface would be about -18 °C, rather than the present average of 15 °C.
- The prior art document
US 2011/0144791 A1 shows a system for control, monitoring and recording of incoming chemical and power use, and emissions of electronic device manufacturing systems. According toUS 2011/0144791 A1 , the system is focused on so called sub-fab equipment which shall typically do not have monitoring data for energy consumption and/or energy savings. The sub-fab equipment, as defined byUS 2011/0144791 A1 , can comprise auxiliary devices as abatement tools, AC power distributors, primary vacuum pumps, spare vacuum pumps, water pumps, chillers, heat exchangers, process cooling water supplies and delivery sys-tems, electrical power supplies and delivery systems, inert gas dumps, valves, device controllers, clean dry air supplies and delivery systems, ambient air supplies and delivery sys-tems, inert gas supplies and delivery systems, fuel supplies and delivery systems, touch screens, process logic control-lers, reagent supplies and delivery systems, etc. Thus,US 2011/0144791 A1 proposed that the energy usage of sub-fab equipment is monitored by integrated sub-fab systems. By integrated sub-fab systems, the system is able to capture different depths of energy savings modes such as idle (shallow energy savings where production equipment can recover to normal production with no quality or throughput impact in seconds), sleep (deeper energy sav-ings where production equipment can recover in minutes), or hibernate (where production equipment may require hours to recover not to have impact on quality, or throughput). The system is also able to monitor and display all gas emissions in a sub-fab as well as the Semi S23 method reporting of CO2 equivalent emission. The system can monitor effluent process gases and energy use from a certain process tool and sub-fab equipment. Therefore, in principle, the system ofUS 2011/0144791 A1 proposes distinct measurements and monitoring at the different sub-fab equipment, to capture or measure the overall monitoring and recording of incoming chemical and power use of the complete fab-system. - The scope of the invention is defined in the independent claims.
- It is an object of the present invention to provide a control system and method providing automated optimization of energy management and/or minimization of the overall energy consumption in production processes of plants or industrial sites. It is an object of the present invention to provide a system and method for an intelligent control system with all the data required that enables automated and certified CO2e quantification measuring. Further, the system should be easy scalable and operatable with all kinds of third-parties' competitor/partner equipment. The system should be able to automatically collect relevant data and process the data to generate site CO2 footprints and/or product CO2 intensities. It should further be able to automatically, or at least semi-automatically provides improvement measures, considering and mutually weighting measured cost parameters, production or manufacturing measures and impact parameters against each other.
- According to the present invention, these objects are achieved, particularly, by the features of the independent claim. In addition, further advantageous embodiments can be derived from the dependent claims and related descriptions.
- According to the present invention, the above-mentioned objects related to optimizing energy consumption control and monitoring of an industrial site and measurement of a CO2-footprint of an industrial site and/or of a product manufactured or processed by said industrial site by means of a control device are achieved, particularly, in that the industrial site comprises one or more processing units for processing or manufacturing one or more products, said control device comprising an input section comprising measuring devices and sensors capturing measuring parameters at the processing units and/or environmental measuring parameters associated with the industrial site, input/output interfaces and data transmission lines/networks to transfer the measured parameters to the control device, in that the input section is configured to capture and/or monitor and/or record predefined measuring parameters triggering in the data-pathways of the measuring devices and sensors for the generation of value settings for optimizing the control and steering of the energy management of the industrial site, in that the monitored measuring parameters comprise parameter vectors wherein the parameter values of the parameter vectors are time series of parameter values changeable over an entire predetermined operation period, and/or parameter scalars, wherein the parameter values of the parameter scalars do not change throughout the entire operation period, and constructional parameters, wherein the constructional parameter values represent structural characteristics of the industrial site, and in that, based on the monitored measuring parameters, a product CO2e quantification measure value is generated measuring a CO2e intensity of a product processed or manufactured by the industrial site and/or an industrial site CO2e quantification measure value is generated measuring a quantified CO2e footprint of the industrial site. The inventive system is enabled to provide CO2 evaluation measurements/prediction/optimization with or without automated and/or optimized energy management.
- The invention has, inter alia, the advantage that it enables to provide an intelligent control system with all the data required providing automated and certified CO2e quantification that allows to integrate competitor and/or partner equipment, alike. The system automatically collects the required data, processes the measured and captured data and generates a site CO2 footprint. The system further is able to process the captured and measured data and generates a product and/or plant and/or industrial site CO2 intensity. The system further can automatically provide improvement appropriate measures considering cost and/or measures and/or impacts. The system is further able to generate added values through combination of sensors, intelligent control system, CO2e quantification with process and sustainability knowledge. Further, it is able to provide third party certificates, as e.g. ISO Certificate. The system can provide controlled and secured access for customers/users to certificates e.g. based on an identification number or other authentication mechanisms. The system can provide a dynamic line configuration for the industrial site to optimize energy management. In addition, the system is able to ink to raw material database, logistics and key process parameters in a new inventive way. The system may also provide quality / CO2e an unique, protected label that proves CO2e certification. In particular, it allows certified measurements in accordance with any technical requirements or regulatory standards, as e.g., given by the standards of the Greenhouse Gas Protocol initiated by the World Resources Institute (WRI) and the World Business Council for Sustainable Development (WBCSD). Finally, the system can integrate block-chain technology to provide said certifications or a trusted lawyer interaction. The integration of the block-chain technology allows the implementation of a controlled multi-layer trust structure in order to operate the inventive control system as a system of trust. In this embodiment variant, the design of the used blockchain technology allows to incorporate three interacting trust layers: a social layer capturing the way actors interact with one another and determine how much information they need, and in what form in order to be able to trust and take action on the basis of the trusted information, e.g. the CO2e certification; a records or data layer that supplies the information that the actors have decided they need to obtain from the control system to give them confidence to act; and a technical layer, capturing the technical means by which the actors interact and create, store and obtain information about those interactions as tamper-resistant and non-repudiable proof of facts about acts, i.e. the CO2e measurement. Though, the primary focus of the present invention is on the records layer; however, to understand this layer, and the means by which the CO2e certification can be managed by the implemented blockchain-based records effectively, it is important to understand the other two layers and, to some extent, how the layers interact with one another in the design and operation of blockchain systems.
- The present invention will be explained in more detail by way of example in reference to the drawings in which:
-
Figure 1 shows a block diagram illustrating schematically anexemplary control device 10 for optimizing energy consumption control and monitoring of anindustrial site 1 and measurement of a CO2-footprint of anindustrial site 1 and/or of aproduct 2 manufactured or processed by saidindustrial site 1. Theindustrial site 1 comprises one ormore processing units 12 for processing or manufacturing one ormore products 2 and saidcontrol device 10 comprises aninput section 101 comprising measuring devices and sensors 13 capturing measuring parameters at theprocessing units 12 and/or environmental measuring parameters associated with theindustrial site 1, input/output interfaces 1011 and data transmission lines/networks 1012 to transfer the measured parameters to thecontrol device 10. -
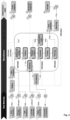
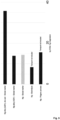
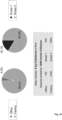
Figure 2 shows a diagram illustrating schematically an exemplary listing and classification of raw materials, produced waste products and used energy producing relevant emission factors by life cycle stage.Figures 2 to 9 are based on an exemplary product assessment in a die casting process by theinventive system 1. -
Figure 3 shows a block diagram illustrating schematically an exemplary PFD of aluminum die casting, wherein the blocks marked with "T" denote a transport and the other blocks processes. Reference numbers in circles denote calculation and monitoring references. Processes are given in blue squares while transport is given in yellow squares. Bold encircled squares denote processes within the cell, i.e. the die casting machine. -
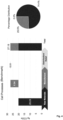
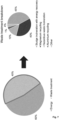
Figure 4 shows a diagram illustrating schematically an exemplary CO2e distribution for 1 kg aluminum die casted part. -
Figure 5 shows a diagram illustrating schematically an exemplary table with aluminum emission factors. It can be seen infigure 5 that the aluminum sourcing may significantly impacts the final footprint. -
Figure 6 shows a diagram illustrating schematically the measured and/or predicted savings in the exemplary plant. The cell processes are those conducted by the die casting machine, inter alia comprising (i) holding and dosing, (ii) spraying, (iii) casting, (iv) thermal control, (v) extraction, (vi) cooling water system, (vii) cooling, and (viii) trimming. -
Figure 7 shows a diagram illustrating schematically exemplary contributions to manufacturing emissions for the waste treatment. -
Figure 8 shows a diagram illustrating schematically exemplary contributions to manufacturing emissions for the energy. -
Figure 9 shows a diagram illustrating schematically the measured and/or predicted savings in the exemplary customer value chain. -
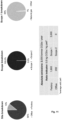
Figure 10 shows a diagram illustrating schematically exemplary CO2 distributions in narrow to broader scopes (scope1-3). -
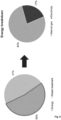
Figure 11 shows a diagram illustrating schematically an exemplary breakdown of the site emissions.Figure 11 is based on an exemplary site assessment in a die casting example by theinventive system 1. -
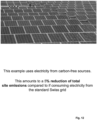
Figure 12 shows a diagram illustrating schematically an exemplary dependence from the choice of sources of electricity for the CO2 emission. Switching to green electricity can help further reduce emissions. For example photovoltaics can help to avoid emissions. The example inFigure 16 uses electricity from carbon-free sources. This saves 2,500 tonnes CO2e per year. This amounts to a 50% reduction of total site emissions compared to if consuming electricity from the standard Swiss grid. -
Figure 13 shows a diagram illustrating schematically an exemplary process flow in flour production, wherein the blocks marked with "T" denote a transport and the other blocks processes. Reference numbers in circles denote calculation and monitoring references. Processes are given in blue squares while transport is given in yellow squares. -
Figures 13 and14 are based on an exemplary product assessment in a milling example by theinventive system 1. -
Figure 14 shows a diagram illustrating schematically an exemplary CO2e distribution for 1 tonne of flour with transport emissions in the milling example. -
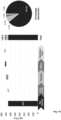
Figure 15 shows a diagram illustrating schematically an exemplary implementation of defining and reporting of CO2 emissions.Figures 15 to 17 are based on an exemplary site assessment in a milling example by theinventive system 1. -
Figure 16 shows a diagram illustrating schematically exemplary results for the exemplary site assessment with specific electricity emission factor. -
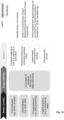
Figure 1 7 shows a diagram/online dashboard illustrating schematically an exemplary CO2e quantification for the milling site example. -
Figure 1 illustrates, schematically, an architecture for a possible implementation of the inventive method and system, in particular for the claimedinventive control device 10 for optimizing energy consumption control and monitoring of anindustrial site 1 and/or measurement of a CO2-footprint of anindustrial site 1 and of aproduct 2 manufactured or processed by saidindustrial site 1. The CO2-footprint can capture not only the manufacturing or processing process at a specific site, but can comprises and cover the complete production chain of anindustrial product 2, e.g. from the sowing, crop, raw material processing, transport, industrial processing, or manufacturing, up to the delivery transport, thus covering all aspects of the production of an industrial product including transport and packing etc. In the variant of such a more holistic measurement, the termindustrial site 1 is used in a wider definition comprising all technical means for processing and providing an industrial product the mining or cultivation of raw material to theend product 2. However, the measurement of the CO2-footprint can also be limited to a specific industrial plant, production line, or manufacturing process providing only a partial step in the overall industrial production chain of theproduct 2. The industrial site can e.g. comprise at least one industrial plant and/or processing line and/or production facility/equipment. According to the claimed invention, theindustrial site 1 comprises one ormore processing units 12 for processing or manufacturing one ormore products 2, and thecontrol device 10 comprises aninput section 101 comprising measuring devices and sensors 13 capturing measuring parameters at theprocessing units 12 and/or environmental measuring parameters associated with theindustrial site 1, input/output interfaces 1011 and data transmission lines/networks 1012 to transfer the measured parameters to thecontrol device 10. Theindustrial site 1 can further also comprise one ormore process lines 11 comprising at least oneprocessing unit 12 for processing or manufacturing theproducts 2. It is important to note that the optimization of energy consumption of anindustrial site 1 and the measurement of the CO2-footprint of the respectiveindustrial site 1 and/or of aproduct 2 manufactured or processed by theindustrial site 1, can be decoupled technical aspects. For example, if there is mitigating procurement of green energy in the overall energy consumption, CO2 reduction can become decoupled from energy reduction. Thus, for the expert system aspects of the present invention, the measured CO2-footprint and optimizing of the energy consumption do not need to have a direct relationship. - The
control device 10 can e.g. comprise at least one programmable logic controller (PLC) or programmable controller associated with the industrial site as automation controllers adapted for the control of a manufacturing process or product processing process at the industrial site, the PLC input and output devices (I/O) realized as in-house integral with a data processor or rack-mounted as modular devices with I/O devices. The PLCs of the industrial site can e.g. be connected over adata transmission network 4 to a supervisory control and data acquisition (SCADA) system of the control device providing programming and process fault diagnosis of processing units of the industrial site. - The
input section 101 captures and/or monitors and/or recordspredefined measuring parameters 134 triggering in the data-pathways of the measuring devices and sensors 13 for the generation of value settings for optimizing the control and steering of the energy management of theindustrial site 1. - In the claimed invention, the monitored measuring
parameters 134 comprise parameter vectors wherein the parameter values of the parameter vectors are time series of parameter values changeable over an entire predetermined operation period, and/or parameter scalars, wherein the parameter values of the parameter scalars do not change throughout the entire operation period, and constructional parameters, wherein the constructional parameter values represent structural characteristics of theindustrial site 1. - Based on the monitored measuring
parameters 134, a product CO2equantification measure value 21 is generated measuring a CO2e intensity 22 of aproduct 2 processed or manufactured by theindustrial site 1 and/or an industrial site CO2e quantification measure value 141 is generated measuring a quantified CO2e footprint 14 of theindustrial site 1. The CO2equantification measure value 21 can e.g. be generated by thecontrol device 10 or by a dedicated CO2e quantification module 107 of thecontrol device 10. The term "module," as used herein, refers to logic embodied in hardware or firmware, or to a collection of software instructions, written in a programming language. In one embodiment, the program language may be Java, C, or assembly. One or more software instructions in the modules may be embedded in firmware, such as in an EPROM. The modules described herein may be implemented as either software and/or hardware modules and may be stored in any type of non-transitory computer-readable storage medium or other storage device. Some nonlimiting examples of non-transi-tory computer-readable storage medium include CDs, DVDs, flash memory, and hard disk drives. Based on the generated product CO2e quantification measure value 211 and/or the generated industrial site CO2e quantification measure value 141, thecontrol device 10 can e.g. provide optimized improvement measures by mutual weighing impact of varying cost parameters and possible improvement measures. Thecontrol device 10 can e.g. provide a dynamically adapted line configuration based on the optimized improvement measures. - The
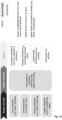
control device 10 can further comprise a carbon footprint inventory system 108. The carbon footprint inventory system 108 can further includes an interface and/or data capturing module, a setting module, a selecting module, a determining module, a notifying module, a data processing module, a displaying module, and a verifying module. The modules may comprise computerized instructions in the form of one or more programs that are stored in the storage device and executed by the at least one processor. In one embodiment, the storage device may be an internal storage system, such as a random-access memory (RAM) for temporary storage of information, and/or a read only memory (ROM) for permanent storage of information. In some embodiments, the storage device may also be an external storage system, such as an external hard disk, a storage card, or a data storage medium. The interface receives an inventory procedure of the product or industrial plant/site e.g. selected via a graphical user interface (GUI), and executes an inventory process of the product or industrial plant/site. The inventory procedure can e.g. include a first inventory, a reference template inventory, and/or a historical reference inventory of the product or industrial plant/site. When a user selects the first inventory (e.g., by selecting the first inventory displayed on a display screen using a mouse, keyboard, and/or a touchscreen), the first setting module can e.g. set standard units and parameters of the inventory processes, and receives the standard units, such as a quality unit and a volume unit, for example, and the parameters, such as life cycle assessment (LCA) parameters and GWP parameters, for example, which are input in the inventory procedures. When the user selects the reference template inventory, the interface receives a template selected by the user. Different industries may apply different templates. The interface loads the standard units and the parameters of the reference template inventory e.g. from the storage device to offer the user various reference selections in the inventory processes. When the user selects the historical reference inventory, the interface receives a historical reference inventory and inventory structure selected by the user. The interface copies the standard units and the parameters of the historical reference inventory and inventory structure providing the same reference selections for approval by the user and/or as predefined or start setting. The first setting module sets inventory targets of the carbon footprint inventory of the product. The inventory targets can e.g. comprise an inventory project, certain inventory criteria, an organization of the product or industrial plant/site, an inventory period. For example, inFIG. 3 , the inventory project is "alloy production", one of the inventory criteria is denoted by the reference "Carat 400 Cell", i.e. the die casting machine, and given by its structure, and the inventory target may e.g. be (i) measuring the CO2e-footprint of the alloy or the production site or the overall production process, (ii) optimization of the CO2e footprint, or (iii) optimizing of the energy consumption of the production process of the alloy. Finally, for example, the organization may be a steel company. A specific product of a production site can e.g. be selected by means of the selecting module according to the inventory targets, and loads material data of the product. For example, the selecting module can e.g. select a particular alloy as the product e.g. according to a demand of the user. The selecting module loads the material data of the product from a dedicated database. The material data may include a list of materials in the product, and, in relation to each material, e.g. a vendor and/or material characteristics as weight/composition/properties etc., for example. All the materials of the product can e.g. be displayed by the selecting module displays on a display device according to a tree diagram or another suitable graphical representation. The selecting module may further load an image of the product for a reference. In the claimed invention, the determining module determines materials of the product e.g. according to a weight analysis of each material and a CO2e analysis of each material. The product includes a plurality of materials, and the weight of each material may be different. In the claimed invention, the determining module determines a weight proportion which is a proportion of the weight of each material to the total weight of the product according to the weight analysis of each material and picks the materials with greater weight proportions to avoid wasting time on materials with less, or insignificant, weight proportions. The determining module can e.g. perform the same steps for the production cycle in situ etc.. In the claimed invention, the determining module determines a CO2e proportion which is a proportion of the CO2e exhausted from each material to the total CO2e exhausted from the product in the life cycle according to the CO2e analysis of each material and the production process. Finally, the notifying module may generate an appropriate notice to a vendor of a material participating in the carbon footprint inventory, if the required data are not available, and requests the vendor to inventory the CO2e data of the material. Regarding the used materials in the production process, the materials may include more or less relevant materials, where a more relevant material is a material whose CO2e proportion reaches a larger proportion, one percent, for example, than a less relevant material. The CO2e proportion is a proportion of the CO2e exhausted from each material in relation to the total CO2e exhausted from the product in the life cycle. The priority of more relevant materials is higher than the priority of less relevant materials. Thus, in the material, the priority of a material with greater CO2e proportion is higher than the priority of a material with less CO2e proportion. - The
control device 10 generates the CO2e of a product or an industrial plat/site according to the condition and characteristics parameters of the setting of theprocess line 11 and/orprocessing units 12 of the carbon footprint inventory and/or the priority of the used materials. Thecontrol device 10 generates any uncertainties or imponderables of the CO2e of the product or industrial plant/site according to a generation structure generating such uncertainties or imponderables. This structure can e.g. comprise machine-learning-based or artificial-intelligence based units being trained based on historical data e.g. of optimized runningprocessing units 12. The generation structure for generating the carbon footprint can e.g. multiplying activity level data in the life cycle of a product or industrial plant/site by an exhausting factor to obtain the CO2e in the life cycle of a product or industrial plant/site, or multiplying activity level data in some stages of the life cycle of the product or industrial plant/site by an exhausting factor to obtain the CO2e in some stages of the life cycle of the product or industrial plant/site. The activity level data includes material activity level data, power activity level data, and waste activity level data. The units of the activity level data may be a kilogram, a cubic meter, a kilowatt, a kilometer, for example. The exhausting factor is the CO2e of the activity level data in each unit. For example for a specific product, if all of the material orprocessing unit 12 activity level data, the power activity level data, and the waste activity level data is fifteen cubic meters and the CO2e in each cubic meter is zero-point one kilogram, then the CO2e of the product in life cycle is one point five kilogram, the result of multiplying fifteen by zero point one. Generating uncertainties in relation to the CO2e of the product or industrial plat/site is to take account of any uncertainties in a result of a CO2e value generation and minimize the effects of such uncertainties, to raise confidence in the result of the CO2e value generation. To generate such uncertainties, e.g. the Monte Carlo simulation can be used. Finally, the displaying module can e.g. generate an inventory report including the CO2e of the product or industrial plant/site and any uncertainties. The displaying module can e.g. combine the inventory report with a process chart of each stage in life cycle of the product or industrial plant/site orprocess line 11 and/orprocessing unit 12, and displays the inventory report and the process chart on the display device. The process chart can e.g. comprise the C02e measuring values and any uncertainties corresponding to each stage in the life cycle of the product or industrial plant/site. The system can be realized to allow to generate C02e outputs of each stage in the life cycle of the product or industrial plant/site. It is to be noted that CO2e emissions and/or energy consumption is used herein in the example, although the output parameters of thecontrol device 10 may convey other information. Although most emissions can be converted into a CO2e emission by applying accepted factors, virtually every resource usage by an organization or industry can also be converted into a CO2e emission by applying suitable factors, since every resource can be associated with an amount of energy used to create the resource, consume the resource, and dispose of any resource waste. For example, airline travel by employees or the usage of paper can be converted to a CO2e emission. - The organization can e.g. enter target levels to the
control device 10, such as CO2e levels, for future emissions for a defined time period, as e.g. years. The target levels will typically be a line that may increase, decrease, or stay the same over time. Typically, the organization's targets for future emissions will be lower than extrapolated predicted future emissions (baseline emissions) determined by thecontrol device 10, where the baseline emissions are predicted future emissions assuming no strategies are implemented to reduce emissions. For example, thecontrol device 10 can e.g. measure that the organization's future emissions will increase by 10% per year due to the anticipated growth of the organization. - The
control device 10 can the create a graphical representation as a chart indicating the past, current, and predicted baseline emissions for the defined period of time, as e.g. span of years, along with the target line. The baseline emissions and target line will normally diverge to form a wedge-shaped gap. The organization must then devise ways to close the gap using one or more strategies. These strategies may include, for example, progressively adapting or renewing or optimizingprocess units 12, using other energy resources, using other materials in the production process, changing transportation means or ways or structures, reducing employee travel, replacing bulbs with LEDs, using more efficient windows, using green power sources, etc. Each strategy can be associated with a different implementation time. The strategies may be generated as expert devices by means of thecontrol device 10 acting as an expert system. Again, thecontrol device 10 is able to provide information for each unit of an industrial site/plant 1 relevant to environmental impact. Some of the information may be related to resource consumption of theindustrial site 1, such as types of energy used ( e.g., electricity, natural gas, diesel, oil, coal, etc.), quantities of energy used ( e.g., kwh, gallons, etc.), dates of energy used, costs of energy used, airline travel, lighting usage, types/amounts of products manufactured and types/amounts of emissions, effi-ciencies, waste products, water usage, raw input product usage (e.g., paper, metals, etc.), costs of various pertinent resources, and other types of data pertinent to resource consumption. Thecontrol device 10 can save the individual resource consumption entries as resource consumption items for theindustrial site 10 in the carbon footprint inventory system 108. Some of the information may also be related to demographics of the organizational unit, such as facility area ( e.g., square footage), facility revenue, facility produced units, facility type ( e.g., office, manufacturing, etc.), facility age, facility operating hours, facility employee count, facility HVAC type, facility location, and other types of data pertinent to demographics. - When resource consumption of a target unit/facility is not available, the control device can e.g. estimate the resource consumption based on comparable units/facilities within the entity or from a database comprising historic data or data from other
industrial sites 1 comparable units/ facilities outside of the entity. The control device executes the measuring value generation structure, matches the comparable facilities based on their demographic data in the database or carbon footprint inventory system 108. The control device can then automatically select a comparable facility, and determine resource consumption items of the selected comparable facility from database. The control device then can select a specific resource consumption item, as aprocessing unit 12, and determine a measured resource consumption of the target facility, and determines a measure of environmental impact from the measurement. Any report listing the estimated resource consumption, or the measure of environmental impact clearly designates the value as an estimate. - According to the invention, for the generation of the product CO2e quantification measure value 211 based on the monitored measuring parameters 134 measuring the CO2e intensity 22 of the product 2 processed or manufactured by the industrial site 1, emission factors are classified and monitored by life cycle stage, wherein the classification of the emission factors comprise (a) for emitted raw material: acid, alkali, aluminum, argon, base oil, carton, ceramic abrasive, citric acid, demi water, ethanol, flocculant, glass abrasive, hydraulic fluid, isopropanol, Lubricant, magnesium, nitrogen, oxygen, paper, penetrant, polyester, refractory, salt, sodium fluoride, steel, sulphur dioxide, surfactant, water, or any other raw material as e.g. wheat and/or flour and/or vitamins and/or water etc.; and/or (b) for emitted waste materials: (i) energy emission: acetylene, diesel, electricity, solar power, fuel oil, natural gas, petrol, propane, (ii) waste material emission: aluminium incineration, aluminium recycling, electronics dismantling, hazardous waste incineration, mercury treatment, mineral oil incineration with energy recovery, municipal waste incineration, paperboard incineration, PET incineration, sludge incineration with energy recovery, and wood incineration; and (c) for transport emissions: transport by truck, and transport by ship.
- As an embodiment variant, the
control device 10 further provides third party certificates based on the generated product CO2equantification measure value 21 and/or the generated industrial site CO2e quantification measure value 141. The third party certificates comprise ISO certificates. The third-party certificates can also be provided based on block-chain technology. -
- 1 Industrial site
- 10 Control device
- 101 Input section
- 1011 I/O interface
- 1012 Network interface
- 102 Supervisory Control and Data Acquisition system (SCADA)
- 103 Persistence storage
- 1031 Non-volatile storage
- 1032 Volatile storage
- 104 Steering and control parameters
- 105 CO2e footprint generation of the
industrial site 1 - 106 CO2e intensity generation of a
product 2 - 107 CO2e quantification module
- 108 Carbon footprint inventory system
- 101 Input section
- 11 Process line
- 111 I/O devices
- 112 Programmable Logic Controller (PLC)
- 12 Processing units
121, 122, ..., 12i - 13 Measuring devices and sensors
- 131 Operational measuring devices of the processing units
- 132 Environmental measuring devices
- 133 Product characteristics measuring devices and/or sensors
- 134 Measuring parameter
- 1341 Operational measuring parameters of the
processing units 12 - 1342 Product characteristics measuring parameters
- 1343 Environmental measuring parameters
- 13431 Geographical location parameters
- 13432 Temporal and/or seasonal parameters
- 13433 Weather related parameters
- 1341 Operational measuring parameters of the
- 14 CO2e footprint of the
industrial site 1- 141 Industrial site CO2e quantification measure value
- 142 Further sustainability measuring parameters
- 1421 Water use
- 1422 Land use
- 1433 Biodiversity
- 10 Control device
- 2 Product manufactured or processed by the
industrial site 1
21 CO2e intensity of aproduct 2- 211 Product CO2e quantification measure
- 212 Further sustainability measuring parameters
- 2121 Water use
- 2122 Land use
- 2123 Biodiversity
- 3 Environment of the
industrial plant 1 - 4 Data transmission network
Claims (10)
- A control device (10) for optimizing energy consumption control and monitoring of an industrial site (1) and/or measurement of a CO2-footprint of an industrial site (1) and of a product (2) manufactured or processed by said industrial site (1), the industrial site (1) comprising one or more processing units (12) for processing or manufacturing one or more products (2) and said control device (10) comprising an input section (101) comprising measuring devices and sensors (13) capturing measuring parameters at the processing units (12) and/or environmental measuring parameters associated with the industrial site (1), input/output interfaces (1011) and data transmission lines/networks (1012) to transfer the measured parameters to the control device (10), characterized,in that the input section (101) comprises measuring devices and sensors (13) capturing measuring parameters at the processing units (12) and/or environmental measuring parameters associated with the industrial site (1), input/output interfaces (1011) and data transmission lines/networks (1012) to transfer the measured parameters to the control device (10), the monitored measuring parameters (134) comprising parameter vectors wherein the parameter values of the parameter vectors are time series of parameter values changeable over an entire predetermined operation period, and/or parameter scalars, wherein the parameter values of the parameter scalars do not change throughout the entire operation period, and constructional parameters, wherein the constructional parameter values represent structural characteristics of the industrial site (1),in that for measuring a product CO2e quantification measure value (211) based on the monitored measuring parameters (134) measuring a CO2e intensity (21) of the product (2) processed or manufactured by the industrial site (1), emission factors are classified and monitored by life cycle stage, wherein the classification of the emission factors comprise (a) for emitted raw material: wheat and other crops, water, acid, alkali, aluminum, argon, base oil, carton, ceramic abrasive, citric acid, demi water, ethanol, flocculant, glass abrasive, hydraulic fluid, isopropanol, Lubricant, magnesium, nitrogen, oxygen, paper, plastic and other packaging materials, penetrant, polyester, refractory, salt, sodium fluoride, steel, sulphur dioxide, surfactant, water; and/or (b) for emitted waste materials: (i) energy emission: acetylene, diesel, electricity, solar power, fuel oil, natural gas, petrol, propane, (ii) waste material emission: aluminium incineration, aluminium recycling, electronics dismantling, hazardous waste incineration, mercury treatment, mineral oil incineration with energy recovery, municipal waste incineration, paperboard incineration, PET incineration, sludge incineration with energy recovery, and wood incineration; and (c) for transport emissions: transport by truck, and transport by ship, andin that a determining module determines materials of the product (2) according to a weight analysis of each material and a CO2e analysis of each material, wherein for the weight analysis a weight proportion is determined by the determining module which is a proportion of the weight of each material to the total weight of the product (2), wherein materials with greater weight proportions are picked by the determining module avoiding wasting time on materials with less, or insignificant, weight proportions, and wherein a CO2e proportion is determined by the determining module which is a proportion of the CO2e exhausted from each material to the total CO2e exhausted from the product in the life cycle according to the CO2e analysis of each material and the production process.
- A control device for optimizing energy management and monitoring of CO2-footprint of an industrial site and/or of a product manufactured by said industrial site according to claim 1, characterized in that based on the generated product CO2e quantification measure value (211) and/or the generated industrial site CO2e quantification measure value (141) the control device (10) provides optimized improvement measures by mutual weighting impact of varying cost parameters and possible improvement measures.
- A control device for optimizing energy management and monitoring of CO2-footprint of an industrial site and/or of a product manufactured by said industrial site according to claim 2, characterized in that the control device (10) provides a dynamically adapted line configuration based on the optimized improvement measures.
- A control device for optimizing energy management and monitoring of CO2-footprint of an industrial site and/or of a product manufactured by said industrial site according to one of the claims 1 to 3, characterized in that the control device (10) further provides third party certificates based on the generated product CO2e quantification measure value (21) and/or the generated industrial site CO2e quantification measure value (141).
- A control device for optimizing energy management and monitoring of CO2-footprint of an industrial site and/or of a product manufactured by said industrial site according to claim 4, characterized in that the third party certificates comprise ISO certificates.
- A control device for optimizing energy management and monitoring of CO2-footprint of an industrial site and/or of a product manufactured by said industrial site according to one of the claims 4 or 5, characterized in that the third party certificates are provided based on block-chain technology.
- A control device for optimizing energy management and monitoring of CO2-footprint of an industrial site and/or of a product manufactured by said industrial site according to one of the claims 1 to 6, characterized in that the industrial site comprises at least one industrial plant and/or processing line and/or production facility/equipment.
- A control device for optimizing energy management and monitoring of CO2-footprint of an industrial site and/or of a product manufactured by said industrial site according to one of the claims 1 to 7, characterized in that the control device (10) further comprises at least one programmable logic controller (PLC) or programmable controller associated with the industrial site as automation controllers adapted for the control of a manufacturing process or product processing process at the industrial site, the PLC input and output devices (I/O) realized as in-house integral with a data processor or rack-mounted as modular devices with I/O devices.
- A control device for optimizing energy management and monitoring of CO2-footprint of an industrial site and/or of a product manufactured by said industrial site according to claim 8, characterized in that said PLCs of the industrial site are connected over a data transmission network to a supervisory control and data acquisition (SCADA) system of the control device providing programming and process fault diagnosis of processing units of the industrial site.
- A control device for optimizing energy management and monitoring of CO2-footprint of an industrial site and/or of a product manufactured by said industrial site according to one of the claims 1 to 9, characterized in that the industrial site (1) comprises one or more process lines (11) comprising at least one processing unit (12) for processing or manufacturing the products (2).
Priority Applications (6)
| Application Number | Priority Date | Filing Date | Title |
|---|---|---|---|
| EP21185050.8A EP4120158B1 (en) | 2021-07-12 | 2021-07-12 | Control system for optimizing energy management in production processes of plants or industrial sites or measuring system for automated measuring of co2e quantification measures |
| PT211850508T PT4120158T (en) | 2021-07-12 | 2021-07-12 | Control system for optimizing energy management in production processes of plants or industrial sites or measuring system for automated measuring of co2e quantification measures |
| EP22750798.5A EP4371049A1 (en) | 2021-07-12 | 2022-07-11 | Measuring and/or control system for optimizing environmental-relevant energy consumption in production processes of plants or industrial sites and/or measuring system for automated measuring of environmental quantification measurands |
| JP2024501550A JP7652404B2 (en) | 2021-07-12 | 2022-07-11 | MEASUREMENT AND/OR CONTROL SYSTEM FOR OPTIMIZING ENVIRONMENTALLY RELEVANT ENERGY CONSUMPTION IN A PRODUCTION PROCESS IN A PLANT OR INDUSTRIAL SITE AND/OR MEASUREMENT SYSTEM FOR AUTOMATIC MEASUREMENT OF ENVIRONMENTAL QUANTIFICATION MEASUREMENTS - Patent application |
| US18/578,368 US20240295863A1 (en) | 2021-07-12 | 2022-07-11 | Measuring and/or control system for optimizing environmental-relevant energy consumption in production processes of plants or industrial sites and/or measuring system for automated measuring of environmental quantification measurands |
| PCT/EP2022/069334 WO2023285389A1 (en) | 2021-07-12 | 2022-07-11 | Measuring and/or control system for optimizing environmental-relevant energy consumption in production processes of plants or industrial sites and/or measuring system for automated measuring of environmental quantification measurands |
Applications Claiming Priority (1)
| Application Number | Priority Date | Filing Date | Title |
|---|---|---|---|
| EP21185050.8A EP4120158B1 (en) | 2021-07-12 | 2021-07-12 | Control system for optimizing energy management in production processes of plants or industrial sites or measuring system for automated measuring of co2e quantification measures |
Publications (2)
| Publication Number | Publication Date |
|---|---|
| EP4120158A1 EP4120158A1 (en) | 2023-01-18 |
| EP4120158B1 true EP4120158B1 (en) | 2024-04-17 |
Family
ID=77179859
Family Applications (2)
| Application Number | Title | Priority Date | Filing Date |
|---|---|---|---|
| EP21185050.8A Active EP4120158B1 (en) | 2021-07-12 | 2021-07-12 | Control system for optimizing energy management in production processes of plants or industrial sites or measuring system for automated measuring of co2e quantification measures |
| EP22750798.5A Pending EP4371049A1 (en) | 2021-07-12 | 2022-07-11 | Measuring and/or control system for optimizing environmental-relevant energy consumption in production processes of plants or industrial sites and/or measuring system for automated measuring of environmental quantification measurands |
Family Applications After (1)
| Application Number | Title | Priority Date | Filing Date |
|---|---|---|---|
| EP22750798.5A Pending EP4371049A1 (en) | 2021-07-12 | 2022-07-11 | Measuring and/or control system for optimizing environmental-relevant energy consumption in production processes of plants or industrial sites and/or measuring system for automated measuring of environmental quantification measurands |
Country Status (5)
| Country | Link |
|---|---|
| US (1) | US20240295863A1 (en) |
| EP (2) | EP4120158B1 (en) |
| JP (1) | JP7652404B2 (en) |
| PT (1) | PT4120158T (en) |
| WO (1) | WO2023285389A1 (en) |
Families Citing this family (17)
| Publication number | Priority date | Publication date | Assignee | Title |
|---|---|---|---|---|
| TWI830384B (en) * | 2022-09-16 | 2024-01-21 | 國立成功大學 | Hybrid system and method of carbon and energy managements for green intelligent manufacturing |
| US20240201666A1 (en) * | 2022-12-20 | 2024-06-20 | Honeywell International Inc. | Method and apparatus for optimizing carbon emissions associated with an operation of a processing plant |
| US12554233B2 (en) | 2022-12-20 | 2026-02-17 | Honeywell International Inc. | Methods, apparatuses, and computer programming products implementing a multi-variable, closed loop approach for determining an optimization pathway |
| US20240201675A1 (en) * | 2022-12-20 | 2024-06-20 | Honeywell International Inc. | Emission optimization for industrial processes |
| US12517478B2 (en) * | 2023-02-22 | 2026-01-06 | Honeywell International Inc. | Systems, apparatuses, methods, and computer program products for constrained emissions control, emissions optimization, and emissions planning |
| CN116433441B (en) * | 2023-04-13 | 2024-04-05 | 北京数极智能科技有限公司 | Carbon footprint integrated management system of full life cycle photovoltaic industry chain |
| CN116341770B (en) * | 2023-05-30 | 2023-07-21 | 无锡兴达泡塑新材料股份有限公司 | Production capacity prediction method and system based on polystyrene production data |
| CN117134364B (en) * | 2023-06-21 | 2024-05-28 | 国网湖北省电力有限公司营销服务中心(计量中心) | Load management method for feed processing enterprises based on staged policy gradient algorithm |
| EP4528609A1 (en) * | 2023-09-19 | 2025-03-26 | Siemens Aktiengesellschaft | Method for operating a production site by means of an energy management system of the production site, computer program product, computer-readable storage medium and energy management system |
| CN117522387B (en) * | 2023-10-07 | 2024-06-28 | 江苏德博技术有限公司 | An electronic component recycling management system |
| IT202300024960A1 (en) * | 2023-11-23 | 2025-05-23 | Edmond Climate Network SA | PROCEDURE TO REDUCE THE ENVIRONMENTAL IMPACT IN TERMS OF CO2E FOR THE PRODUCTION OF A PRODUCT |
| IT202300025251A1 (en) * | 2023-11-28 | 2025-05-28 | Overlab S R L | SYSTEM AND METHOD FOR OPTIMIZE THE CO2 EQUIVALENT EMISSIONS OF A MACHINERY |
| CN117974077B (en) * | 2024-04-01 | 2024-06-07 | 潍坊宏图环保设备有限公司 | Ecological environment monitoring system based on big data |
| CN118246817B (en) * | 2024-05-28 | 2024-08-06 | 中国科学院南京土壤研究所 | A method, system, device and storage medium for assessing carbon footprint of crops |
| CN118689165B (en) * | 2024-06-18 | 2024-12-20 | 江苏觅科激光设备有限公司 | Dynamic adjustment method and device for laser equipment processing environment |
| CN121616295A (en) * | 2024-08-27 | 2026-03-06 | 新加坡商希达数位有限公司 | Efficient product carbon footprint checking system and method |
| CN119476024B (en) * | 2024-11-11 | 2025-06-20 | 深圳市蔚鸿信科技有限公司 | Optimization method and system for low-VOC environmentally friendly polyurethane foam anti-heartburn agent |
Family Cites Families (7)
| Publication number | Priority date | Publication date | Assignee | Title |
|---|---|---|---|---|
| JPH09231197A (en) * | 1996-02-22 | 1997-09-05 | Fujitsu Ltd | Thermostatic chamber device and method for temperature parallel simulated annealing |
| EP1355247A1 (en) | 2001-01-25 | 2003-10-22 | Matsushita Electric Industrial Co., Ltd. | Environment load amount calculating system, environment load amount calculating method, environment load amount display unit, environment load amount display method,program, and medium |
| JP4110080B2 (en) | 2003-11-28 | 2008-07-02 | 株式会社東芝 | Evaluation apparatus and evaluation method |
| JP2008191739A (en) | 2007-02-01 | 2008-08-21 | Hitachi Ltd | Manufacturing plant operation management system, operating condition evaluation device, manufacturing plant operation management method, and operating condition evaluation method |
| JP2010015207A (en) | 2008-07-01 | 2010-01-21 | Toyota Motor Corp | Energy management system |
| US9075408B2 (en) * | 2009-11-16 | 2015-07-07 | Applied Materials, Inc. | Energy savings and global gas emissions monitoring and display |
| JP6838308B2 (en) | 2016-07-29 | 2021-03-03 | 日本電気株式会社 | Line equipment setting support device, method and program |
-
2021
- 2021-07-12 PT PT211850508T patent/PT4120158T/en unknown
- 2021-07-12 EP EP21185050.8A patent/EP4120158B1/en active Active
-
2022
- 2022-07-11 EP EP22750798.5A patent/EP4371049A1/en active Pending
- 2022-07-11 JP JP2024501550A patent/JP7652404B2/en active Active
- 2022-07-11 WO PCT/EP2022/069334 patent/WO2023285389A1/en not_active Ceased
- 2022-07-11 US US18/578,368 patent/US20240295863A1/en active Pending
Also Published As
| Publication number | Publication date |
|---|---|
| EP4371049A1 (en) | 2024-05-22 |
| US20240295863A1 (en) | 2024-09-05 |
| JP7652404B2 (en) | 2025-03-27 |
| EP4120158A1 (en) | 2023-01-18 |
| WO2023285389A1 (en) | 2023-01-19 |
| PT4120158T (en) | 2024-08-09 |
| JP2024529333A (en) | 2024-08-06 |
Similar Documents
| Publication | Publication Date | Title |
|---|---|---|
| EP4120158B1 (en) | Control system for optimizing energy management in production processes of plants or industrial sites or measuring system for automated measuring of co2e quantification measures | |
| Kluczek et al. | Energy audits in industrial processes | |
| Nabavi-Pelesaraei et al. | Comprehensive model of energy, environmental impacts and economic in rice milling factories by coupling adaptive neuro-fuzzy inference system and life cycle assessment | |
| Ibn-Mohammed et al. | Integrating economic considerations with operational and embodied emissions into a decision support system for the optimal ranking of building retrofit options | |
| Prashar | Adopting Six Sigma DMAIC for environmental considerations in process industry environment | |
| Olanrewaju et al. | Review of energy models to the development of an efficient industrial energy model | |
| Gera et al. | Machine Learning for Environmental Sustainability in the Corporate World | |
| Shui et al. | Manufacturing productivity and energy efficiency: a stochastic efficiency frontier analysis | |
| US8504306B2 (en) | Graphical technique for visualizing effects of environmental emission reductions | |
| Kanchiralla et al. | Energy use categorization with performance indicators for the food industry and a conceptual energy planning framework | |
| Pascual‐González et al. | Macro‐economic multi‐objective input–output model for minimizing CO2 emissions: Application to the US economy | |
| US6820045B1 (en) | Process assessment tool, process assessment method, and medium storing the method | |
| Lim et al. | A multi-period model for optimal planning of an integrated, resource-efficient rice mill | |
| Umar et al. | Navigating epistemic uncertainty in third-generation biodiesel supply chain management through robust optimization for economic and environmental performance | |
| Miah et al. | Heat integration in processes with diverse production lines: A comprehensive framework and an application in food industry | |
| Luu et al. | Integrated hybrid multi-regional input-output for assessing life cycle air emissions of the Italian power system | |
| JP7040935B2 (en) | Power plant operation planning equipment and operation planning method | |
| Brădescu | GREEN LOGISTICS-A DIFFERENT AND SUSTAINABLE BUSINESS GROWTH MODEL. | |
| Youssef et al. | Exploring the correlation between energy intensity and specific energy consumption in food and kindred industry for the Midwest states | |
| CN119365877A (en) | Measurement and/or control systems for optimizing environmentally relevant energy consumption in production processes at factories or industrial sites and/or measurement systems for automated measurement of environmentally quantified measured objects | |
| Munguia et al. | Energy Audit in the Meat Processing Industry-A Case Study in Hermosillo, Sonora Mexico | |
| Gomes et al. | Multimodal green food supply chain design and planning under uncertainty | |
| Kalisa et al. | Environment risk management of warehouse and production hall investment projects | |
| Putridewi et al. | Performance Analysis of the Cement Industry Based on Green Supply Chain Management | |
| Firdaus et al. | Creating the standard for specific energy consumption at palm oil industry |
Legal Events
| Date | Code | Title | Description |
|---|---|---|---|
| STAA | Information on the status of an ep patent application or granted ep patent |
Free format text: STATUS: EXAMINATION IS IN PROGRESS |
|
| PUAI | Public reference made under article 153(3) epc to a published international application that has entered the european phase |
Free format text: ORIGINAL CODE: 0009012 |
|
| 17P | Request for examination filed |
Effective date: 20210712 |
|
| AK | Designated contracting states |
Kind code of ref document: A1 Designated state(s): AL AT BE BG CH CY CZ DE DK EE ES FI FR GB GR HR HU IE IS IT LI LT LU LV MC MK MT NL NO PL PT RO RS SE SI SK SM TR |
|
| RBV | Designated contracting states (corrected) |
Designated state(s): AL AT BE BG CH CY CZ DE DK EE ES FI FR GB GR HR HU IE IS IT LI LT LU LV MC MK MT NL NO PL PT RO RS SE SI SK SM TR |
|
| P01 | Opt-out of the competence of the unified patent court (upc) registered |
Effective date: 20230523 |
|
| REG | Reference to a national code |
Ref country code: DE Free format text: PREVIOUS MAIN CLASS: G06Q0010060000 Ipc: G06Q0050040000 Ref country code: DE Ref legal event code: R079 Ref document number: 602021011833 Country of ref document: DE Free format text: PREVIOUS MAIN CLASS: G06Q0010060000 Ipc: G06Q0050040000 |
|
| RIC1 | Information provided on ipc code assigned before grant |
Ipc: G06Q 50/04 20120101AFI20231220BHEP |
|
| GRAP | Despatch of communication of intention to grant a patent |
Free format text: ORIGINAL CODE: EPIDOSNIGR1 |
|
| STAA | Information on the status of an ep patent application or granted ep patent |
Free format text: STATUS: GRANT OF PATENT IS INTENDED |
|
| INTG | Intention to grant announced |
Effective date: 20240201 |
|
| GRAS | Grant fee paid |
Free format text: ORIGINAL CODE: EPIDOSNIGR3 |
|
| GRAA | (expected) grant |
Free format text: ORIGINAL CODE: 0009210 |
|
| STAA | Information on the status of an ep patent application or granted ep patent |
Free format text: STATUS: THE PATENT HAS BEEN GRANTED |
|
| AK | Designated contracting states |
Kind code of ref document: B1 Designated state(s): AL AT BE BG CH CY CZ DE DK EE ES FI FR GB GR HR HU IE IS IT LI LT LU LV MC MK MT NL NO PL PT RO RS SE SI SK SM TR |
|
| REG | Reference to a national code |
Ref country code: GB Ref legal event code: FG4D |
|
| REG | Reference to a national code |
Ref country code: CH Ref legal event code: EP |
|
| REG | Reference to a national code |
Ref country code: IE Ref legal event code: FG4D Ref country code: DE Ref legal event code: R096 Ref document number: 602021011833 Country of ref document: DE |
|
| REG | Reference to a national code |
Ref country code: PT Ref legal event code: SC4A Ref document number: 4120158 Country of ref document: PT Date of ref document: 20240809 Kind code of ref document: T Free format text: AVAILABILITY OF NATIONAL TRANSLATION Effective date: 20240805 |
|
| REG | Reference to a national code |
Ref country code: LT Ref legal event code: MG9D |
|
| REG | Reference to a national code |
Ref country code: NL Ref legal event code: MP Effective date: 20240417 |
|
| PGFP | Annual fee paid to national office [announced via postgrant information from national office to epo] |
Ref country code: NL Payment date: 20240730 Year of fee payment: 4 |
|
| REG | Reference to a national code |
Ref country code: AT Ref legal event code: MK05 Ref document number: 1677968 Country of ref document: AT Kind code of ref document: T Effective date: 20240417 |
|
| PG25 | Lapsed in a contracting state [announced via postgrant information from national office to epo] |
Ref country code: NL Free format text: LAPSE BECAUSE OF FAILURE TO SUBMIT A TRANSLATION OF THE DESCRIPTION OR TO PAY THE FEE WITHIN THE PRESCRIBED TIME-LIMIT Effective date: 20240417 |
|
| REG | Reference to a national code |
Ref country code: NL Ref legal event code: NE Effective date: 20240917 |
|
| PG25 | Lapsed in a contracting state [announced via postgrant information from national office to epo] |
Ref country code: NL Free format text: LAPSE BECAUSE OF FAILURE TO SUBMIT A TRANSLATION OF THE DESCRIPTION OR TO PAY THE FEE WITHIN THE PRESCRIBED TIME-LIMIT Effective date: 20240417 |
|
| PGFP | Annual fee paid to national office [announced via postgrant information from national office to epo] |
Ref country code: IS Payment date: 20240730 Year of fee payment: 4 |
|
| PG25 | Lapsed in a contracting state [announced via postgrant information from national office to epo] |
Ref country code: BG Free format text: LAPSE BECAUSE OF FAILURE TO SUBMIT A TRANSLATION OF THE DESCRIPTION OR TO PAY THE FEE WITHIN THE PRESCRIBED TIME-LIMIT Effective date: 20240417 |
|
| PG25 | Lapsed in a contracting state [announced via postgrant information from national office to epo] |
Ref country code: HR Free format text: LAPSE BECAUSE OF FAILURE TO SUBMIT A TRANSLATION OF THE DESCRIPTION OR TO PAY THE FEE WITHIN THE PRESCRIBED TIME-LIMIT Effective date: 20240417 |
|
| PGFP | Annual fee paid to national office [announced via postgrant information from national office to epo] |
Ref country code: FI Payment date: 20240730 Year of fee payment: 4 Ref country code: IE Payment date: 20240730 Year of fee payment: 4 |
|
| PG25 | Lapsed in a contracting state [announced via postgrant information from national office to epo] |
Ref country code: GR Free format text: LAPSE BECAUSE OF FAILURE TO SUBMIT A TRANSLATION OF THE DESCRIPTION OR TO PAY THE FEE WITHIN THE PRESCRIBED TIME-LIMIT Effective date: 20240718 |
|
| PGFP | Annual fee paid to national office [announced via postgrant information from national office to epo] |
Ref country code: PT Payment date: 20240829 Year of fee payment: 4 |
|
| PGFP | Annual fee paid to national office [announced via postgrant information from national office to epo] |
Ref country code: BE Payment date: 20240730 Year of fee payment: 4 |
|
| PG25 | Lapsed in a contracting state [announced via postgrant information from national office to epo] |
Ref country code: ES Free format text: LAPSE BECAUSE OF FAILURE TO SUBMIT A TRANSLATION OF THE DESCRIPTION OR TO PAY THE FEE WITHIN THE PRESCRIBED TIME-LIMIT Effective date: 20240417 |
|
| PGFP | Annual fee paid to national office [announced via postgrant information from national office to epo] |
Ref country code: CZ Payment date: 20240801 Year of fee payment: 4 |
|
| PG25 | Lapsed in a contracting state [announced via postgrant information from national office to epo] |
Ref country code: AT Free format text: LAPSE BECAUSE OF FAILURE TO SUBMIT A TRANSLATION OF THE DESCRIPTION OR TO PAY THE FEE WITHIN THE PRESCRIBED TIME-LIMIT Effective date: 20240417 |
|
| PG25 | Lapsed in a contracting state [announced via postgrant information from national office to epo] |
Ref country code: PL Free format text: LAPSE BECAUSE OF FAILURE TO SUBMIT A TRANSLATION OF THE DESCRIPTION OR TO PAY THE FEE WITHIN THE PRESCRIBED TIME-LIMIT Effective date: 20240417 |
|
| PG25 | Lapsed in a contracting state [announced via postgrant information from national office to epo] |
Ref country code: LV Free format text: LAPSE BECAUSE OF FAILURE TO SUBMIT A TRANSLATION OF THE DESCRIPTION OR TO PAY THE FEE WITHIN THE PRESCRIBED TIME-LIMIT Effective date: 20240417 |
|
| PG25 | Lapsed in a contracting state [announced via postgrant information from national office to epo] |
Ref country code: PL Free format text: LAPSE BECAUSE OF FAILURE TO SUBMIT A TRANSLATION OF THE DESCRIPTION OR TO PAY THE FEE WITHIN THE PRESCRIBED TIME-LIMIT Effective date: 20240417 Ref country code: NO Free format text: LAPSE BECAUSE OF FAILURE TO SUBMIT A TRANSLATION OF THE DESCRIPTION OR TO PAY THE FEE WITHIN THE PRESCRIBED TIME-LIMIT Effective date: 20240717 Ref country code: LV Free format text: LAPSE BECAUSE OF FAILURE TO SUBMIT A TRANSLATION OF THE DESCRIPTION OR TO PAY THE FEE WITHIN THE PRESCRIBED TIME-LIMIT Effective date: 20240417 Ref country code: HR Free format text: LAPSE BECAUSE OF FAILURE TO SUBMIT A TRANSLATION OF THE DESCRIPTION OR TO PAY THE FEE WITHIN THE PRESCRIBED TIME-LIMIT Effective date: 20240417 Ref country code: GR Free format text: LAPSE BECAUSE OF FAILURE TO SUBMIT A TRANSLATION OF THE DESCRIPTION OR TO PAY THE FEE WITHIN THE PRESCRIBED TIME-LIMIT Effective date: 20240718 Ref country code: ES Free format text: LAPSE BECAUSE OF FAILURE TO SUBMIT A TRANSLATION OF THE DESCRIPTION OR TO PAY THE FEE WITHIN THE PRESCRIBED TIME-LIMIT Effective date: 20240417 Ref country code: BG Free format text: LAPSE BECAUSE OF FAILURE TO SUBMIT A TRANSLATION OF THE DESCRIPTION OR TO PAY THE FEE WITHIN THE PRESCRIBED TIME-LIMIT Effective date: 20240417 Ref country code: AT Free format text: LAPSE BECAUSE OF FAILURE TO SUBMIT A TRANSLATION OF THE DESCRIPTION OR TO PAY THE FEE WITHIN THE PRESCRIBED TIME-LIMIT Effective date: 20240417 Ref country code: RS Free format text: LAPSE BECAUSE OF FAILURE TO SUBMIT A TRANSLATION OF THE DESCRIPTION OR TO PAY THE FEE WITHIN THE PRESCRIBED TIME-LIMIT Effective date: 20240717 |
|
| PGFP | Annual fee paid to national office [announced via postgrant information from national office to epo] |
Ref country code: NO Payment date: 20240731 Year of fee payment: 4 |
|
| PG25 | Lapsed in a contracting state [announced via postgrant information from national office to epo] |
Ref country code: NO Free format text: LAPSE BECAUSE OF FAILURE TO SUBMIT A TRANSLATION OF THE DESCRIPTION OR TO PAY THE FEE WITHIN THE PRESCRIBED TIME-LIMIT Effective date: 20240717 |
|
| PGRI | Patent reinstated in contracting state [announced from national office to epo] |
Ref country code: NO Effective date: 20241023 |
|
| REG | Reference to a national code |
Ref country code: DE Ref legal event code: R026 Ref document number: 602021011833 Country of ref document: DE |
|
| PG25 | Lapsed in a contracting state [announced via postgrant information from national office to epo] |
Ref country code: DK Free format text: LAPSE BECAUSE OF FAILURE TO SUBMIT A TRANSLATION OF THE DESCRIPTION OR TO PAY THE FEE WITHIN THE PRESCRIBED TIME-LIMIT Effective date: 20240417 |
|
| PLBI | Opposition filed |
Free format text: ORIGINAL CODE: 0009260 |
|
| PG25 | Lapsed in a contracting state [announced via postgrant information from national office to epo] |
Ref country code: EE Free format text: LAPSE BECAUSE OF FAILURE TO SUBMIT A TRANSLATION OF THE DESCRIPTION OR TO PAY THE FEE WITHIN THE PRESCRIBED TIME-LIMIT Effective date: 20240417 |
|
| PG25 | Lapsed in a contracting state [announced via postgrant information from national office to epo] |
Ref country code: SK Free format text: LAPSE BECAUSE OF FAILURE TO SUBMIT A TRANSLATION OF THE DESCRIPTION OR TO PAY THE FEE WITHIN THE PRESCRIBED TIME-LIMIT Effective date: 20240417 Ref country code: RO Free format text: LAPSE BECAUSE OF FAILURE TO SUBMIT A TRANSLATION OF THE DESCRIPTION OR TO PAY THE FEE WITHIN THE PRESCRIBED TIME-LIMIT Effective date: 20240417 |
|
| PG25 | Lapsed in a contracting state [announced via postgrant information from national office to epo] |
Ref country code: SM Free format text: LAPSE BECAUSE OF FAILURE TO SUBMIT A TRANSLATION OF THE DESCRIPTION OR TO PAY THE FEE WITHIN THE PRESCRIBED TIME-LIMIT Effective date: 20240417 |
|
| PLAX | Notice of opposition and request to file observation + time limit sent |
Free format text: ORIGINAL CODE: EPIDOSNOBS2 |
|
| PG25 | Lapsed in a contracting state [announced via postgrant information from national office to epo] |
Ref country code: SM Free format text: LAPSE BECAUSE OF FAILURE TO SUBMIT A TRANSLATION OF THE DESCRIPTION OR TO PAY THE FEE WITHIN THE PRESCRIBED TIME-LIMIT Effective date: 20240417 Ref country code: SK Free format text: LAPSE BECAUSE OF FAILURE TO SUBMIT A TRANSLATION OF THE DESCRIPTION OR TO PAY THE FEE WITHIN THE PRESCRIBED TIME-LIMIT Effective date: 20240417 Ref country code: RO Free format text: LAPSE BECAUSE OF FAILURE TO SUBMIT A TRANSLATION OF THE DESCRIPTION OR TO PAY THE FEE WITHIN THE PRESCRIBED TIME-LIMIT Effective date: 20240417 Ref country code: NO Free format text: LAPSE BECAUSE OF FAILURE TO SUBMIT A TRANSLATION OF THE DESCRIPTION OR TO PAY THE FEE WITHIN THE PRESCRIBED TIME-LIMIT Effective date: 20240717 Ref country code: EE Free format text: LAPSE BECAUSE OF FAILURE TO SUBMIT A TRANSLATION OF THE DESCRIPTION OR TO PAY THE FEE WITHIN THE PRESCRIBED TIME-LIMIT Effective date: 20240417 Ref country code: DK Free format text: LAPSE BECAUSE OF FAILURE TO SUBMIT A TRANSLATION OF THE DESCRIPTION OR TO PAY THE FEE WITHIN THE PRESCRIBED TIME-LIMIT Effective date: 20240417 |
|
| PGRI | Patent reinstated in contracting state [announced from national office to epo] |
Ref country code: NO Effective date: 20241023 |
|
| PG25 | Lapsed in a contracting state [announced via postgrant information from national office to epo] |
Ref country code: MC Free format text: LAPSE BECAUSE OF FAILURE TO SUBMIT A TRANSLATION OF THE DESCRIPTION OR TO PAY THE FEE WITHIN THE PRESCRIBED TIME-LIMIT Effective date: 20240417 |
|
| 26 | Opposition filed |
Opponent name: GEA GROUP AG Effective date: 20250114 |
|
| PG25 | Lapsed in a contracting state [announced via postgrant information from national office to epo] |
Ref country code: LU Free format text: LAPSE BECAUSE OF NON-PAYMENT OF DUE FEES Effective date: 20240712 |
|
| PG25 | Lapsed in a contracting state [announced via postgrant information from national office to epo] |
Ref country code: LU Free format text: LAPSE BECAUSE OF NON-PAYMENT OF DUE FEES Effective date: 20240712 |
|
| PG25 | Lapsed in a contracting state [announced via postgrant information from national office to epo] |
Ref country code: SI Free format text: LAPSE BECAUSE OF FAILURE TO SUBMIT A TRANSLATION OF THE DESCRIPTION OR TO PAY THE FEE WITHIN THE PRESCRIBED TIME-LIMIT Effective date: 20240417 |
|
| PLAF | Information modified related to communication of a notice of opposition and request to file observations + time limit |
Free format text: ORIGINAL CODE: EPIDOSCOBS2 |
|
| PG25 | Lapsed in a contracting state [announced via postgrant information from national office to epo] |
Ref country code: SE Free format text: LAPSE BECAUSE OF FAILURE TO SUBMIT A TRANSLATION OF THE DESCRIPTION OR TO PAY THE FEE WITHIN THE PRESCRIBED TIME-LIMIT Effective date: 20240417 |
|
| PGFP | Annual fee paid to national office [announced via postgrant information from national office to epo] |
Ref country code: DE Payment date: 20250722 Year of fee payment: 5 |
|
| PLBB | Reply of patent proprietor to notice(s) of opposition received |
Free format text: ORIGINAL CODE: EPIDOSNOBS3 |
|
| PGFP | Annual fee paid to national office [announced via postgrant information from national office to epo] |
Ref country code: IT Payment date: 20250731 Year of fee payment: 5 |
|
| PGFP | Annual fee paid to national office [announced via postgrant information from national office to epo] |
Ref country code: GB Payment date: 20250724 Year of fee payment: 5 |
|
| PGFP | Annual fee paid to national office [announced via postgrant information from national office to epo] |
Ref country code: FR Payment date: 20250723 Year of fee payment: 5 |
|
| PGFP | Annual fee paid to national office [announced via postgrant information from national office to epo] |
Ref country code: CH Payment date: 20250801 Year of fee payment: 5 Ref country code: SE Payment date: 20250723 Year of fee payment: 5 |
|
| PG25 | Lapsed in a contracting state [announced via postgrant information from national office to epo] |
Ref country code: CY Free format text: LAPSE BECAUSE OF FAILURE TO SUBMIT A TRANSLATION OF THE DESCRIPTION OR TO PAY THE FEE WITHIN THE PRESCRIBED TIME-LIMIT; INVALID AB INITIO Effective date: 20210712 |
|
| PG25 | Lapsed in a contracting state [announced via postgrant information from national office to epo] |
Ref country code: CZ Free format text: LAPSE BECAUSE OF NON-PAYMENT OF DUE FEES Effective date: 20250712 |
|
| PLAB | Opposition data, opponent's data or that of the opponent's representative modified |
Free format text: ORIGINAL CODE: 0009299OPPO |
|
| REG | Reference to a national code |
Ref country code: CH Ref legal event code: L10 Free format text: ST27 STATUS EVENT CODE: U-0-0-L10-L00 (AS PROVIDED BY THE NATIONAL OFFICE) Effective date: 20260218 |
|
| PG25 | Lapsed in a contracting state [announced via postgrant information from national office to epo] |
Ref country code: HU Free format text: LAPSE BECAUSE OF FAILURE TO SUBMIT A TRANSLATION OF THE DESCRIPTION OR TO PAY THE FEE WITHIN THE PRESCRIBED TIME-LIMIT; INVALID AB INITIO Effective date: 20210712 |
|
| R26 | Opposition filed (corrected) |
Opponent name: GEA GROUP AKTIENGESELLSCHAFT Effective date: 20250114 |
|
| REG | Reference to a national code |
Ref country code: BE Ref legal event code: MM Effective date: 20250731 |
|
| PG25 | Lapsed in a contracting state [announced via postgrant information from national office to epo] |
Ref country code: NO Free format text: LAPSE BECAUSE OF NON-PAYMENT OF DUE FEES Effective date: 20250731 |
|
| PG25 | Lapsed in a contracting state [announced via postgrant information from national office to epo] |
Ref country code: BE Free format text: LAPSE BECAUSE OF NON-PAYMENT OF DUE FEES Effective date: 20250731 |
|
| PG25 | Lapsed in a contracting state [announced via postgrant information from national office to epo] |
Ref country code: PT Free format text: LAPSE BECAUSE OF NON-PAYMENT OF DUE FEES Effective date: 20260112 |