EP4116881A1 - Information processing device and machine learning method - Google Patents
Information processing device and machine learning method Download PDFInfo
- Publication number
- EP4116881A1 EP4116881A1 EP21764535.7A EP21764535A EP4116881A1 EP 4116881 A1 EP4116881 A1 EP 4116881A1 EP 21764535 A EP21764535 A EP 21764535A EP 4116881 A1 EP4116881 A1 EP 4116881A1
- Authority
- EP
- European Patent Office
- Prior art keywords
- data
- graph structure
- unit
- input data
- information processing
- Prior art date
- Legal status (The legal status is an assumption and is not a legal conclusion. Google has not performed a legal analysis and makes no representation as to the accuracy of the status listed.)
- Granted
Links
Images







Classifications
-
- G—PHYSICS
- G06—COMPUTING OR CALCULATING; COUNTING
- G06N—COMPUTING ARRANGEMENTS BASED ON SPECIFIC COMPUTATIONAL MODELS
- G06N3/00—Computing arrangements based on biological models
- G06N3/02—Neural networks
- G06N3/04—Architecture, e.g. interconnection topology
- G06N3/045—Combinations of networks
- G06N3/0455—Auto-encoder networks; Encoder-decoder networks
-
- G—PHYSICS
- G06—COMPUTING OR CALCULATING; COUNTING
- G06N—COMPUTING ARRANGEMENTS BASED ON SPECIFIC COMPUTATIONAL MODELS
- G06N3/00—Computing arrangements based on biological models
- G06N3/02—Neural networks
- G06N3/08—Learning methods
- G06N3/082—Learning methods modifying the architecture, e.g. adding, deleting or silencing nodes or connections
-
- G—PHYSICS
- G06—COMPUTING OR CALCULATING; COUNTING
- G06N—COMPUTING ARRANGEMENTS BASED ON SPECIFIC COMPUTATIONAL MODELS
- G06N3/00—Computing arrangements based on biological models
- G06N3/02—Neural networks
- G06N3/04—Architecture, e.g. interconnection topology
-
- G—PHYSICS
- G06—COMPUTING OR CALCULATING; COUNTING
- G06N—COMPUTING ARRANGEMENTS BASED ON SPECIFIC COMPUTATIONAL MODELS
- G06N3/00—Computing arrangements based on biological models
- G06N3/02—Neural networks
- G06N3/04—Architecture, e.g. interconnection topology
- G06N3/044—Recurrent networks, e.g. Hopfield networks
- G06N3/0442—Recurrent networks, e.g. Hopfield networks characterised by memory or gating, e.g. long short-term memory [LSTM] or gated recurrent units [GRU]
-
- G—PHYSICS
- G06—COMPUTING OR CALCULATING; COUNTING
- G06N—COMPUTING ARRANGEMENTS BASED ON SPECIFIC COMPUTATIONAL MODELS
- G06N3/00—Computing arrangements based on biological models
- G06N3/02—Neural networks
- G06N3/04—Architecture, e.g. interconnection topology
- G06N3/0475—Generative networks
-
- G—PHYSICS
- G06—COMPUTING OR CALCULATING; COUNTING
- G06N—COMPUTING ARRANGEMENTS BASED ON SPECIFIC COMPUTATIONAL MODELS
- G06N3/00—Computing arrangements based on biological models
- G06N3/02—Neural networks
- G06N3/04—Architecture, e.g. interconnection topology
- G06N3/0495—Quantised networks; Sparse networks; Compressed networks
-
- G—PHYSICS
- G06—COMPUTING OR CALCULATING; COUNTING
- G06N—COMPUTING ARRANGEMENTS BASED ON SPECIFIC COMPUTATIONAL MODELS
- G06N3/00—Computing arrangements based on biological models
- G06N3/02—Neural networks
- G06N3/08—Learning methods
- G06N3/084—Backpropagation, e.g. using gradient descent
-
- G—PHYSICS
- G06—COMPUTING OR CALCULATING; COUNTING
- G06N—COMPUTING ARRANGEMENTS BASED ON SPECIFIC COMPUTATIONAL MODELS
- G06N3/00—Computing arrangements based on biological models
- G06N3/02—Neural networks
- G06N3/08—Learning methods
- G06N3/0895—Weakly supervised learning, e.g. semi-supervised or self-supervised learning
-
- G—PHYSICS
- G06—COMPUTING OR CALCULATING; COUNTING
- G06N—COMPUTING ARRANGEMENTS BASED ON SPECIFIC COMPUTATIONAL MODELS
- G06N3/00—Computing arrangements based on biological models
- G06N3/02—Neural networks
- G06N3/08—Learning methods
- G06N3/09—Supervised learning
-
- G—PHYSICS
- G06—COMPUTING OR CALCULATING; COUNTING
- G06N—COMPUTING ARRANGEMENTS BASED ON SPECIFIC COMPUTATIONAL MODELS
- G06N3/00—Computing arrangements based on biological models
- G06N3/02—Neural networks
- G06N3/04—Architecture, e.g. interconnection topology
- G06N3/042—Knowledge-based neural networks; Logical representations of neural networks
-
- G—PHYSICS
- G06—COMPUTING OR CALCULATING; COUNTING
- G06N—COMPUTING ARRANGEMENTS BASED ON SPECIFIC COMPUTATIONAL MODELS
- G06N3/00—Computing arrangements based on biological models
- G06N3/02—Neural networks
- G06N3/04—Architecture, e.g. interconnection topology
- G06N3/047—Probabilistic or stochastic networks
-
- G—PHYSICS
- G06—COMPUTING OR CALCULATING; COUNTING
- G06N—COMPUTING ARRANGEMENTS BASED ON SPECIFIC COMPUTATIONAL MODELS
- G06N3/00—Computing arrangements based on biological models
- G06N3/02—Neural networks
- G06N3/08—Learning methods
- G06N3/094—Adversarial learning
Definitions
- the present disclosure relates to an information processing device and a machine learning method.
- NPL 1 discloses a configuration in which a relationship between elements included in input data is extracted as a graph structure to perform post-processing using the graph structure as an intermediate expression.
- NPL 1 discloses a configuration in which a syntax tree is generated by a reward increment nonnegative factor offset reinforcement characteristic eligibility (REINFORCE) algorithm and data structured by the syntax tree is reconfigured by a variational autoencoder (VAE) as the intermediate expression.
- REINFORCE reward increment nonnegative factor offset reinforcement characteristic eligibility
- VAE variational autoencoder
- the present disclosure has been made to solve the above problems, and an object of the present disclosure is to improve accuracy of the model that extracts a graph structure as the intermediate representation from input data.
- An information processing device extracts a graph structure representing a correlation between elements included in input data from the input data to generate output data from the graph structure.
- the information processing device includes an encoding unit, a sampling unit, a decoding unit, and a learning unit.
- the encoding unit extracts a feature amount of each of a plurality of vertices included in the graph structure from the input data to calculate a likelihood that an edge representing the correlation is connected to the vertex.
- the sampling unit determines the graph structure based on a conversion result of a Gumbel-Softmax function for the likelihood.
- the decoding unit receives the graph structure and the feature amount to generate the output data.
- the learning unit optimizes the decoding unit and the encoding unit by back propagation that targets a loss function for minimization, the loss function including an error between the output data and correct data.
- the loss function can also be differentiated by the determination processing for the graph structure by the sampling unit, so that the error between the output data and the correct data can be back-propagated from the output layer of the decoding unit to the input layer of the encoding unit by the back propagation.
- the optimization of the decoding unit and the encoding unit can be performed end-to-end from the output layer of the decoding unit to the input layer of the encoding unit, so that the accuracy of the graph structure as the intermediate representation and the accuracy of the output data can be improved.
- the information processing device may further include a reconfiguration unit configured to reconfigure the graph structure from the output data.
- the loss function may include an error between an output from the reconfiguration unit and a correct graph structure.
- the machine learning is performed such that the identity is maintained between the graph structure reconfigured by the reconfiguration unit and the correct graph structure, whereby lossless compression by the encoding unit is promoted.
- the accuracy of the graph structure as the intermediate representation and the accuracy of the output data can be further improved as compared with the configuration 1.
- the information processing device may further include an inference unit configured to receive the graph structure from the sampling unit to output an inference result for the input data.
- the learning unit performs unsupervised learning for the decoding unit and the encoding unit, and performs supervised learning for the inference unit.
- the lossless compression by the encoding unit is promoted, and inference accuracy of the inference unit can be improved by supervised learning for the inference unit.
- the input data may include first data and second data. Modality of the first data may be different from modality of the second data.
- the encoding unit may include a first encoder and a second encoder. The first encoder may extract a feature amount of the first data. The second encoder may extract a feature amount of the second data.
- the graph structure can be extracted from various input data.
- modality of the output data may be different from modality of the input data.
- various data can be generated from the graph structure.
- a machine learning method is performed by a processor that executes a machine learning program stored in a storage unit for a model that extracts a graph structure representing a correlation between elements included in input data from the input data to generate output data from the graph structure.
- the machine learning method includes: extracting a feature amount of each of a plurality of vertices included in the graph structure from the input data to calculate a likelihood that an edge representing the correlation is connected to the vertex; determining the graph structure based on a conversion result of a Gumbel-Softmax function for the likelihood; receiving the graph structure and the feature amount to generate the output data; and optimizing the model by back propagation that targets a loss function for minimization, the loss function including an error between the output data and correct data.
- the loss function can be also differentiated by determining the graph structure, so that the error between the output data and the correct data can be back-propagated from the output layer of the model to the input layer of the model by the back propagation.
- the optimization of the model can be performed end-to-end from the output layer of the model to the input layer of the model, so that the accuracy of the graph structure as the intermediate representation and the accuracy of the output data can be improved.
- the accuracy of the model that extracts the graph structure as the intermediate representation from the input data can be improved.
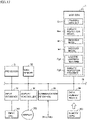
- Fig. 1 is a block diagram illustrating a configuration of an information processing device 1 according to a first embodiment.
- information processing device 1 includes an encoding unit 100, a sampling unit 130, a decoding unit 140, and a learning unit 150.
- Information processing device 1 extracts a graph structure representing a correlation between elements included in input data 10 from input data 10, and generates output data 20 from the graph structure. The case where the output data including procedure sequence data of food is generated from input data including image column data and foodstuff column data of a cooking procedure will be described in the first embodiment.
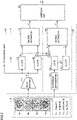
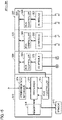
- Fig. 2 is a block diagram illustrating specific configurations of input data 10 and encoding unit 100 in Fig. 1 .
- input data 10 includes image column data 11 (first data) and foodstuff column data 12 (second data).
- Modality of image column data 11 is an image.
- Modality of foodstuff column data 12 is a character string.
- the modality of image column data 11 is different from the modality of foodstuff column data 12.
- the modality includes a format, a type, or a type of data.
- Image column data 11 includes images Im 1 to Im M .
- Each of images Im 1 to Im M represents the image of each procedure of the cooking, and the cooking is performed in order of the images Im 1 to Im M . That is, images Im 1 to Im M are ordered in this order.
- Foodstuff column data 12 includes character strings Tx 1 to Tx N .
- Each of character strings Tx 1 to Tx N represents a foodstuff name. In the process of the cooking, character strings Tx 1 to Tx N are used in this order. That is, character strings Tx 1 to Tx N are ordered in this order.
- Fig. 2 illustrates the case where a number of procedures M is four and a number of foodstuffs N is four.
- Character strings Tx1 to Tx4 represent "tomato", “pumpkin”, “mayonnaise”, and “ketchup", respectively.
- the number of procedures M is not limited to four, but may be less than or equal to three or greater than or equal to five. The same applies to the number of foodstuffs N. In addition, the number of procedures M and the number of foodstuffs N may be different.
- Encoding unit 100 includes an encoder 110 (first encoder) and an encoder 120 (second encoder).
- Encoder 110 includes a learned image encoder 111, a bidirectional long short-term memory (biLSTM) 112, 113 and a matrix estimator 114.
- Encoder 120 includes a dispersion representer 121, an LSTM 122, a biLSTM 123, and a matrix estimator 124.
- dispersion representer 121 includes word2vec.
- Feature vectors ⁇ 1 to ⁇ M correspond to feature vectors v 1 to v M , respectively.
- Feature vectors ⁇ 1 to ⁇ M correspond to feature vectors v 1 to v M , respectively.
- Index k is a natural number.
- Matrix estimator 114 receives vector representations ⁇ , ⁇ , estimates the adjacent relation of images Im 1 to Im M , and outputs the adjacent relation as an adjacent matrix Y.
- the estimation of the adjacent relation between images Im 1 to Im M means that likelihood that an edge exists between two vertices is calculated with each of images Im 1 to Im M as a vertex of a graph structure.
- a component Y i,j of adjacent matrix Y is expressed by the following equation (1).
- a vector expression ⁇ ( ⁇ 1 , ⁇ 2 ,..., ⁇ k ,..., ⁇ M ) (feature amount) is calculated from vector expressions ⁇ , ⁇ , and vector expression ⁇ is input to matrix estimator 124.
- the component of each dimension of feature vector cok is the larger one of the components of the dimensions of feature vectors ⁇ k , ⁇ k .
- Dispersion representer 121 outputs a dispersion representation of character string Txk included in foodstuff column data 12.
- Feature vectors ⁇ 1 to ⁇ N correspond to feature vectors g 1 to g N , respectively.
- Matrix estimator 124 receives vector representations ⁇ , ⁇ , estimates adjacent relationships between images Im 1 to Im M and character strings Tx 1 to Tx N , and outputs the adjacent relationships as an adjacent matrix X.
- the estimation of the adjacent relation between images Im 1 to Im M and character strings Tx 1 to Tx N means that each of character strings Tx 1 to Tx N is set as the vertex of the graph structure and the likelihood that the edge exists between the vertex corresponding to each of character strings Tx 1 to Tx N and the vertex corresponding to each of images Im 1 to Im 4 is calculated.
- Fig. 3 is a schematic diagram of adjacent matrix Y in Fig. 2 .
- the darker the hatching applied to each component the greater the likelihood of the component.
- the likelihood of existence of the edge from the vertex included in a row to a vertex included in a column is a component of the adjacent matrix specified by the row and the column. That is, adjacent matrix Y represents a directed graph structure.
- the likelihood of the existence of the edge from the vertex included in the column toward the vertex included in the row may be the component of the adjacent matrix specified by the row and the column.
- Adjacent matrix Y representing the directed graph structure may be transformed into an adjacent matrix T representing an undirected graph structure as needed.
- an average value of the respective components of adjacent matrix Y and the components obtained by inverting the rows and columns of the components can be set as the components of adjacent matrix T corresponding to the two components such that a transposed matrix of adjacent matrix T is equal to adjacent matrix T.
- Fig. 4 is a schematic diagram of adjacent matrix X in Fig. 2 .
- the relationship between density of the hatching and the likelihood is similar to that in Fig. 3 .
- the likelihood of whether the edge exists between the vertex included in the row and the vertex included in the column is the component of the adjacent matrix specified by the row and the column.
- Adjacent matrix X represents the undirected graph structure.
- sampling unit 130 receives adjacent matrices X, Y, and outputs a tree structure Tr (graph structure) in which the vertex corresponding to each of character strings Tx 1 to Tx N is set to a leaf node, the vertex corresponding to the last image in image column data 11 is set to a root node, and the vertex corresponding to another image is set to a node.
- Tr graph structure
- Sampling unit 130 uses the Gumbel-Softmax function (see NPL 2) to convert the likelihood of each component of adjacent matrices X, Y into a probability that the edge exists between two vertices corresponding to the component (reparameterization trick).
- Sampling unit 130 converts adjacent matrices X, Y into adjacent matrices A, B, respectively, by the reparameterization trick.
- Components A i,j , B i,j are expressed as the following equations (3), (4), respectively.
- ⁇ i,k ⁇ i,k are noises sampled from a gumbel (0,1) distribution.
- ⁇ is a temperature parameter of the Gumbel-Softmax function.
- Sampling unit 130 determines the presence or absence of a branch (edge) between nodes using adjacent matrices A, B, and determines tree structure Tr.
- Fig. 5 is a view illustrating tree structure Tr in Fig. 1 .
- nodes Nd 1 to Nd 4 correspond to images Im 1 to Im 4 , respectively.
- Node Nd 4 is a root node.
- Leaf nodes Lf 1 to Lf 4 correspond to character strings Tx 1 to Tx 4 , respectively.
- leaf node Lf 1 and node Nd 1 are connected by a branch Br 1 .
- Leaf node Lf 2 and node Nd 2 are connected by a branch Br 2 .
- Leaf node Lf 3 and root node Nd 4 are connected by a branch Br 3 .
- Leaf node Lf 4 and root node Nd4 are connected by a branch Br 4 .
- Nodes Nd 1 and Nd 3 are connected by a branch Br 5 extending from node Nd 1 toward node Nd 3 .
- Nodes Nd 2 and Nd 3 are connected by a branch Br6 extending from node Nd2 toward node Nd3.
- Node Nd3 and root node Nd4 are connected by a branch Br 7 from node Nd 3 toward root node Nd 4 .
- Tree structure Tr indicates that the result of the procedure illustrated in image Im 1 and the result of the procedure illustrated in image Im2 are used in the procedure illustrated in image Im3, and that the result of the procedure illustrated in image Im3 is used in the procedure illustrated in image Im 4 .
- tree structure Tr indicates that the foodstuff of character string Tx 1 is used in the procedure illustrated in image Im 1 , that the foodstuff of character string Tx 2 is used in the procedure illustrated in image Im2, and that the foodstuff of each of character strings Tx 3 , Tx4 is used in the procedure illustrated in image Im 4 .
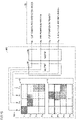
- Fig. 6 is a view illustrating adjacent matrixes X1, Y1 representing tree structure Tr in Fig. 5 .
- Adjacent matrices X1, Y1 are determined by sampling unit 130 through adjacent matrices A, B, respectively. For example, sampling unit 130 sets the component corresponding to the maximum value in each row of adjacent matrices A, B to 1, sets other components to 0, and determines adjacent matrices X1, Y1 with each row as one-hot representation.
- each row or each column may be expressed as overlap of at least two one-hot expressions by ensemble Gumbel-Softmax (see NPL 3).
- a characteristic of the extracted graph structure can be considered in addition to the conversion result of the reparameterization trick using the Gumbel-Softmax function for the likelihood of each component of adjacent matrices X, Y. For example, because the edge (self-loop) from a certain node to the node is not allowed in tree structure Tr indicating the cooking procedure, a diagonal component of adjacent matrix Y1 becomes 0. In addition, because the node higher in the hierarchy than the root node does not exist in tree structure Tr, each component of the fourth row corresponding to the root node in adjacent matrix Y1 becomes 0.
- Adjacent matrix Y1 representing the directed graph structure may be converted into adjacent matrix T1 representing the undirected graph structure as needed.
- adjacent matrix Y1 for example, a maximum value, a minimum value, or a value randomly selected from among the components of adjacent matrix Y1 and the components obtained by reversing the rows and columns of the components can be set as the components of adjacent matrix T1 corresponding to the two components such that the transposed matrix of adjacent matrix T1 is equal to adjacent matrix T1.
- Fig. 7 is a block diagram illustrating a specific configuration of decoding unit 140 and output data 20 in Fig. 1 .
- decoding unit 140 includes an LSTM 141, an encoder decoder model 142, and a sampling unit 143.
- LSTM 141 includes tree-LSTM (see NPL 4), and for example, includes a child-sum LSTM.
- Encoder decoder model 142 receives vector representation H from LSTM 141 and receives vector representation V from image encoder 111 in Fig. 2 .
- Encoder decoder model 142 converts a pair (h k ,v k ) into character string Stk, and outputs output data 20 including character strings St 1 to St M that are the procedure column data.
- the modality of output data 20 is the character string and is different from the modality of image column data 11 included in input data 10.
- Character string St 1 represents "cut the tomato into bite-sized pieces”.
- Character string St 2 represents "fry the squash in a frying pan”.
- Character string St 3 represents "place the squash on top of the tomato”.
- Character string St 4 represents "add ketchup and mayonnaise”.
- Output data 20 indicates that the cooking is performed in the order of character strings St 1 to St M . That is, character strings St 1 to St M are ordered in this order.
- encoder decoder model 142 a word is output using the Gumbel-Softmax function.
- Learning unit 150 optimizes decoding unit 140 and encoding unit 100 by back propagation that targets a loss function L 1 for minimization.
- Loss function L 1 is expressed as the following equation (5).
- Loss function L 1 defines an overall error generated in the process of performing the processing from encoding unit 100 to decoding unit 140 as a sum of loss functions L T and L P .
- Loss function L T defines a cross entropy error between adjacent matrices X, Y output from encoding unit 100 and a previously-prepared correct answer matrix (correct answer graph structure).
- Loss function L P defines the cross entropy error between the output data output from decoding unit 140 and previously-prepared correct answer data.
- Loss function L 1 can be differentiated by determination processing of the graph structure by sampling unit 130 by the reparameterization trick, so that the error between output data 20 and the correct data can be back-propagated from the output layer of decoding unit 140 to the input layer of encoding unit 100 by the back propagation.
- the optimization of decoding unit 140 and encoding unit 100 can be performed end-to-end from the output layer of decoding unit 140 to the input layer of encoding unit 100, so that the accuracy of the graph structure as the intermediate representation and the accuracy of the output data can be improved.
- Fig. 8 is a flowchart illustrating a flow of a machine learning method performed in information processing device 1.
- encoding unit 100 extracts the feature amount of the element (vertex) included in input data 10, and advances the processing to S12.
- encoding unit 100 calculates the likelihood that the edge exists between the two vertices using cosine similarity between the two vertices. Similarity or a distance other than the cosine similarity may be used for the calculation of the likelihood.
- sampling unit 130 performs a reparameterization trick using the Gumbel-Softmax function to determine the graph structure.
- decoding unit 140 generates the output data from the graph structure from sampling unit 130 and the feature amount of each vertex from encoding unit 100.
- learning unit 150 optimizes the parameter included in each of decoding unit 140 and encoding unit 100 by the back propagation that targets loss function L 1 for minimization, and ends the machine learning method.
- the parameter includes a weight and bias of the neural network included in decoding unit 140 and encoding unit 100.
- the information processing device and the machine learning method of the first embodiment it is possible to improve the accuracy of the model that extracts the graph structure from the input data as the intermediate representation.
- the adjacent matrix is reconfigured from output data.
- the machine learning is performed such that the identity is maintained between the reconfigured adjacent matrix and the adjacent matrix output from the encoding unit, whereby lossless compression by the encoding unit is promoted.
- the accuracy of the graph structure as the intermediate representation and the accuracy of the output data can be further improved as compared with the first embodiment.
- Fig. 9 is a block diagram illustrating a configuration of an information processing device 1A according to a modification of the first embodiment.
- the configuration of information processing device 1A is a configuration in which learning unit 150 is replaced with a learning unit 150A while a reconfiguration unit 160 is added to the configuration of information processing device 1 in Fig. 1 .
- the other configurations are the same, and the description thereof will not be repeated.
- reconfiguration unit 160 receives output data 20 and receives vector representations ⁇ , ⁇ from encoding unit 100.
- Fig. 10 is a block diagram illustrating a specific configuration of reconfiguration unit 160 in Fig. 9 .
- reconfiguration unit 160 includes biLSTMs 161, 162 and a matrix estimator 163.
- biLSTM 161 receives output data 20 and outputs a feature vector obtained by combining the first hidden layer and the last hidden layer for each of character strings St1 to StM.
- Feature vectors ⁇ 1 to ⁇ M correspond to character strings St 1 to St M , respectively.
- Matrix estimator 163 receives vector representations ⁇ , ⁇ , A, estimates the adjacent relation of character strings Tx 1 to Tx M and character strings St 1 to St M as an adjacent matrix C, and estimates the adjacent relation of images Im 1 to Im M and character strings St 1 to St M as an adjacent matrix D.
- Adjacent matrices C, D are expressed as the following equations (6), (7), respectively.
- a loss function L R that defines an error between adjacent matrices C, D and the correct answer matrix used to calculate the error of adjacent matrices X, Y output from encoding unit 100 is added to loss function L 1 .
- a loss function L 2 defining the overall error in the modification of the first embodiment is expressed by the following equation (8).
- a coefficient ⁇ of loss function L 2 is a hyperparameter.
- Loss function L R may be a loss function that defines the error between adjacent matrices C, D and adjacent matrices X, Y (correct data).
- a learning unit 150A optimizes the parameter included in each of reconfiguration unit 160, decoding unit 140, and encoding unit 100 by the back propagation that targets loss function L 2 for minimization.
- Table 1 GLocal Attention Cascading Networks
- BLEU BiLingual Evaluation Understudy
- BLEU4 Recall-Oriented Understudy for Gisting Evaluation Longest common subsequence
- CIDEr Consensus-based Image Description Evaluation
- METEOR Metric for Evaluation of Translation with Explicit ORdering
- the performance of the first embodiment exceeds the performance of the comparative example.
- the performance of the modification of the first embodiment exceeds the performance of the first embodiment.
- the accuracy of the model extracting the graph structure from the input data as the intermediate representation can be further improved as compared with the first embodiment.
- the configuration in which the tree structure is extracted as the graph structure from the input data has been described in the first embodiment.
- the graph structure extracted from the input data is not limited to the tree structure, but for example, may be an N-graph structure (N is a natural number greater than or equal to 2).
- N is a natural number greater than or equal to 2.
- a configuration in which a two-graph structure is extracted from input data will be described as an example of the N-graph structure.
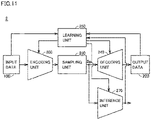
- Fig. 11 is a block diagram illustrating a configuration of an information processing device 2 of the second embodiment.
- information processing device 2 includes an encoding unit 200, a sampling unit 230, a decoding unit 240, a learning unit 250, and an inference unit 270.
- Encoding unit 200, sampling unit 230, decoding unit 240, and learning unit 250 form a variational autoencoder (VAE).
- VAE variational autoencoder
- Encoding unit 200 extracts a feature amount of each of a plurality of vertices of the graph structure included in an input data 10B. Encoding unit 200 divides the plurality of vertices into two subsets Sb 1 , Sb 2 having no common vertex. Encoding unit 200 calculates the likelihood that the edge exists between the vertex included in subset Sb 1 and the vertex included in subset Sb 2 , and outputs the adjacent matrix having the likelihood as the component to sampling unit 230. That is, encoding unit 200 performs two-graph matching between subsets Sb 1 and Sb 2 .
- Sampling unit 230 performs the reparameterization trick using the Gumbel-Softmax function on the adjacent matrix from encoding unit 200, determines a two-graph structure Bp, and outputs two-graph structure Bp and the feature amount of each of the plurality of vertices included in two-graph structure Bp to decoding unit 240 and inference unit 270.
- Decoding unit 240 reproduces an output data 20B from two-graph structure Bp and the feature amount.
- Inference unit 270 performs inference based on two-graph structure Bp and the feature amount, and outputs an inference result.
- inference unit 270 includes a graph neural network (GNN).
- GNN graph neural network
- Learning unit 250 optimizes inference unit 270, decoding unit 240, and encoding unit 200 by the back propagation.
- the loss function to be targeted for minimization in the back propagation includes the error between output data 20B and input data 10B (correct data) and the error between the inference result of inference unit 270 and the correct data included in the learning data set. That is, learning unit 250 performs semi-supervised learning on inference unit 270, decoding unit 240, and encoding unit 200. Specifically, learning unit 250 performs unsupervised learning on decoding unit 240 and encoding unit 200, and performs supervised learning on inference unit 270.
- the main purpose of information processing device 2 is to output the inference result by inference unit 270. Optimization of the VAE formed by encoding unit 200, sampling unit 230, decoding unit 240, and learning unit 250 is positioned as a subtask implementing lossless compression from input data 10B to the two-graph structure.
- Fig. 12 is a view illustrating an example of two-graph structure Bp between a plurality of users and a plurality of companies extracted from input data 10B.
- Fig. 12 illustrates a correlation between users Us 1 , Us2, Us 3 , Us 4 and companies Cm 1 , Cm 2 , Cm 3 , Cm 4 , Cm 5 .
- user Us 1 and company Cm 2 are connected by an edge Rs 1 .
- User Us 2 and company Cm4 are connected by an edge Rs 2 .
- User Us 3 and company Cm 3 are connected by an edge Rs 3 .
- Fig. 13 is a view illustrating a matrix representing two-graph structure Bp in Fig. 12 .
- Inference unit 270 in Fig. 11 receives two-graph structure Bp, infers the company matching the needs of each user, and recommends the company to the user.
- the accuracy of the model that extracts the graph structure from the input data as the intermediate representation can be improved.
- a configuration in which a plurality of sensors is structured as a graph structure based on time-series data of detection values of a plurality of sensors in a plurality of processes included in a manufacturing facility to specify a process in which a defect is generated in a product will be described in a third embodiment.
- Fig. 14 is a schematic diagram illustrating a configuration example of a management system 3000 of the third embodiment.
- management system 3000 is associated with a manufacturing facility 30 including a plurality of processes, and provides a function managing quality of the product manufactured by manufacturing facility 30.
- five consecutive processes Pr 1 , Pr 2 , Pr 3 , Pr 4 , Pr 5 are illustrated along a conveyor 307 conveying a workpiece.
- the workpiece passes through processes Pr 1 to Pr 5 in this order.
- a sensor detecting the state of the process is installed.
- Processes Pr 1 to Pr 5 are controlled and monitored by programmable logic controllers (PLCs) 301, 302, 303, 304, 305 that are an example of the control device.
- PLCs programmable logic controllers
- PLCs 301 to 305 are connected so as to be able to perform data communication through a local network 306.
- PLCs 301 to 305 transmit state information related to the process to be controlled to a relay server device 308 on local network 306 every predetermined period or every event.
- the state information includes time-series data (sensor time-series data) of a plurality of detection values detected at a plurality of sampling times by the sensor provided in the process.
- Relay server device 308 transfers the state information from each of PLCs 301 to 305 to a collection and analysis server device 3 (information processing device) through the Internet. Relay server device 308 may perform necessary preprocessing on the state information.
- Collection and analysis server device 3 collects the state information received from relay server device 308 and analyzes the collected information. Collection and analysis server device 3 outputs an analysis result to a terminal device 309 through the Internet when a predetermined condition is satisfied or when a request is received from terminal device 309.
- Fig. 14 illustrates a configuration in which PLCs are provided in each of the plurality of processes installed in single manufacturing facility 30 and the PLCs are connected to relay server device 308 through the same local network 306 as a typical example, but the present invention is not limited thereto.
- a configuration in which a plurality of PLCs is directly connected to collection and analysis server device 3 may be adopted without disposing relay server device 308. In this case, each PLC transmits required information to collection and analysis server device 3.
- a plurality of relay server devices 308 may be provided.
- a certain relay server device 308 may transfer the state information from some PLCs to collection and analysis server device 3, and another relay server device 308 may transfer the state information from the remaining PLCs to collection and analysis server device 3.
- FIG. 15 is a schematic diagram illustrating an example of a hardware configuration of PLCs 301 to 305 constituting management system 3000 in Fig. 14 .
- each of PLCs 301 to 305 includes an arithmetic unit 310 and one or a plurality of functional units 320.
- Arithmetic unit 310 is an arithmetic device that executes a previously-stored user program or the like, acquires a field signal (information indicating the state of the facility to be controlled, or the like) from functional unit 320, and outputs a required control signal through functional unit 320.
- Arithmetic unit 310 includes a processor 312 that executes the user program and the like, a memory 316 that stores the user program, an operating system (OS), various data, and the like, a bus controller 314 that controls data exchange through an internal bus 326, and a communication interface 318.
- Memory 316 may be configured by combining a volatile storage device such as a dynamic random access memory (DRAM) and a nonvolatile storage device such as a flash memory.
- Processor 312 acquires a detection value from a sensor 315 installed in the process corresponding to each of PLCs 301 to 305.
- the detection value includes a current value, a voltage value, a power value, a temperature, humidity, or a vibration value.
- a plurality of sensors 315 may be provided in one process.
- One or a plurality of communication ports may be provided in communication interface 318 according to a target device that exchanges the data.
- a communication port conforming to a universal serial bus (USB) for connection to a personal computer or the like or a communication port supporting a serial line or a parallel line may be mounted.
- Ethernet registered trademark
- USB universal serial bus
- Functional unit 320 may provide an input output (IO) function exchanging various types of information with the facility to be controlled. Specifically, functions such as a digital input (DI) that receives a digital signal, a digital output (DO) that outputs a digital signal, an analog input (AI) that receives an analog signal, and an analog output (AO) that outputs an analog signal may be implemented. In addition, special functions such as proportional integral derivative (PID) control or motion control may be implemented.
- DI digital input
- DO digital output
- AI analog input
- AO analog output
- PID proportional integral derivative
- motion control may be implemented.
- each of functional units 320 that provides the IO function includes an IO module 322 and a bus controller 324 that controls data exchange with arithmetic unit 310 through internal bus 326.
- Each of IO modules 322 acquires state information from the process to be controlled, and sends the state information to relay server device 308 and collection and analysis server device 3 through arithmetic unit 310.
- any PLC may be adopted as long as the PLC includes an interface outputting internal information to an external device using any communication means.
- the hardware configuration of the PLC is not limited to the configuration in Fig. 15 , but any configuration can be adopted. In practice, it is assumed that manufacturers and models are not unified among the plurality of PLCs disposed in manufacturing facility 30 of Fig. 14 . In management system 3000, relay server device 308 absorbs such differences in the manufacturer and model of the PLC.
- Fig. 16 is a block diagram illustrating a functional configuration of collection and analysis server device 3 in Fig. 14 .
- collection and analysis server device 3 includes an encoding unit 300, a sampling unit 330, a decoding unit 340, and a quality inspection unit 370 (inference unit).
- An input data 10C includes sensor time-series data from PLC 301 to 305.
- Encoding unit 300, sampling unit 330, decoding unit 340, and a learning unit 350 form the variational autoencoder (VAE).
- VAE variational autoencoder
- Encoding unit 300 includes an encoder model Mc.
- Encoder model Mc extracts the graph structure representing a correlation between sensors included in input data 10C from input data 10C.
- Encoding unit 300 extracts the feature amount of each of a plurality of sensors that are the vertex of the graph structure from the sensor time-series data.
- Encoding unit 300 calculates the likelihood that the edge exists between two vertices included in the plurality of vertices, and outputs the adjacent matrix having the likelihood as the component to sampling unit 330.
- Sampling unit 330 performs the reparameterization trick using the Gumbel-Softmax function on the adjacent matrix from encoding unit 300, determines a graph structure Gs, and outputs graph structure Gs and the feature amount of each of the plurality of vertices of graph structure Gs to decoding unit 340 and quality inspection unit 370.
- Decoding unit 340 includes a decoder model Md. Decoder model Md reproduces output data 20C from graph structure Gs and the feature amount.
- Quality inspection unit 370 includes a quality inspection model Mm.
- Quality inspection model Mm calculates quality data representing the quality of the product based on graph structure Gs and the feature amount.
- quality inspection part 370 includes GNN.
- Quality inspection unit 370 visualizes the error between the quality data and the reference quality data in graph structure Gs.
- the reference quality data is standard quality data corresponding to a normal product. The larger the error between the quality data and the reference quality data, the larger the defect degree included in the quality data.
- heat mapping of the error using Gradient-weighted Class Activation Mapping can be exemplified as a method for visualizing the error in graph structure Gs.
- Learning unit 350 optimizes the parameters of the neural network included in each of quality check model Mm, decoder model Md, and encoder model Mc by back propagation.
- the parameter includes the weight and the bias of the neural network.
- the loss function to be targeted for minimization in the back propagation includes the error between output data 20C and input data 10C (correct data) and the error between the inspection result of quality inspection unit 370 and the correct quality data included in the learning data set. That is, learning unit 350 performs the semi-supervised learning on quality inspection unit 370, decoding unit 340, and encoding unit 300. Specifically, learning unit 350 performs the unsupervised learning on decoding unit 340 and encoding unit 300, and performs the supervised learning on quality inspection unit 370.
- the main purpose of collection and analysis server device 3 is to output the inspection result by quality inspection unit 370.
- the optimization of the VAE formed by encoding unit 300, sampling unit 330, decoding unit 340, and learning unit 350 is positioned as a subtask implementing the lossless compression from input data 10C to the graph structure.
- FIG. 17 is a block diagram illustrating a hardware configuration of collection and analysis server device 3 in Fig. 14 .
- collection and analysis server device 3 includes a processor 31 that is an arithmetic processing unit, a main memory 32 and a hard disk 33 that are a storage unit, an input interface 34, a display controller 35, a communication interface 36, and a data reader/writer 38. These units are data-communicably connected to each other through a bus 39.
- Processor 31 includes a central processing unit (CPU). Processor 31 may further include a graphics processing unit (GPU). Processor 31 develops a program (code) stored in hard disk 33 in main memory 32 and executes the program in a predetermined order to perform various operations.
- CPU central processing unit
- GPU graphics processing unit
- Main memory 32 is typically a volatile storage device such as a dynamic random access memory (DRAM). Main memory 32 holds the program read from hard disk 33.
- DRAM dynamic random access memory
- Input interface 34 mediates data transmission between processor 31 and an input unit 361.
- input unit 361 includes a mouse, a keyboard, or a touch panel. That is, input interface 34 receives an operation command given by the user operating input unit 361.
- Display controller 35 is connected to a display 362 that is a typical example of the display device, and notifies the user of a result of image processing in processor 31 and the like. That is, display controller 35 is connected to display 362 to control the display on display 362.
- display 362 is a liquid crystal display, an organic EL (Electro Luminescence) display, or other display devices.
- Communication interface 36 mediates the data transmission between processor 31 and other external devices through the Internet.
- Communication interface 36 typically includes Ethernet (registered trademark), and a universal serial bus (USB).
- Data reader and writer 38 mediates the data transmission between processor 31 and a memory card 363 that is a storage medium.
- memory card 363 stores the program to be executed in collection and analysis server device 3.
- Data reader/writer 38 reads the program from memory card 363.
- Memory card 363 includes a general-purpose semiconductor storage device such as a compact flash (CF) and a secure digital (SD), a magnetic recording medium such as a flexible disk, and an optical recording medium such as a compact disk read only memory (CD-ROM).
- Another output device such as a printer may be connected to collection and analysis server device 3 as needed.
- Hard disk 33 is a non-volatile magnetic storage device. Hard disk 33 stores a learning data set Ds, quality inspection model Mm, encoder model Mc, decoder model Md, a machine learning program Pg1, and a quality inspection program Pg2. Various setting values and the like may be stored in hard disk 33. A semiconductor storage device such as a flash memory may be adopted in addition to or instead of hard disk 33.
- Learning data set Ds includes a plurality of learning data.
- Each of the plurality of learning data is a combination of time-series data of the detection value by each sensor of the plurality of processes through which the product passes and correct quality data corresponding to the quality of the product.
- Machine learning program Pg1 Learning data set Ds, encoder model Mc, decoder model Md, and quality check model Mm are referred to in machine learning program Pg1.
- Processor 31 that executes machine learning program Pg1 implements encoding unit 300, sampling unit 330, decoding unit 340, learning unit 350, and quality inspection unit 370 in Fig. 16 .
- Processor 31 executes machine learning program Pg1 to adapt each of encoder model Mc, decoder model Md, and quality check model Mm to the learned state.
- Encoder model Mc and quality inspection model Mm are referred to in quality inspection program Pg2.
- Processor 31 executes quality inspection program Pg2 to calculate the quality data of the product from the sensor time-series data corresponding to the product, and visualizes the error between the quality data and the reference quality data in graph structure Gs.
- the error visualized in graph structure Gs of the error is output to display 362 and terminal device 309.
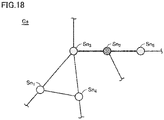
- Fig. 18 is a view illustrating an example of graph structure Gs visualized together with the error between the quality data and the reference quality data.
- vertexes Sn 1 to Sn 5 correspond to the sensors provided in processes Pr 1 to Pr 5 in Fig. 14 , respectively.
- a thicker hatched vertex indicates that the detection value of the sensor corresponding to the vertex deviates from the normal value.
- vertex Sn 3 is connected to vertexes Sn 1 , Sn 2 , Sn 4 .
- Vertex Sn 5 is connected to vertex Sn 2 .
- Vertex Sn 2 is the thickest, and vertexes Sn 1 , Sn4 are the thinnest.
- the edge connecting vertexes Sn 2 , Sn 3 and the edge connecting vertexes Sn 2 , Sn 5 are emphasized to be thicker than other edges.
- Graph structure Gs in which the error is visualized represents the correlation between the detection values of the plurality of sensors, and also illustrates the detection value of the sensor contributing to the defect (the error between the quality data and the reference quality data) included in the product.
- the detection value of the sensor most contributing to the defect included in the product is the detection value of the sensor provided in process Pr 2 corresponding to vertex Sn 2 . Consequently, there is a high possibility that the defect is generated in process Pr 2 .
- processes Pr 3 , Pr 5 corresponding to vertexes Sn 3 , Sn 5 connected to vertex Sn 2 in graph structure Gs there is the possibility that the defect is generated after process Pr 2 .
- processes Pr 1 , Pr 4 corresponding to vertexes Sn 1 , Sn 4 there is the lowest possibility that the defect is generated. According to graph structure Gs in which the error is visualized, the process causing the generation of the defect included in the product completed through the plurality of processes can be easily specified.
- the accuracy of the model that extracts the graph structure from the input data as the intermediate representation can be improved.
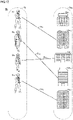
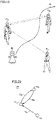
- Fig. 19 is a view illustrating route planning by a robot Rb corresponding to the information processing device of the embodiment.
- a visual field of robot Rb includes pedestrians Ps 1 , Ps 2 , Ps 3 .
- Pedestrian Ps 1 is watching pedestrian Ps 2 .
- Pedestrian Ps 2 is watching pedestrian Ps 3 .
- Pedestrian Ps 3 is watching pedestrian Ps 2 .
- Robot Rb extracts the directed graph structure having each of the pedestrians Ps 1 to Ps 3 as the vertex based on the posture, the line-of-sight direction, the relative positional relationship between the pedestrians Ps 1 to Ps 3 , and the like of each of the pedestrians Ps 1 to Ps 3 included in the visual field moving image that is time-series data.
- Fig. 20 is a view illustrating a directed graph structure Pf extracted by robot Rb in Fig. 19 .
- vertexes Vx 1 , Vx 2 , Vx 3 correspond to pedestrians Ps 1 , Ps 2 , Ps 3 in Fig. 19 , respectively.
- vertex Vx 1 and vertex Vx 2 are connected by an edge Eg 1 from vertex Vx 1 toward vertex Vx 2 .
- Vertex Vx 2 and vertex Vx 3 are connected by an edge Eg 2 from vertex Vx 2 toward vertex Vx 3 and an edge Eg 3 from vertex Vx 3 toward vertex Vx 2 .
- Fig. 21 is a view illustrating the matrix representation corresponding to directed graph structure Pf in Fig. 20 .
- Robot Rb inputs directed graph structure Pf in Fig. 21 to the inference unit, performs the people flow prediction for pedestrians Ps 1 to Ps 3 , and plans a route Rt in Fig. 19 capable of avoiding pedestrians Ps 1 to Ps 3 .
- the inference unit includes a social GAN (Generative Adversarial Network).
- the information processing device and the machine learning method of the embodiment are also applicable to prediction of traffic congestion.
- the graph structure in which a traffic volume at each time in a plurality of points connected by a road are used as time-series input data, each of the plurality of points at each time from the input data is set as the vertex, and a relationship in traffic volume between two points over different times is set as the edge, is extracted in the prediction of the traffic congestion. That is, the graph structure is extracted from the input data as the result of the N-graph matching in which a plurality of points at each time are set as a subset of the vertex set.
- the information processing device predicts the traffic congestion at each point in a specific time based on the graph structure.
- the information processing device and the machine learning method of the embodiment are also applicable to materials informatics (MI).
- MI materials informatics
- a physical property of a molecular structure is estimated by making the vertex and the edge of the graph structure extracted from the input data correspond to the atom and the bond of the molecular structure.
- An information processing device (1, 1A, 2, 3) that extracts a graph structure (Tr, Bp, Gs, Pf) representing a correlation between elements included in input data (10, 10B, 10C) from the input data (10, 10B, 10C) to generate output data (20, 20B, 20C) from the graph structure (Tr, Bp, Gs, Pf), the information processing device (1, 1A, 2, 3) including:
- the information processing device (1A) according to the configuration 1, further including a reconfiguration unit (160) configured to reconfigure the graph structure (Tr) from the output data (20), in which the loss function includes an error (L R ) between an output from the reconfiguration unit (160) and a correct graph structure.
- a reconfiguration unit (160) configured to reconfigure the graph structure (Tr) from the output data (20), in which the loss function includes an error (L R ) between an output from the reconfiguration unit (160) and a correct graph structure.
- the information processing device (2, 3) according to the configuration 1 or 2, further including an inference unit (270, 370) configured to receive the graph structure (Bp, Gs) from the sampling unit (230, 330) to output an inference result for the input data (10B, 10C), in which the learning unit (250, 350) performs unsupervised learning for the decoding unit (240, 340) and the encoding unit (100, 200), and performs supervised learning for the inference unit (270, 370).
- the information processing device (1, 1A) according to any one of the configurations 1 to 3, in which the input data (10) includes first data (11) and second data (12),
- the information processing device (1,1A) according to any one of the configurations 1 to 4, in which modality of the output data (20) is different from modality of the input data (10).
- a machine learning method performed by a processor (31) that executes a machine learning program (Pg1) stored in a storage unit (33) for a model (Mc, Md) that extracts a graph structure (Tr, Bp, Gs, Pf) representing a correlation between elements included in input data (10, 10B, 10C) from the input data (10, 10B, 10C) to generate output data (20, 20B, 20C) from the graph structure (Tr, Bp, Gs, Pf), the machine learning method including:
Landscapes
- Engineering & Computer Science (AREA)
- Theoretical Computer Science (AREA)
- Physics & Mathematics (AREA)
- Data Mining & Analysis (AREA)
- General Health & Medical Sciences (AREA)
- Biomedical Technology (AREA)
- Biophysics (AREA)
- Computational Linguistics (AREA)
- Life Sciences & Earth Sciences (AREA)
- Evolutionary Computation (AREA)
- Artificial Intelligence (AREA)
- Molecular Biology (AREA)
- Computing Systems (AREA)
- General Engineering & Computer Science (AREA)
- General Physics & Mathematics (AREA)
- Mathematical Physics (AREA)
- Software Systems (AREA)
- Health & Medical Sciences (AREA)
- Image Analysis (AREA)
Abstract
Description
- The present disclosure relates to an information processing device and a machine learning method.
- Conventionally, a configuration in which a relationship between elements included in input data is extracted as a graph structure to perform post-processing using the graph structure as an intermediate expression is known. For example, NPL 1 discloses a configuration in which a syntax tree is generated by a reward increment nonnegative factor offset reinforcement characteristic eligibility (REINFORCE) algorithm and data structured by the syntax tree is reconfigured by a variational autoencoder (VAE) as the intermediate expression.
-
- NPL 1:Pengcheng Yin, Chunting Zhou, Junxian He, Graham Neubig, "StructVAE: Tree-structured Latent Variable Models for Semi-supervised Semantic Parsing" (https://www.aclweb.org/anthology/P18-1070/), in Proceedings of the 56th Annual Meeting of the Association for Computational Linguistics (Volume 1: Long Papers), pp. 754-765.
- NPL 2: Eric Jang, Shixiang Gu, Ben Poole, "Categorical Reparameterization with Gumbel-Softmax", https://openreview.net/forum?id=rkE3y85ee, ICLR (International Conference on Learning Representations) 2017.
- NPL 3: Jianlong Chang, Xinbang Zhang, Yiwen Guo, Gaofeng Meng, Shiming Xiang, Chunhong Pan, "Differentiable Architecture Search with Ensemble Gumbel-Softmax", https://arxiv.org/abs/1905.01786.
- NPL 4:Kai Sheng Tai, Richard Socher, Christopher D. Manning, "Improved Semantic Representations From Tree-Structured Long Short-Term Memory Networks", https://www.aclweb.org/anthology/P15-1150/, in Proceedings of the 53rd Annual Meeting of the Association for Computational Linguistics and the 7th International Joint Conference on Natural Language Processing (Volume 1: Long Papers), pp. 1556-1566.
- In reinforcement learning including the REINFORCE algorithm used in
NPL 1, because a model (agent) of an optimization target advances optimization of a parameter while trial and error are repeated, sometimes it is difficult to specify a correct answer for the output of the model. Accordingly, in the reinforcement learning, it is known that sometimes it is difficult to improve the accuracy of the model as compared with machine learning using back propagation that differentiates a loss function that defines an error between output from the model and a correct answer to propagate the error from an output layer to an input layer of the model based on a chain law. In the configuration disclosed inNPL 1, there is room for improvement in accuracy of a learned model formed by the machine learning. - The present disclosure has been made to solve the above problems, and an object of the present disclosure is to improve accuracy of the model that extracts a graph structure as the intermediate representation from input data.
- An information processing device according to an example of the present disclosure extracts a graph structure representing a correlation between elements included in input data from the input data to generate output data from the graph structure. The information processing device includes an encoding unit, a sampling unit, a decoding unit, and a learning unit. The encoding unit extracts a feature amount of each of a plurality of vertices included in the graph structure from the input data to calculate a likelihood that an edge representing the correlation is connected to the vertex. The sampling unit determines the graph structure based on a conversion result of a Gumbel-Softmax function for the likelihood. The decoding unit receives the graph structure and the feature amount to generate the output data. The learning unit optimizes the decoding unit and the encoding unit by back propagation that targets a loss function for minimization, the loss function including an error between the output data and correct data.
- According to this disclosure, the loss function can also be differentiated by the determination processing for the graph structure by the sampling unit, so that the error between the output data and the correct data can be back-propagated from the output layer of the decoding unit to the input layer of the encoding unit by the back propagation. As a result, the optimization of the decoding unit and the encoding unit can be performed end-to-end from the output layer of the decoding unit to the input layer of the encoding unit, so that the accuracy of the graph structure as the intermediate representation and the accuracy of the output data can be improved.
- In the above disclosure, the information processing device may further include a reconfiguration unit configured to reconfigure the graph structure from the output data. The loss function may include an error between an output from the reconfiguration unit and a correct graph structure.
- According to this disclosure, the machine learning is performed such that the identity is maintained between the graph structure reconfigured by the reconfiguration unit and the correct graph structure, whereby lossless compression by the encoding unit is promoted. As a result, the accuracy of the graph structure as the intermediate representation and the accuracy of the output data can be further improved as compared with the
configuration 1. - In the above disclosure, the information processing device may further include an inference unit configured to receive the graph structure from the sampling unit to output an inference result for the input data. The learning unit performs unsupervised learning for the decoding unit and the encoding unit, and performs supervised learning for the inference unit.
- According to this disclosure, the lossless compression by the encoding unit is promoted, and inference accuracy of the inference unit can be improved by supervised learning for the inference unit.
- In the above disclosure, the input data may include first data and second data. Modality of the first data may be different from modality of the second data. The encoding unit may include a first encoder and a second encoder. The first encoder may extract a feature amount of the first data. The second encoder may extract a feature amount of the second data.
- According to this disclosure, the graph structure can be extracted from various input data.
- In the above disclosure, modality of the output data may be different from modality of the input data.
- According to this disclosure, various data can be generated from the graph structure.
- A machine learning method according to another example of the present disclosure is performed by a processor that executes a machine learning program stored in a storage unit for a model that extracts a graph structure representing a correlation between elements included in input data from the input data to generate output data from the graph structure. The machine learning method includes: extracting a feature amount of each of a plurality of vertices included in the graph structure from the input data to calculate a likelihood that an edge representing the correlation is connected to the vertex; determining the graph structure based on a conversion result of a Gumbel-Softmax function for the likelihood; receiving the graph structure and the feature amount to generate the output data; and optimizing the model by back propagation that targets a loss function for minimization, the loss function including an error between the output data and correct data.
- According to this disclosure, the loss function can be also differentiated by determining the graph structure, so that the error between the output data and the correct data can be back-propagated from the output layer of the model to the input layer of the model by the back propagation. As a result, the optimization of the model can be performed end-to-end from the output layer of the model to the input layer of the model, so that the accuracy of the graph structure as the intermediate representation and the accuracy of the output data can be improved.
- According to the information processing device and the machine learning method of the present disclosure, the accuracy of the model that extracts the graph structure as the intermediate representation from the input data can be improved.
-
-
Fig. 1 is a block diagram illustrating a configuration of an information processing device according to a first embodiment. -
Fig. 2 is a block diagram illustrating specific configurations of input data and an encoding unit inFig. 1 . -
Fig. 3 is a schematic diagram illustrating an adjacent matrix output from a first encoder inFig. 2 . -
Fig. 4 is a schematic diagram illustrating the adjacent matrix output from a second encoder inFig. 2 . -
Fig. 5 is a view illustrating a tree structure inFig. 1 . -
Fig. 6 is a view illustrating the adjacent matrix representing the tree structure inFig. 5 . -
Fig. 7 is a block diagram illustrating a specific configuration of a decoding unit and output data inFig. 1 . -
Fig. 8 is a flowchart illustrating a flow of a machine learning method performed in the information processing device. -
Fig. 9 is a block diagram illustrating a configuration of an information processing device according to a modification of the first embodiment. -
Fig. 10 is a block diagram illustrating a specific configuration of a reconfiguration unit inFig. 9 . -
Fig. 11 is a block diagram illustrating a configuration of an information processing device according to a second embodiment. -
Fig. 12 is a view illustrating an example of a two-graph structure between a plurality of users and a plurality of companies extracted from the input data. -
Fig. 13 is a view illustrating a matrix representing the two-graph structure inFig. 12 . -
Fig. 14 is a schematic diagram illustrating a configuration example of a management system according to a third embodiment. -
Fig. 15 is a schematic diagram illustrating an example of a hardware configuration of a PLC constituting the management system inFig. 14 . -
Fig. 16 is a block diagram illustrating a functional configuration of a collection and analysis server device inFig. 14 . -
Fig. 17 is a block diagram illustrating a hardware configuration of the collection and analysis server device inFig. 14 . -
Fig. 18 is a view illustrating an example of a graph structure visualized together with an error between quality data and reference quality data. -
Fig. 19 is a view illustrating route planning by a robot corresponding to the information processing device of the embodiment. -
Fig. 20 is a view illustrating a directed graph structure extracted by the robot inFig. 19 . -
Fig. 21 is a view illustrating matrix representation corresponding to the directed graph structure inFig. 20 . - Hereinafter, embodiments of the present invention will be described in detail with reference to the drawings. In the drawings, the same or corresponding portion is denoted by the same reference numeral, and the description thereof will not generally be repeated.
-
Fig. 1 is a block diagram illustrating a configuration of aninformation processing device 1 according to a first embodiment. As illustrated inFig. 1 ,information processing device 1 includes anencoding unit 100, asampling unit 130, adecoding unit 140, and alearning unit 150.Information processing device 1 extracts a graph structure representing a correlation between elements included ininput data 10 frominput data 10, and generatesoutput data 20 from the graph structure. The case where the output data including procedure sequence data of food is generated from input data including image column data and foodstuff column data of a cooking procedure will be described in the first embodiment. -
Fig. 2 is a block diagram illustrating specific configurations ofinput data 10 andencoding unit 100 inFig. 1 . As illustrated inFig. 2 ,input data 10 includes image column data 11 (first data) and foodstuff column data 12 (second data). Modality ofimage column data 11 is an image. Modality offoodstuff column data 12 is a character string. The modality ofimage column data 11 is different from the modality offoodstuff column data 12. The modality includes a format, a type, or a type of data. -
Image column data 11 includes images Im1 to ImM. Each of images Im1 to ImM represents the image of each procedure of the cooking, and the cooking is performed in order of the images Im1 to ImM. That is, images Im1 to ImM are ordered in this order.Foodstuff column data 12 includes character strings Tx1 to TxN. Each of character strings Tx1 to TxN represents a foodstuff name. In the process of the cooking, character strings Tx1 to TxN are used in this order. That is, character strings Tx1 to TxN are ordered in this order.Fig. 2 illustrates the case where a number of procedures M is four and a number of foodstuffs N is four. Character strings Tx1 to Tx4 represent "tomato", "pumpkin", "mayonnaise", and "ketchup", respectively. The number of procedures M is not limited to four, but may be less than or equal to three or greater than or equal to five. The same applies to the number of foodstuffs N. In addition, the number of procedures M and the number of foodstuffs N may be different. -
Encoding unit 100 includes an encoder 110 (first encoder) and an encoder 120 (second encoder).Encoder 110 includes a learnedimage encoder 111, a bidirectional long short-term memory (biLSTM) 112, 113 and amatrix estimator 114.Encoder 120 includes adispersion representer 121, anLSTM 122, abiLSTM 123, and amatrix estimator 124. For example,dispersion representer 121 includes word2vec. -
Image encoder 111 extracts a feature vector vk of image Imk included inimage column data 11, and outputs a vector representation V = (v1, v2,..., vk,..., vM) (feature amount).biLSTM 112 receives vector representation V and outputs a vector representation Θ = (θ1, θ2,..., θk,..., θM) (feature amount). Feature vectors θ1 to θM correspond to feature vectors v1 to vM, respectively.biLSTM 113 receives vector representation V and outputs a vector representation Φ = (ϕ1, ϕ2,..., ϕk,..., ϕM) (feature amount). Feature vectors ϕ1 to ϕM correspond to feature vectors v1 to vM, respectively. Index k is a natural number. -
Matrix estimator 114 receives vector representations Θ, Φ, estimates the adjacent relation of images Im1 to ImM, and outputs the adjacent relation as an adjacent matrix Y. The estimation of the adjacent relation between images Im1 to ImM means that likelihood that an edge exists between two vertices is calculated with each of images Im1 to ImM as a vertex of a graph structure. A component Yi,j of adjacent matrix Y is expressed by the following equation (1).
[Mathematical Formula 1] Mathematical formula 1
- In
encoder 120, a vector expression Ω = (ω1, ω2,..., ωk,..., ωM) (feature amount) is calculated from vector expressions Θ, Φ, and vector expression Ω is input tomatrix estimator 124. The component of each dimension of feature vector cok is the larger one of the components of the dimensions of feature vectors θk, ϕk. -
Dispersion representer 121 outputs a dispersion representation of character string Txk included infoodstuff column data 12.LSTM 122 converts the dispersion representation of character string Txk into a feature vector gk and outputs a vector representation G = (g1, g2,..., gk,..., gN).biLSTM 123 receives vector representation G and outputs a vector representation Γ = (γ1, γ2,..., γk,..., γN) (feature amount). Feature vectors γ1 to γN correspond to feature vectors g1 to gN, respectively. -
Matrix estimator 124 receives vector representations Ω, Γ, estimates adjacent relationships between images Im1 to ImM and character strings Tx1 to TxN, and outputs the adjacent relationships as an adjacent matrix X. The estimation of the adjacent relation between images Im1 to ImM and character strings Tx1 to TxN means that each of character strings Tx1 to TxN is set as the vertex of the graph structure and the likelihood that the edge exists between the vertex corresponding to each of character strings Tx1 to TxN and the vertex corresponding to each of images Im1 to Im4 is calculated. Component Xi,j of adjacent matrix X is expressed by the following equation (2).
[Mathematical Formula 2] Mathematical Formula 2
-
Fig. 3 is a schematic diagram of adjacent matrix Y inFig. 2 . InFig. 3 , the darker the hatching applied to each component, the greater the likelihood of the component. InFig. 3 , the likelihood of existence of the edge from the vertex included in a row to a vertex included in a column is a component of the adjacent matrix specified by the row and the column. That is, adjacent matrix Y represents a directed graph structure. The likelihood of the existence of the edge from the vertex included in the column toward the vertex included in the row may be the component of the adjacent matrix specified by the row and the column. - Adjacent matrix Y representing the directed graph structure may be transformed into an adjacent matrix T representing an undirected graph structure as needed. In the transformation of adjacent matrix Y, for example, an average value of the respective components of adjacent matrix Y and the components obtained by inverting the rows and columns of the components can be set as the components of adjacent matrix T corresponding to the two components such that a transposed matrix of adjacent matrix T is equal to adjacent matrix T.
-
Fig. 4 is a schematic diagram of adjacent matrix X inFig. 2 . The relationship between density of the hatching and the likelihood is similar to that inFig. 3 . InFig. 4 , the likelihood of whether the edge exists between the vertex included in the row and the vertex included in the column is the component of the adjacent matrix specified by the row and the column. Adjacent matrix X represents the undirected graph structure. - Referring to
Fig. 2 again, samplingunit 130 receives adjacent matrices X, Y, and outputs a tree structure Tr (graph structure) in which the vertex corresponding to each of character strings Tx1 to TxN is set to a leaf node, the vertex corresponding to the last image inimage column data 11 is set to a root node, and the vertex corresponding to another image is set to a node.Sampling unit 130 uses the Gumbel-Softmax function (see NPL 2) to convert the likelihood of each component of adjacent matrices X, Y into a probability that the edge exists between two vertices corresponding to the component (reparameterization trick).Sampling unit 130 converts adjacent matrices X, Y into adjacent matrices A, B, respectively, by the reparameterization trick. Components Ai,j, Bi,j are expressed as the following equations (3), (4), respectively. - [Mathematical Formula 3]
Mathematical Formula 3

- In the equations (3), (4), δi,k, εi,k are noises sampled from a gumbel (0,1) distribution. τ is a temperature parameter of the Gumbel-Softmax function.
Sampling unit 130 determines the presence or absence of a branch (edge) between nodes using adjacent matrices A, B, and determines tree structure Tr. -
Fig. 5 is a view illustrating tree structure Tr inFig. 1 . InFig. 5 , nodes Nd1 to Nd4 correspond to images Im1 to Im4, respectively. Node Nd4 is a root node. Leaf nodes Lf1 to Lf4 correspond to character strings Tx1 to Tx4, respectively. - As illustrated in
Fig. 5 , leaf node Lf1 and node Nd1 are connected by a branch Br1. Leaf node Lf2 and node Nd2 are connected by a branch Br2. Leaf node Lf3 and root node Nd4 are connected by a branch Br3. Leaf node Lf4 and root node Nd4 are connected by a branch Br4. Nodes Nd1 and Nd3 are connected by a branch Br5 extending from node Nd1 toward node Nd3. Nodes Nd2 and Nd3 are connected by a branch Br6 extending from node Nd2 toward node Nd3. Node Nd3 and root node Nd4 are connected by a branch Br7 from node Nd3 toward root node Nd4. - Tree structure Tr indicates that the result of the procedure illustrated in image Im1 and the result of the procedure illustrated in image Im2 are used in the procedure illustrated in image Im3, and that the result of the procedure illustrated in image Im3 is used in the procedure illustrated in image Im4. In addition, tree structure Tr indicates that the foodstuff of character string Tx1 is used in the procedure illustrated in image Im1, that the foodstuff of character string Tx2 is used in the procedure illustrated in image Im2, and that the foodstuff of each of character strings Tx3, Tx4 is used in the procedure illustrated in image Im4.
-
Fig. 6 is a view illustrating adjacent matrixes X1, Y1 representing tree structure Tr inFig. 5 . Adjacent matrices X1, Y1 are determined by samplingunit 130 through adjacent matrices A, B, respectively. For example,sampling unit 130 sets the component corresponding to the maximum value in each row of adjacent matrices A, B to 1, sets other components to 0, and determines adjacent matrices X1, Y1 with each row as one-hot representation. When the maximum number of the edge output from the vertex or the maximum number of the edge entering the vertex included in the graph structure extracted from the input data is determined, each row or each column may be expressed as overlap of at least two one-hot expressions by ensemble Gumbel-Softmax (see NPL 3). In determining the graph structure, a characteristic of the extracted graph structure can be considered in addition to the conversion result of the reparameterization trick using the Gumbel-Softmax function for the likelihood of each component of adjacent matrices X, Y. For example, because the edge (self-loop) from a certain node to the node is not allowed in tree structure Tr indicating the cooking procedure, a diagonal component of adjacent matrix Y1 becomes 0. In addition, because the node higher in the hierarchy than the root node does not exist in tree structure Tr, each component of the fourth row corresponding to the root node in adjacent matrix Y1 becomes 0. - Adjacent matrix Y1 representing the directed graph structure may be converted into adjacent matrix T1 representing the undirected graph structure as needed. In the conversion of adjacent matrix Y1, for example, a maximum value, a minimum value, or a value randomly selected from among the components of adjacent matrix Y1 and the components obtained by reversing the rows and columns of the components can be set as the components of adjacent matrix T1 corresponding to the two components such that the transposed matrix of adjacent matrix T1 is equal to adjacent matrix T1.
-
Fig. 7 is a block diagram illustrating a specific configuration ofdecoding unit 140 andoutput data 20 inFig. 1 . As illustrated inFig. 7 , decodingunit 140 includes anLSTM 141, anencoder decoder model 142, and asampling unit 143.LSTM 141 includes tree-LSTM (see NPL 4), and for example, includes a child-sum LSTM.LSTM 141 obtains the feature amount corresponding to the k-th procedure ofimage column data 11 in tree structure Tr as a feature vector hk from a k-th hidden layer of child-sum LSTM, and outputs a vector representation H = (h1, h2,..., hk,..., hM).Encoder decoder model 142 receives vector representation H fromLSTM 141 and receives vector representation V fromimage encoder 111 inFig. 2 .Encoder decoder model 142 converts a pair (hk,vk) into character string Stk, and outputsoutput data 20 including character strings St1 to StM that are the procedure column data. The modality ofoutput data 20 is the character string and is different from the modality ofimage column data 11 included ininput data 10. Character string St1 represents "cut the tomato into bite-sized pieces". Character string St2 represents "fry the squash in a frying pan". Character string St3 represents "place the squash on top of the tomato". Character string St4 represents "add ketchup and mayonnaise".Output data 20 indicates that the cooking is performed in the order of character strings St1 to StM. That is, character strings St1 to StM are ordered in this order. Inencoder decoder model 142, a word is output using the Gumbel-Softmax function. - Machine learning processing performed in
information processing device 1 inFig. 1 will be described below.Learning unit 150 optimizes decodingunit 140 andencoding unit 100 by back propagation that targets a loss function L1 for minimization. Loss function L1 is expressed as the following equation (5). - [Mathematical Formula 4]
Mathematical Formula 4
- Loss function L1 defines an overall error generated in the process of performing the processing from
encoding unit 100 todecoding unit 140 as a sum of loss functions LT and LP. Loss function LT defines a cross entropy error between adjacent matrices X, Y output from encodingunit 100 and a previously-prepared correct answer matrix (correct answer graph structure). Loss function LP defines the cross entropy error between the output data output from decodingunit 140 and previously-prepared correct answer data. Loss function L1 can be differentiated by determination processing of the graph structure by samplingunit 130 by the reparameterization trick, so that the error betweenoutput data 20 and the correct data can be back-propagated from the output layer ofdecoding unit 140 to the input layer ofencoding unit 100 by the back propagation. As a result, the optimization ofdecoding unit 140 andencoding unit 100 can be performed end-to-end from the output layer ofdecoding unit 140 to the input layer ofencoding unit 100, so that the accuracy of the graph structure as the intermediate representation and the accuracy of the output data can be improved. -
Fig. 8 is a flowchart illustrating a flow of a machine learning method performed ininformation processing device 1. As illustrated inFig. 8 , in S11, encodingunit 100 extracts the feature amount of the element (vertex) included ininput data 10, and advances the processing to S12. In S12, encodingunit 100 calculates the likelihood that the edge exists between the two vertices using cosine similarity between the two vertices. Similarity or a distance other than the cosine similarity may be used for the calculation of the likelihood. In S13,sampling unit 130 performs a reparameterization trick using the Gumbel-Softmax function to determine the graph structure. In S14, decodingunit 140 generates the output data from the graph structure fromsampling unit 130 and the feature amount of each vertex from encodingunit 100. In S15, learningunit 150 optimizes the parameter included in each ofdecoding unit 140 andencoding unit 100 by the back propagation that targets loss function L1 for minimization, and ends the machine learning method. The parameter includes a weight and bias of the neural network included indecoding unit 140 andencoding unit 100. - As described above, according to the information processing device and the machine learning method of the first embodiment, it is possible to improve the accuracy of the model that extracts the graph structure from the input data as the intermediate representation.
- In a modification of the first embodiment, the case where the adjacent matrix is reconfigured from output data will be described. The machine learning is performed such that the identity is maintained between the reconfigured adjacent matrix and the adjacent matrix output from the encoding unit, whereby lossless compression by the encoding unit is promoted. As a result, the accuracy of the graph structure as the intermediate representation and the accuracy of the output data can be further improved as compared with the first embodiment.
-
Fig. 9 is a block diagram illustrating a configuration of aninformation processing device 1A according to a modification of the first embodiment. The configuration ofinformation processing device 1A is a configuration in whichlearning unit 150 is replaced with alearning unit 150A while areconfiguration unit 160 is added to the configuration ofinformation processing device 1 inFig. 1 . The other configurations are the same, and the description thereof will not be repeated. As illustrated inFig. 9 ,reconfiguration unit 160 receivesoutput data 20 and receives vector representations Γ, Ω from encodingunit 100. -
Fig. 10 is a block diagram illustrating a specific configuration ofreconfiguration unit 160 inFig. 9 . As illustrated inFig. 10 ,reconfiguration unit 160 includesbiLSTMs matrix estimator 163.biLSTM 161 receivesoutput data 20 and outputs a feature vector obtained by combining the first hidden layer and the last hidden layer for each of character strings St1 to StM.biLSTM 162 receives the feature vector of each of character strings St1 to StM frombiLSTM 161, and outputs vector representation A = (λ1, λ2,..., λk,..., λM) (feature amount) reflecting the order of character strings St1 to StM. Feature vectors λ1 to λM correspond to character strings St1 to StM, respectively. -
Matrix estimator 163 receives vector representations Γ, Ω, A, estimates the adjacent relation of character strings Tx1 to TxM and character strings St1 to StM as an adjacent matrix C, and estimates the adjacent relation of images Im1 to ImM and character strings St1 to StM as an adjacent matrix D. Adjacent matrices C, D are expressed as the following equations (6), (7), respectively.
[Mathematical Formula 5] Mathematical Formula 5

- When the tree structure included in the input data is accurately reflected in
output data 20, images Im1 to ImM inimage column data 11 correspond to character strings St1 to StM inoutput data 20. Consequently, adjacent matrices C, D need to be recognized to be identical to adjacent matrices X, Y calculated by encodingunit 100. Accordingly, in the modification of the first embodiment, a loss function LR that defines an error between adjacent matrices C, D and the correct answer matrix used to calculate the error of adjacent matrices X, Y output from encodingunit 100 is added to loss function L1. A loss function L2 defining the overall error in the modification of the first embodiment is expressed by the following equation (8). A coefficient α of loss function L2 is a hyperparameter. Loss function LR may be a loss function that defines the error between adjacent matrices C, D and adjacent matrices X, Y (correct data). - [Mathematical Formula 6]
Mathematical Formula 6
- A
learning unit 150A optimizes the parameter included in each ofreconfiguration unit 160, decodingunit 140, andencoding unit 100 by the back propagation that targets loss function L2 for minimization. - Regarding the accuracy of
output data 20, the comparison of the comparative example, the first embodiment, and the modification of the first embodiment is illustrated in Table 1 below. In Table 1, GLocal Attention Cascading Networks (GLACNet) is used as a comparative example. In addition, in Table 1, scores of BiLingual Evaluation Understudy (BLEU) 1, BLEU4, Recall-Oriented Understudy for Gisting Evaluation Longest common subsequence (ROUGE-L), Consensus-based Image Description Evaluation (CIDEr)-D, and Metric for Evaluation of Translation with Explicit ORdering (METEOR), which are an automatic evaluation scale, are illustrated. -
Table 1 Automatic evaluation scale BLEU 1 BLEU 4 ROUGE-L CIDEr-D METEOR Comparative example (GLACNet) 33.2 7.4 23.8 23.6 23.2 First embodiment 35.3 8.3 23.9 25.3 23.4 Modification of first embodiment 37.2 8.7 25.6 35.2 24.4 - As illustrated in Table 1, in each automatic evaluation scale, the performance of the first embodiment exceeds the performance of the comparative example. In addition, the performance of the modification of the first embodiment exceeds the performance of the first embodiment.
- As described above, according to the information processing device and the machine learning method of the modification of the first embodiment, the accuracy of the model extracting the graph structure from the input data as the intermediate representation can be further improved as compared with the first embodiment.
- The configuration in which the tree structure is extracted as the graph structure from the input data has been described in the first embodiment. The graph structure extracted from the input data is not limited to the tree structure, but for example, may be an N-graph structure (N is a natural number greater than or equal to 2). In a second embodiment, a configuration in which a two-graph structure is extracted from input data will be described as an example of the N-graph structure.
-
Fig. 11 is a block diagram illustrating a configuration of aninformation processing device 2 of the second embodiment. As illustrated inFig. 11 ,information processing device 2 includes anencoding unit 200, asampling unit 230, adecoding unit 240, alearning unit 250, and aninference unit 270.Encoding unit 200,sampling unit 230, decodingunit 240, andlearning unit 250 form a variational autoencoder (VAE). -
Encoding unit 200 extracts a feature amount of each of a plurality of vertices of the graph structure included in aninput data 10B.Encoding unit 200 divides the plurality of vertices into two subsets Sb1, Sb2 having no common vertex.Encoding unit 200 calculates the likelihood that the edge exists between the vertex included in subset Sb1 and the vertex included in subset Sb2, and outputs the adjacent matrix having the likelihood as the component tosampling unit 230. That is, encodingunit 200 performs two-graph matching between subsets Sb1 and Sb2. -
Sampling unit 230 performs the reparameterization trick using the Gumbel-Softmax function on the adjacent matrix from encodingunit 200, determines a two-graph structure Bp, and outputs two-graph structure Bp and the feature amount of each of the plurality of vertices included in two-graph structure Bp to decodingunit 240 andinference unit 270. Decodingunit 240 reproduces anoutput data 20B from two-graph structure Bp and the feature amount.Inference unit 270 performs inference based on two-graph structure Bp and the feature amount, and outputs an inference result. For example,inference unit 270 includes a graph neural network (GNN). -
Learning unit 250 optimizesinference unit 270, decodingunit 240, andencoding unit 200 by the back propagation. The loss function to be targeted for minimization in the back propagation includes the error betweenoutput data 20B andinput data 10B (correct data) and the error between the inference result ofinference unit 270 and the correct data included in the learning data set. That is, learningunit 250 performs semi-supervised learning oninference unit 270, decodingunit 240, andencoding unit 200. Specifically, learningunit 250 performs unsupervised learning ondecoding unit 240 andencoding unit 200, and performs supervised learning oninference unit 270. - The main purpose of
information processing device 2 is to output the inference result byinference unit 270. Optimization of the VAE formed by encodingunit 200,sampling unit 230, decodingunit 240, andlearning unit 250 is positioned as a subtask implementing lossless compression frominput data 10B to the two-graph structure. - The case where a history of a user search operation on the search system is set as
input data 10B will be described below.Fig. 12 is a view illustrating an example of two-graph structure Bp between a plurality of users and a plurality of companies extracted frominput data 10B.Fig. 12 illustrates a correlation between users Us1, Us2, Us3, Us4 and companies Cm1, Cm2, Cm3, Cm4, Cm5. As illustrated inFig. 12 , user Us1 and company Cm2 are connected by an edge Rs1. User Us2 and company Cm4 are connected by an edge Rs2. User Us3 and company Cm3 are connected by an edge Rs3. User Us4 and company Cm5 are connected by an edge Rs4.Fig. 13 is a view illustrating a matrix representing two-graph structure Bp inFig. 12 .Inference unit 270 inFig. 11 receives two-graph structure Bp, infers the company matching the needs of each user, and recommends the company to the user. - As described above, according to the information processing device and the machine learning method of the second embodiment, the accuracy of the model that extracts the graph structure from the input data as the intermediate representation can be improved.
- A configuration in which a plurality of sensors is structured as a graph structure based on time-series data of detection values of a plurality of sensors in a plurality of processes included in a manufacturing facility to specify a process in which a defect is generated in a product will be described in a third embodiment.
-
Fig. 14 is a schematic diagram illustrating a configuration example of amanagement system 3000 of the third embodiment. Referring toFig. 14 ,management system 3000 is associated with amanufacturing facility 30 including a plurality of processes, and provides a function managing quality of the product manufactured by manufacturingfacility 30. InFig. 14 , five consecutive processes Pr1, Pr2, Pr3, Pr4, Pr5 are illustrated along aconveyor 307 conveying a workpiece. The workpiece passes through processes Pr1 to Pr5 in this order. In each of processes Pr1 to Pr5, a sensor detecting the state of the process is installed. Processes Pr1 to Pr5 are controlled and monitored by programmable logic controllers (PLCs) 301, 302, 303, 304, 305 that are an example of the control device. -
PLCs 301 to 305 are connected so as to be able to perform data communication through alocal network 306.PLCs 301 to 305 transmit state information related to the process to be controlled to arelay server device 308 onlocal network 306 every predetermined period or every event. The state information includes time-series data (sensor time-series data) of a plurality of detection values detected at a plurality of sampling times by the sensor provided in the process. -
Relay server device 308 transfers the state information from each ofPLCs 301 to 305 to a collection and analysis server device 3 (information processing device) through the Internet.Relay server device 308 may perform necessary preprocessing on the state information. - Collection and
analysis server device 3 collects the state information received fromrelay server device 308 and analyzes the collected information. Collection andanalysis server device 3 outputs an analysis result to aterminal device 309 through the Internet when a predetermined condition is satisfied or when a request is received fromterminal device 309. -
Fig. 14 illustrates a configuration in which PLCs are provided in each of the plurality of processes installed insingle manufacturing facility 30 and the PLCs are connected to relayserver device 308 through the samelocal network 306 as a typical example, but the present invention is not limited thereto. For example, a configuration in which a plurality of PLCs is directly connected to collection andanalysis server device 3 may be adopted without disposingrelay server device 308. In this case, each PLC transmits required information to collection andanalysis server device 3. - Alternatively, a plurality of
relay server devices 308 may be provided. In this case, a certainrelay server device 308 may transfer the state information from some PLCs to collection andanalysis server device 3, and anotherrelay server device 308 may transfer the state information from the remaining PLCs to collection andanalysis server device 3. - A hardware configuration example of the PLC will be described below.
Fig. 15 is a schematic diagram illustrating an example of a hardware configuration ofPLCs 301 to 305constituting management system 3000 inFig. 14 . Referring toFig. 15 , each ofPLCs 301 to 305 includes anarithmetic unit 310 and one or a plurality offunctional units 320.Arithmetic unit 310 is an arithmetic device that executes a previously-stored user program or the like, acquires a field signal (information indicating the state of the facility to be controlled, or the like) fromfunctional unit 320, and outputs a required control signal throughfunctional unit 320. -
Arithmetic unit 310 includes aprocessor 312 that executes the user program and the like, amemory 316 that stores the user program, an operating system (OS), various data, and the like, abus controller 314 that controls data exchange through aninternal bus 326, and acommunication interface 318.Memory 316 may be configured by combining a volatile storage device such as a dynamic random access memory (DRAM) and a nonvolatile storage device such as a flash memory.Processor 312 acquires a detection value from asensor 315 installed in the process corresponding to each ofPLCs 301 to 305. For example, the detection value includes a current value, a voltage value, a power value, a temperature, humidity, or a vibration value. A plurality ofsensors 315 may be provided in one process. - One or a plurality of communication ports may be provided in
communication interface 318 according to a target device that exchanges the data. For example, a communication port conforming to Ethernet (registered trademark) for connection to local network 306 (seeFig. 14 ), a communication port conforming to a universal serial bus (USB) for connection to a personal computer or the like, or a communication port supporting a serial line or a parallel line may be mounted. -
Functional unit 320 may provide an input output (IO) function exchanging various types of information with the facility to be controlled. Specifically, functions such as a digital input (DI) that receives a digital signal, a digital output (DO) that outputs a digital signal, an analog input (AI) that receives an analog signal, and an analog output (AO) that outputs an analog signal may be implemented. In addition, special functions such as proportional integral derivative (PID) control or motion control may be implemented. - For example, each of
functional units 320 that provides the IO function includes anIO module 322 and abus controller 324 that controls data exchange witharithmetic unit 310 throughinternal bus 326. Each ofIO modules 322 acquires state information from the process to be controlled, and sends the state information to relayserver device 308 and collection andanalysis server device 3 througharithmetic unit 310. - In
management system 3000, any PLC may be adopted as long as the PLC includes an interface outputting internal information to an external device using any communication means. The hardware configuration of the PLC is not limited to the configuration inFig. 15 , but any configuration can be adopted. In practice, it is assumed that manufacturers and models are not unified among the plurality of PLCs disposed inmanufacturing facility 30 ofFig. 14 . Inmanagement system 3000,relay server device 308 absorbs such differences in the manufacturer and model of the PLC. -
Fig. 16 is a block diagram illustrating a functional configuration of collection andanalysis server device 3 inFig. 14 . As illustrated inFig. 16 , collection andanalysis server device 3 includes anencoding unit 300, asampling unit 330, adecoding unit 340, and a quality inspection unit 370 (inference unit). Aninput data 10C includes sensor time-series data fromPLC 301 to 305.Encoding unit 300,sampling unit 330, decodingunit 340, and alearning unit 350 form the variational autoencoder (VAE). -
Encoding unit 300 includes an encoder model Mc. Encoder model Mc extracts the graph structure representing a correlation between sensors included ininput data 10C frominput data 10C.Encoding unit 300 extracts the feature amount of each of a plurality of sensors that are the vertex of the graph structure from the sensor time-series data.Encoding unit 300 calculates the likelihood that the edge exists between two vertices included in the plurality of vertices, and outputs the adjacent matrix having the likelihood as the component tosampling unit 330. -
Sampling unit 330 performs the reparameterization trick using the Gumbel-Softmax function on the adjacent matrix from encodingunit 300, determines a graph structure Gs, and outputs graph structure Gs and the feature amount of each of the plurality of vertices of graph structure Gs todecoding unit 340 andquality inspection unit 370. - Decoding
unit 340 includes a decoder model Md. Decoder model Md reproduces output data 20C from graph structure Gs and the feature amount. -
Quality inspection unit 370 includes a quality inspection model Mm. Quality inspection model Mm calculates quality data representing the quality of the product based on graph structure Gs and the feature amount. For example,quality inspection part 370 includes GNN.Quality inspection unit 370 visualizes the error between the quality data and the reference quality data in graph structure Gs. The reference quality data is standard quality data corresponding to a normal product. The larger the error between the quality data and the reference quality data, the larger the defect degree included in the quality data. For example, heat mapping of the error using Gradient-weighted Class Activation Mapping (GradCAM) can be exemplified as a method for visualizing the error in graph structure Gs. -
Learning unit 350 optimizes the parameters of the neural network included in each of quality check model Mm, decoder model Md, and encoder model Mc by back propagation. The parameter includes the weight and the bias of the neural network. The loss function to be targeted for minimization in the back propagation includes the error between output data 20C andinput data 10C (correct data) and the error between the inspection result ofquality inspection unit 370 and the correct quality data included in the learning data set. That is, learningunit 350 performs the semi-supervised learning onquality inspection unit 370, decodingunit 340, andencoding unit 300. Specifically, learningunit 350 performs the unsupervised learning ondecoding unit 340 andencoding unit 300, and performs the supervised learning onquality inspection unit 370. - The main purpose of collection and
analysis server device 3 is to output the inspection result byquality inspection unit 370. The optimization of the VAE formed by encodingunit 300,sampling unit 330, decodingunit 340, andlearning unit 350 is positioned as a subtask implementing the lossless compression frominput data 10C to the graph structure. -
Fig. 17 is a block diagram illustrating a hardware configuration of collection andanalysis server device 3 inFig. 14 . As illustrated inFig. 17 , collection andanalysis server device 3 includes aprocessor 31 that is an arithmetic processing unit, amain memory 32 and ahard disk 33 that are a storage unit, aninput interface 34, adisplay controller 35, acommunication interface 36, and a data reader/writer 38. These units are data-communicably connected to each other through abus 39. -
Processor 31 includes a central processing unit (CPU).Processor 31 may further include a graphics processing unit (GPU).Processor 31 develops a program (code) stored inhard disk 33 inmain memory 32 and executes the program in a predetermined order to perform various operations. -
Main memory 32 is typically a volatile storage device such as a dynamic random access memory (DRAM).Main memory 32 holds the program read fromhard disk 33. -
Input interface 34 mediates data transmission betweenprocessor 31 and aninput unit 361. For example,input unit 361 includes a mouse, a keyboard, or a touch panel. That is,input interface 34 receives an operation command given by the useroperating input unit 361. -
Display controller 35 is connected to adisplay 362 that is a typical example of the display device, and notifies the user of a result of image processing inprocessor 31 and the like. That is,display controller 35 is connected to display 362 to control the display ondisplay 362. For example,display 362 is a liquid crystal display, an organic EL (Electro Luminescence) display, or other display devices. -
Communication interface 36 mediates the data transmission betweenprocessor 31 and other external devices through the Internet.Communication interface 36 typically includes Ethernet (registered trademark), and a universal serial bus (USB). - Data reader and
writer 38 mediates the data transmission betweenprocessor 31 and amemory card 363 that is a storage medium. For example,memory card 363 stores the program to be executed in collection andanalysis server device 3. Data reader/writer 38 reads the program frommemory card 363.Memory card 363 includes a general-purpose semiconductor storage device such as a compact flash (CF) and a secure digital (SD), a magnetic recording medium such as a flexible disk, and an optical recording medium such as a compact disk read only memory (CD-ROM). Another output device such as a printer may be connected to collection andanalysis server device 3 as needed. -
Hard disk 33 is a non-volatile magnetic storage device.Hard disk 33 stores a learning data set Ds, quality inspection model Mm, encoder model Mc, decoder model Md, a machine learning program Pg1, and a quality inspection program Pg2. Various setting values and the like may be stored inhard disk 33. A semiconductor storage device such as a flash memory may be adopted in addition to or instead ofhard disk 33. - Learning data set Ds includes a plurality of learning data. Each of the plurality of learning data is a combination of time-series data of the detection value by each sensor of the plurality of processes through which the product passes and correct quality data corresponding to the quality of the product.
- Learning data set Ds, encoder model Mc, decoder model Md, and quality check model Mm are referred to in machine learning program Pg1.
Processor 31 that executes machine learning program Pg1 implements encodingunit 300,sampling unit 330, decodingunit 340, learningunit 350, andquality inspection unit 370 inFig. 16 .Processor 31 executes machine learning program Pg1 to adapt each of encoder model Mc, decoder model Md, and quality check model Mm to the learned state. - Encoder model Mc and quality inspection model Mm are referred to in quality inspection program Pg2.
Processor 31 executes quality inspection program Pg2 to calculate the quality data of the product from the sensor time-series data corresponding to the product, and visualizes the error between the quality data and the reference quality data in graph structure Gs. The error visualized in graph structure Gs of the error is output to display 362 andterminal device 309. -
Fig. 18 is a view illustrating an example of graph structure Gs visualized together with the error between the quality data and the reference quality data. InFig. 18 , vertexes Sn1 to Sn5 correspond to the sensors provided in processes Pr1 to Pr5 inFig. 14 , respectively. A thicker hatched vertex indicates that the detection value of the sensor corresponding to the vertex deviates from the normal value. - As illustrated in
Fig. 18 , vertex Sn3 is connected to vertexes Sn1, Sn2, Sn4. Vertex Sn5 is connected to vertex Sn2. Vertex Sn2 is the thickest, and vertexes Sn1, Sn4 are the thinnest. The edge connecting vertexes Sn2, Sn3 and the edge connecting vertexes Sn2, Sn5 are emphasized to be thicker than other edges. Graph structure Gs in which the error is visualized represents the correlation between the detection values of the plurality of sensors, and also illustrates the detection value of the sensor contributing to the defect (the error between the quality data and the reference quality data) included in the product. InFig. 18 , the detection value of the sensor most contributing to the defect included in the product is the detection value of the sensor provided in process Pr2 corresponding to vertex Sn2. Consequently, there is a high possibility that the defect is generated in process Pr2. In processes Pr3, Pr5 corresponding to vertexes Sn3, Sn5 connected to vertex Sn2 in graph structure Gs, there is the possibility that the defect is generated after process Pr2. In processes Pr1, Pr4 corresponding to vertexes Sn1, Sn4, there is the lowest possibility that the defect is generated. According to graph structure Gs in which the error is visualized, the process causing the generation of the defect included in the product completed through the plurality of processes can be easily specified. - As described above, according to the information processing device and the machine learning method of the third embodiment, the accuracy of the model that extracts the graph structure from the input data as the intermediate representation can be improved.
- The information processing device and the machine learning method of the embodiment can be applied to route planning based on people flow prediction.
Fig. 19 is a view illustrating route planning by a robot Rb corresponding to the information processing device of the embodiment. As illustrated inFig. 19 , a visual field of robot Rb includes pedestrians Ps1, Ps2, Ps3. Pedestrian Ps1 is watching pedestrian Ps2. Pedestrian Ps2 is watching pedestrian Ps3. Pedestrian Ps3 is watching pedestrian Ps2. Robot Rb extracts the directed graph structure having each of the pedestrians Ps1 to Ps3 as the vertex based on the posture, the line-of-sight direction, the relative positional relationship between the pedestrians Ps1 to Ps3, and the like of each of the pedestrians Ps1 to Ps3 included in the visual field moving image that is time-series data. -
Fig. 20 is a view illustrating a directed graph structure Pf extracted by robot Rb inFig. 19 . InFig. 19 , vertexes Vx1, Vx2, Vx3 correspond to pedestrians Ps1, Ps2, Ps3 inFig. 19 , respectively. As illustrated inFig. 20 , vertex Vx1 and vertex Vx2 are connected by an edge Eg1 from vertex Vx1 toward vertex Vx2. Vertex Vx2 and vertex Vx3 are connected by an edge Eg2 from vertex Vx2 toward vertex Vx3 and an edge Eg3 from vertex Vx3 toward vertex Vx2. -
Fig. 21 is a view illustrating the matrix representation corresponding to directed graph structure Pf inFig. 20 . Robot Rb inputs directed graph structure Pf inFig. 21 to the inference unit, performs the people flow prediction for pedestrians Ps1 to Ps3, and plans a route Rt inFig. 19 capable of avoiding pedestrians Ps1 to Ps3. For example, the inference unit includes a social GAN (Generative Adversarial Network). - The information processing device and the machine learning method of the embodiment are also applicable to prediction of traffic congestion. The graph structure, in which a traffic volume at each time in a plurality of points connected by a road are used as time-series input data, each of the plurality of points at each time from the input data is set as the vertex, and a relationship in traffic volume between two points over different times is set as the edge, is extracted in the prediction of the traffic congestion. That is, the graph structure is extracted from the input data as the result of the N-graph matching in which a plurality of points at each time are set as a subset of the vertex set. The information processing device predicts the traffic congestion at each point in a specific time based on the graph structure.
- The information processing device and the machine learning method of the embodiment are also applicable to materials informatics (MI). In the application example to the materials informatics, a physical property of a molecular structure is estimated by making the vertex and the edge of the graph structure extracted from the input data correspond to the atom and the bond of the molecular structure.
- The above embodiments include the following technical ideas.
- An information processing device (1, 1A, 2, 3) that extracts a graph structure (Tr, Bp, Gs, Pf) representing a correlation between elements included in input data (10, 10B, 10C) from the input data (10, 10B, 10C) to generate output data (20, 20B, 20C) from the graph structure (Tr, Bp, Gs, Pf), the information processing device (1, 1A, 2, 3) including:
- an encoding unit (100, 200, 300) configured to extract a feature amount (Θ, Φ, Ω, Γ) of each of a plurality of vertices (Lf1 to Lf4, Nd1 to Nd4, Us1 to Us4, Cm1 to Cm5, Sn1 to Sn5 Vx1 to Vx3) included in the graph structure (Tr, Bp, Gs, Pf) from the input data (10, 10B, 10C) to calculate a likelihood that an edge (Br1 to Br7, Rs1 to Rs4, Eg1 to Eg3) representing the correlation is connected to the vertex;
- a sampling unit (130, 230, 330) configured to determine the graph structure (Tr, Bp, Gs, Pf) based on a conversion result of a Gumbel-Softmax function for the likelihood;
- a decoding unit (140, 240, 340) configured to receive the graph structure (Tr, Bp, Gs, Pf) and the feature amount (Θ, Φ, Ω, Γ) to generate the output data (20, 20B, 20C); and
- a learning unit (150, 250, 350) configured to optimize the decoding unit (140, 240, 340) and the encoding unit (100, 200, 300) by back propagation that targets a loss function for minimization, the loss function including an error (LP) between the output data (20, 20B, 20C) and correct data.
- The information processing device (1A) according to the
configuration 1, further including a reconfiguration unit (160) configured to reconfigure the graph structure (Tr) from the output data (20),
in which the loss function includes an error (LR) between an output from the reconfiguration unit (160) and a correct graph structure. - The information processing device (2, 3) according to the
configuration
in which the learning unit (250, 350) performs unsupervised learning for the decoding unit (240, 340) and the encoding unit (100, 200), and performs supervised learning for the inference unit (270, 370). - The information processing device (1, 1A) according to any one of the
configurations 1 to 3, in which the input data (10) includes first data (11) and second data (12), - modality of the first data (11) is different from modality of the second data (12), and
- the encoding unit (100) includes:
- a first encoder (110) that extracts a feature amount (Θ, Φ) of the first data (11); and
- a second encoder (120) that extracts a feature amount (Γ) of the second data (12).
- The information processing device (1,1A) according to any one of the
configurations 1 to 4, in which modality of the output data (20) is different from modality of the input data (10). - A machine learning method performed by a processor (31) that executes a machine learning program (Pg1) stored in a storage unit (33) for a model (Mc, Md) that extracts a graph structure (Tr, Bp, Gs, Pf) representing a correlation between elements included in input data (10, 10B, 10C) from the input data (10, 10B, 10C) to generate output data (20, 20B, 20C) from the graph structure (Tr, Bp, Gs, Pf), the machine learning method including:
- extracting (S11, S12) a feature amount (Θ, Φ, Ω, Γ) of each of a plurality of vertices (Lf1 to Lf4, Nd1 to Nd4, Us1 to Us4, Cm1 to Cm5, Sn1 to Sn5, Vx1 to Vx3) included in the graph structure (Tr, Bp, Gs, Pf) from the input data (10,10B,10C) to calculate a likelihood that an edge (Br1 to Br7, Rs1 to Rs4, Eg1 to Eg3) representing the correlation is connected to the vertex;
- determining (S13) the graph structure (Tr, Bp, Gs, Pf) based on a conversion result of a Gumbel-Softmax function for the likelihood;
- receiving (S14) the graph structure (Tr, Bp, Gs, Pf) and the feature amount (Θ, Φ, Ω, Γ) to generate the output data (20, 20B, 20C); and
- optimizing (S15) the model (Mc, Md) by back propagation that targets a loss function for minimization, the loss function including an error (LP) between the output data (20, 20B, 20C) and correct data.
- The embodiments disclosed herein are also planned to be implemented in appropriate combination within a range not contradictory. It should be considered that the disclosed embodiments are an example in all respects and not restrictive. The scope of the present invention is defined by not the description above, but the claims, and it is intended that all modifications within the meaning and scope of the claims and their equivalents are included in the present invention.
- 1, 1A, 2: information processing device, 3: collection and analysis server device, 10, 10B, 10C: input data, 11: image column data, 12: foodstuff column data, 20, 20B, 20C: output data, 30: manufacturing facility, 31, 312: processor, 32: main memory, 33: hard disk, 34: input interface, 35: display controller, 36, 318: communication interface, 38: data reader/writer, 39: bus, 100, 200, 300: encoding unit, 110, 120: encoder, 111: image encoder, 114, 124, 163: matrix estimator, 121: dispersion representer, 130, 143, 230, 330: sampling unit, 140, 240, 340: decoding unit, 142: encoder decoder model, 150, 150A, 250, 350: learning unit, 160: reconfiguration unit, 270: inference unit, 306: local network, 307: conveyor, 308: relay server device, 309: terminal device, 310: arithmetic unit, 314, 324: bus controller, 315: sensor, 316: memory, 320: functional unit, 322: IO module, 326: internal bus, 361: input unit, 362: display, 363: memory card, 370: quality inspection unit, 3000: management system, Bp: two-graph structure, Br1 to Br7: branch, Cm1 to Cm5: company, Ds: learning data set, Eg1 to Eg3, Rs1 to Rs4: edge, Gs: graph structure, Im1 to Im4: image, LP, LR, LT: loss function, Lf1 to Lf4: leaf node, Mc: encoder model, Md: decoder model, Mm: quality inspection model, Nd1 to Nd4: node, Pf: directed graph structure, Pg1: machine learning program, Pg2: quality inspection program, Pr1 to Pr5: process, Ps1 to Ps3: pedestrian, Rb: robot, Rt: route, Sb1, Sb2: subset, Sn1 to Sn5, Vx1 to Vx3: vertex, St1 to St4, Tx1 to Tx4: character string, Tr: tree structure, Us1 to US4: user
Claims (6)
- An information processing device that extracts a graph structure representing a correlation between elements included in input data from the input data to generate output data from the graph structure, the information processing device comprising:an encoding unit configured to extract a feature amount of each of a plurality of vertices included in the graph structure from the input data to calculate a likelihood that an edge representing the correlation is connected to the vertex;a sampling unit configured to determine the graph structure based on a conversion result of a Gumbel-Softmax function for the likelihood;a decoding unit configured to receive the graph structure and the feature amount to generate the output data; anda learning unit configured to optimize the decoding unit and the encoding unit by back propagation that targets a loss function for minimization, the loss function including an error between the output data and correct data.
- The information processing device according to claim 1, further comprising a reconfiguration unit configured to reconfigure the graph structure from the output data,
wherein the loss function includes an error between an output from the reconfiguration unit and a correct graph structure. - The information processing device according to claim 1 or 2, further comprising an inference unit configured to receive the graph structure from the sampling unit to output an inference result for the input data,
wherein the learning unit performs unsupervised learning for the decoding unit and the encoding unit, and performs supervised learning for the inference unit. - The information processing device according to any one of claims 1 to 3, wherein the input data includes first data and second data,
modality of the first data is different from modality of the second data, and the encoding unit includes:a first encoder that extracts a feature amount of the first data; anda second encoder that extracts a feature amount of the second data. - The information processing device according to any one of claims 1 to 4, wherein modality of the output data is different from modality of the input data.
- A machine learning method performed by a processor that executes a machine learning program stored in a storage unit for a model that extracts a graph structure representing a correlation between elements included in input data from the input data to generate output data from the graph structure, the machine learning method comprising:extracting a feature amount of each of a plurality of vertices included in the graph structure from the input data to calculate a likelihood that an edge representing the correlation is connected to the vertex;determining the graph structure based on a conversion result of a Gumbel-Softmax function for the likelihood;receiving the graph structure and the feature amount to generate the output data; andoptimizing the model by back propagation that targets a loss function for minimization, the loss function including an error between the output data and correct data.
Applications Claiming Priority (2)
| Application Number | Priority Date | Filing Date | Title |
|---|---|---|---|
| JP2020038785A JP7359394B2 (en) | 2020-03-06 | 2020-03-06 | Information processing device and machine learning method |
| PCT/JP2021/006302 WO2021177056A1 (en) | 2020-03-06 | 2021-02-19 | Information processing device and machine learning method |
Publications (3)
| Publication Number | Publication Date |
|---|---|
| EP4116881A1 true EP4116881A1 (en) | 2023-01-11 |
| EP4116881A4 EP4116881A4 (en) | 2024-03-20 |
| EP4116881B1 EP4116881B1 (en) | 2026-07-08 |
Family
ID=77613527
Family Applications (1)
| Application Number | Title | Priority Date | Filing Date |
|---|---|---|---|
| EP21764535.7A Active EP4116881B1 (en) | 2020-03-06 | 2021-02-19 | Information processing device and machine learning method |
Country Status (5)
| Country | Link |
|---|---|
| US (1) | US20230013870A1 (en) |
| EP (1) | EP4116881B1 (en) |
| JP (1) | JP7359394B2 (en) |
| CN (1) | CN115136150A (en) |
| WO (1) | WO2021177056A1 (en) |
Families Citing this family (7)
| Publication number | Priority date | Publication date | Assignee | Title |
|---|---|---|---|---|
| CN114503084B (en) * | 2020-08-27 | 2023-07-25 | 清华大学 | Parallel program scalability bottleneck detection method and computing device |
| CN115249057B (en) * | 2021-04-26 | 2026-06-16 | 阿里巴巴创新公司 | A system and computer-implemented method for sampling graphical nodes. |
| CN116151337B (en) * | 2021-11-15 | 2026-03-20 | 阿里巴巴达摩院(杭州)科技有限公司 | Methods, systems, and storage media for accelerating attribute access in graph neural networks |
| DE102022103812A1 (en) * | 2022-02-17 | 2023-08-17 | WAGO Verwaltungsgesellschaft mit beschränkter Haftung | COMPUTER-IMPLEMENTED METHOD FOR AT LEAST PARTIALLY AUTOMATED CONFIGURATION OF A FIELDBUS, FIELDBUS SYSTEM, COMPUTER PROGRAM, COMPUTER READABLE STORAGE MEDIUM, TRAINING DATA SET AND METHOD FOR TRAINING A CONFIGURATION AI MODEL |
| CN114925811A (en) * | 2022-05-16 | 2022-08-19 | 北京火山引擎科技有限公司 | Multivariable time sequence processing method, device, equipment and medium |
| US20250252341A1 (en) * | 2024-02-05 | 2025-08-07 | Disney Enterprises, Inc. | Multi-Sourced Machine Learning Model-Based Artificial Intelligence Character Training and Development |
| CN119339008B (en) * | 2024-12-20 | 2025-08-26 | 杭州宇泛智能科技股份有限公司 | Dynamic modeling method of scene space 3D model based on multimodal data |
Family Cites Families (7)
| Publication number | Priority date | Publication date | Assignee | Title |
|---|---|---|---|---|
| EP3698288B1 (en) * | 2017-10-27 | 2024-12-04 | DeepMind Technologies Limited | Graph neural network systems for generating structured representations of objects |
| CN108132968B (en) * | 2017-12-01 | 2020-08-04 | 西安交通大学 | Weak supervision learning method for associated semantic elements in web texts and images |
| CN109117795B (en) * | 2018-08-17 | 2022-03-25 | 西南大学 | A neural network expression recognition method based on graph structure |
| CN109359733A (en) * | 2018-10-19 | 2019-02-19 | 中国石油大学(华东) | A Variational Autoencoder-Based Modeling Method for Operating State of Dynamic Systems |
| CN110490035A (en) * | 2019-05-17 | 2019-11-22 | 上海交通大学 | Human skeleton action identification method, system and medium |
| CN110188168B (en) * | 2019-05-24 | 2021-09-03 | 北京邮电大学 | Semantic relation recognition method and device |
| CN110309268B (en) * | 2019-07-12 | 2021-06-29 | 中电科大数据研究院有限公司 | A Cross-Language Information Retrieval Method Based on Concept Map |
-
2020
- 2020-03-06 JP JP2020038785A patent/JP7359394B2/en active Active
-
2021
- 2021-02-19 CN CN202180015456.3A patent/CN115136150A/en active Pending
- 2021-02-19 US US17/802,620 patent/US20230013870A1/en active Pending
- 2021-02-19 WO PCT/JP2021/006302 patent/WO2021177056A1/en not_active Ceased
- 2021-02-19 EP EP21764535.7A patent/EP4116881B1/en active Active
Also Published As
| Publication number | Publication date |
|---|---|
| CN115136150A (en) | 2022-09-30 |
| JP2021140551A (en) | 2021-09-16 |
| US20230013870A1 (en) | 2023-01-19 |
| EP4116881A4 (en) | 2024-03-20 |
| EP4116881B1 (en) | 2026-07-08 |
| WO2021177056A1 (en) | 2021-09-10 |
| JP7359394B2 (en) | 2023-10-11 |
Similar Documents
| Publication | Publication Date | Title |
|---|---|---|
| US20230013870A1 (en) | Information processing device and machine learning method | |
| US10769570B2 (en) | Artificial intelligence based risk and knowledge management | |
| US11621892B2 (en) | Temporal-based network embedding and prediction | |
| EP4242955A1 (en) | User profile-based object recommendation method and device | |
| Wijesekara et al. | Comparison of imputation methods for missing values in air pollution data: Case study on Sydney air quality index | |
| US20190272553A1 (en) | Predictive Modeling with Entity Representations Computed from Neural Network Models Simultaneously Trained on Multiple Tasks | |
| Hosseinifard et al. | Process capability analysis in non normal linear regression profiles | |
| CN117708738A (en) | Sensor time sequence anomaly detection method and system based on multi-modal variable correlation | |
| CN118522157B (en) | Traffic information prediction method, device, equipment and medium | |
| CN113033090A (en) | Push model training method, data push device and storage medium | |
| US12008800B2 (en) | Conflation of geospatial points of interest and ground-level imagery | |
| CN114386513B (en) | An interactive rating prediction method and system integrating comments and ratings | |
| CN118378185A (en) | Fault detection method, electronic device and storage medium | |
| CN120126712A (en) | A method and system for predicting and optimizing medical device inventory based on big data | |
| CN111178987A (en) | Method and apparatus for training user behavior prediction model | |
| JP2021174040A (en) | Information processing equipment, information processing methods and programs | |
| Moradi et al. | Constructing explainable health indicators for aircraft engines by developing an interpretable neural network with discretized weights: M. Moradi et al. | |
| CN114417173A (en) | Resource recommendation method, graph convolutional neural network model training method and equipment | |
| US20240185117A1 (en) | Knowledge Graph Based Modeling System for a Production Environment | |
| CN120612534B (en) | Intelligent equipment inspection method and device integrating robot vision and robot | |
| CN117132315A (en) | Active user prediction method, device, equipment and storage medium | |
| CN112182498B (en) | Old people nursing device and method based on network representation learning | |
| CN120810583A (en) | Method, apparatus, device and medium for wind power prediction | |
| CN113139817A (en) | Data classification method, data classification device, medium, and electronic apparatus | |
| CN118966975A (en) | Internet-based supply chain dynamic real-time management system and method |
Legal Events
| Date | Code | Title | Description |
|---|---|---|---|
| STAA | Information on the status of an ep patent application or granted ep patent |
Free format text: STATUS: THE INTERNATIONAL PUBLICATION HAS BEEN MADE |
|
| PUAI | Public reference made under article 153(3) epc to a published international application that has entered the european phase |
Free format text: ORIGINAL CODE: 0009012 |
|
| STAA | Information on the status of an ep patent application or granted ep patent |
Free format text: STATUS: REQUEST FOR EXAMINATION WAS MADE |
|
| 17P | Request for examination filed |
Effective date: 20220824 |
|
| AK | Designated contracting states |
Kind code of ref document: A1 Designated state(s): AL AT BE BG CH CY CZ DE DK EE ES FI FR GB GR HR HU IE IS IT LI LT LU LV MC MK MT NL NO PL PT RO RS SE SI SK SM TR |
|
| DAV | Request for validation of the european patent (deleted) | ||
| DAX | Request for extension of the european patent (deleted) | ||
| REG | Reference to a national code |
Ref country code: DE Free format text: PREVIOUS MAIN CLASS: G06N0003040000 Ref country code: DE Ref legal event code: R079 Ref document number: 602021056864 Country of ref document: DE Free format text: PREVIOUS MAIN CLASS: G06N0003040000 Ipc: G06N0003045500 |
|
| A4 | Supplementary search report drawn up and despatched |
Effective date: 20240221 |
|
| RIC1 | Information provided on ipc code assigned before grant |
Ipc: G06N 3/094 20230101ALN20240215BHEP Ipc: G06N 3/0475 20230101ALN20240215BHEP Ipc: G06N 3/047 20230101ALN20240215BHEP Ipc: G06N 3/0442 20230101ALN20240215BHEP Ipc: G06N 3/042 20230101ALN20240215BHEP Ipc: G06N 3/0895 20230101ALI20240215BHEP Ipc: G06N 3/084 20230101ALI20240215BHEP Ipc: G06N 3/0455 20230101AFI20240215BHEP |
|
| STAA | Information on the status of an ep patent application or granted ep patent |
Free format text: STATUS: EXAMINATION IS IN PROGRESS |
|
| 17Q | First examination report despatched |
Effective date: 20251117 |
|
| GRAP | Despatch of communication of intention to grant a patent |
Free format text: ORIGINAL CODE: EPIDOSNIGR1 |
|
| STAA | Information on the status of an ep patent application or granted ep patent |
Free format text: STATUS: GRANT OF PATENT IS INTENDED |
|
| RIC1 | Information provided on ipc code assigned before grant |
Ipc: G06N 3/0455 20230101AFI20260311BHEP Ipc: G06N 3/084 20230101ALI20260311BHEP Ipc: G06N 3/0895 20230101ALI20260311BHEP Ipc: G06N 3/042 20230101ALN20260311BHEP Ipc: G06N 3/0442 20230101ALN20260311BHEP Ipc: G06N 3/047 20230101ALN20260311BHEP Ipc: G06N 3/0475 20230101ALN20260311BHEP Ipc: G06N 3/094 20230101ALN20260311BHEP |
|
| INTG | Intention to grant announced |
Effective date: 20260319 |
|
| GRAS | Grant fee paid |
Free format text: ORIGINAL CODE: EPIDOSNIGR3 |
|
| GRAA | (expected) grant |
Free format text: ORIGINAL CODE: 0009210 |
|
| STAA | Information on the status of an ep patent application or granted ep patent |
Free format text: STATUS: THE PATENT HAS BEEN GRANTED |
|
| AK | Designated contracting states |
Kind code of ref document: B1 Designated state(s): AL AT BE BG CH CY CZ DE DK EE ES FI FR GB GR HR HU IE IS IT LI LT LU LV MC MK MT NL NO PL PT RO RS SE SI SK SM TR |
|
| REG | Reference to a national code |
Ref country code: CH Ref legal event code: F10 Free format text: ST27 STATUS EVENT CODE: U-0-0-F10-F00 (AS PROVIDED BY THE NATIONAL OFFICE) Effective date: 20260708 Ref country code: GB Ref legal event code: FG4D |
|
| REG | Reference to a national code |
Ref country code: DE Ref legal event code: R096 Ref document number: 602021056864 Country of ref document: DE |
|
| REG | Reference to a national code |
Ref country code: IE Ref legal event code: FG4D |