EP4113307A1 - Onboarding of monitoring tools - Google Patents
Onboarding of monitoring tools Download PDFInfo
- Publication number
- EP4113307A1 EP4113307A1 EP22181769.5A EP22181769A EP4113307A1 EP 4113307 A1 EP4113307 A1 EP 4113307A1 EP 22181769 A EP22181769 A EP 22181769A EP 4113307 A1 EP4113307 A1 EP 4113307A1
- Authority
- EP
- European Patent Office
- Prior art keywords
- statistics
- application
- metrics
- region
- user interface
- Prior art date
- Legal status (The legal status is an assumption and is not a legal conclusion. Google has not performed a legal analysis and makes no representation as to the accuracy of the status listed.)
- Granted
Links
Images



Classifications
-
- G—PHYSICS
- G06—COMPUTING OR CALCULATING; COUNTING
- G06F—ELECTRIC DIGITAL DATA PROCESSING
- G06F21/00—Security arrangements for protecting computers, components thereof, programs or data against unauthorised activity
- G06F21/10—Protecting distributed programs or content, e.g. vending or licensing of copyrighted material ; Digital rights management [DRM]
- G06F21/105—Arrangements for software license management or administration, e.g. for managing licenses at corporate level
-
- G—PHYSICS
- G06—COMPUTING OR CALCULATING; COUNTING
- G06F—ELECTRIC DIGITAL DATA PROCESSING
- G06F11/00—Error detection; Error correction; Monitoring
- G06F11/30—Monitoring
- G06F11/3089—Monitoring arrangements determined by the means or processing involved in sensing the monitored data, e.g. interfaces, connectors, sensors, probes, agents
- G06F11/3093—Configuration details thereof, e.g. installation, enabling, spatial arrangement of the probes
-
- G—PHYSICS
- G06—COMPUTING OR CALCULATING; COUNTING
- G06F—ELECTRIC DIGITAL DATA PROCESSING
- G06F11/00—Error detection; Error correction; Monitoring
- G06F11/30—Monitoring
- G06F11/3003—Monitoring arrangements specially adapted to the computing system or computing system component being monitored
- G06F11/302—Monitoring arrangements specially adapted to the computing system or computing system component being monitored where the computing system component is a software system
-
- G—PHYSICS
- G06—COMPUTING OR CALCULATING; COUNTING
- G06F—ELECTRIC DIGITAL DATA PROCESSING
- G06F11/00—Error detection; Error correction; Monitoring
- G06F11/30—Monitoring
- G06F11/3065—Monitoring arrangements determined by the means or processing involved in reporting the monitored data
-
- G—PHYSICS
- G06—COMPUTING OR CALCULATING; COUNTING
- G06F—ELECTRIC DIGITAL DATA PROCESSING
- G06F11/00—Error detection; Error correction; Monitoring
- G06F11/30—Monitoring
- G06F11/32—Monitoring with visual or acoustical indication of the functioning of the machine
- G06F11/324—Display of status information
- G06F11/328—Computer systems status display
-
- G—PHYSICS
- G06—COMPUTING OR CALCULATING; COUNTING
- G06F—ELECTRIC DIGITAL DATA PROCESSING
- G06F11/00—Error detection; Error correction; Monitoring
- G06F11/30—Monitoring
- G06F11/34—Recording or statistical evaluation of computer activity, e.g. of down time, of input/output operation ; Recording or statistical evaluation of user activity, e.g. usability assessment
- G06F11/3409—Recording or statistical evaluation of computer activity, e.g. of down time, of input/output operation ; Recording or statistical evaluation of user activity, e.g. usability assessment for performance assessment
-
- G—PHYSICS
- G06—COMPUTING OR CALCULATING; COUNTING
- G06F—ELECTRIC DIGITAL DATA PROCESSING
- G06F11/00—Error detection; Error correction; Monitoring
- G06F11/30—Monitoring
- G06F11/34—Recording or statistical evaluation of computer activity, e.g. of down time, of input/output operation ; Recording or statistical evaluation of user activity, e.g. usability assessment
- G06F11/3466—Performance evaluation by tracing or monitoring
-
- G—PHYSICS
- G06—COMPUTING OR CALCULATING; COUNTING
- G06F—ELECTRIC DIGITAL DATA PROCESSING
- G06F21/00—Security arrangements for protecting computers, components thereof, programs or data against unauthorised activity
- G06F21/10—Protecting distributed programs or content, e.g. vending or licensing of copyrighted material ; Digital rights management [DRM]
- G06F21/12—Protecting executable software
- G06F21/121—Restricting unauthorised execution of programs
-
- G—PHYSICS
- G06—COMPUTING OR CALCULATING; COUNTING
- G06F—ELECTRIC DIGITAL DATA PROCESSING
- G06F3/00—Input arrangements for transferring data to be processed into a form capable of being handled by the computer; Output arrangements for transferring data from processing unit to output unit, e.g. interface arrangements
- G06F3/01—Input arrangements or combined input and output arrangements for interaction between user and computer
- G06F3/048—Interaction techniques based on graphical user interfaces [GUI]
- G06F3/0481—Interaction techniques based on graphical user interfaces [GUI] based on specific properties of the displayed interaction object or a metaphor-based environment, e.g. interaction with desktop elements like windows or icons, or assisted by a cursor's changing behaviour or appearance
- G06F3/0482—Interaction with lists of selectable items, e.g. menus
-
- G—PHYSICS
- G06—COMPUTING OR CALCULATING; COUNTING
- G06F—ELECTRIC DIGITAL DATA PROCESSING
- G06F9/00—Arrangements for program control, e.g. control units
- G06F9/06—Arrangements for program control, e.g. control units using stored programs, i.e. using an internal store of processing equipment to receive or retain programs
- G06F9/46—Multiprogramming arrangements
- G06F9/54—Interprogram communication
- G06F9/547—Remote procedure calls [RPC]; Web services
-
- H—ELECTRICITY
- H04—ELECTRIC COMMUNICATION TECHNIQUE
- H04L—TRANSMISSION OF DIGITAL INFORMATION, e.g. TELEGRAPHIC COMMUNICATION
- H04L41/00—Arrangements for maintenance, administration or management of data switching networks, e.g. of packet switching networks
- H04L41/04—Network management architectures or arrangements
- H04L41/046—Network management architectures or arrangements comprising network management agents or mobile agents therefor
-
- H—ELECTRICITY
- H04—ELECTRIC COMMUNICATION TECHNIQUE
- H04L—TRANSMISSION OF DIGITAL INFORMATION, e.g. TELEGRAPHIC COMMUNICATION
- H04L43/00—Arrangements for monitoring or testing data switching networks
- H04L43/04—Processing captured monitoring data, e.g. for logfile generation
- H04L43/045—Processing captured monitoring data, e.g. for logfile generation for graphical visualisation of monitoring data
-
- H—ELECTRICITY
- H04—ELECTRIC COMMUNICATION TECHNIQUE
- H04L—TRANSMISSION OF DIGITAL INFORMATION, e.g. TELEGRAPHIC COMMUNICATION
- H04L43/00—Arrangements for monitoring or testing data switching networks
- H04L43/08—Monitoring or testing based on specific metrics, e.g. QoS, energy consumption or environmental parameters
-
- H—ELECTRICITY
- H04—ELECTRIC COMMUNICATION TECHNIQUE
- H04L—TRANSMISSION OF DIGITAL INFORMATION, e.g. TELEGRAPHIC COMMUNICATION
- H04L67/00—Network arrangements or protocols for supporting network services or applications
- H04L67/01—Protocols
- H04L67/02—Protocols based on web technology, e.g. hypertext transfer protocol [HTTP]
- H04L67/025—Protocols based on web technology, e.g. hypertext transfer protocol [HTTP] for remote control or remote monitoring of applications
-
- G—PHYSICS
- G06—COMPUTING OR CALCULATING; COUNTING
- G06F—ELECTRIC DIGITAL DATA PROCESSING
- G06F11/00—Error detection; Error correction; Monitoring
- G06F11/008—Reliability or availability analysis
-
- G—PHYSICS
- G06—COMPUTING OR CALCULATING; COUNTING
- G06F—ELECTRIC DIGITAL DATA PROCESSING
- G06F16/00—Information retrieval; Database structures therefor; File system structures therefor
- G06F16/90—Details of database functions independent of the retrieved data types
- G06F16/95—Retrieval from the web
- G06F16/951—Indexing; Web crawling techniques
-
- G—PHYSICS
- G06—COMPUTING OR CALCULATING; COUNTING
- G06F—ELECTRIC DIGITAL DATA PROCESSING
- G06F21/00—Security arrangements for protecting computers, components thereof, programs or data against unauthorised activity
- G06F21/10—Protecting distributed programs or content, e.g. vending or licensing of copyrighted material ; Digital rights management [DRM]
- G06F21/107—License processing; Key processing
- G06F21/1073—Conversion
-
- G—PHYSICS
- G06—COMPUTING OR CALCULATING; COUNTING
- G06F—ELECTRIC DIGITAL DATA PROCESSING
- G06F2201/00—Indexing scheme relating to error detection, to error correction, and to monitoring
- G06F2201/865—Monitoring of software
-
- H—ELECTRICITY
- H04—ELECTRIC COMMUNICATION TECHNIQUE
- H04L—TRANSMISSION OF DIGITAL INFORMATION, e.g. TELEGRAPHIC COMMUNICATION
- H04L41/00—Arrangements for maintenance, administration or management of data switching networks, e.g. of packet switching networks
- H04L41/08—Configuration management of networks or network elements
- H04L41/0803—Configuration setting
- H04L41/0806—Configuration setting for initial configuration or provisioning, e.g. plug-and-play
-
- H—ELECTRICITY
- H04—ELECTRIC COMMUNICATION TECHNIQUE
- H04L—TRANSMISSION OF DIGITAL INFORMATION, e.g. TELEGRAPHIC COMMUNICATION
- H04L41/00—Arrangements for maintenance, administration or management of data switching networks, e.g. of packet switching networks
- H04L41/14—Network analysis or design
- H04L41/142—Network analysis or design using statistical or mathematical methods
-
- H—ELECTRICITY
- H04—ELECTRIC COMMUNICATION TECHNIQUE
- H04L—TRANSMISSION OF DIGITAL INFORMATION, e.g. TELEGRAPHIC COMMUNICATION
- H04L43/00—Arrangements for monitoring or testing data switching networks
- H04L43/08—Monitoring or testing based on specific metrics, e.g. QoS, energy consumption or environmental parameters
- H04L43/0876—Network utilisation, e.g. volume of load or congestion level
- H04L43/0888—Throughput
Definitions
- aspects of the disclosure relate generally to monitoring of networked devices.
- Network services form the backbone of on-line interactions. Those network services and the servers, databases or other storage or memory, and hardware/software interfaces, at times, need maintenance to address issues.
- service providers may segregate their services into production environments and non-production environments.
- the production environment may provide actual services while the non-production environment may be used to test new packages including software, network interactions, and/or network pathways before moving those packages to the production environment.
- Developers may use dashboards to monitor individual applications. Setting up the monitoring dashboards may be tedious as individual applications may exist in various forms across the production/non-production environments, have been written in a different software language and/or version of that software language, are isolated from other environments, require multiple unique license keys, and/or require detailed configuration. Those differences may require significant developer time to appropriately configure any given dashboard to monitor a specific application. Based on the complexity of establishing a single monitoring dashboard, attempting to establish multiple monitoring dashboards that span multiple applications may take weeks or months' worth of time to appropriately configure the dashboards.
- aspects described herein may address these and other problems, and generally improve how applications may be monitored via dashboards.
- customers using services provided by those applications may have better user experiences with those services.
- the improved services may be at least based on the developers being able to start monitoring applications more readily, thereby permitting moving applications from non-production environments to production environments.
- issues, whether transient and/or recurring, in the monitored applications may be able to be addressed more readily by reducing developers' workload for configuring the monitoring of each application and permitting the found time to be used in the actual monitoring and improving of the deployed applications.
- One or more aspects are directed to improving how applications are monitored.
- Other aspects may comprise improving how monitoring dashboards are implemented.
- a computer-implemented method may comprise receiving a dataset for deployed applications, wherein the dataset comprises application identifiers, production environment identifiers, and license keys, wherein the license keys are associated with combinations of the application identifiers and production environment identifiers.
- the method may further comprise generating a first user interface comprising a plurality of regions.
- the regions may comprise a first region configured to receive an application name associated with a deployed application of the deployed applications, a second region configured to receive a selection of production environment identifiers, a third region configured to receive a selection of license keys, and a fourth region configured to receive a language identification of a computer-readable language in which the deployed application was written.
- the method may further comprise receiving, via the first region, the application name; determining, from the dataset, an application identifier from the application identifiers corresponding to the application name; based on the application identifier, determining application identifier-specific production environment identifiers and application identifier-specific license keys associated with respective application identifier-specific production environment identifiers; modifying the first user interface to provide a list, in the second region, of the determined application identifier-specific production environment identifiers and to provide a list, in the third region, of the determined application identifier-specific license keys; and receiving, via the modified first user interface, a selected environment identifier via the second region, a selected license key via the third region, and the language identification via the fourth region.
- the method may further comprise generating, based on the generated software agent and the metrics made available via the generated software agent, a second user interface comprising a sixth region configured to receive the application identifier and a seventh region configured to receive a selection of the metrics; and based on the application identifier received in the sixth region and the selection of one or more of the metrics, cause a monitoring application to monitor the selected metrics via the API.
- API application programming interface
- a system of one or more computers may be configured to perform particular operations or actions by virtue of having software, firmware, hardware, or a combination of them installed on the system that in operation causes or cause the system to perform the actions.
- One or more computer programs may be configured to perform particular operations or actions by virtue of including instructions that, when executed by data processing apparatus, cause the apparatus to perform the actions.
- corresponding apparatus, systems, and computer-readable media are also within the scope of the disclosure.
- aspects discussed herein may relate to methods and techniques for monitoring applications.
- One or more of those aspects may include creating monitoring tool dashboards for monitoring deployed applications while accounting for the nuances of requirements to permit the monitoring of each application.
- aspects of the concept pertain to creating monitoring tool dashboards for monitoring deployed applications. Developers need to test and subsequently monitor deployed applications in active environments. While dashboards are useful, setting up monitoring dashboards is tedious and error-prone as each deployed application is different. For example, to enable a dashboard to subscribe to a data stream of an application, for instance, via an application programming interface (API) handle, the developer is required to research, for each application, that application's unique API handles and connect those handles to a monitoring dashboard. In some instances, multiple levels of authentication are required to be able to access the APIs, thus complicating the level of research required to implement a single monitoring dashboard.
- API application programming interface
- One or more aspects address the difficulty of creating monitoring dashboards by segmenting the creation of dashboards into creating a specific agent for the deployed application and creating a dashboard based on information made available by the application-specific agent.
- a process for creating the agent may include a user interface that provides a developer with possible options associated with different fields for the agent, where the options may be filtered based on based on previous selections in the user interface.
- a use-case is provided as follows.
- An application is deployed into a specific environment. That environment may be a production environment, a non-production environment, or other environment.
- a developer may provide initial information for an agent for monitoring that application including the name of the application and the production environment. From that information, information for that application may be obtained and used to populate a user interface for the developer to select among various options to further configure that agent.
- the various options may include, but are not limited to, license keys, production/non-production options, and/or other information specific for that application and/or environment.
- the agent may be generated based on the supplied information and installed in the application's environment. Next, a monitoring dashboard may be generated based on information known about the agent.
- the developer may identify, via a user interface for generating the monitoring dashboard, the name of the agent and/or the name of the application. From that information, the user interface for generating the dashboard may be updated with available items from that agent including, for instance, transaction-related metrics and/or browser related metrics. Based on the developer's selections of the one or more of the available metrics, the monitoring dashboard may be created by identifying the one or more data fields exposed via the agent for the subject application and generating one or more status regions, based on the selected metrics, that use information from the data exposed by the agent. By leveraging the translation capability of the agents, dashboards may be easily created as the agents are providing data using handles known at the time of creating the agent. In other words, the agent is providing standardized and/or previously identified fields.
- Additional implementations include generating an agent to monitor information other than performance of a deployed application.
- an additional implementation may include creating an accounting agent to monitor accounting information (e.g., ledger information) passing through a system and providing information flowing past that agent.
- Another implementation may include creating a financial agent to monitor a financial state of an organization.
- Yet another implementation may include creating a medical agent to monitor changes in the health records of a patient or patients, e.g., monitoring pharmaceutical prescriptions, relationships between physicians and patients, status of medical tests (performed and yet to be performed) and their results, and the like.
- a further implementation may include creating a credit monitoring agent to monitor a person's credit and/or multiple persons' credit and how the credit positions change over time. Other agents may be created and deployed as desired to monitor other data.
- Some of the advantages described herein include simplifying a dashboard generation process by removing the opportunity for errors entering improper information by confining selectable options to predefined selectable choices. Also, because the agents act as intermediaries between the applications and the dashboards, errors in creating the dashboards may be reduced as the dashboards are accessing known agents compared to unknown applications.
- FIG. 1 illustrates one example of a computing device 101 that may be used to implement one or more illustrative aspects discussed herein.
- the computing device 101 may, in some implementations, implement one or more aspects of the disclosure by reading and/or executing instructions and performing one or more actions based on the instructions.
- the computing device 101 may represent, be incorporated in, and/or include various devices such as a desktop computer, a computer server, a mobile device (e.g., a laptop computer, a tablet computer, a smart phone, any other types of mobile computing devices, and the like), and/or any other type of data processing device.
- the computing device 101 may, in some implementations, operate in a standalone environment. In others, the computing device 101 may operate in a networked environment. As shown in FIG. 1 , various network nodes 101, 105, 107, and 109 may be interconnected via a network 103, such as the Internet. Other networks may also or alternatively be used, including private intranets, corporate networks, LANs, wireless networks, personal networks (PAN), and the like. Network 103 is for illustration purposes and may be replaced with fewer or additional computer networks.
- a local area network (LAN) may have one or more of any known LAN topologies and may use one or more of a variety of different protocols, such as Ethernet.
- Devices 101, 105, 107, 109, and other devices may be connected to one or more of the networks via twisted pair wires, coaxial cable, fiber optics, radio waves, or other communication media. Additionally or alternatively, the computing device 101 and/or the network nodes 105, 107, and 109 may be a server hosting one or more databases.
- the computing device 101 may include a processor 111, RAM 113, ROM 115, network interface 117, input/output interfaces 119 (e.g., keyboard, mouse, display, printer, etc.), and memory 121.
- Processor 111 may include one or more computer processing units (CPUs), graphical processing units (GPUs), and/or other processing units such as a processor adapted to perform computations associated with database operations.
- Input/output 119 may include a variety of interface units and drives for reading, writing, displaying, and/or printing data or files. Input/output 119 may be coupled with a display such as display 120.
- Memory 121 may store software for configuring computing device 101 into a special purpose computing device in order to perform one or more of the various functions discussed herein.
- Memory 121 may store operating system software 123 for controlling overall operation of the computing device 101, control logic 125 for instructing the computing device 101 to perform aspects discussed herein, database creation and manipulation software 127 and other applications 129.
- Control logic 125 may be incorporated in and may be a part of database creation and manipulation software 127.
- the computing device 101 may include two or more of any and/or all of these components (e.g., two or more processors, two or more memories, etc.) and/or other components and/or subsystems not illustrated here.
- Devices 105, 107, 109 may have similar or different architecture as described with respect to the computing device 101.
- Those of skill in the art will appreciate that the functionality of the computing device 101 (or device 105, 107, 109) as described herein may be spread across multiple data processing devices, for example, to distribute processing load across multiple computers, to segregate transactions based on geographic location, user access level, quality of service (QoS), etc.
- devices 101, 105, 107, 109, and others may operate in concert to provide parallel computing features in support of the operation of control logic 125 and/or software 127.
- One or more aspects discussed herein may be embodied in computer-usable or readable data and/or computer-executable instructions, such as in one or more program modules, executed by one or more computers or other devices as described herein.
- program modules include routines, programs, objects, components, data structures, etc. that perform particular tasks or implement particular abstract data types when executed by a processor in a computer or other device.
- the modules may be written in a source code programming language that is subsequently compiled for execution, or may be written in a scripting language such as (but not limited to) Python or JavaScript.
- the computer executable instructions may be stored on a computer readable medium such as a hard disk, optical disk, removable storage media, solid-state memory, RAM, etc.
- the functionality of the program modules may be combined or distributed as desired in various implementations.
- the functionality may be embodied in whole or in part in firmware or hardware equivalents such as integrated circuits, field programmable gate arrays (FPGA), and the like.
- Particular data structures may be used to more effectively implement one or more aspects discussed herein, and such data structures are contemplated within the scope of computer executable instructions and computer-usable data described herein.
- Various aspects discussed herein may be embodied as a method, a computing device, a data processing system, or a computer program product. Having discussed several examples of computing devices which may be used to implement some aspects as discussed further below, discussion will now turn to a method for verifying an authentication capability for a service.
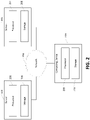
- FIG. 2 is a block diagram of an environment in which systems and/or methods described herein may be implemented.
- the environment may include servers 201 and 202 and a computing device 203 connected by a network 204.
- the devices, servers, and network may be interconnected via wired connections, wireless connections, or a combination of wired and wireless connections.
- the server 201 may be directed toward receiving files relating to activities from computing device 203 and then sending the files to server 202 for processing.
- the network 204 may include one or more wired and/or wireless networks.
- network 204 may include a cellular network (e.g., a long-term evolution (LTE) network, a code division multiple access (CDMA) network, a 3G network, a 4G network, a 5G network, another type of next generation network, etc.), a public land mobile network (PLMN), a local area network (LAN), a wide area network (WAN), a metropolitan area network (MAN), a telephone network (e.g., the Public Switched Telephone Network (PSTN)), a private network, an ad hoc network, an intranet, the Internet, a fiber optic-based network, a cloud computing network, or the like, and/or a combination of these or other types of networks.
- LTE long-term evolution
- CDMA code division multiple access
- 3G Third Generation
- 4G fourth generation
- 5G fifth generation
- PLMN public land mobile network
- PLMN public land mobile network
- LAN local area
- FIG. 2 The number and arrangement of devices and networks shown in FIG. 2 are provided as an example. In practice, there may be additional devices and/or networks, fewer devices and/or networks, different devices and/or networks, or differently arranged devices and/or networks than those shown in FIG. 2 . Furthermore, two or more servers shown in FIG. 2 may be implemented within a single server, or a single server shown in FIG. 2 may be implemented as multiple, distributed servers or in a cloud-based computing environment. Additionally, or alternatively, a set of devices (e.g., one or more devices) of the environment 203 may perform one or more functions described as being performed by another set of devices of the environment. Network 204 may be represented as a single network but may comprise combinations of other networks or subnetworks.
- agents may be configured on a computing device 203 using information from server 201 regarding one or more applications executing on server 202. Those agents may be installed in the computing environment of server 202 and provide access to data relating to those applications. Using data, from the agents installed in the computing environment of server 202, developers may generate monitoring dashboards for display on user interfaces, for instance, controlled by computing device 203. Additionally or alternatively, the agents may not be installed in the environments of the applications but instead execute separately and, for instance, send API calls to the applications and receive the applications' data streams in response to the API calls.
- a process of configuring agents to monitor applications and a process of configuring a monitoring environment to use data exposed by the agents to monitor applications are described herein. For purposes of explanation, the process is described in the following sections: Configuring Agents to Expose Application Data and Configuring Monitoring Environments using Agents.
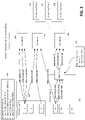
- FIG. 3 depicts a block diagram of monitoring dashboards configured to monitor applications in different environments.
- FIG. 3 includes environment 1 301 having applications A, B, through N and environment 2 302 having applications AA, BB through NN.
- FIG. 3 includes a plurality of monitoring environments and/or user interfaces that may include one or more monitoring dashboards 303-305.
- the monitoring dashboards 303-305 may have been created using one or more monitoring tools 1-3 306-308.
- dashboard 303 is configured to receive data streams A1, A2, and AX from application A in environment 1 301.
- the developer needs to know specific information regarding application A as well as information about environment 1 301.
- That specific information may include one or more of the items identified as application information 309 including a specific application identifier, a specific production environment identifier, a specific license key or keys, and specific names of data fields. It is appreciated that additional items or fewer items in application information 309 may be required to obtain information from application A in environment 1 301. In a typical example, a given application may require 18 or more different license keys based on a team's cloud accounts, production/non-production environments, and language combinations (e.g., JAVA, Go, Ruby, Python, Node.js) of possible agents. Further, hours may be spent learning each monitoring tool 306-308 and the quantity of monitoring tools to learn, in a given monitoring environment, may be seven or more.
- application information 309 including a specific application identifier, a specific production environment identifier, a specific license key or keys, and specific names of data fields. It is appreciated that additional items or fewer items in application information 309 may be required to obtain information from application A in environment 1 301. In a typical
- a dashboard 304 is configured to receive data streams A1, A2, and AX from application A and data stream N1 from application N in environment 1 301 and data stream AA1 from application AA in environment 2 302. Similar to the creation of dashboard 303, a developer needs to know specific information regarding application A, application N, and application AA that may include the items identified as application information 309 including a specific application identifier, a specific production environment identifier, specific license key or keys, and specific names of data fields. While the generation of dashboard 303 only required information relevant to application A and environment 1 301, the generation of dashboard 304 is increasingly complex as requiring, not only specific information regarding application A but also information regarding application N and information regarding application AA as well as specific information regarding each of environment 1 301 and environment 2 302.
- FIG. 3 provides further example in which an agent Q 310 monitors application AA and provides information regarding the operation of application AA to a monitoring dashboard 305.
- agent Q 310 is shown as installed in the environment 2 302. If installed in the environment 2 302, the agent Q 310 may directly monitor the operations of application AA. Being installed in the environment 2 302 may permit agent Q 310 to read data received by application AA and/or read data generated by application AA. Additionally or alternatively, agent Q 310 or another instance of agent Q 310 may reside separate from environment 2 302 (e.g., in a separate server). For instance, if residing separate from environment 2 302, the agent Q 310 may send application programming interface (API) calls to the application AA and, in response, receive one or more data streams relating to the operation of application AA.
- API application programming interface
- Agent Q 310 Information from agent Q 310 may be provided to monitoring dashboard 305.
- agent information 311 about agent Q 310 including an agent identification and agent data fields.
- the agent Q 310 receives data streams AA1, AA2, through AAX, from application AA of environment 2 302.
- Agent Q 310 wraps those data streams in its own identifiers and exposes the wrapped data streams to be accessed by monitoring dashboard 305 as data streams Q1, Q2, through QX.
- agent Q 310 may reformulate the incoming data streams into its own data streams.
- agent Q 310 as an intermediary, the developer is isolated from learning and re-learning the nuances of application AA and the nuances of environment 2 302. Rather, the developer is able to use the exposed interfaces of agent Q 310 to obtain relevant data streams from application AA.
- FIG. 4 depicts a user interface configured to receive selections for configuration of an agent.
- a developer may be presented with a user interface populated with information regarding available applications and environments.
- information regarding applications, environments, and related information may be provided as application data 401.
- Application data 401 may take the form of various computer readable information including one or more tables and/or one or more records stored in one or more databases to further the concepts as disclosed herein.
- Application data 401 may comprise rows and/or records identifying application names, application identifications associated with the application names, accounts associated with the applications, production environment information (e.g., production environments, nonproduction environments, and/or other environments), license keys associated with the applications in the accounts and the specific environments, and/or information describing operating systems in which the application executes. Additionally or alternatively, additional fields and/or fewer fields may be used in an implementation as described herein without detracting from the scope of the concepts.
- Agent templates 402 may be provided in one or more computer readable information forms (e.g., one or more tables and/or one or more records in one or more databases). Agent templates 402 may comprise templates for the creation of agents for installation in environments to monitor applications and/or to remotely monitor those applications. As shown in FIG. 4 , the agents are grouped into configurations of agents specific to an operating system of a particular environment in which an application exists. Alternatively or additionally, agent templates may be generic to operating system environments as the agents may run in virtual machines in the environments. For instance, the agent templates may be deployed in containers that run on virtual machines in each environment.
- the agents may be provided in containers that may be "dockerized” (e.g., via dockerizing a Node.js application to be executable on various platforms in accordance with extensible services provided by Docker Inc. at www.docker.com).
- Agent templates 402 may support various operating system environments by separate agent types being created for each operating system.
- the agent types may comprise Linux agent types 403, Ubuntu agent types 404, UNIX agent types 405, Windows Server agent types 406, and/or other agent types. It is appreciated that additional agent types or fewer agent types may be made available based on the types of operating systems in the environments of the applications.
- the agent types 403-406 may comprise templates for agents in various programming languages, e.g., Java, Python, .NET, Go, PHP, Ruby, Node.js, and the like. It is appreciated that agents in additional or fewer programming languages may be made available as programming languages increase and decrease in popularity or familiarity. Further, types of each language may be included as well - e.g., for instance, for Linux, Amazon Web Service's version of Linux and Rhel's version of Linux may be included; for Ubuntu, Zenial's version of Ubuntu and other versions may be included.
- FIG. 4 may include a user interface 407 that may comprise a variety of regions for accepting user input.
- the regions may comprise an application name region 408, an application ID region 409, an account name region 410, a production environment region 411, a license key or keys region 412, an operating system environment region 413, and an agent type region 414.
- One or more of the regions 408-414 may accept user input.
- a processor may compare that input with matching selections from application data 401 to obtain a filtered set of other options for display in the remaining user interface regions 408-414. For example, a developer may enter an application name in region 408. Based on that entry, a processor may retrieve data from application data 401 related the entered application name.
- the remaining user interface regions 409-414 may be populated with selectable content related to the retrieved fields from application data 401.
- the process may be repeated based on repeated selections of the selectable content from the various user interfaces 409-414. Additionally or alternatively, if there is only one option available for a region based on a previous selection, then the region may be populated with that sole value. For instance, if a developer enters "App A" for the application name in region 408, the application ID region 409 may be populated with the application ID "A ID" corresponding to the matching application ID for the "App A" application name in application data 401. Additionally or alternatively, the user interface 407 may be configured to require two or more data fields to be entered prior to looking up the relevant information from application data 401.
- region 414 may be populated with the software languages associated with agent templates listed in the UNIX agent types 405 in the agent templates 402 dataset.
- the list of agent types in agent templates 402 may be simply the list of agent templates by software language (e.g., Java, Python, etc.) and not operating system-specific lists as shown in FIG. 4 .
- a processor may use the information and the relevant agent template from agent templates 402 to generate agent_A 420.
- agent_A 420 may be installed in environment 1 421 to monitor the operations of application A 422.
- agent A 420 is shown as agent A 423 in broken lines in environment 1 421 and attached to application A 422.
- the agent_A 420 may monitor the operations of application A 422 in a variety of ways. For instance, the agent A 420 may actively compile information regarding the operation of application A 422. In response to an API request, the agent A 420 may forward the compiled information. Additionally or alternatively, the agent A 420 may passively provide access to the operations of application A 422. In response to an API request, the agent A 420 may provide information relating to the current operation of the application A 422.
- the agent A 420 may provide the information in a computer-readable form. For instance, the agent A 420 may provide the information in JSON and/or in XML formats.
- the agent_A 420 may be accessible as a resource (e.g., in a representational state transfer (REST) environment) and/or as a service (e.g., in a simple object access protocol (SOAP) environment) (also referred to as a Web service).
- the information provided by the agent A 420 may be raw information regarding the operation of the application A 422, compiled metrics (e.g., statistics, rates of events, etc.), combinations thereof, and/or other information regarding the operation of application A 422.
- FIG. 5 depicts a user interface configured to receive selections for configuration of a monitoring dashboard.
- FIG. 5 includes a dataset 501 that may include a variety of data relating an application name to an application ID, an account name, and/or an agent identification (also referred to as "agent ID").
- FIG. 5 also includes a user interface 502 provided to a developer by which the developer may specify information relating to the dashboard and what the dashboard is intended to display leading to a given application.
- FIG. 5 may further comprise datasets 509-510 relating to information available from agents relating to transaction metrics (as transaction metrics dataset 509) and browser metrics (as browser metrics dataset 510).
- a developer may receive a dashboard configuration user interface 502 from a processor.
- the dashboard configuration user interface 502 may comprise regions for receiving user selections/identifications of information pertinent to the generation of a monitoring dashboard.
- the dashboard configuration user interface 502 may comprise a dashboard name region 503, an account name region 504, an application name region 505, a monitoring tool selection region 506, a transaction metrics selection region 507, and/or a browser metrics selection region 508.
- a developer may enter a dashboard name in region 503 and enter an account name in region 504.
- the processor may receive the information from the developer, retrieve information relevant to the entered account name, and provide, for selection, available applications in the account. Additionally or alternatively, the developer may enter an application name and the processor modify the user interface 502 to reflect selectable account names available from dataset 501. Based on the developer's selections in the user interface 502, the processor may obtain, from dataset 501, the relevant agent for that application relating to the relevant account.
- monitoring tool selection region 506 The user may select, via monitoring tool selection region 506, a monitoring tool from the list of monitoring tools 1-3 511-513, for instance. Additional or fewer monitoring tools may be made available for selection. Examples of monitoring tools 1-3 511-513 that support various monitoring of applications (e.g., via processing received payloads into useable information for display on a dashboard) may include the ELK Kibana dashboards from Elasticsearch B.V. (providing data in a JSON and Lucerne formats) and the Splunk dashboards from Splunk Inc. (providing data in an XML format). Splunk and ELK Kibana are examples of log ingestion monitoring tools.
- Zabbix from Zabbix LLC, Amazon Web Services (AWS) Cloudwatch from Amazon Web Services, Inc., Datadog NK from Datadog, Inc. are examples of infrastructure monitoring tools.
- DataDog from DataDog, Inc., Gomez from Dynatrace, LLC., Apica from Apica AB, New Relic and New Relic One from New Relic Inc. are examples of application performance monitoring (APM) tools.
- Solarwinds and/or Centos from SolarWinds Worldwide, LLC. and Site 24/7 of Zoho Corp. are examples of network monitoring tools. Additional or fewer monitoring tools may be made available for selection as desired.
- the user interface 502 may be modified to provide a list of selectable metrics.
- monitoring tool 1 511 may provide both transaction metrics and browser metrics. It is appreciated that the types of metrics and related selection regions is related to those metrics provided by the monitoring tool or monitoring tools used to create
- the user may select one or more metrics as desired for incorporation into a dashboard.
- the selectable metrics provided in region 507 may be obtained from the transaction metrics data 509 relating to those transaction metrics provided by the selected agent agent_A1.
- the selectable metrics provided in region 508 may be obtained from the browser metrics data 510 relating to those browser metrics provided by the selected agent agent_A1.
- the transaction metrics available through the selected agent may be found in dataset 508 that relates available agents to available transaction metrics for that monitoring tool 1 508.
- the browser metrics available through the selected agent may be found in dataset 509 that relates available agents to available transaction metrics for that monitoring tool 1 508.
- a monitoring dashboard may be created, e.g., via one or more processors, conforming to the developer's selections.
- the selected metrics may be associated with software code that specifies one or more graphical and/or textual outputs for received information.
- the selected metrics may be instantiated in a monitoring environment 514 that displays metrics on a dashboard based on information from the selected agent.
- a processor may generate a combination of API call templates and a dashboard 520.
- the API call templates may be instantiated as API calls 518 to agent_A1 515.
- Agent_A1 515 receives information about application A 516 and, based on received API calls 518, agent_A1 515 sends, as payloads in the API responses 519, the information requested.
- agent Al 515 and application A 516 are shown as executing in environment 1 517.
- the payloads are receive in monitoring environment 514 and processed for display in the dashboard 520.
- software code to generate a graphical representation of an error count over time may comprise software code that sends, to the specific agent monitoring an application and via an API call, a request for a data stream relating to errors and when those errors occurred.
- the selectable transaction metrics dataset 508 may relate agent IDs to various transaction metrics, where each of the selectable transaction metrics identifies an API call to that specific agent for that metric.
- the list of transaction metrics may comprise a variety of metrics, e.g., throughput metrics, top five slow performing transaction metrics, response time statistics metrics, average response time by transaction type metrics, HTTP response code metrics, top error transaction metrics, 4XX error rate metrics (e.g., three digit HTTP error codes starting with "4"), 5XX error rate metrics (e.g., three digit HTTP error codes starting with "5"), recent errors metrics, error count metrics, and transaction count comparison metrics.
- the selectable browser metrics dataset 510 may comprise a variety of metrics, e.g., unique sessions metrics, page views based on device type metrics, sessions count by platform metrics, unique sessions one-week comparison metrics, average page rendering duration metrics, sessions by device type metrics, average DOM (document object model) processing duration metrics, most popular pages metrics, and average page views per session metrics. It is appreciated that the number and type of selectable metrics is related to the selected monitoring tool 1-3 511-513 and the metric obtainable by the agent installed in the environment to monitor the application.
- FIG. 5 may also include various types of alerts that may be associated with or independent from the generation of the dashboard 520. Similar to dashboarding, alerting may vary in complexity based on the available monitoring tools. For example, three types of alerts may be used. For reference, the alerts may be described as tier 0 alerts, tier 1 alerts, and tier 2 alerts. Tier 0 alerts may include alerts of the highest priority. When triggered, the application, network, and/or storage is in peril and the overall system is shut down until resolved. Tier 1 alerts may include alerts identifying a service degradation has been detected and one or more components need attention. Tier 2 alerts may include alerts that are still critical but redundancies for those components exist and are being temporarily used until the issue has been resolved.
- a greater or fewer quantity of alerts may be used as desired.
- a monitoring tool may create and mute alerts descriptions based on the same process as selecting and creating the monitoring dashboard 520.
- the software developers and/or management teams may modify the monitoring environment 514 to customize when alerts are triggered and/or the information displayed on dashboard 520.
- FIG. 6 depicts an example of a monitoring dashboard.
- a monitoring dashboard 601 may comprise information 602 relating to a dashboard name and/or account name and/or production environment. Graphical and/or textual regions may be generated to reflect metrics from a selected application with information received via a relevant agent. The regions may comprise, for instance, a throughput region 603, HTTP response codes region 604, top five slow performing transactions region 605, response time statistics region 606, average response time by transaction type region 607, and top error transactions region 608.
- the monitoring dashboard 601 may be modified to include a greater number of or fewer metrics as desired and as relating to the selected monitoring tool 1-3 511-513.
- FIG. 7 depicts an example of a process for creating an agent to monitor an application.
- a dataset for deployed applications is received.
- a user interface with selectable applications is generated for developer.
- the user interface receives the developer's selection of the deployed application.
- the system determines available environment identifiers/license keys for the deployed application.
- a processor generates a user interface or updates the existing user interface with available environment identifiers/license keys/software languages relevant to the deployed application.
- the user interface receives selections of the environment identifiers/lesions keys/software language for an agent.
- a processor retrieves a software agent template based on one or more of the received selections from the developer.
- a software agent is generated based on one or more of the selections.
- the processor may cause installation of the software agent in the environment to monitor the relevant application (or cause the agent to remotely monitor the relevant application).
- APIs exposed by the software agent may be accessible by one or more monitoring applications (e.g., one or more monitoring dashboards).
- FIG. 8 depicts an example of a process for creating a dashboard using information from the agent to monitor the deployed application.
- step 801 one or more datasets for deployed applications and/or agents are received.
- step 802 a user interface is generated in which the user interface contains selectable applications and/or available agents.
- step 803 a processor receives a developer's selections made via the user interface from step 802.
- step 804 a processor determines one or more relevant application and/or agents based on the selections from step 803.
- the processor generates (and/or updates) a user interface with available transaction metrics/browser metrics relating to metrics available via the agent.
- step 806 receives the developer's selections made via the interface generated in step 805.
- a dashboard is generated in step 807.
- step 808, API calls to the specific agent/agents are generated.
- step 809 information relating to the selected metrics are processed and displayed as updates to the dashboard.
- a computer-implemented process may comprise receiving a dataset for deployed applications, wherein the dataset comprises application identifiers, production environment identifiers, and license keys, wherein the license keys are associated with combinations of the application identifiers and production environment identifiers.
- the method may further comprise generating a first user interface comprising a plurality of regions.
- the regions may comprise a first region configured to receive an application name associated with a deployed application of the deployed applications, a second region configured to receive a selection of production environment identifiers, a third region configured to receive a selection of license keys, and a fourth region configured to receive a language identification of a computer-readable language in which the deployed application was written.
- the method may further comprise receiving, via the first region, the application name; determining, from the dataset, an application identifier from the application identifiers corresponding to the application name; based on the application identifier, determining application identifier-specific production environment identifiers and application identifier-specific license keys associated with respective application identifier-specific production environment identifiers; modifying the first user interface to provide a list, in the second region, of the determined application identifier-specific production environment identifiers and to provide a list, in the third region, of the determined application identifier-specific license keys; and receiving, via the modified first user interface, a selected environment identifier via the second region, a selected license key via the third region, and the language identification via the fourth region.
- the method may further comprise generating, based on the generated software agent and the metrics made available via the generated software agent, a second user interface comprising a sixth region configured to receive the application identifier and a seventh region configured to receive a selection of the metrics; and based on the application identifier received in the sixth region and the selection of one or more of the metrics, cause a monitoring application to monitor the selected service via the API.
- API application programming interface
- the monitoring application may comprise a dashboard user interface comprising graphical representations of operations of the metrics.
- the method may further comprise receiving an operating system identification.
- the software agent may be generated based on the language identification associated with the deployed application and based on the operating system identification and retrieving a software agent template configured to monitor where the template is written to be used in the identified operating system.
- the agent may be generated based on the software agent template, the application name, the selected environment identifier, and the selected license key.
- the software agent may be generated contact information received via the first user interface.
- the metrics may comprise one or more metrics that may include response-related statistics such as throughput statistics; response time statistics; slow performing transaction statistics; average response times per transaction type statistics; transaction count comparison statistics; or a combination of one or more of the throughput statistics, response time statistics, the slow performing transaction statistics, the average response times per transaction type statistics, and the transaction count comparison statistics. Additionally or alternatively, the metrics may comprise metrics that include error-related statistics comprising error code statistics; recent error code statistics; error codes by code type statistics; error counts statistics; or a combination of one or more of the error code statistics, the recent error code statistics, the error codes by error code type statistics, and the error counts statistics.
- response-related statistics such as throughput statistics; response time statistics; slow performing transaction statistics; average response times per transaction type statistics; transaction count comparison statistics; or a combination of one or more of the throughput statistics, response time statistics, the slow performing transaction statistics, the average response times per transaction type statistics, and the transaction count comparison statistics.
- the metrics may comprise metrics that include error-related statistics comprising error code statistics; recent error code statistics;
- the metrics may further comprise access-related statistics comprising unique session statistics; page views based on device type statistics; session counts per platform statistics; unique sessions per time window statistics; average page rendering duration statistics; sessions by device type statistics; average document object model (DOM) processing duration statistics; page popularity statistics; average page views per session statistics; or a combination of one or more of the unique session statistics, the page views based on device type statistics, the session counts per platform statistics, the unique sessions per time window statistics, the average page rendering duration statistics, the sessions by device type statistics, the average document object model (DOM) processing duration statistics, the page popularity statistics, and the average page views per session statistics.
- access-related statistics comprising unique session statistics; page views based on device type statistics; session counts per platform statistics; unique sessions per time window statistics; average page rendering duration statistics; sessions by device type statistics; average document object model (DOM) processing duration statistics, the page popularity statistics, and the average page views per session statistics.
- the method may further comprise receiving, for the deployed application, a deployment environment identification identifying the deployment environment as a production environment or a non-production environment and the agent is based on the received deployment environment identification.
- the software agent may be deployed to monitor the deployed application.
- the user interfaces may be modified based on selections made in the user interface, e.g., to include additional regions and/or metrics.
- the method may further comprise receiving an operating system identification associated with an operating system of the deployed application; and receiving operating system-specific instructions for generating the software agent. The generation of the software agent may be based on the received operating system-specific instructions.
- the apparatus may comprise one or more processors with instructions that cause the processors to receive a dataset for deployed applications, where the dataset may comprise application identifiers, production environment identifiers, and license keys.
- the license keys may be associated with combinations of the application identifiers and production environment identifiers.
- the instructions may further cause the apparatus to generate, based on the received dataset, a first user interface comprising a first region configured to receive an application name associated with a deployed application of the deployed applications, a second region configured to receive a selection of production environment identifiers, a third region configured to receive a selection of license keys, a fourth region configured to receive a language identification of a computer-readable language in which the deployed application was written, and a fifth region configured to receive an operating system identification identifying an operating system in which the deployed application executes.
- a first user interface comprising a first region configured to receive an application name associated with a deployed application of the deployed applications, a second region configured to receive a selection of production environment identifiers, a third region configured to receive a selection of license keys, a fourth region configured to receive a language identification of a computer-readable language in which the deployed application was written, and a fifth region configured to receive an operating system identification identifying an operating system in which the deployed application executes.
- the instructions may cause the apparatus to receive, via the first region, the application name; determine, from the dataset, an application identifier from the application identifiers corresponding to the application name; based on the application identifier, determine application identifier-specific production environment identifiers and application identifier-specific license keys associated with respective application identifier-specific production environment identifiers; and modify the first user interface to provide a list, in the second region, of the determined application identifier-specific production environment identifiers and to provide a list, in the third region, of the determined application identifier-specific license keys.
- the instructions may further cause the apparatus to receive, via the modified first user interface, a selected environment identifier via the second region, a selected license key via the third region, the language identification via the fourth region, and the operating system identification via the fifth region and, based on the application identifier, the selected environment identifier, the selected license key, the language identification, and the operating system identification, generate a software agent configured to facilitate monitoring the deployed application.
- the software agent may be configured to expose operations of the deployed application to be addressable, via an application programming interface (API), as metrics.
- API application programming interface
- the instructions may further cause the apparatus to generate, based on the generated software agent and the metrics made available via the generated software agent, a second user interface comprising a sixth region configured to receive the application identifier and a seventh region configured to receive a selection of the metrics and, based on the application identifier received in the sixth region and the selection of one or more of the metrics, cause a monitoring application to monitor the selected service via the API.
- the generated second user interface is a dashboard comprising graphical representations of operations of the metrics.
- the metrics may comprise throughput statistics; response time statistics; slow performing transaction statistics; average response times per transaction type statistics; transaction count comparison statistics; or a combination of one or more of the throughput statistics, response time statistics, the slow performing transaction statistics, the average response times per transaction type statistics, and the transaction count comparison statistics.
- the metrics comprise error code statistics; recent error code statistics; error codes by code type statistics; error counts statistics; or a combination of one or more of the error code statistics, the recent error code statistics, the error codes by error code type statistics, and the error counts statistics.
- the metrics comprise unique session statistics; page views based on device type statistics; session counts per platform statistics; unique sessions per time window statistics; average page rendering duration statistics; sessions by device type statistics; average document object model (DOM) processing duration statistics; page popularity statistics; average page views per session statistics; or a combination of one or more of the unique session statistics, the page views based on device type statistics, the session counts per platform statistics, the unique sessions per time window statistics, the average page rendering duration statistics, the sessions by device type statistics, the average document object model (DOM) processing duration statistics, the page popularity statistics, and the average page views per session statistics.
- the instructions may further cause the apparatus to receive, for the deployed application, a deployment environment identification identifying the deployment environment as a production environment or a non-production environment, wherein generation of the software agent is further based on the received deployment environment identification.
- Implementations of the described techniques may include hardware, a method or process, or computer software on a computer-accessible medium.
- implementations of this aspect include corresponding computer systems, apparatus, and computer programs recorded on one or more computer storage devices, each configured to perform the actions of the methods.
- a non-transitory media may store instructions that, when executed by a processor, cause the processor to perform functions comprising receiving a dataset for deployed applications, wherein the dataset comprises application identifiers, production environment identifiers, and license keys, wherein the license keys are associated with combinations of the application identifiers and production environment identifiers.
- the instructions may further cause the processor to perform functions including generating, based on the received dataset, a first user interface comprising a plurality of regions.
- the first user interface may comprise a first region configured to receive an application name associated with a deployed application of the deployed applications, a second region configured to receive a selection of production environment identifiers, a third region configured to receive a selection of license keys, and a fourth region configured to receive a language identification of a computer-readable language in which the deployed application was written.
- the instructions may further cause the processor to perform functions including receiving, via the first region, the application name; determining, from the dataset, an application identifier from the application identifiers corresponding to the application name; based on the application identifier, determining application identifier-specific production environment identifiers and application identifier-specific license keys associated with respective application identifier-specific production environment identifiers; modifying the first user interface to provide a list, in the second region, of the determined application identifier-specific production environment identifiers and to provide a list, in the third region, of the determined application identifier-specific license keys; and receiving, via the modified first user interface, a selected environment identifier via the second region, a selected license key via the third region, and the language identification via the fourth region.
- the instructions may further cause the processor to perform functions including generating a software agent configured to facilitate monitoring the deployed application, wherein the software agent is configured to expose operations of the deployed application to be addressable, via an application programming interface (API), as metrics; generating, based on the generated software agent and the metrics made available via the generated software agent, a second user interface comprising a sixth region configured to receive the application identifier and a seventh region configured to receive a selection of the metrics; and based on the application identifier received in the sixth region and the selection of one or more of the metrics, cause a monitoring application to monitor the selected service via the API.
- API application programming interface
- the generated second user interface may include a dashboard comprising graphical representations of operations of the metrics.
- Other embodiments of this aspect include corresponding computer systems, apparatus, and computer programs recorded on one or more computer storage devices, each configured to perform the actions of the methods.
Landscapes
- Engineering & Computer Science (AREA)
- Theoretical Computer Science (AREA)
- General Engineering & Computer Science (AREA)
- Physics & Mathematics (AREA)
- General Physics & Mathematics (AREA)
- Software Systems (AREA)
- Quality & Reliability (AREA)
- Computer Hardware Design (AREA)
- Computer Security & Cryptography (AREA)
- Computer Networks & Wireless Communication (AREA)
- Signal Processing (AREA)
- Technology Law (AREA)
- Multimedia (AREA)
- Computing Systems (AREA)
- Data Mining & Analysis (AREA)
- Human Computer Interaction (AREA)
- Mathematical Physics (AREA)
- Environmental & Geological Engineering (AREA)
- Stored Programmes (AREA)
Abstract
Description
- Aspects of the disclosure relate generally to monitoring of networked devices.
- Network services form the backbone of on-line interactions. Those network services and the servers, databases or other storage or memory, and hardware/software interfaces, at times, need maintenance to address issues. To eliminate interruptions caused by taking network services offline, service providers may segregate their services into production environments and non-production environments. The production environment may provide actual services while the non-production environment may be used to test new packages including software, network interactions, and/or network pathways before moving those packages to the production environment. Developers may use dashboards to monitor individual applications. Setting up the monitoring dashboards may be tedious as individual applications may exist in various forms across the production/non-production environments, have been written in a different software language and/or version of that software language, are isolated from other environments, require multiple unique license keys, and/or require detailed configuration. Those differences may require significant developer time to appropriately configure any given dashboard to monitor a specific application. Based on the complexity of establishing a single monitoring dashboard, attempting to establish multiple monitoring dashboards that span multiple applications may take weeks or months' worth of time to appropriately configure the dashboards.
- The following presents a simplified summary of various aspects described herein. This summary is not an extensive overview, and is not intended to identify key or critical elements or to delineate the scope of the claims. The following summary merely presents some concepts in a simplified form as an introductory prelude to the more detailed description provided below.
- Aspects described herein may address these and other problems, and generally improve how applications may be monitored via dashboards. In additional aspects, based on the improvements in the speed to begin monitoring applications, customers using services provided by those applications may have better user experiences with those services. The improved services may be at least based on the developers being able to start monitoring applications more readily, thereby permitting moving applications from non-production environments to production environments. Further, issues, whether transient and/or recurring, in the monitored applications may be able to be addressed more readily by reducing developers' workload for configuring the monitoring of each application and permitting the found time to be used in the actual monitoring and improving of the deployed applications. One or more aspects are directed to improving how applications are monitored. Other aspects may comprise improving how monitoring dashboards are implemented. By efficiently establishing monitoring environments and/or displays to be used in the monitoring of deployed applications, delays caused by issues associated with inadequately monitored applications may be avoided and, thus, improve overall experiences for the companies' customers.
- According to some aspects, these and other benefits may be achieved by using a computer-implemented method that may comprise receiving a dataset for deployed applications, wherein the dataset comprises application identifiers, production environment identifiers, and license keys, wherein the license keys are associated with combinations of the application identifiers and production environment identifiers. The method may further comprise generating a first user interface comprising a plurality of regions. The regions may comprise a first region configured to receive an application name associated with a deployed application of the deployed applications, a second region configured to receive a selection of production environment identifiers, a third region configured to receive a selection of license keys, and a fourth region configured to receive a language identification of a computer-readable language in which the deployed application was written. The method may further comprise receiving, via the first region, the application name; determining, from the dataset, an application identifier from the application identifiers corresponding to the application name; based on the application identifier, determining application identifier-specific production environment identifiers and application identifier-specific license keys associated with respective application identifier-specific production environment identifiers; modifying the first user interface to provide a list, in the second region, of the determined application identifier-specific production environment identifiers and to provide a list, in the third region, of the determined application identifier-specific license keys; and receiving, via the modified first user interface, a selected environment identifier via the second region, a selected license key via the third region, and the language identification via the fourth region. Based on the application identifier, the selected environment identifier, the selected license key, and the language identification, generating a software agent configured to facilitate monitoring the deployed application, wherein the software agent is configured to expose operations of the deployed application to be addressable, via an application programming interface (API), as metrics. The method may further comprise generating, based on the generated software agent and the metrics made available via the generated software agent, a second user interface comprising a sixth region configured to receive the application identifier and a seventh region configured to receive a selection of the metrics; and based on the application identifier received in the sixth region and the selection of one or more of the metrics, cause a monitoring application to monitor the selected metrics via the API.
- A system of one or more computers may be configured to perform particular operations or actions by virtue of having software, firmware, hardware, or a combination of them installed on the system that in operation causes or cause the system to perform the actions. One or more computer programs may be configured to perform particular operations or actions by virtue of including instructions that, when executed by data processing apparatus, cause the apparatus to perform the actions. As such, corresponding apparatus, systems, and computer-readable media are also within the scope of the disclosure.
- These features, along with many others, are discussed in greater detail below.
- The present disclosure is illustrated by way of example and not limited in the accompanying figures in which like reference numerals indicate similar elements and in which:
-
FIG. 1 depicts an example of a computing device and system architecture that may be used in implementing one or more aspects of the disclosure in accordance with one or more illustrative aspects discussed herein; -
FIG. 2 depicts a block diagram of an environment in which systems and/or methods described herein may be implemented; -
FIG. 3 depicts a block diagram of monitoring dashboards configured to monitor applications in different environments; -
FIG. 4 depicts a user interface configured to receive selections for configuration of an agent; -
FIG. 5 depicts a user interface configured to receive selections for configuration of a monitoring dashboard; -
FIG. 6 depicts an example of a monitoring dashboard; -
FIG. 7 depicts an example of a process for creating an agent to monitor an application; and -
FIG. 8 depicts an example of a process for creating a dashboard using information from the agent to monitor the application. - In the following description of the various implementations, reference is made to the accompanying drawings, which form a part hereof, and in which is shown by way of illustration various implementations in which aspects of the disclosure may be practiced. It is to be understood that other implementations may be utilized and structural and functional modifications may be made without departing from the scope of the present disclosure. Aspects of the disclosure are capable of other implementations and of being practiced or being carried out in various ways. Also, it is to be understood that the phraseology and terminology used herein are for the purpose of description and should not be regarded as limiting. Rather, the phrases and terms used herein are to be given their broadest interpretation and meaning. The use of "including" and "comprising" and variations thereof is meant to encompass the items listed thereafter and equivalents thereof as well as additional items and equivalents thereof. Any sequence of computer-implementable instructions described in this disclosure may be considered to be an "algorithm" as those instructions are intended to solve one or more classes of problems or to perform one or more computations.
- By way of introduction, aspects discussed herein may relate to methods and techniques for monitoring applications. One or more of those aspects may include creating monitoring tool dashboards for monitoring deployed applications while accounting for the nuances of requirements to permit the monitoring of each application.
- Aspects of the concept pertain to creating monitoring tool dashboards for monitoring deployed applications. Developers need to test and subsequently monitor deployed applications in active environments. While dashboards are useful, setting up monitoring dashboards is tedious and error-prone as each deployed application is different. For example, to enable a dashboard to subscribe to a data stream of an application, for instance, via an application programming interface (API) handle, the developer is required to research, for each application, that application's unique API handles and connect those handles to a monitoring dashboard. In some instances, multiple levels of authentication are required to be able to access the APIs, thus complicating the level of research required to implement a single monitoring dashboard. One or more aspects address the difficulty of creating monitoring dashboards by segmenting the creation of dashboards into creating a specific agent for the deployed application and creating a dashboard based on information made available by the application-specific agent. A process for creating the agent may include a user interface that provides a developer with possible options associated with different fields for the agent, where the options may be filtered based on based on previous selections in the user interface.
- A use-case is provided as follows. An application is deployed into a specific environment. That environment may be a production environment, a non-production environment, or other environment. A developer may provide initial information for an agent for monitoring that application including the name of the application and the production environment. From that information, information for that application may be obtained and used to populate a user interface for the developer to select among various options to further configure that agent. The various options may include, but are not limited to, license keys, production/non-production options, and/or other information specific for that application and/or environment. The agent may be generated based on the supplied information and installed in the application's environment. Next, a monitoring dashboard may be generated based on information known about the agent. For instance, the developer may identify, via a user interface for generating the monitoring dashboard, the name of the agent and/or the name of the application. From that information, the user interface for generating the dashboard may be updated with available items from that agent including, for instance, transaction-related metrics and/or browser related metrics. Based on the developer's selections of the one or more of the available metrics, the monitoring dashboard may be created by identifying the one or more data fields exposed via the agent for the subject application and generating one or more status regions, based on the selected metrics, that use information from the data exposed by the agent. By leveraging the translation capability of the agents, dashboards may be easily created as the agents are providing data using handles known at the time of creating the agent. In other words, the agent is providing standardized and/or previously identified fields. This is in contrast to attempting to learn the nuances of each application's API and authentication requirements. Using the agents reduces the developer's need to obtain in-depth knowledge of each application before being able to access the application's data and reduces the developer's need to obtain in-depth knowledge of each monitoring tool before being able to generate monitoring dashboards for the application or applications. Additional implementations include generating an agent to monitor information other than performance of a deployed application. For example, an additional implementation may include creating an accounting agent to monitor accounting information (e.g., ledger information) passing through a system and providing information flowing past that agent. Another implementation may include creating a financial agent to monitor a financial state of an organization. Yet another implementation may include creating a medical agent to monitor changes in the health records of a patient or patients, e.g., monitoring pharmaceutical prescriptions, relationships between physicians and patients, status of medical tests (performed and yet to be performed) and their results, and the like. A further implementation may include creating a credit monitoring agent to monitor a person's credit and/or multiple persons' credit and how the credit positions change over time. Other agents may be created and deployed as desired to monitor other data.
- Some of the advantages described herein include simplifying a dashboard generation process by removing the opportunity for errors entering improper information by confining selectable options to predefined selectable choices. Also, because the agents act as intermediaries between the applications and the dashboards, errors in creating the dashboards may be reduced as the dashboards are accessing known agents compared to unknown applications. Before discussing these concepts in greater detail, however, several examples of a computing device that may be used in implementing and/or otherwise providing various aspects of the disclosure will first be discussed with respect to
FIG. 1 . -
FIG. 1 illustrates one example of acomputing device 101 that may be used to implement one or more illustrative aspects discussed herein. For example, thecomputing device 101 may, in some implementations, implement one or more aspects of the disclosure by reading and/or executing instructions and performing one or more actions based on the instructions. In some implementations, thecomputing device 101 may represent, be incorporated in, and/or include various devices such as a desktop computer, a computer server, a mobile device (e.g., a laptop computer, a tablet computer, a smart phone, any other types of mobile computing devices, and the like), and/or any other type of data processing device. - The
computing device 101 may, in some implementations, operate in a standalone environment. In others, thecomputing device 101 may operate in a networked environment. As shown inFIG. 1 ,various network nodes network 103, such as the Internet. Other networks may also or alternatively be used, including private intranets, corporate networks, LANs, wireless networks, personal networks (PAN), and the like.Network 103 is for illustration purposes and may be replaced with fewer or additional computer networks. A local area network (LAN) may have one or more of any known LAN topologies and may use one or more of a variety of different protocols, such as Ethernet.Devices computing device 101 and/or thenetwork nodes - As seen in
FIG. 1 , thecomputing device 101 may include aprocessor 111,RAM 113,ROM 115,network interface 117, input/output interfaces 119 (e.g., keyboard, mouse, display, printer, etc.), andmemory 121.Processor 111 may include one or more computer processing units (CPUs), graphical processing units (GPUs), and/or other processing units such as a processor adapted to perform computations associated with database operations. Input/output 119 may include a variety of interface units and drives for reading, writing, displaying, and/or printing data or files. Input/output 119 may be coupled with a display such asdisplay 120.Memory 121 may store software for configuringcomputing device 101 into a special purpose computing device in order to perform one or more of the various functions discussed herein.Memory 121 may storeoperating system software 123 for controlling overall operation of thecomputing device 101,control logic 125 for instructing thecomputing device 101 to perform aspects discussed herein, database creation andmanipulation software 127 andother applications 129.Control logic 125 may be incorporated in and may be a part of database creation andmanipulation software 127. In other implementations, thecomputing device 101 may include two or more of any and/or all of these components (e.g., two or more processors, two or more memories, etc.) and/or other components and/or subsystems not illustrated here. -
Devices computing device 101. Those of skill in the art will appreciate that the functionality of the computing device 101 (ordevice devices control logic 125 and/orsoftware 127. - One or more aspects discussed herein may be embodied in computer-usable or readable data and/or computer-executable instructions, such as in one or more program modules, executed by one or more computers or other devices as described herein. Generally, program modules include routines, programs, objects, components, data structures, etc. that perform particular tasks or implement particular abstract data types when executed by a processor in a computer or other device. The modules may be written in a source code programming language that is subsequently compiled for execution, or may be written in a scripting language such as (but not limited to) Python or JavaScript. The computer executable instructions may be stored on a computer readable medium such as a hard disk, optical disk, removable storage media, solid-state memory, RAM, etc. As will be appreciated by one of skill in the art, the functionality of the program modules may be combined or distributed as desired in various implementations. In addition, the functionality may be embodied in whole or in part in firmware or hardware equivalents such as integrated circuits, field programmable gate arrays (FPGA), and the like. Particular data structures may be used to more effectively implement one or more aspects discussed herein, and such data structures are contemplated within the scope of computer executable instructions and computer-usable data described herein. Various aspects discussed herein may be embodied as a method, a computing device, a data processing system, or a computer program product. Having discussed several examples of computing devices which may be used to implement some aspects as discussed further below, discussion will now turn to a method for verifying an authentication capability for a service.
-
FIG. 2 is a block diagram of an environment in which systems and/or methods described herein may be implemented. As shown inFIG. 2 , the environment may includeservers computing device 203 connected by anetwork 204. The devices, servers, and network may be interconnected via wired connections, wireless connections, or a combination of wired and wireless connections. Theserver 201 may be directed toward receiving files relating to activities fromcomputing device 203 and then sending the files toserver 202 for processing. - The
network 204 may include one or more wired and/or wireless networks. For example,network 204 may include a cellular network (e.g., a long-term evolution (LTE) network, a code division multiple access (CDMA) network, a 3G network, a 4G network, a 5G network, another type of next generation network, etc.), a public land mobile network (PLMN), a local area network (LAN), a wide area network (WAN), a metropolitan area network (MAN), a telephone network (e.g., the Public Switched Telephone Network (PSTN)), a private network, an ad hoc network, an intranet, the Internet, a fiber optic-based network, a cloud computing network, or the like, and/or a combination of these or other types of networks. - The number and arrangement of devices and networks shown in
FIG. 2 are provided as an example. In practice, there may be additional devices and/or networks, fewer devices and/or networks, different devices and/or networks, or differently arranged devices and/or networks than those shown inFIG. 2 . Furthermore, two or more servers shown inFIG. 2 may be implemented within a single server, or a single server shown inFIG. 2 may be implemented as multiple, distributed servers or in a cloud-based computing environment. Additionally, or alternatively, a set of devices (e.g., one or more devices) of theenvironment 203 may perform one or more functions described as being performed by another set of devices of the environment.Network 204 may be represented as a single network but may comprise combinations of other networks or subnetworks. In one or more examples, agents may be configured on acomputing device 203 using information fromserver 201 regarding one or more applications executing onserver 202. Those agents may be installed in the computing environment ofserver 202 and provide access to data relating to those applications. Using data, from the agents installed in the computing environment ofserver 202, developers may generate monitoring dashboards for display on user interfaces, for instance, controlled by computingdevice 203. Additionally or alternatively, the agents may not be installed in the environments of the applications but instead execute separately and, for instance, send API calls to the applications and receive the applications' data streams in response to the API calls. - A process of configuring agents to monitor applications and a process of configuring a monitoring environment to use data exposed by the agents to monitor applications are described herein. For purposes of explanation, the process is described in the following sections: Configuring Agents to Expose Application Data and Configuring Monitoring Environments using Agents.
-
FIG. 3 depicts a block diagram of monitoring dashboards configured to monitor applications in different environments.FIG. 3 includesenvironment 1 301 having applications A, B, through N andenvironment 2 302 having applications AA, BB through NN.FIG. 3 includes a plurality of monitoring environments and/or user interfaces that may include one or more monitoring dashboards 303-305. The monitoring dashboards 303-305 may have been created using one or more monitoring tools 1-3 306-308. In a first example of a monitoring dashboard,dashboard 303 is configured to receive data streams A1, A2, and AX from application A inenvironment 1 301. For a developer to createdashboard 303, the developer needs to know specific information regarding application A as well as information aboutenvironment 1 301. That specific information may include one or more of the items identified asapplication information 309 including a specific application identifier, a specific production environment identifier, a specific license key or keys, and specific names of data fields. It is appreciated that additional items or fewer items inapplication information 309 may be required to obtain information from application A inenvironment 1 301. In a typical example, a given application may require 18 or more different license keys based on a team's cloud accounts, production/non-production environments, and language combinations (e.g., JAVA, Go, Ruby, Python, Node.js) of possible agents. Further, hours may be spent learning each monitoring tool 306-308 and the quantity of monitoring tools to learn, in a given monitoring environment, may be seven or more. - In another example, a
dashboard 304 is configured to receive data streams A1, A2, and AX from application A and data stream N1 from application N inenvironment 1 301 and data stream AA1 from application AA inenvironment 2 302. Similar to the creation ofdashboard 303, a developer needs to know specific information regarding application A, application N, and application AA that may include the items identified asapplication information 309 including a specific application identifier, a specific production environment identifier, specific license key or keys, and specific names of data fields. While the generation ofdashboard 303 only required information relevant to application A andenvironment 1 301, the generation ofdashboard 304 is increasingly complex as requiring, not only specific information regarding application A but also information regarding application N and information regarding application AA as well as specific information regarding each ofenvironment 1 301 andenvironment 2 302. -
FIG. 3 provides further example in which anagent Q 310 monitors application AA and provides information regarding the operation of application AA to amonitoring dashboard 305. As shown inFIG. 3 ,agent Q 310 is shown as installed in theenvironment 2 302. If installed in theenvironment 2 302, theagent Q 310 may directly monitor the operations of application AA. Being installed in theenvironment 2 302 may permitagent Q 310 to read data received by application AA and/or read data generated by application AA. Additionally or alternatively,agent Q 310 or another instance ofagent Q 310 may reside separate fromenvironment 2 302 (e.g., in a separate server). For instance, if residing separate fromenvironment 2 302, theagent Q 310 may send application programming interface (API) calls to the application AA and, in response, receive one or more data streams relating to the operation of application AA. - Information from
agent Q 310 may be provided tomonitoring dashboard 305. To configuremonitoring dashboard 305, usingagent Q 310, a developer may need to know agent information 311 aboutagent Q 310 including an agent identification and agent data fields. - As shown in
FIG. 3 , theagent Q 310 receives data streams AA1, AA2, through AAX, from application AA ofenvironment 2 302.Agent Q 310 wraps those data streams in its own identifiers and exposes the wrapped data streams to be accessed bymonitoring dashboard 305 as data streams Q1, Q2, through QX. Alternatively or additionally,agent Q 310 may reformulate the incoming data streams into its own data streams. By usingagent Q 310 as an intermediary, the developer is isolated from learning and re-learning the nuances of application AA and the nuances ofenvironment 2 302. Rather, the developer is able to use the exposed interfaces ofagent Q 310 to obtain relevant data streams from application AA. -
FIG. 4 depicts a user interface configured to receive selections for configuration of an agent. To configure an agent to be installed in an environment (or otherwise interact with an application in that environment), a developer may be presented with a user interface populated with information regarding available applications and environments. As shown inFIG. 4 , information regarding applications, environments, and related information may be provided asapplication data 401.Application data 401 may take the form of various computer readable information including one or more tables and/or one or more records stored in one or more databases to further the concepts as disclosed herein. -
Application data 401, for example, may comprise rows and/or records identifying application names, application identifications associated with the application names, accounts associated with the applications, production environment information (e.g., production environments, nonproduction environments, and/or other environments), license keys associated with the applications in the accounts and the specific environments, and/or information describing operating systems in which the application executes. Additionally or alternatively, additional fields and/or fewer fields may be used in an implementation as described herein without detracting from the scope of the concepts. -
Agent templates 402 may be provided in one or more computer readable information forms (e.g., one or more tables and/or one or more records in one or more databases).Agent templates 402 may comprise templates for the creation of agents for installation in environments to monitor applications and/or to remotely monitor those applications. As shown inFIG. 4 , the agents are grouped into configurations of agents specific to an operating system of a particular environment in which an application exists. Alternatively or additionally, agent templates may be generic to operating system environments as the agents may run in virtual machines in the environments. For instance, the agent templates may be deployed in containers that run on virtual machines in each environment. For example, the agents may be provided in containers that may be "dockerized" (e.g., via dockerizing a Node.js application to be executable on various platforms in accordance with extensible services provided by Docker Inc. at www.docker.com). -
Agent templates 402, as shown inFIG. 4 , may support various operating system environments by separate agent types being created for each operating system. For instance, the agent types may compriseLinux agent types 403, Ubuntu agent types 404,UNIX agent types 405, Windows Server agent types 406, and/or other agent types. It is appreciated that additional agent types or fewer agent types may be made available based on the types of operating systems in the environments of the applications. The agent types 403-406 may comprise templates for agents in various programming languages, e.g., Java, Python, .NET, Go, PHP, Ruby, Node.js, and the like. It is appreciated that agents in additional or fewer programming languages may be made available as programming languages increase and decrease in popularity or familiarity. Further, types of each language may be included as well - e.g., for instance, for Linux, Amazon Web Service's version of Linux and Rhel's version of Linux may be included; for Ubuntu, Zenial's version of Ubuntu and other versions may be included. -
FIG. 4 may include auser interface 407 that may comprise a variety of regions for accepting user input. The regions may comprise anapplication name region 408, anapplication ID region 409, anaccount name region 410, aproduction environment region 411, a license key orkeys region 412, an operatingsystem environment region 413, and anagent type region 414. One or more of the regions 408-414 may accept user input. Based on that input, a processor may compare that input with matching selections fromapplication data 401 to obtain a filtered set of other options for display in the remaining user interface regions 408-414. For example, a developer may enter an application name inregion 408. Based on that entry, a processor may retrieve data fromapplication data 401 related the entered application name. The remaining user interface regions 409-414 may be populated with selectable content related to the retrieved fields fromapplication data 401. The process may be repeated based on repeated selections of the selectable content from the various user interfaces 409-414. Additionally or alternatively, if there is only one option available for a region based on a previous selection, then the region may be populated with that sole value. For instance, if a developer enters "App A" for the application name inregion 408, theapplication ID region 409 may be populated with the application ID "A ID" corresponding to the matching application ID for the "App A" application name inapplication data 401. Additionally or alternatively, theuser interface 407 may be configured to require two or more data fields to be entered prior to looking up the relevant information fromapplication data 401. - In addition to providing information/selections in regions 408-413 that relate to information corresponding to data from
application data 401, the developer may select, inregion 414, a language in which an agent is to be written based on the available agent types inagent templates 402. For instance, if the operating system environment was "Unix",region 414 may be populated with the software languages associated with agent templates listed in theUNIX agent types 405 in theagent templates 402 dataset. Additionally or alternatively, the list of agent types inagent templates 402 may be simply the list of agent templates by software language (e.g., Java, Python, etc.) and not operating system-specific lists as shown inFIG. 4 . Based on the information provided by and/or selected by a developer in regions 408-414 of the agentconfiguration user interface 407, a processor may use the information and the relevant agent template fromagent templates 402 to generateagent_A 420. Next,agent_A 420 may be installed inenvironment 1 421 to monitor the operations ofapplication A 422. For purposes of illustration,agent A 420 is shown asagent A 423 in broken lines inenvironment 1 421 and attached toapplication A 422. - The
agent_A 420 may monitor the operations ofapplication A 422 in a variety of ways. For instance, theagent A 420 may actively compile information regarding the operation ofapplication A 422. In response to an API request, theagent A 420 may forward the compiled information. Additionally or alternatively, theagent A 420 may passively provide access to the operations ofapplication A 422. In response to an API request, theagent A 420 may provide information relating to the current operation of theapplication A 422. - Whether actively compiling and providing information and/or passively providing information, the
agent A 420 may provide the information in a computer-readable form. For instance, theagent A 420 may provide the information in JSON and/or in XML formats. Theagent_A 420 may be accessible as a resource (e.g., in a representational state transfer (REST) environment) and/or as a service (e.g., in a simple object access protocol (SOAP) environment) (also referred to as a Web service). The information provided by theagent A 420 may be raw information regarding the operation of theapplication A 422, compiled metrics (e.g., statistics, rates of events, etc.), combinations thereof, and/or other information regarding the operation ofapplication A 422. -
FIG. 5 depicts a user interface configured to receive selections for configuration of a monitoring dashboard.FIG. 5 includes adataset 501 that may include a variety of data relating an application name to an application ID, an account name, and/or an agent identification (also referred to as "agent ID").FIG. 5 also includes auser interface 502 provided to a developer by which the developer may specify information relating to the dashboard and what the dashboard is intended to display leading to a given application.FIG. 5 may further comprise datasets 509-510 relating to information available from agents relating to transaction metrics (as transaction metrics dataset 509) and browser metrics (as browser metrics dataset 510). - A developer may receive a dashboard
configuration user interface 502 from a processor. The dashboardconfiguration user interface 502 may comprise regions for receiving user selections/identifications of information pertinent to the generation of a monitoring dashboard. For instance, the dashboardconfiguration user interface 502 may comprise adashboard name region 503, anaccount name region 504, anapplication name region 505, a monitoringtool selection region 506, a transactionmetrics selection region 507, and/or a browsermetrics selection region 508. A developer may enter a dashboard name inregion 503 and enter an account name inregion 504. The processor may receive the information from the developer, retrieve information relevant to the entered account name, and provide, for selection, available applications in the account. Additionally or alternatively, the developer may enter an application name and the processor modify theuser interface 502 to reflect selectable account names available fromdataset 501. Based on the developer's selections in theuser interface 502, the processor may obtain, fromdataset 501, the relevant agent for that application relating to the relevant account. - The user may select, via monitoring
tool selection region 506, a monitoring tool from the list of monitoring tools 1-3 511-513, for instance. Additional or fewer monitoring tools may be made available for selection. Examples of monitoring tools 1-3 511-513 that support various monitoring of applications (e.g., via processing received payloads into useable information for display on a dashboard) may include the ELK Kibana dashboards from Elasticsearch B.V. (providing data in a JSON and Lucerne formats) and the Splunk dashboards from Splunk Inc. (providing data in an XML format). Splunk and ELK Kibana are examples of log ingestion monitoring tools. Zabbix from Zabbix LLC, Amazon Web Services (AWS) Cloudwatch from Amazon Web Services, Inc., Datadog NK from Datadog, Inc. are examples of infrastructure monitoring tools. DataDog from DataDog, Inc., Gomez from Dynatrace, LLC., Apica from Apica AB, New Relic and New Relic One from New Relic Inc. are examples of application performance monitoring (APM) tools. Solarwinds and/or Centos from SolarWinds Worldwide, LLC. and Site 24/7 of Zoho Corp. are examples of network monitoring tools. Additional or fewer monitoring tools may be made available for selection as desired. - Based on the retrieved agent information and the monitoring tool selected in
region 506, theuser interface 502 may be modified to provide a list of selectable metrics. For example,monitoring tool 1 511 may provide both transaction metrics and browser metrics. It is appreciated that the types of metrics and related selection regions is related to those metrics provided by the monitoring tool or monitoring tools used to create - The user may select one or more metrics as desired for incorporation into a dashboard. In the example of
FIG. 5 , the selectable metrics provided inregion 507 may be obtained from thetransaction metrics data 509 relating to those transaction metrics provided by the selected agent agent_A1. The selectable metrics provided inregion 508 may be obtained from thebrowser metrics data 510 relating to those browser metrics provided by the selected agent agent_A1. The transaction metrics available through the selected agent may be found indataset 508 that relates available agents to available transaction metrics for thatmonitoring tool 1 508. The browser metrics available through the selected agent may be found indataset 509 that relates available agents to available transaction metrics for thatmonitoring tool 1 508. - Based on the developer's selections in
user interface 502, a monitoring dashboard may be created, e.g., via one or more processors, conforming to the developer's selections. For instance, the selected metrics may be associated with software code that specifies one or more graphical and/or textual outputs for received information. The selected metrics may be instantiated in amonitoring environment 514 that displays metrics on a dashboard based on information from the selected agent. For example, based on the user selections made in dashboardconfiguration user interface 502, a processor may generate a combination of API call templates and adashboard 520. The API call templates may be instantiated as API calls 518 toagent_A1 515.Agent_A1 515 receives information aboutapplication A 516 and, based on received API calls 518,agent_A1 515 sends, as payloads in theAPI responses 519, the information requested. For reference, bothagent Al 515 and application A 516 are shown as executing inenvironment 1 517. The payloads are receive inmonitoring environment 514 and processed for display in thedashboard 520. For instance, software code to generate a graphical representation of an error count over time may comprise software code that sends, to the specific agent monitoring an application and via an API call, a request for a data stream relating to errors and when those errors occurred. - For instance, the selectable transaction metrics dataset 508 may relate agent IDs to various transaction metrics, where each of the selectable transaction metrics identifies an API call to that specific agent for that metric. The list of transaction metrics may comprise a variety of metrics, e.g., throughput metrics, top five slow performing transaction metrics, response time statistics metrics, average response time by transaction type metrics, HTTP response code metrics, top error transaction metrics, 4XX error rate metrics (e.g., three digit HTTP error codes starting with "4"), 5XX error rate metrics (e.g., three digit HTTP error codes starting with "5"), recent errors metrics, error count metrics, and transaction count comparison metrics. The selectable browser metrics dataset 510 may comprise a variety of metrics, e.g., unique sessions metrics, page views based on device type metrics, sessions count by platform metrics, unique sessions one-week comparison metrics, average page rendering duration metrics, sessions by device type metrics, average DOM (document object model) processing duration metrics, most popular pages metrics, and average page views per session metrics. It is appreciated that the number and type of selectable metrics is related to the selected monitoring tool 1-3 511-513 and the metric obtainable by the agent installed in the environment to monitor the application.
-
FIG. 5 may also include various types of alerts that may be associated with or independent from the generation of thedashboard 520. Similar to dashboarding, alerting may vary in complexity based on the available monitoring tools. For example, three types of alerts may be used. For reference, the alerts may be described as tier 0 alerts,tier 1 alerts, andtier 2 alerts. Tier 0 alerts may include alerts of the highest priority. When triggered, the application, network, and/or storage is in peril and the overall system is shut down until resolved.Tier 1 alerts may include alerts identifying a service degradation has been detected and one or more components need attention.Tier 2 alerts may include alerts that are still critical but redundancies for those components exist and are being temporarily used until the issue has been resolved. A greater or fewer quantity of alerts may be used as desired. Using the arrangement ofFIG. 5 , a monitoring tool may create and mute alerts descriptions based on the same process as selecting and creating themonitoring dashboard 520. The software developers and/or management teams may modify themonitoring environment 514 to customize when alerts are triggered and/or the information displayed ondashboard 520. -
FIG. 6 depicts an example of a monitoring dashboard. Amonitoring dashboard 601 may compriseinformation 602 relating to a dashboard name and/or account name and/or production environment. Graphical and/or textual regions may be generated to reflect metrics from a selected application with information received via a relevant agent. The regions may comprise, for instance, athroughput region 603, HTTPresponse codes region 604, top five slowperforming transactions region 605, responsetime statistics region 606, average response time bytransaction type region 607, and toperror transactions region 608. Themonitoring dashboard 601 may be modified to include a greater number of or fewer metrics as desired and as relating to the selected monitoring tool 1-3 511-513. -
FIG. 7 depicts an example of a process for creating an agent to monitor an application. Instep 701, a dataset for deployed applications is received. Instep 702, a user interface with selectable applications is generated for developer. Instep 703, the user interface receives the developer's selection of the deployed application. Instep 704, the system determines available environment identifiers/license keys for the deployed application. Instep 705, a processor generates a user interface or updates the existing user interface with available environment identifiers/license keys/software languages relevant to the deployed application. Instep 706, the user interface receives selections of the environment identifiers/lesions keys/software language for an agent. Instep 707, a processor retrieves a software agent template based on one or more of the received selections from the developer. Instep 708, a software agent is generated based on one or more of the selections. Instep 709, the processor may cause installation of the software agent in the environment to monitor the relevant application (or cause the agent to remotely monitor the relevant application). Instep 710, APIs exposed by the software agent may be accessible by one or more monitoring applications (e.g., one or more monitoring dashboards). -
FIG. 8 depicts an example of a process for creating a dashboard using information from the agent to monitor the deployed application. Instep 801, one or more datasets for deployed applications and/or agents are received. Instep 802, a user interface is generated in which the user interface contains selectable applications and/or available agents. Instep 803, a processor receives a developer's selections made via the user interface fromstep 802. Instep 804, a processor determines one or more relevant application and/or agents based on the selections fromstep 803. Instep 805, the processor generates (and/or updates) a user interface with available transaction metrics/browser metrics relating to metrics available via the agent. Instep 806, a processor receives the developer's selections made via the interface generated instep 805. Using the selected metrics, a dashboard is generated instep 807. Instep 808, API calls to the specific agent/agents are generated. Instep 809, information relating to the selected metrics are processed and displayed as updates to the dashboard. - Based on the above, a computer-implemented process may comprise receiving a dataset for deployed applications, wherein the dataset comprises application identifiers, production environment identifiers, and license keys, wherein the license keys are associated with combinations of the application identifiers and production environment identifiers. The method may further comprise generating a first user interface comprising a plurality of regions. The regions may comprise a first region configured to receive an application name associated with a deployed application of the deployed applications, a second region configured to receive a selection of production environment identifiers, a third region configured to receive a selection of license keys, and a fourth region configured to receive a language identification of a computer-readable language in which the deployed application was written. The method may further comprise receiving, via the first region, the application name; determining, from the dataset, an application identifier from the application identifiers corresponding to the application name; based on the application identifier, determining application identifier-specific production environment identifiers and application identifier-specific license keys associated with respective application identifier-specific production environment identifiers; modifying the first user interface to provide a list, in the second region, of the determined application identifier-specific production environment identifiers and to provide a list, in the third region, of the determined application identifier-specific license keys; and receiving, via the modified first user interface, a selected environment identifier via the second region, a selected license key via the third region, and the language identification via the fourth region. Based on the application identifier, the selected environment identifier, the selected license key, and the language identification, generating a software agent configured to facilitate monitoring the deployed application, wherein the software agent is configured to expose operations of the deployed application to be addressable, via an application programming interface (API), as metrics. The method may further comprise generating, based on the generated software agent and the metrics made available via the generated software agent, a second user interface comprising a sixth region configured to receive the application identifier and a seventh region configured to receive a selection of the metrics; and based on the application identifier received in the sixth region and the selection of one or more of the metrics, cause a monitoring application to monitor the selected service via the API.
- Further, in some aspects, the monitoring application may comprise a dashboard user interface comprising graphical representations of operations of the metrics. The method may further comprise receiving an operating system identification. The software agent may be generated based on the language identification associated with the deployed application and based on the operating system identification and retrieving a software agent template configured to monitor where the template is written to be used in the identified operating system. The agent may be generated based on the software agent template, the application name, the selected environment identifier, and the selected license key. The software agent may be generated contact information received via the first user interface.
- The metrics may comprise one or more metrics that may include response-related statistics such as throughput statistics; response time statistics; slow performing transaction statistics; average response times per transaction type statistics; transaction count comparison statistics; or a combination of one or more of the throughput statistics, response time statistics, the slow performing transaction statistics, the average response times per transaction type statistics, and the transaction count comparison statistics. Additionally or alternatively, the metrics may comprise metrics that include error-related statistics comprising error code statistics; recent error code statistics; error codes by code type statistics; error counts statistics; or a combination of one or more of the error code statistics, the recent error code statistics, the error codes by error code type statistics, and the error counts statistics. The metrics may further comprise access-related statistics comprising unique session statistics; page views based on device type statistics; session counts per platform statistics; unique sessions per time window statistics; average page rendering duration statistics; sessions by device type statistics; average document object model (DOM) processing duration statistics; page popularity statistics; average page views per session statistics; or a combination of one or more of the unique session statistics, the page views based on device type statistics, the session counts per platform statistics, the unique sessions per time window statistics, the average page rendering duration statistics, the sessions by device type statistics, the average document object model (DOM) processing duration statistics, the page popularity statistics, and the average page views per session statistics.
- The method may further comprise receiving, for the deployed application, a deployment environment identification identifying the deployment environment as a production environment or a non-production environment and the agent is based on the received deployment environment identification. The software agent may be deployed to monitor the deployed application. The user interfaces may be modified based on selections made in the user interface, e.g., to include additional regions and/or metrics. The method may further comprise receiving an operating system identification associated with an operating system of the deployed application; and receiving operating system-specific instructions for generating the software agent. The generation of the software agent may be based on the received operating system-specific instructions.
- The apparatus may comprise one or more processors with instructions that cause the processors to receive a dataset for deployed applications, where the dataset may comprise application identifiers, production environment identifiers, and license keys. The license keys may be associated with combinations of the application identifiers and production environment identifiers. The instructions may further cause the apparatus to generate, based on the received dataset, a first user interface comprising a first region configured to receive an application name associated with a deployed application of the deployed applications, a second region configured to receive a selection of production environment identifiers, a third region configured to receive a selection of license keys, a fourth region configured to receive a language identification of a computer-readable language in which the deployed application was written, and a fifth region configured to receive an operating system identification identifying an operating system in which the deployed application executes.
- The instructions may cause the apparatus to receive, via the first region, the application name; determine, from the dataset, an application identifier from the application identifiers corresponding to the application name; based on the application identifier, determine application identifier-specific production environment identifiers and application identifier-specific license keys associated with respective application identifier-specific production environment identifiers; and modify the first user interface to provide a list, in the second region, of the determined application identifier-specific production environment identifiers and to provide a list, in the third region, of the determined application identifier-specific license keys. The instructions may further cause the apparatus to receive, via the modified first user interface, a selected environment identifier via the second region, a selected license key via the third region, the language identification via the fourth region, and the operating system identification via the fifth region and, based on the application identifier, the selected environment identifier, the selected license key, the language identification, and the operating system identification, generate a software agent configured to facilitate monitoring the deployed application. The software agent may be configured to expose operations of the deployed application to be addressable, via an application programming interface (API), as metrics.
- The instructions may further cause the apparatus to generate, based on the generated software agent and the metrics made available via the generated software agent, a second user interface comprising a sixth region configured to receive the application identifier and a seventh region configured to receive a selection of the metrics and, based on the application identifier received in the sixth region and the selection of one or more of the metrics, cause a monitoring application to monitor the selected service via the API.
- In some examples, the generated second user interface is a dashboard comprising graphical representations of operations of the metrics. In some examples, the metrics may comprise throughput statistics; response time statistics; slow performing transaction statistics; average response times per transaction type statistics; transaction count comparison statistics; or a combination of one or more of the throughput statistics, response time statistics, the slow performing transaction statistics, the average response times per transaction type statistics, and the transaction count comparison statistics. In additional or alternative examples, the metrics comprise error code statistics; recent error code statistics; error codes by code type statistics; error counts statistics; or a combination of one or more of the error code statistics, the recent error code statistics, the error codes by error code type statistics, and the error counts statistics. In additional or alternative examples, the metrics comprise unique session statistics; page views based on device type statistics; session counts per platform statistics; unique sessions per time window statistics; average page rendering duration statistics; sessions by device type statistics; average document object model (DOM) processing duration statistics; page popularity statistics; average page views per session statistics; or a combination of one or more of the unique session statistics, the page views based on device type statistics, the session counts per platform statistics, the unique sessions per time window statistics, the average page rendering duration statistics, the sessions by device type statistics, the average document object model (DOM) processing duration statistics, the page popularity statistics, and the average page views per session statistics.
- The instructions may further cause the apparatus to receive, for the deployed application, a deployment environment identification identifying the deployment environment as a production environment or a non-production environment, wherein generation of the software agent is further based on the received deployment environment identification.
- Implementations of the described techniques may include hardware, a method or process, or computer software on a computer-accessible medium.
- Other implementations of this aspect include corresponding computer systems, apparatus, and computer programs recorded on one or more computer storage devices, each configured to perform the actions of the methods.
- A non-transitory media may store instructions that, when executed by a processor, cause the processor to perform functions comprising receiving a dataset for deployed applications, wherein the dataset comprises application identifiers, production environment identifiers, and license keys, wherein the license keys are associated with combinations of the application identifiers and production environment identifiers. The instructions may further cause the processor to perform functions including generating, based on the received dataset, a first user interface comprising a plurality of regions. The first user interface may comprise a first region configured to receive an application name associated with a deployed application of the deployed applications, a second region configured to receive a selection of production environment identifiers, a third region configured to receive a selection of license keys, and a fourth region configured to receive a language identification of a computer-readable language in which the deployed application was written. The instructions may further cause the processor to perform functions including receiving, via the first region, the application name; determining, from the dataset, an application identifier from the application identifiers corresponding to the application name; based on the application identifier, determining application identifier-specific production environment identifiers and application identifier-specific license keys associated with respective application identifier-specific production environment identifiers; modifying the first user interface to provide a list, in the second region, of the determined application identifier-specific production environment identifiers and to provide a list, in the third region, of the determined application identifier-specific license keys; and receiving, via the modified first user interface, a selected environment identifier via the second region, a selected license key via the third region, and the language identification via the fourth region. Based on the application identifier, the selected environment identifier, the selected license key, and the language identification, the instructions may further cause the processor to perform functions including generating a software agent configured to facilitate monitoring the deployed application, wherein the software agent is configured to expose operations of the deployed application to be addressable, via an application programming interface (API), as metrics; generating, based on the generated software agent and the metrics made available via the generated software agent, a second user interface comprising a sixth region configured to receive the application identifier and a seventh region configured to receive a selection of the metrics; and based on the application identifier received in the sixth region and the selection of one or more of the metrics, cause a monitoring application to monitor the selected service via the API. In one or more examples, the generated second user interface may include a dashboard comprising graphical representations of operations of the metrics. Other embodiments of this aspect include corresponding computer systems, apparatus, and computer programs recorded on one or more computer storage devices, each configured to perform the actions of the methods.
- The following numbered items are also disclosed herein.
- 1. A computer-implemented method comprising:
- receiving a dataset for deployed applications, wherein the dataset comprises application identifiers, production environment identifiers, and license keys, wherein the license keys are associated with combinations of the application identifiers and production environment identifiers;
- generating, based on the received dataset, a first user interface comprising a plurality of regions comprising:
- a first region configured to receive an application name associated with a deployed application of the deployed applications,
- a second region configured to receive a selection of production environment identifiers,
- a third region configured to receive a selection of license keys, and
- a fourth region configured to receive a language identification of a computer-readable language in which the deployed application was written; and
- receiving, via the first region, the application name;
- determining, from the dataset, an application identifier from the application identifiers corresponding to the application name;
- based on the application identifier, determining application identifier-specific production environment identifiers and application identifier-specific license keys associated with respective application identifier-specific production environment identifiers;
- modifying the first user interface to provide a list, in the second region, of the determined application identifier-specific production environment identifiers and to provide a list, in the third region, of the determined application identifier-specific license keys;
- receiving, via the modified first user interface, a selected environment identifier via the second region, a selected license key via the third region, and the language identification via the fourth region;
- based on the application identifier, the selected environment identifier, the selected license key, and the language identification, generating a software agent configured to expose operations of the deployed application to be addressable, via an application programming interface (API), as metrics;
- generating, based on the generated software agent and the metrics made available via the generated software agent, a second user interface comprising a sixth region configured to receive the application identifier and a seventh region configured to receive a selection of the metrics; and
- based on the application identifier received in the sixth region and the selection of one or more of the metrics, cause a monitoring application to monitor the selected service via the API.
- 2. The computer-implemented method of
item 1,
wherein the monitoring application comprises a dashboard user interface comprising graphical representations of operations of the metrics. - 3. The computer-implemented method of
item 1, further comprising:- receiving an operating system identification,
- wherein generating the software agent comprises:
- based on the language identification associated with the deployed application and based on the operating system identification, retrieving a software agent template configured to monitor, in the identified operating system, the deployed application written in the identified language; and
- based on the software agent template, the application name, the selected environment identifier, and the selected license key, generating the software agent.
- 4. The computer-implemented method of
item 3, wherein generating the software agent is further based on contact information received via the first user interface. - 5. The computer-implemented method of
item 1,
wherein the metrics comprise one or more of:- throughput statistics;
- response time statistics;
- slow performing transaction statistics;
- average response times per transaction type statistics;
- transaction count comparison statistics; or
- a combination of one or more of the throughput statistics, response time statistics, the slow performing transaction statistics, the average response times per transaction type statistics, or the transaction count comparison statistics.
- 6. The computer-implemented method of
item 1,
wherein the metrics comprise one or more of:- error code statistics;
- recent error code statistics;
- error codes by code type statistics;
- error counts statistics; or
- a combination of one or more of the error code statistics, the recent error code statistics, the error codes by error code type statistics, or the error counts statistics.
- 7. The computer-implemented method of
item 1,
wherein the metrics comprise one or more of:- unique session statistics;
- page views based on device type statistics;
- session counts per platform statistics;
- unique sessions per time window statistics;
- average page rendering duration statistics;
- sessions by device type statistics;
- average document object model (DOM) processing duration statistics;
- page popularity statistics;
- average page views per session statistics; or
- a combination of one or more of the unique session statistics, the page views based on device type statistics, the session counts per platform statistics, the unique sessions per time window statistics, the average page rendering duration statistics, the sessions by device type statistics, the average document object model (DOM) processing duration statistics, the page popularity statistics, or the average page views per session statistics.
- 8. The method of
item 1, further comprising:- receiving, for the deployed application, a deployment environment identification identifying the deployment environment as a production environment or a non-production environment,
- wherein generating the software agent is further based on the received deployment environment identification.
- 9. The method of
item 1, further comprising:
deploying the software agent to monitor the deployed application. - 10. The method of
item 1, further comprising:- receiving user modifications to the second user interface; and
- generating, based on the user modifications, a modified second user interface.
- 11. The method of item 10,
wherein the modified second user interface comprises additional regions. - 12. The method of item 10,
wherein the modified second user interface comprises additional metrics. - 13. The method of
item 1, further comprising:- receiving an operating system identification associated with an operating system of the deployed application; and
- receiving operating system-specific instructions for generating the software agent,
- wherein generating the software agent is further based on the received operating system-specific instructions.
- 14. An apparatus comprising:
- one or more processors; and
- memory storing instructions that, when executed by the one or more processors, cause the apparatus to:
- receive a dataset for deployed applications, wherein the dataset comprises application identifiers, production environment identifiers, and license keys, wherein the license keys are associated with combinations of the application identifiers and production environment identifiers;
- generate, based on the received dataset, a first user interface comprising a plurality of regions comprising:
- a first region configured to receive an application name associated with a deployed application of the deployed applications,
- a second region configured to receive a selection of production environment identifiers,
- a third region configured to receive a selection of license keys,
- a fourth region configured to receive a language identification of a computer-readable language in which the deployed application was written, and
- a fifth region configured to receive an operating system identification identifying an operating system in which the deployed application executes; and
- receive, via the first region, the application name;
- determine, from the dataset, an application identifier from the application identifiers corresponding to the application name;
- based on the application identifier, determine application identifier-specific production environment identifiers and application identifier-specific license keys associated with respective application identifier-specific production environment identifiers;
- modify the first user interface to provide a list, in the second region, of the determined application identifier-specific environment identifiers and to provide a list, in the third region, of the determined application identifier-specific license keys;
- receive, via the modified first user interface, a selected environment identifier via the second region, a selected license key via the third region, the language identification via the fourth region, and the operating system identification via the fifth region;
- based on the application identifier, the selected environment identifier, the selected license key, the language identification, and the operating system identification, generate a software agent configured to facilitate monitoring the deployed application, wherein the software agent is configured to expose operations of the deployed application to be addressable, via an application programming interface (API), as metrics;
- generate, based on the generated software agent and the metrics made available via the generated software agent, a second user interface comprising a sixth region configured to receive the application identifier and a seventh region configured to receive a selection of the metrics; and
- based on the application identifier received in the sixth region and the selection of one or more of the metrics, cause a monitoring application to monitor the selected service via the API.
- 15. The apparatus of item 14,
wherein the generated second user interface is a dashboard comprising graphical representations of operations of the metrics. - 16. The apparatus of item 14,
wherein the metrics comprise one or more of:- throughput statistics;
- response time statistics;
- slow performing transaction statistics;
- average response times per transaction type statistics;
- transaction count comparison statistics; or
- a combination of one or more of the throughput statistics, response time statistics, the slow performing transaction statistics, the average response times per transaction type statistics, or the transaction count comparison statistics.
- 17. The apparatus of item 14,
wherein the metrics comprise one or more of:- error code statistics;
- recent error code statistics;
- error codes by code type statistics;
- error counts statistics; or
- a combination of one or more of the error code statistics, the recent error code statistics, the error codes by error code type statistics, or the error counts statistics.
- 18. The apparatus of item 14,
wherein the metrics comprise one or more of:- unique session statistics;
- page views based on device type statistics;
- session counts per platform statistics;
- unique sessions per time window statistics;
- average page rendering duration statistics;
- sessions by device type statistics;
- average document object model (DOM) processing duration statistics;
- page popularity statistics;
- average page views per session statistics; or
- a combination of one or more of the unique session statistics, the page views based on device type statistics, the session counts per platform statistics, the unique sessions per time window statistics, the average page rendering duration statistics, the sessions by device type statistics, the average document object model (DOM) processing duration statistics, the page popularity statistics, or the average page views per session statistics.
- 19. The apparatus of item 14, wherein the instructions further cause the apparatus to:
- receive, for the deployed application, a deployment environment identification identifying the deployment environment as a production environment or a non-production environment,
- wherein generation of the software agent is further based on the received deployment environment identification.
- 20. One or more media storing instructions that, when executed by one or more processors, cause the one or more processors to perform steps comprising:
- receiving a dataset for deployed applications, wherein the dataset comprises application identifiers, production environment identifiers, and license keys, wherein the license keys are associated with combinations of the application identifiers and production environment identifiers;
- generating, based on the received dataset, a first user interface comprising a plurality of regions comprising:
- a first region configured to receive an application name associated with a deployed application of the deployed applications,
- a second region configured to receive a selection of production environment identifiers,
- a third region configured to receive a selection of license keys, and
- a fourth region configured to receive a language identification of a computer-readable language in which the deployed application was written; and
- receiving, via the first region, the application name;
- determining, from the dataset, an application identifier from the application identifiers corresponding to the application name;
- based on the application identifier, determining application identifier-specific production environment identifiers and application identifier-specific license keys associated with respective application identifier-specific production environment identifiers;
- modifying the first user interface to provide a list, in the second region, of the application identifier-specific environment identifiers and to provide a list, in the third region, of the determined application identifier-specific license keys;
- receiving, via the modified first user interface, a selected environment identifier via the second region, a selected license key via the third region, and the language identification via the fourth region;
- based on the application identifier, the selected environment identifier, the selected license key, and the language identification, generating a software agent configured to facilitate monitoring the deployed application, wherein the software agent is configured to expose operations of the deployed application to be addressable, via an application programming interface (API), as metrics;
- generating, based on the generated software agent and the metrics made available via the generated software agent, a second user interface comprising a sixth region configured to receive the application identifier and a seventh region configured to receive a selection of the metrics; and
- based on the application identifier received in the sixth region and the selection of one or more of the metrics, cause a monitoring application to monitor the selected service via the API,
- wherein the generated second user interface is a dashboard comprising graphical representations of operations of the metrics.
- Although the subject matter has been described in language specific to structural features and/or methodological acts, it is to be understood that the subject matter defined in the appended claims is not necessarily limited to the specific features or acts described above. Rather, the specific features and acts described above are disclosed as example forms of implementing the claims.
Claims (15)
- A computer-implemented method comprising:receiving a dataset for deployed applications, wherein the dataset comprises application identifiers, production environment identifiers, and license keys, wherein the license keys are associated with combinations of the application identifiers and production environment identifiers;generating, based on the received dataset, a first user interface comprising a plurality of regions comprising:a first region configured to receive an application name associated with a deployed application of the deployed applications,a second region configured to receive a selection of production environment identifiers,a third region configured to receive a selection of license keys, anda fourth region configured to receive a language identification of a computer-readable language in which the deployed application was written; andreceiving, via the first region, the application name;determining, from the dataset, an application identifier from the application identifiers corresponding to the application name;based on the application identifier, determining application identifier-specific production environment identifiers and application identifier-specific license keys associated with respective application identifier-specific production environment identifiers;modifying the first user interface to provide a list, in the second region, of the determined application identifier-specific production environment identifiers and to provide a list, in the third region, of the determined application identifier-specific license keys;receiving, via the modified first user interface, a selected environment identifier via the second region, a selected license key via the third region, and the language identification via the fourth region;based on the application identifier, the selected environment identifier, the selected license key, and the language identification, generating a software agent configured to expose operations of the deployed application to be addressable, via an application programming interface (API), as metrics;generating, based on the generated software agent and the metrics made available via the generated software agent, a second user interface comprising a sixth region configured to receive the application identifier and a seventh region configured to receive a selection of the metrics; andbased on the application identifier received in the sixth region and the selection of one or more of the metrics, cause a monitoring application to monitor the selected service via the API.
- The computer-implemented method of claim 1,
wherein the monitoring application comprises a dashboard user interface comprising graphical representations of operations of the metrics. - The computer-implemented method of any preceding claim, further comprising:receiving an operating system identification,wherein generating the software agent comprises:based on the language identification associated with the deployed application and based on the operating system identification, retrieving a software agent template configured to monitor, in the identified operating system, the deployed application written in the identified language; andbased on the software agent template, the application name, the selected environment identifier, and the selected license key, generating the software agent.
- The computer-implemented method of claim 3, wherein generating the software agent is further based on contact information received via the first user interface.
- The computer-implemented method of any preceding claim,
wherein the metrics comprise one or more of:throughput statistics;response time statistics;slow performing transaction statistics;average response times per transaction type statistics;transaction count comparison statistics; ora combination of one or more of the throughput statistics, response time statistics, the slow performing transaction statistics, the average response times per transaction type statistics, or the transaction count comparison statistics. - The computer-implemented method of any preceding claim,
wherein the metrics comprise one or more of:error code statistics;recent error code statistics;error codes by code type statistics;error counts statistics; ora combination of one or more of the error code statistics, the recent error code statistics, the error codes by error code type statistics, or the error counts statistics. - The computer-implemented method of any preceding claim, wherein the metrics comprise one or more of:unique session statistics;page views based on device type statistics;session counts per platform statistics;unique sessions per time window statistics;average page rendering duration statistics;sessions by device type statistics;average document object model (DOM) processing duration statistics;page popularity statistics;average page views per session statistics; ora combination of one or more of the unique session statistics, the page views based on device type statistics, the session counts per platform statistics, the unique sessions per time window statistics, the average page rendering duration statistics, the sessions by device type statistics, the average document object model (DOM) processing duration statistics, the page popularity statistics, or the average page views per session statistics.
- The computer-implemented method of any preceding claim, further comprising:receiving, for the deployed application, a deployment environment identification identifying the deployment environment as a production environment or a non-production environment,wherein generating the software agent is further based on the received deployment environment identification.
- The computer-implemented method of any preceding claim, further comprising:
deploying the software agent to monitor the deployed application. - The computer-implemented method of any preceding claim, further comprising:receiving user modifications to the second user interface; andgenerating, based on the user modifications, a modified second user interface.
- The computer-implemented method of claim 10,
wherein the modified second user interface comprises additional regions. - The computer-implemented method of claim 10,
wherein the modified second user interface comprises additional metrics. - The computer-implemented method of any preceding claim, further comprising:receiving an operating system identification associated with an operating system of the deployed application; andreceiving operating system-specific instructions for generating the software agent,wherein generating the software agent is further based on the received operating system-specific instructions.
- An apparatus comprising:one or more processors; andmemory storing instructions that, when executed by the one or more processors, cause the apparatus to carry out the method of any of claims 1 to 13.
- One or more media storing instructions that, when executed by one or more processors, cause the one or more processors to perform the method of any of claims 1 to 13.
Applications Claiming Priority (1)
| Application Number | Priority Date | Filing Date | Title |
|---|---|---|---|
| US17/362,403 US11762962B2 (en) | 2021-06-29 | 2021-06-29 | Onboarding of monitoring tools |
Publications (2)
| Publication Number | Publication Date |
|---|---|
| EP4113307A1 true EP4113307A1 (en) | 2023-01-04 |
| EP4113307B1 EP4113307B1 (en) | 2026-04-08 |
Family
ID=83081756
Family Applications (1)
| Application Number | Title | Priority Date | Filing Date |
|---|---|---|---|
| EP22181769.5A Active EP4113307B1 (en) | 2021-06-29 | 2022-06-29 | Onboarding of monitoring tools |
Country Status (3)
| Country | Link |
|---|---|
| US (2) | US11762962B2 (en) |
| EP (1) | EP4113307B1 (en) |
| CA (1) | CA3165869A1 (en) |
Families Citing this family (5)
| Publication number | Priority date | Publication date | Assignee | Title |
|---|---|---|---|---|
| US12450079B2 (en) * | 2021-04-22 | 2025-10-21 | Dell Products L.P. | Component monitoring framework |
| US11949761B2 (en) | 2021-07-29 | 2024-04-02 | Oracle International Corporation | Techniques for distributed interface component generation |
| EP4432092A1 (en) * | 2023-03-16 | 2024-09-18 | Bull Sas | Method and system to monitor the operation of an application |
| US12566691B2 (en) * | 2023-04-10 | 2026-03-03 | Capital One Services, Llc | Systems and methods for testing application resiliency |
| US20250286922A1 (en) * | 2024-03-08 | 2025-09-11 | The Pnc Financial Services Group, Inc. | Systems and methods for monitoring health of a digital application system |
Citations (2)
| Publication number | Priority date | Publication date | Assignee | Title |
|---|---|---|---|---|
| US20190190803A1 (en) * | 2017-03-29 | 2019-06-20 | Ca, Inc. | Introspection driven monitoring of multi-container applications |
| US20200409825A1 (en) * | 2019-06-27 | 2020-12-31 | Capital One Services, Llc | Discovery crawler for application dependency discovery, reporting, and management tool |
Family Cites Families (24)
| Publication number | Priority date | Publication date | Assignee | Title |
|---|---|---|---|---|
| US6505246B1 (en) * | 1998-12-30 | 2003-01-07 | Candle Distributed Solutions, Inc. | User interface for system management applications |
| CA2780646C (en) | 2008-12-11 | 2018-08-07 | Sugarcrm Inc. | Business software application system and method |
| US8880436B2 (en) | 2009-02-23 | 2014-11-04 | The Hong Kong and Shanghai Banking Corporation Limited | Automation system and method for a web-based implementation portal |
| GB0918038D0 (en) * | 2009-10-14 | 2009-12-02 | Univ Strathclyde | Condition monitoring system |
| WO2011063269A1 (en) | 2009-11-20 | 2011-05-26 | Alert Enterprise, Inc. | Method and apparatus for risk visualization and remediation |
| US9003141B2 (en) * | 2011-11-14 | 2015-04-07 | Ca, Inc. | Enhanced software application platform |
| US8972951B2 (en) * | 2012-09-24 | 2015-03-03 | Ca, Inc. | Embedding performance monitoring into mashup application development |
| MY176486A (en) * | 2012-12-06 | 2020-08-12 | Mimos Berhad | Automated test environment deployment with metric recommender for performance testing on iaas cloud |
| US10409912B2 (en) | 2014-07-31 | 2019-09-10 | Oracle International Corporation | Method and system for implementing semantic technology |
| US9274758B1 (en) * | 2015-01-28 | 2016-03-01 | Dell Software Inc. | System and method for creating customized performance-monitoring applications |
| US10394802B1 (en) | 2016-01-31 | 2019-08-27 | Splunk, Inc. | Interactive location queries for raw machine data |
| US10607150B2 (en) | 2016-02-23 | 2020-03-31 | Splunk Inc. | Machine-learning data analysis tool |
| US20170286449A1 (en) | 2016-04-01 | 2017-10-05 | US-ANALYTICS Solutions Group, LLC | System for Connecting Computer Dashboards with Geographic Information Systems |
| US10230601B1 (en) * | 2016-07-05 | 2019-03-12 | Quest Software Inc. | Systems and methods for integrated modeling and performance measurements of monitored virtual desktop infrastructure systems |
| US20180082232A1 (en) | 2016-09-22 | 2018-03-22 | CostFirst Corp. | Uniform workers compenstation cost containment system |
| US11188550B2 (en) | 2016-09-26 | 2021-11-30 | Splunk Inc. | Metrics store system |
| US20180189344A1 (en) | 2016-12-30 | 2018-07-05 | General Electric Company | Onboarding portal for cloud platform |
| US10547521B1 (en) * | 2017-03-29 | 2020-01-28 | Juniper Networks, Inc. | Network dashboard with multifaceted utilization visualizations |
| US10509794B2 (en) | 2017-04-28 | 2019-12-17 | Splunk Inc. | Dynamically-generated files for visualization sharing |
| US11720698B2 (en) | 2019-04-02 | 2023-08-08 | Jpmorgan Chase Bank, N.A. | Systems and methods for implementing an interactive contractor dashboard |
| US20210126977A1 (en) * | 2019-04-09 | 2021-04-29 | Elasticsearch B.V. | Single Agent for Logs, Metrics, Traces, Synthetics, Security, and End Point Monitoring |
| US11847167B2 (en) | 2019-06-05 | 2023-12-19 | Boomi, LP | System and method for generation of chat bot system with integration elements augmenting natural language processing and native business rules |
| US12047839B2 (en) * | 2020-01-17 | 2024-07-23 | Cisco Technology, Inc. | Out of box user performance journey monitoring |
| US20220245476A1 (en) * | 2021-02-03 | 2022-08-04 | Asserts Inc. | Automatically generating assertions and insights |
-
2021
- 2021-06-29 US US17/362,403 patent/US11762962B2/en active Active
-
2022
- 2022-06-28 CA CA3165869A patent/CA3165869A1/en active Pending
- 2022-06-29 EP EP22181769.5A patent/EP4113307B1/en active Active
-
2023
- 2023-08-03 US US18/229,983 patent/US20240004966A1/en active Pending
Patent Citations (2)
| Publication number | Priority date | Publication date | Assignee | Title |
|---|---|---|---|---|
| US20190190803A1 (en) * | 2017-03-29 | 2019-06-20 | Ca, Inc. | Introspection driven monitoring of multi-container applications |
| US20200409825A1 (en) * | 2019-06-27 | 2020-12-31 | Capital One Services, Llc | Discovery crawler for application dependency discovery, reporting, and management tool |
Also Published As
| Publication number | Publication date |
|---|---|
| US11762962B2 (en) | 2023-09-19 |
| US20220414187A1 (en) | 2022-12-29 |
| US20240004966A1 (en) | 2024-01-04 |
| CA3165869A1 (en) | 2022-12-29 |
| EP4113307B1 (en) | 2026-04-08 |
Similar Documents
| Publication | Publication Date | Title |
|---|---|---|
| EP4113307B1 (en) | Onboarding of monitoring tools | |
| US11720527B2 (en) | API for implementing scoring functions | |
| US8649995B2 (en) | System and method for efficient test case generation using input dependency information | |
| US8458666B2 (en) | Methods and systems for implementing a test automation framework for testing software applications on UNIX/LINUX based machines | |
| US11397567B2 (en) | Integrated system for designing a user interface | |
| US20200125926A1 (en) | Dynamic Batch Sizing for Inferencing of Deep Neural Networks in Resource-Constrained Environments | |
| US11218386B2 (en) | Service ticket escalation based on interaction patterns | |
| US20180165258A1 (en) | Methods for improved auditing of web sites and devices thereof | |
| CN110196809B (en) | Interface testing method and device | |
| CN112036577B (en) | Method and device for applying machine learning based on data form and electronic equipment | |
| US20170200101A1 (en) | Systems and methods for optimized task allocation | |
| US20230084685A1 (en) | Constraints-based refactoring of monolith applications through attributed graph embeddings | |
| US11816512B2 (en) | Event driven data processing system and method | |
| CN113191889A (en) | Wind control configuration method, configuration system, electronic device and readable storage medium | |
| US11086606B2 (en) | System and method for dynamic process flow control based on real-time events | |
| CN113726610B (en) | Routing protocol-based UI (user interface) automatic test method, device, equipment and medium | |
| CN117056240B (en) | Data element development and debugging method and system supporting offline Jar package | |
| US20230177337A1 (en) | Multi-objective driven refactoring of a monolith application using reinforcement learning | |
| JP6839673B2 (en) | Application dividers, methods and programs | |
| US12050505B2 (en) | Systems and methods for automatically applying configuration changes to computing clusters | |
| US20250315533A1 (en) | Threat Model Generation Systems | |
| US12566977B2 (en) | Optimizing CogBot retraining | |
| Tamura et al. | Practical reliability and maintainability analysis tool for an open source cloud computing | |
| US20220230181A1 (en) | Next best action framework with nested decision trees | |
| JP7477698B1 (en) | Information processing device, information processing method, and program. |
Legal Events
| Date | Code | Title | Description |
|---|---|---|---|
| PUAI | Public reference made under article 153(3) epc to a published international application that has entered the european phase |
Free format text: ORIGINAL CODE: 0009012 |
|
| STAA | Information on the status of an ep patent application or granted ep patent |
Free format text: STATUS: REQUEST FOR EXAMINATION WAS MADE |
|
| 17P | Request for examination filed |
Effective date: 20220629 |
|
| AK | Designated contracting states |
Kind code of ref document: A1 Designated state(s): AL AT BE BG CH CY CZ DE DK EE ES FI FR GB GR HR HU IE IS IT LI LT LU LV MC MK MT NL NO PL PT RO RS SE SI SK SM TR |
|
| RBV | Designated contracting states (corrected) |
Designated state(s): AL AT BE BG CH CY CZ DE DK EE ES FI FR GB GR HR HU IE IS IT LI LT LU LV MC MK MT NL NO PL PT RO RS SE SI SK SM TR |
|
| GRAP | Despatch of communication of intention to grant a patent |
Free format text: ORIGINAL CODE: EPIDOSNIGR1 |
|
| STAA | Information on the status of an ep patent application or granted ep patent |
Free format text: STATUS: GRANT OF PATENT IS INTENDED |
|
| INTG | Intention to grant announced |
Effective date: 20251103 |
|
| GRAS | Grant fee paid |
Free format text: ORIGINAL CODE: EPIDOSNIGR3 |
|
| GRAA | (expected) grant |
Free format text: ORIGINAL CODE: 0009210 |
|
| STAA | Information on the status of an ep patent application or granted ep patent |
Free format text: STATUS: THE PATENT HAS BEEN GRANTED |
|
| P01 | Opt-out of the competence of the unified patent court (upc) registered |
Free format text: CASE NUMBER: UPC_APP_0006028_4113307/2026 Effective date: 20260218 |
|
| AK | Designated contracting states |
Kind code of ref document: B1 Designated state(s): AL AT BE BG CH CY CZ DE DK EE ES FI FR GB GR HR HU IE IS IT LI LT LU LV MC MK MT NL NO PL PT RO RS SE SI SK SM TR |
|
| REG | Reference to a national code |
Ref country code: CH Ref legal event code: F10 Free format text: ST27 STATUS EVENT CODE: U-0-0-F10-F00 (AS PROVIDED BY THE NATIONAL OFFICE) Effective date: 20260408 Ref country code: GB Ref legal event code: FG4D |
|
| REG | Reference to a national code |
Ref country code: DE Ref legal event code: R096 Ref document number: 602022033886 Country of ref document: DE |