EP4113158A1 - System for determining the priority of inspection of satellite remotely sensed objects and method thereof - Google Patents
System for determining the priority of inspection of satellite remotely sensed objects and method thereof Download PDFInfo
- Publication number
- EP4113158A1 EP4113158A1 EP22179844.0A EP22179844A EP4113158A1 EP 4113158 A1 EP4113158 A1 EP 4113158A1 EP 22179844 A EP22179844 A EP 22179844A EP 4113158 A1 EP4113158 A1 EP 4113158A1
- Authority
- EP
- European Patent Office
- Prior art keywords
- unit
- score
- scatterers
- value
- calculating
- Prior art date
- Legal status (The legal status is an assumption and is not a legal conclusion. Google has not performed a legal analysis and makes no representation as to the accuracy of the status listed.)
- Granted
Links
Images


Classifications
-
- G—PHYSICS
- G01—MEASURING; TESTING
- G01S—RADIO DIRECTION-FINDING; RADIO NAVIGATION; DETERMINING DISTANCE OR VELOCITY BY USE OF RADIO WAVES; LOCATING OR PRESENCE-DETECTING BY USE OF THE REFLECTION OR RERADIATION OF RADIO WAVES; ANALOGOUS ARRANGEMENTS USING OTHER WAVES
- G01S7/00—Details of systems according to groups G01S13/00, G01S15/00, G01S17/00
- G01S7/02—Details of systems according to groups G01S13/00, G01S15/00, G01S17/00 of systems according to group G01S13/00
- G01S7/41—Details of systems according to groups G01S13/00, G01S15/00, G01S17/00 of systems according to group G01S13/00 using analysis of echo signal for target characterisation; Target signature; Target cross-section
- G01S7/415—Identification of targets based on measurements of movement associated with the target
-
- G—PHYSICS
- G01—MEASURING; TESTING
- G01S—RADIO DIRECTION-FINDING; RADIO NAVIGATION; DETERMINING DISTANCE OR VELOCITY BY USE OF RADIO WAVES; LOCATING OR PRESENCE-DETECTING BY USE OF THE REFLECTION OR RERADIATION OF RADIO WAVES; ANALOGOUS ARRANGEMENTS USING OTHER WAVES
- G01S13/00—Systems using the reflection or reradiation of radio waves, e.g. radar systems; Analogous systems using reflection or reradiation of waves whose nature or wavelength is irrelevant or unspecified
- G01S13/88—Radar or analogous systems specially adapted for specific applications
- G01S13/89—Radar or analogous systems specially adapted for specific applications for mapping or imaging
- G01S13/90—Radar or analogous systems specially adapted for specific applications for mapping or imaging using synthetic aperture techniques, e.g. synthetic aperture radar [SAR] techniques
- G01S13/9021—SAR image post-processing techniques
- G01S13/9023—SAR image post-processing techniques combined with interferometric techniques
-
- G—PHYSICS
- G01—MEASURING; TESTING
- G01S—RADIO DIRECTION-FINDING; RADIO NAVIGATION; DETERMINING DISTANCE OR VELOCITY BY USE OF RADIO WAVES; LOCATING OR PRESENCE-DETECTING BY USE OF THE REFLECTION OR RERADIATION OF RADIO WAVES; ANALOGOUS ARRANGEMENTS USING OTHER WAVES
- G01S7/00—Details of systems according to groups G01S13/00, G01S15/00, G01S17/00
- G01S7/02—Details of systems according to groups G01S13/00, G01S15/00, G01S17/00 of systems according to group G01S13/00
- G01S7/41—Details of systems according to groups G01S13/00, G01S15/00, G01S17/00 of systems according to group G01S13/00 using analysis of echo signal for target characterisation; Target signature; Target cross-section
- G01S7/417—Details of systems according to groups G01S13/00, G01S15/00, G01S17/00 of systems according to group G01S13/00 using analysis of echo signal for target characterisation; Target signature; Target cross-section involving the use of neural networks
Definitions
- the present invention relates to a system and a relative method, for determining the priority of inspection of objects on the earth's surface by using multi-temporal interferometry measurements of satellite SAR data.
- objects can be part of the natural environment such as territories, or they can be man-made objects such as linear infrastructures (e.g. water sewer networks, transportations infrastructures), point infrastructures (e.g. electrical towers), polygonal infrastructures (e.g. buildings, settling tanks of wastewater of a treatment plant).
- linear infrastructures e.g. water sewer networks, transportations infrastructures
- point infrastructures e.g. electrical towers
- polygonal infrastructures e.g. buildings, settling tanks of wastewater of a treatment plant.
- Land instability represents a serious source of danger for citizens safety, infrastructure safeguarding and environmental protection. Under the pressure of anthropogenic activities and climate change, the intensity and frequency of land instability phenomena are faster growing than before. As calamitous events, land instability phenomena can cause human injury, loss of life and economic resources, and damage facilities, properties and/or infrastructures, increased costs and delays to new developments.
- Remotely-sensed territories and infrastructure movements can be measured with millimetric accuracy by processing SAR (Synthetic Aperture RADAR) images. It is possible, indeed, to measure the distance between the sensor and the target over time, recording the time elapsed between the electromagnetic wave emission and the backscattered signal's reception. The comparison of distances measured over time allows the computation of territories or infrastructure displacements with millimetric precision. This technique is known as "multi-temporal interferometry" and can produce measures that can be widely used to identify which are the infrastructures that are affected by out of normal movements.
- SAR Synthetic Aperture RADAR
- the ground motion maps obtained as output of the multi-temporal interferometry are visually examined by operators that decide on the basis of their acquired knowledge and their experience if a given area is worthy of field inspection of not.
- This type of approach can be complex, time-demanding and easily subject to errors.
- SAR data can be acquired with a global coverage 24/7 and under any weather condition.
- remotely-sensed monitoring of territories and infrastructure displacements produces millions of measures over areas of few hundreds of square kilometres.
- making decisions over even localised portions of infrastructures or territory reveals to be a difficult task for which human interpretation shows evident limits.
- some attempts have been done in the state of art, to develop tools for slow-moving territories and infrastructure consequence forecasting and for implementing risk mitigation strategies.
- CN109991601A discloses the determination of breakpoints, periodic components and whether there is acceleration in the time series. Risk is empirically evaluated based on maximum settlement, maximum slope/tilt, the recent deformation rate and the acceleration of the deformation rate.
- the object of the present invention is, therefore, to provide a system that allows for automatically detecting pre-critical remotely-sensed movements of territories and infrastructure, so to proceed with the field inspection only of those portions of infrastructures or territories that are in pre-critical status, giving the precedence to those that are in a higher concern situation.
- the system of the present invention comprises an arithmetic device configured to process the multi-temporal interferometry ground motion maps by dividing them into areas and calculating a score indicative of the criticality of the situation for each of said areas and, therefore, of their priority of inspection.
- the arithmetic device can, then, rank the areas on the basis of their indices and, automatically, classify them in risk classes by using a neural network algorithm.
- the above-mentioned arithmetic device is configured to execute:
- the “persistent scatterers”, or PS are single scatterers on the ground showing high temporal phase stability in the entire data stack and that are minimally affected by temporal and geometrical decorrelation.
- the “distributed scatterers”, o DS are, instead, groups of different small scatterers on the ground showing constant reflection over time, with moderate coherence and medium-to-low signal-to-noise ratio, due to temporal and spatial decorrelation. More particularly, the persistent scatterers correspond to artificial or natural elements existing on the Earth's surface, e.g., buildings, monuments, roadways, railways, antennas, electric towers or rocks, debris slopes. Their return signal (backscatter) is characterized by high stability over time. The radar can measure the distance between the sensor and the target every time it flies over it.
- the persistent scatterers have a high signal-to-noise ratio
- the distributed scatterers have a medium-to-low signal-to-noise ratio. To be considered as a unique target, they have to be numerous and close to each other, and they have to exhibit the same backscatter signal.
- the interimage coherence can be calculated, as not limiting example, as the sum over the images of the residual between actual and modelled phase trends, the model phase being the sum of all the contributions due to APS (Atmospheric Phase Screen), DEM (Digital Elevetion Model) error, and displacement.
- APS atmospheric Phase Screen
- DEM Digital Elevetion Model
- SPINUA a flexible processing chain for ERS/ENVISAT long term interferometry. Proceedings of ESA-ENVISAT Symposium, Salzburg, Austria. 6-10 ].
- the coherence is, directly connected to persistent and distributed scatterers quality: the higher the coherence, the lower the uncertainty of the measured backscatter signal. For this reason and as further detailed below, the coherence value for each of the persistent scatterers and/or distributed scatterers was processed to obtain a normalized value of the same and used for selecting only the scatterers having high signal reliability.
- the calculating the score comprises:
- the calculating the score can comprise:
- the processing of determining the priority of inspection of each unit based on the score can comprise ranking the scores of the units and/or classifying the units based on the scores in one of the following risk classes:
- the displaying information can, thus, comprise displaying the scores and/or the risk classes of each unit.
- Color mapping of the scores or the risk classes of each unit on satellite images of the object can also be part of the displaying information.
- the proposed score can be calculated for the displacement measurements derived from multi-temporal interferometry measurements of satellite SAR data acquired in both ascending and descending mode.
- the calculating the score described above, can be replicated for ascending mode and descending mode data, so as to obtain for each unit, a first score, resulting from SAR data acquired in ascending mode, and a second score, resulting from SAR data acquired in descending mode.
- the calculating the score therefore, will further comprise:
- the processing of determining the priority of inspection of each unit will be based on the final score and comprise ranking the final scores of the units and/or classifying the units based on the final scores in one of the following risk classes:
- a second object of the present invention is, then, to provide a method that allows for detecting pre-critical remotely-sensed movements of territories and infrastructure, so to proceed with the field inspection only of those portions of infrastructures or territories that are in pre-critical status, giving the precedence to those that are in a higher concern situation.
- Such a method comprises:
- the step of calculating the score comprises:
- the step of calculating the score can comprise:
- the processing of determining the priority of inspection of each unit based on the score comprise ranking the scores of the units and/or classifying the units assigning to them risk classes based on the scores and the displaying information can comprise displaying and or color mapping the scores and/or the risk classes of each unit.
- the calculating the score described above, can be replicated for ascending mode and descending mode data, so as to obtain for each unit, a first score, resulting from SAR data acquired in ascending mode, and a second score, resulting from SAR data acquired in descending mode.
- the calculating the score therefore, will further comprise:
- the step of processing of determining the priority of inspection of each unit based on the score comprise ranking the final scores of the units and/or classifying the units based on the final scores and the step of displaying information can comprise displaying and or color mapping the final scores and/or the risk classes of each unit.
- a first embodiment of the system of the present invention is specifically designed for determining the priority of inspection of the portions of a linear infrastructure (e.g. water networks, sewer networks, roadways, railways, etc.).
- the first embodiment of the system of the present invention comprising an arithmetic device that is configured to execute:
- An elementary unit (1, 1', 1") is defined as is an area surrounding a segment of the infrastructure, the segment having a length comprised between 90 m and 110 and the area comprising all the scatterers having a linear distance from that segment comprised between 90 m or 110 m, or comprised between 10 m and 30 m.
- NC normalized coherence
- NC 0.5
- the coherence threshold is computed by the multi-temporal interferometry analysis as the value obtained with a Monte Carlo simulation.
- the arithmetic device is further configured to execute:
- the calculating at least a score for each elementary unit (1, 1', 1") comprises:
- the velocity can be used the product of the velocity of a given scatterer and the density of the selected scatterers inside the elementary unit (1, 1', 1") containing that scatterer.
- the arithmetic device is configured to execute determining the priority of inspection of each unit (1, 1', 1") by classifying the units (1, 1', 1") based on the scores, by means of a neural network algorithm using the scores of the units (1, 1', 1") as input.
- the scores of the units (1, 1', 1") are calculated using the velocities or the scatterers and/or the product of the velocities of the scatterers per the density of the scatterers inside the unit (1, 1', 1").
- the risk classes are:
- the calculating at least a score for each elementary unit (1, 1', 1") comprises:
- the scores obtained by using acceleration can be used alone in the processing of determining the priority of inspection or in combination with the scores obtained by using the velocity and/or the scores obtained by using the product between the density and the velocity.
- the processing of determining the priority of inspection of each unit (1, 1', 1") based on the score comprises ranking the scores of the units (1, 1', 1") and classifying the units (1, 1', 1"), said scores being calculated on the basis of the acceleration.
- the processing of determining the priority of inspection comprises comparing, for each unit (1, 1', 1"), the score obtained by using the acceleration, the score calculated on the basis of the velocity and the score obtained by using the product of the density and the velocity.
- a final score is then selected as the score that is greater among the three calculated scores (acceleration, velocity, product of density and velocity, density per acceleration) and the ranking is performed on the final score.
- a fourth type of scores on the basis the product of the density and the acceleration can be calculated and compared with the others.
- the arithmetic device can, therefore, execute the step of classifying by means of a neural network algorithm using simultaneously all the types of scores as inputs.
- all the proposed scores can be calculated for the displacement measurements derived from multi-temporal interferometry measurements of satellite SAR data acquired in both ascending and descending mode.
- the calculating the score can be replicated for ascending mode and descending mode data, so as to obtain for each unit (1, 1', 1"), a first score, resulting from SAR data acquired in ascending mode, and a second score, resulting from SAR data acquired in descending mode.
- the calculating the score therefore, will further comprise:
- the partial final scores calculated for all the used quantities have, then, to be compared so as obtaining a total final score. To this aim, the latter is calculated as the higher partial final scores.
- the arithmetic device is further configured to execute processing of displaying information on the score and/or the risk classes of each unit (1, 1', 1").
- the displaying information can comprise also the color mapping the scores and/or the risk classes of each unit (1, 1', 1") on satellite images of the linear infrastructure.
- a first embodiment of the method of the present invention is designed for determining the priority of inspection of the portions of a linear infrastructure (e.g. water networks, sewer networks, roadways, railways, and comprises all the steps executed by the arithmetic device of the first embodiment of the system of the present invention.
- a linear infrastructure e.g. water networks, sewer networks, roadways, railways
- a second embodiment of the system of the present invention is specifically designed for determining the priority of inspection of the portions of a polygonal infrastructure (e.g. buildings, settling tanks of wastewater of a treatment plant, etc.).
- a polygonal infrastructure e.g. buildings, settling tanks of wastewater of a treatment plant, etc.
- NC 0.5
- the coherence threshold (SC) is computed by the multi-temporal interferometry analysis as the value obtained with a Monte Carlo simulation.
- the arithmetic device that is further configured to execute:
- the calculating at least a score for each elementary unit (2, 2', 2") comprises:
- the acceleration of the scatterers can be used as quantity, on the basis of which calculate the scores.
- the calculating at least a score for each elementary unit (2, 2', 2") comprises:
- the scores obtained using the acceleration can be used alone in the processing of determining the priority of inspection or in combination with the scores obtained by using the velocity.
- the processing of determining the priority of inspection of each unit (2, 2', 2") based on the score comprises ranking the scores of the units (2, 2', 2") and classifying the units (2, 2', 2"), said scores being calculated on the basis of the acceleration.
- the processing of determining the priority of inspection comprises comparing, for each unit (2, 2', 2"), the score obtained by using the acceleration and the score calculated on the basis of the velocity.
- a final score is then selected as the score that is greater among the three calculated scores (acceleration, velocity) and the ranking is performed on the final score.
- the arithmetic device can, therefore, execute the step of classifying by means of a neural network algorithm using simultaneously all the types of scores as inputs. Moreover, as previously mentioned, all the proposed scores (based on velocity and acceleration) can be calculated for the displacement measurements derived from multi-temporal interferometry measurements of satellite SAR data acquired in both ascending and descending mode.
- the calculating the score can be replicated for ascending mode and descending mode data, so as to obtain for each unit (2, 2', 2"), a first score, resulting from SAR data acquired in ascending mode, and a second score, resulting from SAR data acquired in descending mode.
- the calculating the score therefore, will further comprise:
- the partial final scores calculated for all the used quantities have, then, to be compared so as obtaining a total final score. To this aim, the latter is calculated as the higher partial final scores.
- the arithmetic device is further configured to execute processing of displaying information on the score and/or on the risk classes of each unit (2, 2', 2").
- the displaying information can comprise also the color mapping of the scores and/or of the risk classes of each unit (2, 2', 2") on satellite images of the polygonal infrastructure.
- a second embodiment of the method of the present invention is designed for determining the priority of inspection of the portions of a polygonal infrastructure (e.g. buildings, settling tanks of wastewater of a treatment plant, etc.) and comprises all the steps executed by the arithmetic device of the second embodiment of the system of the present invention.
- a polygonal infrastructure e.g. buildings, settling tanks of wastewater of a treatment plant, etc.
- a third embodiment of the system of the present invention is specifically designed for determining the priority of inspection of the portions of a point infrastructure (e.g. electrical towers, etc.).
- a point infrastructure e.g. electrical towers, etc.
- An elementary unit (3, 3', 3") is defined as circular area centred in a point of the infrastructure, the area having a radius of length comprised between 90 m or 110 m, or comprised between 10 m and 30 m.
- NC normalized coherence
- NC 0.5
- the coherence threshold (SC) is computed by the multi-temporal interferometry analysis as the value obtained with a Monte Carlo simulation.
- the arithmetic device that is further configured to execute:
- the calculating at least a score for each elementary unit (3, 3', 3") comprises:
- the calculating at least a score for each elementary unit (3, 3', 3") comprises:
- the scores obtained using the acceleration can be used alone in the processing of determining the priority of inspection or in combination with the scores obtained by using the velocity.
- the processing of determining the priority of inspection of each unit (3, 3', 3") based on the score comprises ranking the scores of the units (3, 3', 3") and classifying the units (3, 3', 3"), said scores being calculated on the basis of the acceleration.
- the processing of determining the priority of inspection comprises comparing, for each unit (3, 3', 3"), the score obtained by using the acceleration and the score calculated on the basis of the velocity.
- a final score is then selected as the score that is greater among the two calculated scores (acceleration, velocity) and the ranking is performed on the final score.
- the arithmetic device can, therefore, execute the step of classifying by means of a neural network algorithm using simultaneously all the types of scores as inputs. Moreover, as previously mentioned, all the proposed scores (based on velocity and acceleration) can be calculated for the displacement measurements derived from multi-temporal interferometry measurements of satellite SAR data acquired in both ascending and descending mode.
- the calculating the score can be replicated for ascending mode and descending mode data, so as to obtain for each unit (3, 3', 3"), a first score, resulting from SAR data acquired in ascending mode, and a second score, resulting from SAR data acquired in descending mode.
- the calculating the score therefore, will further comprise:
- the partial final scores calculated for all the used quantities have, then, to be compared so as obtaining a total final score. To this aim, the latter is calculated as the higher partial final scores.
- the arithmetic device is further configured to execute processing of displaying information on the score and/or the risk classes of each unit (3, 3', 3").
- the displaying information can comprise also the color mapping of the scores and/or of the risk classes of each unit (3, 3', 3") on satellite images of the point infrastructure.
- a third embodiment of the method of the present invention is designed for determining the priority of inspection of the portions of a point infrastructure (e.g. electrical towers, etc.) and comprises all the steps executed by the arithmetic device of the third embodiment of the system of the present invention.
- a fourth embodiment of the method of the present invention is specifically designed for determining the priority of inspection of the portions of a territory.
- An elementary unit (4, 4', 4") is defined as a circular shaped or polygonal shaped (e.g. square-shaped or hexagon-shaped) area, the plurality of the elementary units (4, 4', 4") forming a grid covering the territory.
- the size and placement of each area are defined using horizontal and vertical spacing, both ranging between 30 and 300 m.
- SC coherence threshold
- NC normalized coherence
- NC 0.5
- the coherence threshold (SC) is computed by the multi-temporal interferometry analysis as the value obtained with a Monte Carlo simulation.
- the arithmetic device that is further configured to execute:
- the calculating at least a score for each elementary unit (4, 4', 4") comprises:
- the scores obtained using the product of the density per the velocity can be used alone in the processing of determining the priority of inspection or in combination with the scores obtained by using the velocity.
- the processing of determining the priority of inspection of each unit (4, 4', 4") based on the score comprises ranking the scores of the units (4, 4', 4") and classifying the units (4, 4', 4"), said scores being calculated on the basis of the density per velocity.
- the processing of determining the priority of inspection comprises comparing, for each unit (4, 4', 4"), the score obtained by using the density per velocity and the score calculated on the basis of the velocity.
- a final score is then selected as the score that is greater among the two calculated scores (velocity, density per velocity) and the ranking is performed on the final score.
- the arithmetic device can, therefore, execute the step of classifying by means of a neural network algorithm using simultaneously all the types of scores as inputs. Moreover, as previously mentioned, all the proposed scores (based on velocity and density per velocity) can be calculated for the displacement measurements derived from multi-temporal interferometry measurements of satellite SAR data acquired in both ascending and descending mode.
- the calculating the score can be replicated for ascending mode and descending mode data, so as to obtain for each unit (4, 4', 4"), a first score, resulting from SAR data acquired in ascending mode, and a second score, resulting from SAR data acquired in descending mode.
- the calculating the score therefore, will further comprise:
- the partial final scores calculated for all the used quantities have, then, to be compared so as obtaining a total final score. To this aim, the latter is calculated as the higher partial final scores.
- the arithmetic device is further configured to execute processing of displaying information on the score and/or the risk classes of each unit (4, 4', 4").
- the displaying information can comprise also the color mapping of the scores and/or of the risk classes of each unit (4, 4', 4") on satellite images of the territory.
- a fourth embodiment of the method of the present invention is designed for determining the priority of inspection of the portions of a territory and comprises all the steps executed by the arithmetic device of the fourth embodiment of the system of the present invention.
Landscapes
- Engineering & Computer Science (AREA)
- Remote Sensing (AREA)
- Radar, Positioning & Navigation (AREA)
- Physics & Mathematics (AREA)
- Computer Networks & Wireless Communication (AREA)
- General Physics & Mathematics (AREA)
- Artificial Intelligence (AREA)
- Evolutionary Computation (AREA)
- Electromagnetism (AREA)
- Radar Systems Or Details Thereof (AREA)
Abstract
Description
- The present invention relates to a system and a relative method, for determining the priority of inspection of objects on the earth's surface by using multi-temporal interferometry measurements of satellite SAR data. These objects can be part of the natural environment such as territories, or they can be man-made objects such as linear infrastructures (e.g. water sewer networks, transportations infrastructures), point infrastructures (e.g. electrical towers), polygonal infrastructures (e.g. buildings, settling tanks of wastewater of a treatment plant).
- Land instability represents a serious source of danger for citizens safety, infrastructure safeguarding and environmental protection. Under the pressure of anthropogenic activities and climate change, the intensity and frequency of land instability phenomena are faster growing than before. As calamitous events, land instability phenomena can cause human injury, loss of life and economic resources, and damage facilities, properties and/or infrastructures, increased costs and delays to new developments.
- The management of critical infrastructures (e.g. water and sewer networks, transportations infrastructures, electrical towers, private and public buildings, historical heritage, etc.) and urbanised territory is a complex and expensive task for multi-utility companies, operators and public entities, which are in need of ensuring the correct and safe functionality of crucial assets, as well as the safety of citizens. Multi-utility companies, operators and public entities spend a lot of financial resources maintaining their assets. Right now, policies are strictly oriented to recovery assets in case of disruption due to major problems.
- Identifying high concern-level (or pre-critical) portions of infrastructures or territory before critical situations occur is a challenge.
- Traditional campaigns for the regular monitoring of wide areas and infrastructures require considerable financial resources and time and are often complex to implement. The use of remotely-sensed data can overcome these limitations and provide frequent, accurate and accessible information thanks to the wide availability of spatial information. Remotely-sensed territories and infrastructure movements can be measured with millimetric accuracy by processing SAR (Synthetic Aperture RADAR) images. It is possible, indeed, to measure the distance between the sensor and the target over time, recording the time elapsed between the electromagnetic wave emission and the backscattered signal's reception. The comparison of distances measured over time allows the computation of territories or infrastructure displacements with millimetric precision. This technique is known as "multi-temporal interferometry" and can produce measures that can be widely used to identify which are the infrastructures that are affected by out of normal movements.
- At the current state of art, the ground motion maps obtained as output of the multi-temporal interferometry are visually examined by operators that decide on the basis of their acquired knowledge and their experience if a given area is worthy of field inspection of not. This type of approach can be complex, time-demanding and easily subject to errors. SAR data can be acquired with a global coverage 24/7 and under any weather condition. Hence, remotely-sensed monitoring of territories and infrastructure displacements produces millions of measures over areas of few hundreds of square kilometres. As a consequence, making decisions over even localised portions of infrastructures or territory reveals to be a difficult task for which human interpretation shows evident limits. To this aim, some attempts have been done in the state of art, to develop tools for slow-moving territories and infrastructure consequence forecasting and for implementing risk mitigation strategies. [ Peduto D et al, "Empirical fragility and vulnerability curves for buildings exposed to slow-moving landslides at medium and large scales", Landslides, Springer Berlin Heidelberg Berlin/Heidelberg, vol. 14, no.6, 13 April 2017 ], in particular, discloses a two-scale (medium and large) procedure for vulnerability assessment of buildings located in areas affected by slow-moving landslides. Intensity measures are derived from Differential Interferometric Synthetic Aperture Radar (DInSAR) satellite data analysis and based on Din-SAR-derived intensity parameters, fragility and vulnerability curves are generated for the exposed building in vulnerable areas. The operator can, then, decides if a building is worthy of inspection or not by empirically evaluating the obtained curves. In [ Nappo N. et al. "Slow-moving landslides interacting with the road network: Analysis of damage using ancillary data, in situ surveys and multi-source monitoring data." Engineering Geology, Elsevier Science Publishers, Amsterdam, NL, vol. 260, 30 July 2019], instead, an analysis of road damage based on interferometry using persistent scatterers is described. More particularly, [ Nappo N. et al. "Slow-moving landslides interacting with the road network: Analysis of damage using ancillary data, in situ surveys and multi-source monitoring data." Engineering Geology, Elsevier Science Publishers, Amsterdam, NL, vol. 260, 30 July 2019 ] discloses an existing correlation between the damage level and a differential displacement parameter. This differential displacement parameter is determined as the absolute value of the difference of the average absolute cumulative displacement in a circle on the road and in a larger circle comprising an area outside the road. The empirical use of the disclosed correlation of such differential parameter with the damage level is proposed as procedure to help road maintenance prioritization and scheduling as well as risk management. [ Pratesi F. et al. "Rating health and stability of engineering structures via classification indexes of InSAR Persistent Scatterers", International Journal of Applied Earth Observation and Geoinformation, vol. 40, pages 81-90, 22 April 2015 ] discloses indexes derived from permanent scatterers for the evaluation of health of engineering structures based on persistent scatterers coverage, maximum velocity and a velocity distribution index that is function of maximum, minimum, and mean velocities and expresses the symmetry degree. Such indexes are, thus, colour coded and used as to determine the buildings requiring further investigation.
CN109991601A describes how to determine the maximum settlement of a building and the slope/tilt of the settlement. More particularly,CN109991601A discloses the determination of breakpoints, periodic components and whether there is acceleration in the time series. Risk is empirically evaluated based on maximum settlement, maximum slope/tilt, the recent deformation rate and the acceleration of the deformation rate. Finally, [ Peduto D et al, "Analysis of damage to buildings in urban centers on unstable slopes via TerraSAR-X PSI data: the case Study of El Papiol Town (Spain)", IEEE Geoscience and Remote Sensing Letters, vol. 16, no.111, 1 November 2019 ] describes how to determine vulnerability/fragility curves using differential settlements of buildings based on persistent scatterers. The use of fragility curves for prioritization of interventions and maintenance works is proposed. All the prior art approaches discussed above are all linked to human interpretations of the results of the several proposed analyses and, as such, are dependent on the operator's empirical decision that manually compares the present results with previously acquired data. - The object of the present invention is, therefore, to provide a system that allows for automatically detecting pre-critical remotely-sensed movements of territories and infrastructure, so to proceed with the field inspection only of those portions of infrastructures or territories that are in pre-critical status, giving the precedence to those that are in a higher concern situation.
- To this aim the system of the present invention comprises an arithmetic device configured to process the multi-temporal interferometry ground motion maps by dividing them into areas and calculating a score indicative of the criticality of the situation for each of said areas and, therefore, of their priority of inspection. In this way, the arithmetic device can, then, rank the areas on the basis of their indices and, automatically, classify them in risk classes by using a neural network algorithm.
- More particularly, the above-mentioned arithmetic device is configured to execute:
- processing of importing displacement measurement data derived from multi-temporal interferometry measurements of satellite SAR data on the location of the objects to be monitored;
- processing of importing at least one information data record about the objects, said information data being selected from the group consisting of: location, geometry, material, size, age, topology, function, past failures, service levels, traffic data, geology, geomorphology, digital elevation model, slope and aspect;
- processing of subdividing the objects into a plurality of elementary units, each of said unit comprising a plurality of persistent scatterers and/or distributed scatterers;
- calculating a coherence value for each of the persistent scatterers and/or distributed scatterers;
- calculating a first quantity value for each of the persistent scatterers and/or distributed scatterers, said first quantity being dependent on the coherence value;
- processing of selecting the scatterers having a first quantity value above a fixed threshold, thus obtaining a set of selected scatterers for each elementary unit;
- calculating at least a score for each elementary unit;
- processing of determining the priority of inspection of each unit based on the score; and
- processing of displaying information on the score of each unit and/or a result of the determining of the priority of inspection on an output device.
- For the sake of the present description and, as known in the field, the "persistent scatterers", or PS, are single scatterers on the ground showing high temporal phase stability in the entire data stack and that are minimally affected by temporal and geometrical decorrelation.
- The "distributed scatterers", o DS, are, instead, groups of different small scatterers on the ground showing constant reflection over time, with moderate coherence and medium-to-low signal-to-noise ratio, due to temporal and spatial decorrelation. More particularly, the persistent scatterers correspond to artificial or natural elements existing on the Earth's surface, e.g., buildings, monuments, roadways, railways, antennas, electric towers or rocks, debris slopes. Their return signal (backscatter) is characterized by high stability over time. The radar can measure the distance between the sensor and the target every time it flies over it.
- While the persistent scatterers have a high signal-to-noise ratio, the distributed scatterers have a medium-to-low signal-to-noise ratio. To be considered as a unique target, they have to be numerous and close to each other, and they have to exhibit the same backscatter signal.
- Preferably, the interimage coherence can be calculated, as not limiting example, as the sum over the images of the residual between actual and modelled phase trends, the model phase being the sum of all the contributions due to APS (Atmospheric Phase Screen), DEM (Digital Elevetion Model) error, and displacement. [ Bovenga, Fabio & Refice, Alberto & Nutricato, Raffaele & Guerriero, Luciano & Chiaradia, Mt. (2005). SPINUA: a flexible processing chain for ERS/ENVISAT long term interferometry. Proceedings of ESA-ENVISAT Symposium, Salzburg, Austria. 6-10 ]. Hence, the coherence is, directly connected to persistent and distributed scatterers quality: the higher the coherence, the lower the uncertainty of the measured backscatter signal. For this reason and as further detailed below, the coherence value for each of the persistent scatterers and/or distributed scatterers was processed to obtain a normalized value of the same and used for selecting only the scatterers having high signal reliability.
- The calculating the score comprises:
- calculating at least a second quantity dependent on the displacement for each selected scatterer so as to obtain a second quantity value for each selected scatterer;
- calculating, for each unit, a mean of the second quantity value of the selected scatterers inside the unit, so as to obtain a second quantity mean for each unit;
- calculating a maximum value of the second quantity means of the units, thus obtaining a second quantity mean maximum; and
- dividing the second quantity mean of each unit by the second quantity mean maximum, thus obtaining the score.
- Alternatively, the calculating the score can comprise:
- calculating, for each unit the absolute value of the difference between the second quantity value of each selected scatterer inside the unit and the second quantity mean of each unit, so as to obtain a second quantity difference value for each selected scatterer;
- selecting the selected scatterers having the second quantity difference value higher than a fixed threshold, thus obtaining a set of subselected scatterers for each elementary unit (the selection of subselected scatterers is based on statistical tests; i.e. only the selected scatterers having the absolute value that is statistically significantly higher than the second quantity mean of the unit are chosen as subselected scatterers);
- calculating, for each unit, a mean of the second quantity difference values among the subselected scatterers inside the unit, so as to obtain a second quantity difference mean for each unit;
- calculating a maximum value of the second quantity difference mean of the units, thus obtaining a second quantity difference mean maximum;
- dividing the second quantity difference mean of each unit by the second quantity difference mean maximum, thus obtaining a second quantity difference ratio;
- calculating a maximum value of the second quantity means of the units, thus obtaining a second quantity mean maximum;
- dividing the second quantity mean of each unit by the second quantity mean maximum, thus obtaining a second quantity ratio;
- summing the second quantity ratio and the second quantity difference ratio, thus obtaining a sum value; and
- calculating a ratio between the sum value of the unit and the maximum value of the sum value among the elementary units, thus obtaining the score of the unit.
- The processing of determining the priority of inspection of each unit based on the score can comprise ranking the scores of the units and/or classifying the units based on the scores in one of the following risk classes:
- high risk, if the score is higher than an upper score threshold;
- intermediate risk, if the score is comprised between a lower score threshold and the upper score threshold; and
- low risk, if the score is lower than the lower score threshold.
- The displaying information can, thus, comprise displaying the scores and/or the risk classes of each unit. Color mapping of the scores or the risk classes of each unit on satellite images of the object can also be part of the displaying information.
- The proposed score can be calculated for the displacement measurements derived from multi-temporal interferometry measurements of satellite SAR data acquired in both ascending and descending mode. In this case, i.e. when data of both types of acquiring mode are employed, the calculating the score, described above, can be replicated for ascending mode and descending mode data, so as to obtain for each unit, a first score, resulting from SAR data acquired in ascending mode, and a second score, resulting from SAR data acquired in descending mode. The calculating the score, therefore, will further comprise:
- comparing, for each unit, the first score and the second score;
- calculating, for each unit, a final score, the final score being equal to the first score, if the first score is higher than the second score, and to the second score, if the second score is higher than the first score.
- The processing of determining the priority of inspection of each unit will be based on the final score and comprise ranking the final scores of the units and/or classifying the units based on the final scores in one of the following risk classes:
- high risk, if the final score is higher than a upper final score threshold;
- intermediate risk, if the final score is comprised between a lower final score threshold and the upper final score threshold; and
- low risk, if the final score is lower than the lower final score threshold.
- A second object of the present invention is, then, to provide a method that allows for detecting pre-critical remotely-sensed movements of territories and infrastructure, so to proceed with the field inspection only of those portions of infrastructures or territories that are in pre-critical status, giving the precedence to those that are in a higher concern situation.
- Such a method comprises:
- importing displacement measurement data derived from multi-temporal interferometry measurement of satellite SAR data over the objects to be monitored;
- importing at least one information data record about the objects, said information data being selected from the group consisting of: location, geometry, material, size, age, topology, function, past failures, service levels, traffic data, geology, geomorphology, digital elevation model, slope and aspect;
- subdividing the objects into a plurality of elementary units, each of said unit comprising a plurality of persistent scatterers and/or distributed scatterers;
- calculating a coherence value for each of the persistent scatterers and/or distributed scatterers;
- calculating a first quantity value for each of the persistent scatterers and/or distributed scatterers, said first quantity being dependent on the coherence value;
- selecting the scatterers having a first quantity value above a fixed threshold, thus obtaining a set of selected scatterers for each elementary unit;
- calculating at least a score for each elementary unit;
- determining the priority of inspection of each unit based on the score; and
- displaying information on the score of each unit and/or a result of the determining of the priority of inspection.
- The step of calculating the score comprises:
- calculating at least a second quantity dependent on the displacement for each selected point so as to obtain a second quantity value for each selected point;
- calculating, for each unit, a mean of the second quantity value of the selected scatterers inside the unit, so as to obtain a second quantity mean for each unit;
- calculating a maximum value of the second quantity means of the units, thus obtaining a second quantity mean maximum; and
- dividing the second quantity mean of each unit by the second quantity mean maximum, thus obtaining the score;
- Alternatively, the step of calculating the score can comprise:
- calculating, for each unit the absolute value of the difference between the second quantity value of each selected scatterer inside the unit and the second quantity mean of each unit, so as to obtain a second quantity difference value for each selected scatterer;
- selecting the selected scatterers having the second quantity difference value higher than a fixed threshold, thus obtaining a set of subselected scatterers for each elementary unit (the selection of subselected scatterers is based on statistical tests; i.e. only the selected scatterers having the absolute value that is statistically significantly higher than the second quantity mean of the unit are chosen as subselected scatterers);
- calculating, for each unit, a mean of the second quantity difference values among the subselected scatterers inside the unit, so as to obtain a second quantity difference mean for each unit;
- calculating a maximum value of the second quantity difference mean of the units, thus obtaining a second quantity difference mean maximum;
- dividing the second quantity difference mean of each unit by the second quantity difference mean maximum, thus obtaining a second quantity difference ratio;
- calculating a maximum value of the second quantity means of the units, thus obtaining a second quantity mean maximum;
- dividing the second quantity mean of each unit by the second quantity mean maximum, thus obtaining a second quantity ratio;
- summing the second quantity ratio and the second quantity difference ratio, thus obtaining a sum value; and
- calculating a ratio between the sum value of the unit and the maximum value of the sum value among the elementary units, thus obtaining the score of the unit.
- As previously mentioned about the system that is the subject of the present invention, the processing of determining the priority of inspection of each unit based on the score comprise ranking the scores of the units and/or classifying the units assigning to them risk classes based on the scores and the displaying information can comprise displaying and or color mapping the scores and/or the risk classes of each unit. When data of both types of acquiring mode are employed, the calculating the score, described above, can be replicated for ascending mode and descending mode data, so as to obtain for each unit, a first score, resulting from SAR data acquired in ascending mode, and a second score, resulting from SAR data acquired in descending mode. The calculating the score, therefore, will further comprise:
- comparing, for each unit, the first score and the second score;
- calculating, for each unit, a final score, the final score being equal to the first score, if the first score is higher than the second score, and to the second score, if the second score is higher than the first score.
- In this case, the step of processing of determining the priority of inspection of each unit based on the score comprise ranking the final scores of the units and/or classifying the units based on the final scores and the step of displaying information can comprise displaying and or color mapping the final scores and/or the risk classes of each unit. These and further features of the present invention will be made clearer by the reading the following detailed description, relating to some preferred embodiments of the present invention, to be considered by way of a non-limiting example of the more general concepts claimed.
- The following description refers to the accompanying drawings, in which:
-
Figure 1 is a very high-resolution satellite image showing a linear infrastructure on which the elementary units are shown as superimposed to said image; -
Figure 2 is a very high-resolution satellite image showing a point infrastructure on which the elementary units are shown as superimposed to said image; -
Figure 3 is a very high-resolution satellite image showing a polygonal infrastructure on which the elementary units are shown as superimposed to said image; and -
Figure 4 is a very high-resolution image of a territory on which the elementary units are shown as superimposed to said image. - Referring to
Figure 1 , a first embodiment of the system of the present invention is specifically designed for determining the priority of inspection of the portions of a linear infrastructure (e.g. water networks, sewer networks, roadways, railways, etc.). The first embodiment of the system of the present invention comprising an arithmetic device that is configured to execute: - processing of importing displacement measurement data derived from multi-temporal interferometry measurements of satellite SAR data over the linear infrastructure to be monitored;
- processing of importing at least one information data record about the linear infrastructure, said information data being selected from the group consisting of: location, geometry, material, size, age, topology, function, past failures, service levels, traffic data;
- processing of subdividing the linear infrastructure into a plurality of elementary units (1, 1', 1"), each of said unit (1, 1', 1") comprising a plurality of persistent scatterers and/or distributed scatterers;
- calculating a coherence value for each of the persistent scatterers and/or distributed scatterers; and
- calculating a normalized coherence (NC) value for each of the persistent scatterers and/or distributed scatterers.
- An elementary unit (1, 1', 1") is defined as is an area surrounding a segment of the infrastructure, the segment having a length comprised between 90 m and 110 and the area comprising all the scatterers having a linear distance from that segment comprised between 90 m or 110 m, or comprised between 10 m and 30 m.
- If the coherence of that scatterer is higher than a coherence threshold (SC), the normalized coherence (NC) of a scatterer is given by the following equation:


- Finally, if the coherence of that scatterer is equal to the coherence threshold (SC), the normalized coherence (NC) is, then, given by the following equation:

- As known, the coherence threshold (SC) is computed by the multi-temporal interferometry analysis as the value obtained with a Monte Carlo simulation.
- The arithmetic device is further configured to execute:
- processing of selecting the scatterers having a normalized coherence above a fixed threshold comprised between 0.4 and 0.6, thus obtaining a set of selected scatterers for each elementary unit (1, 1', 1");
- calculating at least a score for each elementary unit (1, 1', 1");
- determining the priority of inspection of each unit (1, 1', 1") by ranking the score of the units (1, 1', 1") and/or by classifying the units (1,1', 1") based on the scores in risk classes; and
- processing of displaying information on the score of each unit (1, 1', 1") and/or a result of the determining of the priority of inspection on an output device.
- The calculating at least a score for each elementary unit (1, 1', 1") comprises:
- calculating the velocity of each selected scatterer;
- calculating, for each unit (1, 1', 1"), a mean of the velocity selected scatterers inside the unit (1, 1', 1"), so as to obtain a velocity mean for each unit (1, 1', 1");
- calculating, for each unit (1, 1', 1") the absolute value of the difference between the velocity value of each selected scatterer inside the unit (1, 1', 1") and the velocity mean of each unit (1, 1', 1"), so as to obtain a velocity difference value for each selected scatterer;
- selecting the selected scatterers having the velocity difference value higher than a fixed threshold, thus obtaining a set of subselected scatterers for each elementary unit (1, 1', 1");
- calculating, for each unit (1, 1', 1"), a mean of the velocity difference values among the subselected scatterers inside the unit (1, 1', 1"), so as to obtain a velocity difference mean for each unit (1, 1', 1");
- calculating a maximum value of the velocity difference mean of the units (1, 1', 1"), thus obtaining a velocity difference mean maximum;
- dividing the velocity difference mean of each unit (1, 1', 1") by the velocity difference mean maximum, thus obtaining a velocity difference ratio;
- calculating a maximum value of the velocity means of the units (1, 1', 1"), thus obtaining a velocity mean maximum;
- dividing the velocity mean of each unit (1, 1', 1") by the velocity mean maximum, thus obtaining a velocity ratio;
- summing the velocity ratio and the velocity difference ratio, thus obtaining a sum value; and
- calculating a ratio between the sum value of the unit (1, 1', 1") and the maximum value of the sum value among the elementary units (1, 1', 1"), thus obtaining the score of the unit (1, 1', 1").
- Alternatively to the velocity, other quantities can be used. For example, it can be used the product of the velocity of a given scatterer and the density of the selected scatterers inside the elementary unit (1, 1', 1") containing that scatterer.
- The arithmetic device is configured to execute determining the priority of inspection of each unit (1, 1', 1") by classifying the units (1, 1', 1") based on the scores, by means of a neural network algorithm using the scores of the units (1, 1', 1") as input. The scores of the units (1, 1', 1") are calculated using the velocities or the scatterers and/or the product of the velocities of the scatterers per the density of the scatterers inside the unit (1, 1', 1"). The risk classes are:
- high risk, if the score is higher than an upper score threshold;
- intermediate risk, if the score is comprised between a lower score threshold and the upper score threshold; and
- low risk, if the score is lower than the lower score threshold.
- Even the acceleration of the scatterers can be used as quantity on which calculate the scores. In this case, the calculating at least a score for each elementary unit (1, 1', 1") comprises:
- calculating the acceleration of each selected scatterer;
- calculating, for each unit (1, 1', 1"), a mean of the acceleration selected scatterers inside the unit (1, 1', 1"), so as to obtain an acceleration mean for each unit (1, 1', 1");
- calculating, for each unit (1, 1', 1") the absolute value of the difference between the acceleration value of each selected scatterer inside the unit (1, 1', 1") and the acceleration mean of each unit (1, 1', 1"), so as to obtain an acceleration difference value for each selected scatterer;
- selecting the selected scatterers having the acceleration difference value higher than a fixed threshold, thus obtaining a set of subselected scatterers for each elementary unit (1, 1', 1");
- calculating, for each unit (1, 1', 1"), a mean of the acceleration difference values among the subselected scatterers inside the unit (1, 1', 1"), so as to obtain an acceleration difference mean for each unit (1, 1', 1");
- calculating a maximum value of the acceleration difference mean of the units (1, 1', 1"), thus obtaining an acceleration difference mean maximum;
- dividing the acceleration difference mean of each unit (1, 1', 1") by the acceleration difference mean maximum, thus obtaining an acceleration difference ratio;
- calculating a maximum value of the acceleration means of the units (1, 1', 1"), thus obtaining an acceleration mean maximum;
- dividing the acceleration mean of each unit (1, 1', 1") by the acceleration mean maximum, thus obtaining an acceleration ratio;
- summing the acceleration ratio and the acceleration difference ratio, thus obtaining a sum value; and
- calculating a ratio between the sum value of the unit (1, 1', 1") and the maximum value of the sum value among the elementary units (1, 1', 1"), thus obtaining the score of the unit (1, 1', 1").
- The scores obtained by using acceleration can be used alone in the processing of determining the priority of inspection or in combination with the scores obtained by using the velocity and/or the scores obtained by using the product between the density and the velocity.
- In the first case, the processing of determining the priority of inspection of each unit (1, 1', 1") based on the score comprises ranking the scores of the units (1, 1', 1") and classifying the units (1, 1', 1"), said scores being calculated on the basis of the acceleration.
- In the second case, the processing of determining the priority of inspection comprises comparing, for each unit (1, 1', 1"), the score obtained by using the acceleration, the score calculated on the basis of the velocity and the score obtained by using the product of the density and the velocity.
- For each unit (1, 1', 1"), a final score, is then selected as the score that is greater among the three calculated scores (acceleration, velocity, product of density and velocity, density per acceleration) and the ranking is performed on the final score. Moreover, also a fourth type of scores on the basis the product of the density and the acceleration can be calculated and compared with the others.
- The arithmetic device can, therefore, execute the step of classifying by means of a neural network algorithm using simultaneously all the types of scores as inputs.
- Moreover, as previously mentioned, all the proposed scores (based on velocity, product of density and velocity, acceleration and product of density and acceleration) can be calculated for the displacement measurements derived from multi-temporal interferometry measurements of satellite SAR data acquired in both ascending and descending mode.
- When only one score per unit (1, 1', 1") was calculated because only one quantity was used, said quantity being chosen among velocity, acceleration, density per velocity and density per acceleration, the calculating the score can be replicated for ascending mode and descending mode data, so as to obtain for each unit (1, 1', 1"), a first score, resulting from SAR data acquired in ascending mode, and a second score, resulting from SAR data acquired in descending mode. The calculating the score, therefore, will further comprise:
- comparing, for each unit (1, 1', 1"), the first score and the second score;
- calculating, for each unit (1, 1', 1"), a final score, the final score being equal to the first score, if the first score is higher than the second score, and to the second score, if the second score is higher than the first score.
- comparing, for each unit (1, 1', 1"), the first score and the second score; and
- calculating, for each unit, a partial final score relative to said quantity, the partial final score being equal to the first score, if the first score is higher than the second score, and to the second score, if the second score is higher than the first score.
- The partial final scores calculated for all the used quantities have, then, to be compared so as obtaining a total final score. To this aim, the latter is calculated as the higher partial final scores.
- Finally, in all the situations described above, the arithmetic device is further configured to execute processing of displaying information on the score and/or the risk classes of each unit (1, 1', 1"). The displaying information can comprise also the color mapping the scores and/or the risk classes of each unit (1, 1', 1") on satellite images of the linear infrastructure.
- Referring to
Figure 1 , a first embodiment of the method of the present invention, is designed for determining the priority of inspection of the portions of a linear infrastructure (e.g. water networks, sewer networks, roadways, railways, and comprises all the steps executed by the arithmetic device of the first embodiment of the system of the present invention. - Referring to
Figure 2 , a second embodiment of the system of the present invention is specifically designed for determining the priority of inspection of the portions of a polygonal infrastructure (e.g. buildings, settling tanks of wastewater of a treatment plant, etc.). - The second embodiment of the system of the present invention comprising an arithmetic device that is configured to execute:
- processing of importing displacement measurement data derived from multi-temporal interferometry measurements of satellite SAR data over the polygonal infrastructure to be monitored;
- processing of importing at least one information data record about the polygonal infrastructure, said information data being selected from the group consisting of: location, geometry, material, size, age, topology, function, geology, geomorphology, digital elevation model, slope and aspect;
- processing of subdividing the polygonal infrastructure into a plurality of elementary units (2, 2', 2"), each of said unit (2, 2', 2") comprising a plurality of persistent scatterers and/or distributed scatterers;
- calculating a coherence value for each of the persistent scatterers and/or distributed scatterers; and
- calculating a normalized coherence (NC) value for each of the persistent scatterers and/or distributed scatterers.
- An elementary unit (2, 2', 2") is defined as is an area surrounding a polygon ofthe infrastructure, the area comprising all the scatterers having a linear distance from that segment comprised between 90 m or 110 m, or comprised between 10 m and 30 m. If the coherence of that scatterer is higher than a coherence threshold (SC), the normalized coherence (NC) of a scatterer is given by the following equation:


- Finally, if the coherence of that scatterer is equal to the coherence threshold (SC), the normalized coherence (NC) is, then, given by the following equation:

- The coherence threshold (SC) is computed by the multi-temporal interferometry analysis as the value obtained with a Monte Carlo simulation.
- The arithmetic device that is further configured to execute:
- processing of selecting the scatterers having a normalized coherence above a fixed threshold comprised between 0.4 and 0.6, thus obtaining a set of selected scatterers for each elementary unit (2, 2', 2");
- calculating at least a score for each elementary unit (2, 2', 2");
- determining the priority of inspection of each unit (2, 2', 2") by ranking the score of the units (2, 2', 2") and/or by classifying the units (2, 2', 2") based on the scores in risk classes; and
- processing of displaying information on the score of each unit (2, 2', 2") and/or a result of the determining of the priority of inspection on an output device.
- The calculating at least a score for each elementary unit (2, 2', 2") comprises:
- calculating the velocity of each selected scatterer;
- calculating, for each unit (2, 2', 2"), a mean of the velocity selected scatterers inside the unit (2, 2', 2"), so as to obtain a velocity mean for each unit (2, 2', 2");
- calculating, for each unit (2, 2', 2") the absolute value of the difference between the velocity value of each selected scatterer inside the unit (2, 2', 2") and the velocity mean of each unit (2, 2', 2"), so as to obtain a velocity value for each selected scatterer;
- selecting the selected scatterers having the velocity difference value higher than a fixed threshold, thus obtaining a set of subselected scatterers for each elementary unit (2, 2', 2");
- calculating, for each unit (2, 2', 2"), a mean of the velocity difference values among the subselected scatterers inside the unit (2, 2', 2"), so as to obtain a velocity difference mean for each unit (2, 2', 2");
- calculating a maximum value of the velocity difference mean of the units (2, 2', 2"), thus obtaining a velocity difference mean maximum;
- dividing the velocity difference mean of each unit (2, 2', 2") by the velocity difference mean maximum, thus obtaining a velocity difference ratio;
- calculating a maximum value of the velocity means of the units (2, 2', 2"), thus obtaining a velocity mean maximum;
- dividing the velocity mean of each unit (2, 2', 2") by the velocity mean maximum, thus obtaining a velocity ratio;
- summing the velocity ratio and the velocity difference ratio, thus obtaining a sum value; and
- calculating a ratio between the sum value of the unit (2, 2', 2") and the maximum value of the sum value among the elementary units (2, 2', 2"), thus obtaining the score of the unit (2, 2', 2").
- Alternatively to the velocity, other quantities can be used. For example, the acceleration of the scatterers can be used as quantity, on the basis of which calculate the scores. In this case, the calculating at least a score for each elementary unit (2, 2', 2") comprises:
- calculating the acceleration of each selected scatterer;
- calculating, for each unit (2, 2', 2"), a mean of the acceleration selected scatterers inside the unit (2, 2', 2"), so as to obtain an acceleration mean for each unit (2, 2', 2");
- calculating, for each unit (2, 2', 2") the absolute value of the difference between the acceleration value of each selected scatterer inside the unit (2, 2', 2") and the acceleration mean of each unit (2, 2', 2"), so as to obtain an acceleration difference value for each selected scatterer;
- selecting the selected scatterers having the acceleration difference value higher than a fixed threshold, thus obtaining a set of subselected scatterers for each elementary unit (2, 2', 2");
- calculating, for each unit (2, 2', 2"), a mean of the acceleration difference values among the subselected scatterers inside the unit (2, 2', 2"), so as to obtain an acceleration difference mean for each unit (2, 2', 2");
- calculating a maximum value of the acceleration difference mean of the units (2, 2', 2"), thus obtaining an acceleration difference mean maximum;
- dividing the acceleration difference mean of each unit (2, 2', 2") by the acceleration difference mean maximum, thus obtaining an acceleration difference ratio;
- calculating a maximum value of the acceleration means of the units (2, 2', 2"), thus obtaining an acceleration mean maximum;
- dividing the acceleration mean of each unit (2, 2', 2") by the acceleration mean maximum, thus obtaining an acceleration ratio;
- summing the acceleration ratio and the acceleration difference ratio, thus obtaining a sum value; and
- calculating a ratio between the sum value of the unit (2, 2', 2") and the maximum value of the sum value among the elementary units (2, 2', 2"), thus obtaining the score of the unit (2, 2', 2").
- The scores obtained using the acceleration can be used alone in the processing of determining the priority of inspection or in combination with the scores obtained by using the velocity.
- In the first case, the processing of determining the priority of inspection of each unit (2, 2', 2") based on the score comprises ranking the scores of the units (2, 2', 2") and classifying the units (2, 2', 2"), said scores being calculated on the basis of the acceleration.
- In the second case, the processing of determining the priority of inspection comprises comparing, for each unit (2, 2', 2"), the score obtained by using the acceleration and the score calculated on the basis of the velocity.
- For each unit (2, 2', 2"), a final score, is then selected as the score that is greater among the three calculated scores (acceleration, velocity) and the ranking is performed on the final score.
- The arithmetic device can, therefore, execute the step of classifying by means of a neural network algorithm using simultaneously all the types of scores as inputs. Moreover, as previously mentioned, all the proposed scores (based on velocity and acceleration) can be calculated for the displacement measurements derived from multi-temporal interferometry measurements of satellite SAR data acquired in both ascending and descending mode.
- When only one score per unit (2, 2', 2") was calculated because only one quantity was used, said quantity being chosen among velocity and acceleration, the calculating the score can be replicated for ascending mode and descending mode data, so as to obtain for each unit (2, 2', 2"), a first score, resulting from SAR data acquired in ascending mode, and a second score, resulting from SAR data acquired in descending mode. The calculating the score, therefore, will further comprise:
- comparing, for each unit (2, 2', 2"), the first score and the second score;
- calculating, for each unit (2, 2', 2"), a final score, the final score being equal to the first score, if the first score is higher than the second score, and to the second score, if the second score is higher than the first score.
- comparing, for each unit (2, 2', 2"), the first score and the second score; and
- calculating, for each unit (2, 2', 2"), a partial final score relative to said quantity, the partial final score being equal to the first score, if the first score is higher than the second score, and to the second score, if the second score is higher than the first score.
- The partial final scores calculated for all the used quantities have, then, to be compared so as obtaining a total final score. To this aim, the latter is calculated as the higher partial final scores.
- Finally, in all the situations described above, the arithmetic device is further configured to execute processing of displaying information on the score and/or on the risk classes of each unit (2, 2', 2"). The displaying information can comprise also the color mapping of the scores and/or of the risk classes of each unit (2, 2', 2") on satellite images of the polygonal infrastructure.
- Referring to
Figure 2 , a second embodiment of the method of the present invention, is designed for determining the priority of inspection of the portions of a polygonal infrastructure (e.g. buildings, settling tanks of wastewater of a treatment plant, etc.) and comprises all the steps executed by the arithmetic device of the second embodiment of the system of the present invention. - Referring to
Figure 3 , a third embodiment of the system of the present invention is specifically designed for determining the priority of inspection of the portions of a point infrastructure (e.g. electrical towers, etc.). - The third embodiment of the system of the present invention comprising an arithmetic device that is configured to execute:
- processing of importing displacement measurement data derived from multi-temporal interferometry measurements of satellite SAR data over the point infrastructure to be monitored;
- processing of importing at least one information data record about the point infrastructure, said information data being selected from the group consisting of: location, geometry, material, size, age, topology, function, past failures, service levels, geology, geomorphology, digital elevation model, slope and aspect;
- processing of subdividing the point infrastructure into a plurality of elementary units (3, 3', 3"), each of said unit (3, 3', 3") comprising a plurality of persistent scatterers and/or distributed scatterers;
- calculating a coherence value for each of the persistent scatterers and/or distributed scatterers; and
- calculating a normalized coherence (NC) value for each of the persistent scatterers and/or distributed scatterers.
- An elementary unit (3, 3', 3") is defined as circular area centred in a point of the infrastructure, the area having a radius of length comprised between 90 m or 110 m, or comprised between 10 m and 30 m.
- If the coherence of that scatterer is higher than a coherence threshold (SC), the normalized coherence (NC) of a scatterer is given by the following equation:


- Finally, if the coherence of that scatterer is equal to the coherence threshold (SC), the normalized coherence (NC) is, then, given by the following equation:

- The coherence threshold (SC) is computed by the multi-temporal interferometry analysis as the value obtained with a Monte Carlo simulation.
- The arithmetic device that is further configured to execute:
- processing of selecting the scatterers having a normalized coherence above a fixed threshold comprised between 0.4 and 0.6, thus obtaining a set of selected scatterers for each elementary unit (3, 3', 3");
- calculating at least a score for each elementary unit (3, 3', 3");
- determining the priority of inspection of each unit (3, 3', 3") by ranking the score of the units (3, 3', 3") and/or by classifying the units (3, 3', 3") based on the scores in risk classes; and
- processing of displaying information on the score of each unit (3, 3', 3") and/or a result of the determining of the priority of inspection on an output device.
- The calculating at least a score for each elementary unit (3, 3', 3") comprises:
- calculating the velocity of each selected scatterer;
- calculating, for each unit (3, 3', 3"), a mean of the velocity selected scatterers inside the unit (3, 3', 3"), so as to obtain a velocity mean for each unit (3, 3', 3");
- calculating, for each unit (3, 3', 3") the absolute value of the difference between the velocity value of each selected scatterer inside the unit (3, 3', 3") and the velocity mean of each unit (3, 3', 3"), so as to obtain a velocity difference value for each selected scatterer;
- selecting the selected scatterers having the velocity difference value higher than a fixed threshold, thus obtaining a set of subselected scatterers for each elementary unit (3, 3", 3");
- calculating, for each unit (3, 3', 3"), a mean of the velocity difference values among the subselected scatterers inside the unit (3, 3', 3"), so as to obtain a velocity difference mean for each unit (3, 3', 3");
- calculating a maximum value of the velocity difference mean of the units (3, 3', 3"), thus obtaining a velocity difference mean maximum;
- dividing the velocity difference mean of each unit (3, 3', 3") by the velocity difference mean maximum, thus obtaining a velocity difference ratio;
- calculating a maximum value of the velocity means of the units (3, 3', 3"), thus obtaining a velocity mean maximum;
- dividing the velocity mean of each unit (3, 3', 3") by the velocity mean maximum, thus obtaining a velocity ratio;
- summing the velocity ratio and the velocity difference ratio, thus obtaining a sum value; and
- calculating a ratio between the sum value of the unit (3, 3', 3") and the maximum value of the sum value among the elementary units (3, 3', 3"), thus obtaining the score of the unit (3, 3', 3").
- Alternatively to the velocity, other quantities can be used. For example, the acceleration of the scatterers can be used as quantity on which calculate the scores. In this case, the calculating at least a score for each elementary unit (3, 3', 3") comprises:
- calculating the acceleration of each selected scatterer;
- calculating, for each unit (3, 3', 3"), a mean of the acceleration selected scatterers inside the unit (3, 3', 3"), so as to obtain an acceleration mean for each unit (3, 3', 3");
- calculating, for each unit (3, 3', 3") the absolute value of the difference between the acceleration value of each selected scatterer inside the unit (3, 3', 3") and the acceleration mean of each unit (3, 3', 3"), so as to obtain an acceleration difference value for each selected scatterer;
- selecting the selected scatterers having the acceleration difference value higher than a fixed threshold, thus obtaining a set of subselected scatterers for each elementary unit (3, 3", 3");
- calculating, for each unit (3, 3', 3"), a mean of the acceleration difference values among the subselected scatterers inside the unit (3, 3', 3"), so as to obtain a acceleration difference mean for each unit (3, 3', 3");
- calculating a maximum value of the acceleration difference mean of the units (3, 3', 3"), thus obtaining an acceleration difference mean maximum;
- dividing the acceleration difference mean of each unit (3, 3', 3") by the acceleration difference mean maximum, thus obtaining an acceleration difference ratio;
- calculating a maximum value of the acceleration means of the units (3, 3', 3"), thus obtaining an acceleration mean maximum;
- dividing the acceleration mean of each unit (3, 3', 3") by the acceleration mean maximum, thus obtaining an acceleration ratio;
- summing the acceleration ratio and the acceleration difference ratio, thus obtaining a sum value; and
- calculating a ratio between the sum value of the unit (3, 3', 3") and the maximum value of the sum value among the elementary units (3, 3', 3"), thus obtaining the score of the unit (3, 3', 3").
- The scores obtained using the acceleration can be used alone in the processing of determining the priority of inspection or in combination with the scores obtained by using the velocity.
- In the first case, the processing of determining the priority of inspection of each unit (3, 3', 3") based on the score comprises ranking the scores of the units (3, 3', 3") and classifying the units (3, 3', 3"), said scores being calculated on the basis of the acceleration.
- In the second case, the processing of determining the priority of inspection comprises comparing, for each unit (3, 3', 3"), the score obtained by using the acceleration and the score calculated on the basis of the velocity.
- For each unit (3, 3', 3"), a final score, is then selected as the score that is greater among the two calculated scores (acceleration, velocity) and the ranking is performed on the final score.
- The arithmetic device can, therefore, execute the step of classifying by means of a neural network algorithm using simultaneously all the types of scores as inputs. Moreover, as previously mentioned, all the proposed scores (based on velocity and acceleration) can be calculated for the displacement measurements derived from multi-temporal interferometry measurements of satellite SAR data acquired in both ascending and descending mode.
- When only one score per unit (3, 3', 3") was calculated because only one quantity was used, said quantity being chosen among velocity and acceleration, the calculating the score can be replicated for ascending mode and descending mode data, so as to obtain for each unit (3, 3', 3"), a first score, resulting from SAR data acquired in ascending mode, and a second score, resulting from SAR data acquired in descending mode. The calculating the score, therefore, will further comprise:
- comparing, for each unit (3, 3', 3"), the first score and the second score;
- calculating, for each unit (3, 3', 3"), a final score, the final score being equal to the first score, if the first score is higher than the second score, and to the second score, if the second score is higher than the first score.
- comparing, for each unit (3, 3', 3"), the first score and the second score; and
- calculating, for each unit (3, 3', 3"), a partial final score relative to said quantity, the partial final score being equal to the first score, if the first score is higher than the second score, and to the second score, if the second score is higher than the first score.
- The partial final scores calculated for all the used quantities have, then, to be compared so as obtaining a total final score. To this aim, the latter is calculated as the higher partial final scores.
- Finally, in all the situations described above, the arithmetic device is further configured to execute processing of displaying information on the score and/or the risk classes of each unit (3, 3', 3"). The displaying information can comprise also the color mapping of the scores and/or of the risk classes of each unit (3, 3', 3") on satellite images of the point infrastructure.
- Referring to
Figure 3 , a third embodiment of the method of the present invention, is designed for determining the priority of inspection of the portions of a point infrastructure (e.g. electrical towers, etc.) and comprises all the steps executed by the arithmetic device of the third embodiment of the system of the present invention. Referring toFigure 4 , a fourth embodiment of the method of the present invention is specifically designed for determining the priority of inspection of the portions of a territory. - The fourth embodiment of the system of the present invention comprising an arithmetic device that is configured to execute:
- processing of importing displacement measurement data derived from multi-temporal interferometry measurements of satellite SAR data over the territory to be monitored;
- processing of importing at least one information data record about the territory, said information data being selected from the group consisting of: location, geometry, geology, geomorphology, digital elevation model, slope and aspect;
- processing of subdividing the territory into a plurality of elementary units (4, 4', 4"), each of said unit (4, 4', 4") comprising a plurality of persistent scatterers and/or distributed scatterers;
- calculating a coherence value for each of the persistent scatterers and/or distributed scatterers; and
- calculating a normalized coherence (NC) value for each of the persistent scatterers and/or distributed scatterers.
- An elementary unit (4, 4', 4") is defined as a circular shaped or polygonal shaped (e.g. square-shaped or hexagon-shaped) area, the plurality of the elementary units (4, 4', 4") forming a grid covering the territory. The size and placement of each area are defined using horizontal and vertical spacing, both ranging between 30 and 300 m. If the coherence of that scatterer is higher than a coherence threshold (SC), the normalized coherence (NC) of a scatterer is given by the following equation:


- Finally, if the coherence of that scatterer is equal to the coherence threshold (SC), the normalized coherence (NC) is, then, given by the following equation:

- The coherence threshold (SC) is computed by the multi-temporal interferometry analysis as the value obtained with a Monte Carlo simulation.
- The arithmetic device that is further configured to execute:
- processing of selecting the scatterers having a normalized coherence above a fixed threshold comprised between 0.4 and 0.6, thus obtaining a set of selected scatterers for each elementary unit (4, 4', 4");
- calculating at least a score for each elementary unit (4, 4', 4");
- determining the priority of inspection of each unit (4, 4', 4") by ranking the score of the units (4, 4', 4") and/or by classifying the units (4, 4', 4") based on the scores in risk classes; and
- processing of displaying information on the score of each unit (4, 4', 4") and/or a result of the determining of the priority of inspection on an output device.
- The calculating at least a score for each elementary unit (4, 4', 4") comprises:
- calculating the velocity of each selected scatterer;
- calculating, for each unit (4, 4', 4"), a mean of the velocity selected scatterers inside the unit (4, 4', 4"), so as to obtain a velocity mean for each unit (4, 4', 4");
- calculating, for each unit (4, 4', 4") the absolute value of the difference between the velocity value of each selected scatterer inside the unit (4,4', 4") and the velocity mean of each unit (4, 4', 4"), so as to obtain a velocity difference value for each selected scatterer;
- selecting the selected scatterers having the velocity difference value higher than a fixed threshold, thus obtaining a set of subselected scatterers for each elementary unit (4, 4', 4");
- calculating, for each unit (4, 4', 4"), a mean of the velocity difference values among the subselected scatterers inside the unit (4, 4', 4"), so as to obtain a velocity difference mean for each unit (4, 4', 4");
- calculating a maximum value of the velocity difference mean of the units (4, 4', 4"), thus obtaining a velocity difference mean maximum;
- dividing the velocity difference mean of each unit (4, 4', 4") by the velocity difference mean maximum, thus obtaining a velocity difference ratio;
- calculating a maximum value of the velocity means of the units (4, 4', 4"), thus obtaining a velocity mean maximum;
- dividing the velocity mean of each unit (4, 4', 4") by the velocity mean maximum, thus obtaining a velocity ratio;
- summing the velocity ratio and the velocity difference ratio, thus obtaining a sum value; and
- calculating a ratio between the sum value of the unit (4, 4', 4") and the maximum value of the sum value among the elementary units (4, 4', 4"), thus obtaining the score of the unit (4, 4', 4").
- Alternatively to the velocity, other quantities can be used such as the product of the velocity of a given scatterer and the density of the selected scatterers of the elementary unit (4, 4', 4") containing that scatterer.
- The scores obtained using the product of the density per the velocity can be used alone in the processing of determining the priority of inspection or in combination with the scores obtained by using the velocity.
- In the first case, the processing of determining the priority of inspection of each unit (4, 4', 4") based on the score comprises ranking the scores of the units (4, 4', 4") and classifying the units (4, 4', 4"), said scores being calculated on the basis of the density per velocity.
- In the second case, the processing of determining the priority of inspection comprises comparing, for each unit (4, 4', 4"), the score obtained by using the density per velocity and the score calculated on the basis of the velocity.
- For each unit (4, 4', 4"), a final score, is then selected as the score that is greater among the two calculated scores (velocity, density per velocity) and the ranking is performed on the final score.
- The arithmetic device can, therefore, execute the step of classifying by means of a neural network algorithm using simultaneously all the types of scores as inputs. Moreover, as previously mentioned, all the proposed scores (based on velocity and density per velocity) can be calculated for the displacement measurements derived from multi-temporal interferometry measurements of satellite SAR data acquired in both ascending and descending mode.
- When only one score per unit (4, 4', 4") was calculated because only one quantity was used, said quantity being chosen among velocity and density per velocity, the calculating the score can be replicated for ascending mode and descending mode data, so as to obtain for each unit (4, 4', 4"), a first score, resulting from SAR data acquired in ascending mode, and a second score, resulting from SAR data acquired in descending mode. The calculating the score, therefore, will further comprise:
- comparing, for each unit (4, 4', 4"), the first score and the second score;
- calculating, for each unit (4, 4', 4"), a final score, the final score being equal to the first score, if the first score is higher than the second score, and to the second score, if the second score is higher than the first score.
- comparing, for each unit (4, 4', 4"), the first score and the second score; and
- calculating, for each unit (4, 4', 4"), a partial final score relative to said quantity, the partial final score being equal to the first score, if the first score is higher than the second score, and to the second score, if the second score is higher than the first score.
- The partial final scores calculated for all the used quantities have, then, to be compared so as obtaining a total final score. To this aim, the latter is calculated as the higher partial final scores.
- Finally, in all the situations described above, the arithmetic device is further configured to execute processing of displaying information on the score and/or the risk classes of each unit (4, 4', 4"). The displaying information can comprise also the color mapping of the scores and/or of the risk classes of each unit (4, 4', 4") on satellite images of the territory.
- Referring to
Figure 4 , a fourth embodiment of the method of the present invention, is designed for determining the priority of inspection of the portions of a territory and comprises all the steps executed by the arithmetic device of the fourth embodiment of the system of the present invention.
Claims (17)
- A system for determining the priority of inspection of environmental and man-made objects of the earth's surface comprising an arithmetic device that is configured to execute:- processing of importing displacement measurement data derived from multi-temporal interferometry measurements of satellite SAR data over the objects to be monitored;- processing of importing at least one information data record about the objects, said information data being selected from the group consisting of: location, geometry, material, size, age, topology, function, past failures, service levels, traffic data, geology, geomorphology, digital elevation model, slope and aspect;- processing of subdividing the objects into a plurality of elementary units (1, 1', 1", 2, 2', 2", 3, 3", 3", 4, 4', 4"), each of said unit (1, 1', 1", 2, 2', 2", 3, 3", 3", 4, 4', 4") comprising a plurality of persistent scatterers and/or distributed scatterers;- calculating a coherence value for each of the persistent scatterers and/or distributed scatterers;- calculating a first quantity value for each of the persistent scatterers and/or distributed scatterers, said first quantity being dependent on the coherence value;- processing of selecting the scatterers having a first quantity value above a fixed threshold, thus obtaining a set of selected scatterers for each elementary unit (1, 1', 1", 2, 2', 2", 3, 3", 3", 4, 4', 4");- calculating at least a score for each elementary unit (1, 1', 1", 2, 2', 2", 3, 3", 3", 4, 4', 4");- determining the priority of inspection of each unit (1, 1', 1", 2, 2', 2", 3, 3", 3", 4, 4', 4") by ranking the score of the units (1, 1', 1", 2, 2', 2", 3, 3", 3", 4, 4', 4") and/or by classifying the units (1, 1', 1", 2, 2', 2", 3, 3", 3", 4,4', 4") based on the scores in risk classes;• and- processing of displaying information on the score of each unit (1, 1', 1", 2, 2', 2", 3, 3", 3", 4, 4', 4") and/or a result of the determining of the priority of inspection on an output device;characterized in that the calculating the score comprises:- calculating at least a second quantity dependent on the displacement for each selected scatterer so as to obtain a second quantity value for each selected scatterer;- calculating, for each unit (1, 1', 1", 2, 2', 2", 3, 3", 3", 4, 4', 4"), a mean of the second quantity value of the selected scatterers inside the unit (1, 1', 1", 2, 2', 2", 3, 3", 3", 4,4', 4"), so as to obtain a second quantity mean for each unit (1, 1', 1", 2, 2', 2", 3, 3", 3", 4, 4', 4"); and- performing the following steps:• calculating a maximum value of the second quantity means of the units (1, 1', 1", 2, 2', 2", 3, 3", 3", 4, 4', 4"), thus obtaining a second quantity mean maximum; and• dividing the second quantity mean of each unit (1, 1', 1", 2, 2', 2", 3, 3", 3", 4, 4', 4") by the second quantity mean maximum, thus obtaining the score.or• calculating, for each unit (1, 1', 1", 2, 2', 2", 3, 3', 3", 4, 4', 4") the absolute value of the difference between the second quantity value of each selected scatterer inside the unit (1, 1', 1", 2, 2', 2", 3, 3', 3", 4, 4', 4") and the second quantity mean of each unit (1, 1', 1", 2, 2', 2", 3, 3', 3", 4, 4', 4"), so as to obtain a second quantity difference value for each selected scatterer;• selecting the selected scatterers having the second quantity difference value higher than a fixed threshold, thus obtaining a set of subselected scatterers for each elementary unit (1, 1', 1", 2, 2', 2", 3, 3", 3", 4, 4', 4");• calculating, for each unit (1, 1', 1", 2, 2', 2", 3, 3", 3", 4, 4', 4"), a mean of the second quantity difference values among the subselected scatterers inside the unit (1, 1', 1", 2, 2', 2", 3, 3", 3", 4, 4', 4"), so as to obtain a second quantity difference mean for each unit (1, 1', 1", 2, 2', 2", 3, 3", 3", 4, 4', 4");• calculating a maximum value of the second quantity difference mean of the units (1, 1', 1", 2, 2', 2", 3, 3", 3", 4, 4', 4"), thus obtaining a second quantity difference mean maximum;• dividing the second quantity difference mean of each unit (1, 1', 1", 2, 2', 2", 3, 3", 3", 4, 4', 4") by the second quantity difference mean maximum, thus obtaining a second quantity difference ratio;• calculating a maximum value of the second quantity means of the units (1, 1', 1", 2, 2', 2", 3, 3", 3", 4, 4', 4"), thus obtaining a second quantity mean maximum;• dividing the second quantity mean of each unit (1, 1', 1", 2, 2', 2", 3, 3", 3", 4, 4', 4") by the second quantity mean maximum, thus obtaining a second quantity ratio;• summing the second quantity ratio and the second quantity difference ratio, thus obtaining a sum value; and• calculating a ratio between the sum value of the unit (1, 1', 1", 2, 2', 2", 3, 3", 3", 4, 4', 4") and the maximum value of the sum value among the elementary units (1, 1', 1", 2, 2', 2", 3, 3", 3", 4, 4', 4"), thus obtaining the score of the unit (1, 1', 1", 2, 2', 2", 3, 3", 3", 4, 4', 4").
- The system according to claim 1 wherein the first quantity (NC) value of a scatterer is given by the following equation, if the coherence value of that scatterer is higher than a coherence threshold (SC):
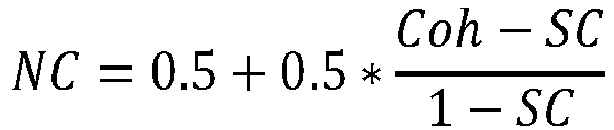


- The system according to claim 1 or 2 wherein said fixed threshold is comprised between 0.4 and 0.6.
- The system according to any of the claims from 1 to 3 wherein the second quantity for each selected scatterer is the velocity of that scatterer.
- The system according to any of the claims from 1 to 3 wherein the second quantity for each selected scatterer is a product of the velocity of that scatterer and the density of the selected scatterers of the elementary unit (1, 1', 1", 4, 4', 4") containing that scatterer.
- The system according to any of the claims from 1 to 3 wherein the second quantity is a product of the velocity of that scatterer and the density of those scatterers that belong to a subset of the selected scatterers in the elementary unit (1, 1', 1", 4, 4', 4") containing that scatterer.
- The system according to claim 6 wherein the subset comprises only those selected scatterers having a velocity exceeding the velocity mean in that unit (1, 1', 1", 4, 4', 4") of a given velocity threshold.
- The system according to any of the claims from 1 to 3 wherein the second quantity for each selected scatterer is the acceleration of that scatterer.
- The system according to claim 6 wherein the object is a linear infrastructure and the elementary unit (1, 1', 1") is an area surrounding a segment of the infrastructure.
- The system according to any of the claims from 1 to 8 wherein the object is a point infrastructure and the elementary unit (3, 3", 3") is a circular area centred in a point of the infrastructure.
- The system according to any of the claims from 1 to 6 wherein the object is a polygonal infrastructure and the elementary unit (2, 2', 2") is an area surrounding a polygon of the infrastructure.
- The system according to any of the claims from 1 to 6 wherein the object is a territory and the elementary unit (4, 4', 4") is a circular shaped or polygonal shaped area, the plurality of the elementary units (4, 4', 4") forming a grid covering the territory.
- The system according to any of the preceding claims wherein the risk classes are:- high risk, if the score is higher than a upper score threshold;- intermediate risk, if the score is comprised between a lower score threshold and the upper score threshold; and- low risk, if the score is lower than the lower score threshold.
- The system according to the any of the previous claims wherein the arithmetic device is configured to execute determining the priority of inspection of each unit (1, 1', 1", 2, 2', 2", 3, 3", 3", 4, 4', 4") by classifying the units (1, 1', 1", 2, 2', 2", 3, 3", 3", 4, 4', 4") based on the scores, by means of a neural network algorithm using the scores of the units (1, 1', 1", 2, 2', 2", 3, 3', 3", 4, 4', 4") as input.
- The system according to claim 13 or 14 wherein the displaying information comprise displaying the scores and/or risk classes of each unit (1, 1', 1", 2, 2', 2", 3, 3", 3", 4, 4', 4").
- The system according the preceding claim wherein the processing of displaying information comprises color mapping the scores and/or risk classes of each unit (1, 1', 1", 2, 2', 2", 3, 3", 3", 4, 4', 4") on satellite images of the object.
- A method for determining the priority of inspection of environmental and man-made objects comprising:- importing displacement measurement data derived from multi-temporal interferometry measurement of satellite SAR data over the objects to be monitored;- importing at least one information data record about the objects, said information data being selected from the group consisting of: location, geometry, material, size, age, topology, function, past failures, service levels, traffic data, geology, geomorphology, digital elevation model, slope and aspect;- subdividing the objects into a plurality of elementary units (1, 1', 1", 2, 2', 2", 3, 3", 3", 4, 4', 4"), each of said unit (1, 1', 1", 2, 2', 2", 3, 3", 3", 4, 4', 4") comprising a plurality of persistent scatterers and/or distributed scatterers;- calculating a coherence value for each of the persistent scatterers and/or distributed scatterers;- calculating a first quantity value for each of the persistent scatterers and/or distributed scatterers, said first quantity being dependent on the coherence value;- selecting the scatterers having a first quantity value above a fixed threshold, thus obtaining a set of selected scatterers for each elementary unit (1, 1', 1", 2, 2', 2", 3, 3", 3", 4, 4', 4");- calculating at least a score for each elementary unit (1, 1', 1", 2, 2', 2", 3, 3", 3", 4, 4', 4");- determining the priority of inspection of each unit (1, 1', 1", 2, 2', 2", 3, 3", 3", 4, 4', 4") by ranking the score of the units (1, 1', 1", 2, 2', 2", 3, 3", 3", 4, 4', 4") and/or by classifying the units (1, 1', 1", 2, 2', 2", 3, 3", 3", 4, 4', 4") based on the scores in risk classes;• and- displaying information on the score of each unit (1, 1', 1", 2, 2', 2", 3, 3", 3", 4, 4', 4") and/or a result of the determining of the priority of inspection;characterized in that the calculating the score comprises:- calculating at least a second quantity dependent on the displacement for each selected scatterer so as to obtain a second quantity value for each selected scatterer;- calculating, for each unit (1, 1', 1", 2, 2', 2", 3, 3", 3", 4, 4', 4"), a mean of the second quantity value of the selected scatterers inside the unit (1, 1', 1", 2, 2', 2", 3, 3", 3", 4,4', 4"), so as to obtain a second quantity mean for each unit (1, 1', 1", 2, 2', 2", 3, 3", 3", 4, 4', 4"); and- performing the following steps:• calculating a maximum value of the second quantity means of the units, thus obtaining a second quantity mean maximum; and• dividing the second quantity mean of each unit (1, 1', 1", 2, 2', 2", 3, 3", 3", 4, 4', 4") by the second quantity mean maximum, thus obtaining the score.or• calculating, for each unit (1, 1', 1", 2, 2', 2", 3, 3', 3", 4, 4', 4") the absolute value of the difference between the second quantity value of each selected scatterer inside the unit (1, 1', 1", 2, 2', 2", 3, 3', 3", 4, 4', 4") and the second quantity mean of each unit (1, 1', 1", 2, 2', 2", 3, 3', 3", 4,4', 4"), so as to obtain a second quantity difference value for each selected scatterer;• selecting the selected scatterers having the second quantity difference value higher than a fixed threshold, thus obtaining a set of subselected scatterers for each elementary unit (1, 1', 1", 2, 2', 2", 3, 3", 3", 4, 4', 4");• calculating, for each unit (1, 1', 1", 2, 2', 2", 3, 3", 3", 4, 4', 4"), a mean of the second quantity difference values among the subselected scatterers inside the unit (1, 1', 1", 2, 2', 2", 3, 3", 3", 4, 4', 4"), so as to obtain a second quantity difference mean for each unit (1, 1', 1", 2, 2', 2", 3, 3", 3", 4, 4', 4");• calculating a maximum value of the second quantity difference mean of the units (1, 1', 1", 2, 2', 2", 3, 3", 3", 4, 4', 4"), thus obtaining a second quantity difference mean maximum;• dividing the second quantity difference mean of each unit (1, 1', 1", 2, 2', 2", 3, 3", 3", 4, 4', 4") by the second quantity difference mean maximum, thus obtaining a second quantity difference ratio;• calculating a maximum value of the second quantity means of the units (1, 1', 1", 2, 2', 2", 3, 3", 3", 4, 4', 4"), thus obtaining a second quantity mean maximum;• dividing the second quantity mean of each unit (1, 1', 1", 2, 2', 2", 3, 3", 3", 4, 4', 4 ") by the second quantity mean maximum, thus obtaining a second quantity ratio;• summing the second quantity ratio and the second quantity difference ratio, thus obtaining a sum value; and• calculating a ratio between the sum value of the unit (1, 1', 1", 2, 2', 2", 3, 3", 3", 4, 4', 4") and the maximum value of the sum value among the elementary units, thus obtaining the score of the unit (1, 1', 1", 2, 2', 2", 3, 3", 3", 4, 4', 4").
Applications Claiming Priority (1)
| Application Number | Priority Date | Filing Date | Title |
|---|---|---|---|
| EP21181986.7A EP4113167A1 (en) | 2021-06-28 | 2021-06-28 | System for determining the priority of inspection of satellite remotely sensed objects and method thereof |
Publications (3)
| Publication Number | Publication Date |
|---|---|
| EP4113158A1 true EP4113158A1 (en) | 2023-01-04 |
| EP4113158C0 EP4113158C0 (en) | 2025-11-12 |
| EP4113158B1 EP4113158B1 (en) | 2025-11-12 |
Family
ID=76695535
Family Applications (2)
| Application Number | Title | Priority Date | Filing Date |
|---|---|---|---|
| EP21181986.7A Withdrawn EP4113167A1 (en) | 2021-06-28 | 2021-06-28 | System for determining the priority of inspection of satellite remotely sensed objects and method thereof |
| EP22179844.0A Active EP4113158B1 (en) | 2021-06-28 | 2022-06-20 | System for determining the priority of inspection of satellite remotely sensed objects and method thereof |
Family Applications Before (1)
| Application Number | Title | Priority Date | Filing Date |
|---|---|---|---|
| EP21181986.7A Withdrawn EP4113167A1 (en) | 2021-06-28 | 2021-06-28 | System for determining the priority of inspection of satellite remotely sensed objects and method thereof |
Country Status (1)
| Country | Link |
|---|---|
| EP (2) | EP4113167A1 (en) |
Cited By (2)
| Publication number | Priority date | Publication date | Assignee | Title |
|---|---|---|---|---|
| CN117274342A (en) * | 2023-11-21 | 2023-12-22 | 中铁水利水电规划设计集团有限公司 | A deformation monitoring method for water conservancy projects based on satellite data |
| US12613332B2 (en) * | 2020-12-28 | 2026-04-28 | Nec Corporation | Information processing device, information processing method, and non-transitory computer-readable storage medium |
Citations (1)
| Publication number | Priority date | Publication date | Assignee | Title |
|---|---|---|---|---|
| CN109991601A (en) | 2018-11-29 | 2019-07-09 | 北京东方至远科技股份有限公司 | A kind of house methods of risk assessment based on PS-InSAR technology |
-
2021
- 2021-06-28 EP EP21181986.7A patent/EP4113167A1/en not_active Withdrawn
-
2022
- 2022-06-20 EP EP22179844.0A patent/EP4113158B1/en active Active
Patent Citations (1)
| Publication number | Priority date | Publication date | Assignee | Title |
|---|---|---|---|---|
| CN109991601A (en) | 2018-11-29 | 2019-07-09 | 北京东方至远科技股份有限公司 | A kind of house methods of risk assessment based on PS-InSAR technology |
Non-Patent Citations (10)
| Title |
|---|
| AMODIO ANGELO ET AL: "Rheticus Network Alert supporting critical infrastructures: a case study for ACEA - utility operator - within SCIRES project", 12� THEMED REMOTE SENSING WORKSHOP - THE ROLE OF COPERNICUS SENTINEL DATA IN KNOWLEDGE PROCESSES AND LAND MANAGEMENT: STATE OF THE ART OF TECHNOLOGY TRANSFER TO THE OPERATIONAL SECTOR - EXTENDED ABSTRACTS, 25 June 2019 (2019-06-25), pages 1 - 69, XP055971540, ISBN: 978-88-82863-77-7, Retrieved from the Internet <URL:https://www.enea.it/it/seguici/pubblicazioni/pdf-volumi/2019/atti_ait_2019_extended-abstracts.pdf> [retrieved on 20221014] * |
| BOVENGA, FABIOREFICE, ALBERTONUTRICATO, RAFFAELEGUERRIERO, LUCIANOCHIARADIA, MT.: "SPINUA: a flexible processing chain for ERS/ENVISAT long term interferometry", PROCEEDINGS OF ESA-ENVISAT SYMPOSIUM, 2005, pages 6 - 10 |
| NAPPO N. ET AL.: "Engineering Geology", vol. 260, 30 July 2019, ELSEVIER SCIENCE PUBLISHERS, article "Slow-moving landslides interacting with the road network: Analysis of damage using ancillary data, in situ surveys and multi-source monitoring data" |
| NAPPO NICOLETTA ET AL: "Slow-moving landslides interacting with the road network: Analysis of damage using ancillary data, in situ surveys and multi-source monitoring data", ENGINEERING GEOLOGY, ELSEVIER SCIENCE PUBLISHERS, AMSTERDAM, NL, vol. 260, 30 July 2019 (2019-07-30), XP085872964, ISSN: 0013-7952, [retrieved on 20190730], DOI: 10.1016/J.ENGGEO.2019.105244 * |
| PEDUTO D ET AL.: "Analysis of damage to buildings in urban centers on unstable slopes via TerraSAR-X PSI data: the case Study of El Papiol Town (Spain)", IEEE GEOSCIENCE AND REMOTE SENSING LETTERS, vol. 16, no. 111, 1 November 2019 (2019-11-01) |
| PEDUTO D ET AL.: "Empirical fragility and vulnerability curves for buildings exposed to slow-moving landslides at medium and large scales", LANDSLIDES, SPRINGER BERLIN HEIDELBERG BERLIN/HEIDELBERG, vol. 14, no. 6, 13 April 2017 (2017-04-13), XP036373065, DOI: 10.1007/s10346-017-0826-7 |
| PEDUTO D ET AL: "Analysis of Damage to Buildings in Urban Centers on Unstable Slopes via TerraSAR-X PSI Data: The Case Study of El Papiol Town (Spain)", IEEE GEOSCIENCE AND REMOTE SENSING LETTERS, IEEE, USA, vol. 16, no. 11, 1 November 2019 (2019-11-01), pages 1706 - 1710, XP011756150, ISSN: 1545-598X, [retrieved on 20191030], DOI: 10.1109/LGRS.2019.2907557 * |
| PEDUTO DARIO ET AL: "Empirical fragility and vulnerability curves for buildings exposed to slow-moving landslides at medium and large scales", LANDSLIDES, SPRINGER BERLIN HEIDELBERG, BERLIN/HEIDELBERG, vol. 14, no. 6, 13 April 2017 (2017-04-13), pages 1993 - 2007, XP036373065, ISSN: 1612-510X, [retrieved on 20170413], DOI: 10.1007/S10346-017-0826-7 * |
| PRATESI F. ET AL.: "Rating health and stability of engineering structures via classification indexes of InSAR Persistent Scatterers", INTERNATIONAL JOURNAL OF APPLIED EARTH OBSERVATION AND GEOINFORMATION, vol. 40, 22 April 2015 (2015-04-22), pages 81 - 90, XP029217791, DOI: 10.1016/j.jag.2015.04.012 |
| PRATESI FABIO ET AL: "Rating health and stability of engineering structures via classification indexes of InSAR Persistent Scatterers", INTERNATIONAL JOURNAL OF APPLIED EARTH OBSERVATION ANDGEOINFORMATION, ELSEVIER, AMSTERDAM, NL, vol. 40, 22 April 2015 (2015-04-22), pages 81 - 90, XP029217791, ISSN: 0303-2434, DOI: 10.1016/J.JAG.2015.04.012 * |
Cited By (3)
| Publication number | Priority date | Publication date | Assignee | Title |
|---|---|---|---|---|
| US12613332B2 (en) * | 2020-12-28 | 2026-04-28 | Nec Corporation | Information processing device, information processing method, and non-transitory computer-readable storage medium |
| CN117274342A (en) * | 2023-11-21 | 2023-12-22 | 中铁水利水电规划设计集团有限公司 | A deformation monitoring method for water conservancy projects based on satellite data |
| CN117274342B (en) * | 2023-11-21 | 2024-02-13 | 中铁水利水电规划设计集团有限公司 | Hydraulic engineering deformation monitoring method based on satellite data |
Also Published As
| Publication number | Publication date |
|---|---|
| EP4113158C0 (en) | 2025-11-12 |
| EP4113158B1 (en) | 2025-11-12 |
| EP4113167A1 (en) | 2023-01-04 |
Similar Documents
| Publication | Publication Date | Title |
|---|---|---|
| Abellán et al. | Detection and spatial prediction of rockfalls by means of terrestrial laser scanner monitoring | |
| Zhou et al. | Effect of vegetation cover on soil erosion in a mountainous watershed | |
| Scheidl et al. | The use of airborne LiDAR data for the analysis of debris flow events in Switzerland | |
| Deems et al. | Mapping starting zone snow depth with a ground-based lidar to assist avalanche control and forecasting | |
| JP2020020740A (en) | SAR image analysis system | |
| EP4113158B1 (en) | System for determining the priority of inspection of satellite remotely sensed objects and method thereof | |
| Schröder et al. | Permanent terrestrial LiDAR monitoring in mining, natural hazard prevention and infrastructure protection–Chances, risks, and challenges: A case study of a rockfall in Tyrol, Austria | |
| Rijal et al. | Detection of gullies in Fort Riley military installation using LiDAR derived high resolution DEM | |
| Chandarana et al. | Monitoring and predicting slope instability: a review of current practices from a mining perspective | |
| Bathrellos et al. | Landslide susceptibility assessment mapping: a case study in Central Greece | |
| Gigli et al. | Event scenario analysis for the design of rockslide countermeasures | |
| Polat et al. | Debris flow susceptibility and propagation assessment in West Koyulhisar, Turkey | |
| Fabbri et al. | Prediction rate functions of landslide susceptibility applied in the Iberian Peninsula | |
| Mohan et al. | Integrated geospatial, rainfall threshold and physical based modelling for landslides in parts of upper bhagirathi basin, Uttarakhand | |
| Hearn et al. | Landslide hazard mapping and risk assessment | |
| Foria et al. | Application of Spatial Multi-Criteria Analysis (SMCA) to assess rockfall hazard and plan mitigation strategies along long infrastructures | |
| WO2021199241A1 (en) | Analysis device, analysis method, and storage medium | |
| Fang et al. | Uncertainty analysis of predicted disturbance from off-road vehicular traffic in complex landscapes at Fort Hood | |
| Malinverni et al. | LiDAR-driven Topographic Surveys for Floodplain Management | |
| Jakubiak et al. | Rainfall estimates from radar vs. raingauge measurements. Warsaw case study | |
| Yu et al. | Digital terrain model extraction from airborne LiDAR data in complex mining area | |
| CN120411421B (en) | Intelligent permanent scatterer selection method and system for foundation slope monitoring radar | |
| Iannacone et al. | The role of InSAR in detecting and evaluating geotechnical risk from ground deformation | |
| Selvakumaran | Interferometric synthetic aperture radar for remote satellite monitoring of bridges | |
| Sung et al. | Method for setting flash flood risk criteria in unmeasured areas using the relationship between flood damage risk occurrence characteristics according to topographical characteristics |
Legal Events
| Date | Code | Title | Description |
|---|---|---|---|
| PUAI | Public reference made under article 153(3) epc to a published international application that has entered the european phase |
Free format text: ORIGINAL CODE: 0009012 |
|
| STAA | Information on the status of an ep patent application or granted ep patent |
Free format text: STATUS: THE APPLICATION HAS BEEN PUBLISHED |
|
| AK | Designated contracting states |
Kind code of ref document: A1 Designated state(s): AL AT BE BG CH CY CZ DE DK EE ES FI FR GB GR HR HU IE IS IT LI LT LU LV MC MK MT NL NO PL PT RO RS SE SI SK SM TR |
|
| STAA | Information on the status of an ep patent application or granted ep patent |
Free format text: STATUS: REQUEST FOR EXAMINATION WAS MADE |
|
| 17P | Request for examination filed |
Effective date: 20230630 |
|
| RBV | Designated contracting states (corrected) |
Designated state(s): AL AT BE BG CH CY CZ DE DK EE ES FI FR GB GR HR HU IE IS IT LI LT LU LV MC MK MT NL NO PL PT RO RS SE SI SK SM TR |
|
| GRAP | Despatch of communication of intention to grant a patent |
Free format text: ORIGINAL CODE: EPIDOSNIGR1 |
|
| STAA | Information on the status of an ep patent application or granted ep patent |
Free format text: STATUS: GRANT OF PATENT IS INTENDED |
|
| INTG | Intention to grant announced |
Effective date: 20250708 |
|
| GRAS | Grant fee paid |
Free format text: ORIGINAL CODE: EPIDOSNIGR3 |
|
| GRAA | (expected) grant |
Free format text: ORIGINAL CODE: 0009210 |
|
| STAA | Information on the status of an ep patent application or granted ep patent |
Free format text: STATUS: THE PATENT HAS BEEN GRANTED |
|
| AK | Designated contracting states |
Kind code of ref document: B1 Designated state(s): AL AT BE BG CH CY CZ DE DK EE ES FI FR GB GR HR HU IE IS IT LI LT LU LV MC MK MT NL NO PL PT RO RS SE SI SK SM TR |
|
| REG | Reference to a national code |
Ref country code: CH Ref legal event code: F10 Free format text: ST27 STATUS EVENT CODE: U-0-0-F10-F00 (AS PROVIDED BY THE NATIONAL OFFICE) Effective date: 20251112 Ref country code: GB Ref legal event code: FG4D |
|
| REG | Reference to a national code |
Ref country code: IE Ref legal event code: FG4D |
|
| REG | Reference to a national code |
Ref country code: DE Ref legal event code: R096 Ref document number: 602022024761 Country of ref document: DE |
|
| U01 | Request for unitary effect filed |
Effective date: 20251210 |
|
| U07 | Unitary effect registered |
Designated state(s): AT BE BG DE DK EE FI FR IT LT LU LV MT NL PT RO SE SI Effective date: 20251217 |
|
| PG25 | Lapsed in a contracting state [announced via postgrant information from national office to epo] |
Ref country code: ES Free format text: LAPSE BECAUSE OF FAILURE TO SUBMIT A TRANSLATION OF THE DESCRIPTION OR TO PAY THE FEE WITHIN THE PRESCRIBED TIME-LIMIT Effective date: 20251112 |
|
| PG25 | Lapsed in a contracting state [announced via postgrant information from national office to epo] |
Ref country code: NO Free format text: LAPSE BECAUSE OF FAILURE TO SUBMIT A TRANSLATION OF THE DESCRIPTION OR TO PAY THE FEE WITHIN THE PRESCRIBED TIME-LIMIT Effective date: 20260212 |
|
| PG25 | Lapsed in a contracting state [announced via postgrant information from national office to epo] |
Ref country code: HR Free format text: LAPSE BECAUSE OF FAILURE TO SUBMIT A TRANSLATION OF THE DESCRIPTION OR TO PAY THE FEE WITHIN THE PRESCRIBED TIME-LIMIT Effective date: 20251112 |
|
| PG25 | Lapsed in a contracting state [announced via postgrant information from national office to epo] |
Ref country code: RS Free format text: LAPSE BECAUSE OF FAILURE TO SUBMIT A TRANSLATION OF THE DESCRIPTION OR TO PAY THE FEE WITHIN THE PRESCRIBED TIME-LIMIT Effective date: 20260212 |
|
| PG25 | Lapsed in a contracting state [announced via postgrant information from national office to epo] |
Ref country code: IS Free format text: LAPSE BECAUSE OF FAILURE TO SUBMIT A TRANSLATION OF THE DESCRIPTION OR TO PAY THE FEE WITHIN THE PRESCRIBED TIME-LIMIT Effective date: 20260312 |
|
| PG25 | Lapsed in a contracting state [announced via postgrant information from national office to epo] |
Ref country code: PL Free format text: LAPSE BECAUSE OF FAILURE TO SUBMIT A TRANSLATION OF THE DESCRIPTION OR TO PAY THE FEE WITHIN THE PRESCRIBED TIME-LIMIT Effective date: 20251112 |