EP4109464A1 - Value-based advanced clinical benchmarking - Google Patents
Value-based advanced clinical benchmarking Download PDFInfo
- Publication number
- EP4109464A1 EP4109464A1 EP21180742.5A EP21180742A EP4109464A1 EP 4109464 A1 EP4109464 A1 EP 4109464A1 EP 21180742 A EP21180742 A EP 21180742A EP 4109464 A1 EP4109464 A1 EP 4109464A1
- Authority
- EP
- European Patent Office
- Prior art keywords
- healthcare
- health outcome
- healthcare delivery
- expected
- type
- Prior art date
- Legal status (The legal status is an assumption and is not a legal conclusion. Google has not performed a legal analysis and makes no representation as to the accuracy of the status listed.)
- Pending
Links
Images


Classifications
-
- G—PHYSICS
- G16—INFORMATION AND COMMUNICATION TECHNOLOGY [ICT] SPECIALLY ADAPTED FOR SPECIFIC APPLICATION FIELDS
- G16H—HEALTHCARE INFORMATICS, i.e. INFORMATION AND COMMUNICATION TECHNOLOGY [ICT] SPECIALLY ADAPTED FOR THE HANDLING OR PROCESSING OF MEDICAL OR HEALTHCARE DATA
- G16H40/00—ICT specially adapted for the management or administration of healthcare resources or facilities; ICT specially adapted for the management or operation of medical equipment or devices
- G16H40/20—ICT specially adapted for the management or administration of healthcare resources or facilities; ICT specially adapted for the management or operation of medical equipment or devices for the management or administration of healthcare resources or facilities, e.g. managing hospital staff or surgery rooms
-
- G—PHYSICS
- G16—INFORMATION AND COMMUNICATION TECHNOLOGY [ICT] SPECIALLY ADAPTED FOR SPECIFIC APPLICATION FIELDS
- G16H—HEALTHCARE INFORMATICS, i.e. INFORMATION AND COMMUNICATION TECHNOLOGY [ICT] SPECIALLY ADAPTED FOR THE HANDLING OR PROCESSING OF MEDICAL OR HEALTHCARE DATA
- G16H40/00—ICT specially adapted for the management or administration of healthcare resources or facilities; ICT specially adapted for the management or operation of medical equipment or devices
- G16H40/60—ICT specially adapted for the management or administration of healthcare resources or facilities; ICT specially adapted for the management or operation of medical equipment or devices for the operation of medical equipment or devices
- G16H40/63—ICT specially adapted for the management or administration of healthcare resources or facilities; ICT specially adapted for the management or operation of medical equipment or devices for the operation of medical equipment or devices for local operation
-
- G—PHYSICS
- G16—INFORMATION AND COMMUNICATION TECHNOLOGY [ICT] SPECIALLY ADAPTED FOR SPECIFIC APPLICATION FIELDS
- G16H—HEALTHCARE INFORMATICS, i.e. INFORMATION AND COMMUNICATION TECHNOLOGY [ICT] SPECIALLY ADAPTED FOR THE HANDLING OR PROCESSING OF MEDICAL OR HEALTHCARE DATA
- G16H50/00—ICT specially adapted for medical diagnosis, medical simulation or medical data mining; ICT specially adapted for detecting, monitoring or modelling epidemics or pandemics
- G16H50/20—ICT specially adapted for medical diagnosis, medical simulation or medical data mining; ICT specially adapted for detecting, monitoring or modelling epidemics or pandemics for computer-aided diagnosis, e.g. based on medical expert systems
-
- G—PHYSICS
- G16—INFORMATION AND COMMUNICATION TECHNOLOGY [ICT] SPECIALLY ADAPTED FOR SPECIFIC APPLICATION FIELDS
- G16H—HEALTHCARE INFORMATICS, i.e. INFORMATION AND COMMUNICATION TECHNOLOGY [ICT] SPECIALLY ADAPTED FOR THE HANDLING OR PROCESSING OF MEDICAL OR HEALTHCARE DATA
- G16H50/00—ICT specially adapted for medical diagnosis, medical simulation or medical data mining; ICT specially adapted for detecting, monitoring or modelling epidemics or pandemics
- G16H50/30—ICT specially adapted for medical diagnosis, medical simulation or medical data mining; ICT specially adapted for detecting, monitoring or modelling epidemics or pandemics for calculating health indices; for individual health risk assessment
-
- G—PHYSICS
- G16—INFORMATION AND COMMUNICATION TECHNOLOGY [ICT] SPECIALLY ADAPTED FOR SPECIFIC APPLICATION FIELDS
- G16H—HEALTHCARE INFORMATICS, i.e. INFORMATION AND COMMUNICATION TECHNOLOGY [ICT] SPECIALLY ADAPTED FOR THE HANDLING OR PROCESSING OF MEDICAL OR HEALTHCARE DATA
- G16H50/00—ICT specially adapted for medical diagnosis, medical simulation or medical data mining; ICT specially adapted for detecting, monitoring or modelling epidemics or pandemics
- G16H50/70—ICT specially adapted for medical diagnosis, medical simulation or medical data mining; ICT specially adapted for detecting, monitoring or modelling epidemics or pandemics for mining of medical data, e.g. analysing previous cases of other patients
Definitions
- the present invention relates, in general, to Continuous Quality Improvement (CQI) programs in healthcare and, more particularly, to a method, an apparatus and a computer program for analyzing data related to a plurality of healthcare delivery units, e.g. to improve performance of a target healthcare provider unit.
- CQI Continuous Quality Improvement
- Clinical data contains a multitude of information pertaining to patient health, clinical resources, and interactions of several groups of clinical users.
- a use case of clinical data analytics of high contemporary relevance is given in the prediction of aggregated incidence of a future occurrence of a certain health outcome event from past and presently obtained data in healthcare provider units for benchmarking and Continuous Quality Improvement (CQI).
- CQI Continuous Quality Improvement
- a healthcare-delivery-unit-level incidence is associated to an aggregated impact of risk factors distribution in a case mix of the healthcare provider unit.
- a total health outcome risk for an individual patient is given by the health outcome risk as effect of several chains of causal subevents with respective risks.
- the underlying task for the present invention is to provide a method, an apparatus and a computer program within Continuous Quality Improvement (CQI) programs in healthcare, incorporating:
- a computer-implemented method for analyzing data related to a plurality of healthcare delivery units.
- the method may include collecting data from different data sources related to the plurality of healthcare delivery units; computing, based on the collected data, for individual patients associated with any one of the plurality of healthcare delivery units, an expected frequency of at least one type of health outcome for each of the individual patients; and generalizing the computed expected frequencies of the at least one type of health outcome for the individual patients into one or more individual-level impact metrics associated with one or more risk factors for the at least one type of health outcome, wherein the one or more risk factors comprise one or more modifiable risk factors and one or more un-modifiable risk factors.
- an apparatus for analyzing data related to a plurality of healthcare delivery units.
- the apparatus may include a processor, memory in electronic communication with the processor, and instructions stored in the memory.
- the instructions may be executed by the processor to cause the apparatus to perform the following steps: collecting data from different data sources related to the plurality of healthcare delivery units; computing, based on the collected data, for individual patients associated with any one of the plurality of healthcare delivery units, an expected frequency of at least one type of health outcome for each of the individual patients; and generalizing the computed expected frequencies of the at least one type of health outcome for the individual patients into one or more individual-level impact metrics associated with one or more risk factors for the at least one type of health outcome, wherein the one or more risk factors comprise one or more modifiable risk factors and one or more un-modifiable risk factors.
- an apparatus for analyzing data related to a plurality of healthcare delivery units.
- the apparatus may include means for collecting data from different data sources related to the plurality of healthcare delivery units; means for computing, based on the collected data, for individual patients associated with any one of the plurality of healthcare delivery units, an expected frequency of at least one type of health outcome for each of the individual patients; and means for generalizing the computed expected frequencies of the at least one type of health outcome for the individual patients into one or more individual-level impact metrics associated with one or more risk factors for the at least one type of health outcome, wherein the one or more risk factors comprise one or more modifiable risk factors and one or more un-modifiable risk factors.
- a non-transitory computer-readable medium storing code for analyzing data related to a plurality of healthcare delivery units.
- the code may include instructions executable by a processor to perform the following steps: collecting data from different data sources related to the plurality of healthcare delivery units; computing, based on the collected data, for individual patients associated with any one of the plurality of healthcare delivery units, an expected frequency of at least one type of health outcome for each of the individual patients; and generalizing the computed expected frequencies of the at least one type of health outcome for the individual patients into one or more individual-level impact metrics associated with one or more risk factors for the at least one type of health outcome, wherein the one or more risk factors comprise one or more modifiable risk factors and one or more un-modifiable risk factors.
- some examples of the method, apparatuses, and non-transitory computer-readable medium according to the first aspect of the invention may further include operations, features, means, or instructions for consolidating data from the different data sources.
- some examples of the method, apparatuses, and non-transitory computer-readable medium described herein may further include operations, features, means, or instructions for extracting a set of features from the data from the different data sources.
- some examples of the method, apparatuses, and non-transitory computer-readable medium according to the first or the second aspect of the invention may further include operations, features, means, or instructions for obtaining one or more analytical models suitable for a set of features extracted from the data and for the at least one type of health outcome.
- the one or more analytical models may preferably comprise an exponential distribution family, a derivative of an exponential distribution family, a Bayesian network, an artificial neural network, and/or a non-parametric method.
- the non-parametric method may preferably comprise use of a decision tree, k-Nearest neighbors, and/or a support vector machine.
- some examples of the method, apparatuses, and non-transitory computer-readable medium according to the third aspect of the invention may further include operations, features, means, or instructions for setting up a model architecture based on a Continuous Quality Improvements (CQI) structure.
- CQI Continuous Quality Improvements
- some examples of the method, apparatuses, and non-transitory computer-readable medium according to the fourth aspect of the invention may further include operations, features, means, or instructions for training (F) n+m risk models based on the obtained one or more analytical models and the model architecture.
- n represents the number of the at least one type of health outcome
- m represents the number of the one or more modifiable risk factors.
- some examples of the method, apparatuses, and non-transitory computer-readable medium described herein may further include operations, features, means, or instructions for evaluating calibration and accuracy of the n+m risk models in a test set.
- some examples of the method, apparatuses, and non-transitory computer-readable medium according to any of the third to fifth aspects of the invention may further include operations, features, means, or instructions for applying the one or more analytical models to the collected data to predict the expected frequency for the at least one type of health outcome for the individual patients.
- some examples of the method, apparatuses, and non-transitory computer-readable medium according to any of the first to sixth aspects of the invention may further include operations, features, means, or instructions for applying aggregation rules to translate said computed expected frequencies for the individual patients into a healthcare-delivery-unit-level expected frequency for each of the healthcare delivery units; identifying a level of contribution of each of the one or more risk factors to the healthcare-delivery-unit-level expected frequency of the at least one type of health outcome for each of the healthcare delivery units within the plurality of healthcare delivery units, or a benchmarking subset thereof and computing the one or more individual-level impact metrics associated with the one or more risk factors based on the identified level of contribution.
- some examples of the method, apparatuses, and non-transitory computer-readable medium according to the seventh aspect of the invention may further include operations, features, means, or instructions for constructing, for each healthcare delivery unit within the plurality of healthcare delivery units, or a subset thereof, a standard population scenario to estimate, based on the one or more individual-level impact metrics, a modified expected frequency of the at least one type of health outcome that would be expected if a distribution of the one or more non-modifiable risk factors was fixed to a distribution observed in the standard population.
- some examples of the method, apparatuses, and non-transitory computer-readable medium described herein may further include operations, features, means, or instructions for ranking the healthcare delivery units within the plurality of healthcare delivery units, or the subset thereof, based on the estimated modified expected frequencies of the at least one type of health outcome that would be expected in the standard population.
- some examples of the method, apparatuses, and non-transitory computer-readable medium according to any of the first to eighth aspect of the invention may further include operations, features, means, or instructions for aggregating the one or more individual-level impact metrics associated with the one or more risk factors for each healthcare delivery unit within the plurality of healthcare delivery units, or a subset thereof; and normalizing said one or more individual-level impact metrics into a healthcare-delivery-unit-level impact metric for each healthcare delivery unit within the plurality of healthcare delivery units, or the subset thereof.
- some examples of the method, apparatuses, and non-transitory computer-readable medium according to any of the first to ninth aspects may further include operations, features, means, or instructions for identifying a level of contribution of each of one or more new risk factors to the expected frequency of the at least one type of health outcome for at least one healthcare delivery unit within the plurality of healthcare delivery units, wherein the one or more new risk factors are associated with one or more emerging medical needs, and optionally, ranking the emerging medical needs based on the corresponding identified level of contribution to the expected frequency of the at least one type of health outcome.
- some examples of the method, apparatuses, and non-transitory computer-readable medium according to the nineth or tenth aspect of the invention may further include operations, features, means, or instructions for defining a target frequency of the at least one type of health outcome at a target healthcare delivery unit; computing patient-level target achievement probabilities at the target healthcare delivery unit based on the healthcare-delivery-unit-level impact metrics; aggregating the patient-level target achievement probabilities to compute an expected target achievement prevalence at the target healthcare delivery unit; and computing an expected margin of improvement for the target healthcare delivery unit by comparing the expected target achievement prevalence with a prevalence based on a distribution of the one or more non-modifiable risk factors observed in a standard population.
- some examples of the method, apparatuses, and non-transitory computer-readable medium according to the eleventh aspect of the invention may further include operations, features, means, or instructions for displaying, on a graphical user interface (GUI), the expected margin of improvement for the at least one modifiable risk factor for the target healthcare delivery unit; and/or for displaying on the GUI, guidance for addressing at least one unmet medical need for the target healthcare delivery unit, wherein the unmet medical need is associated with under-achievement in the at least one modifiable risk factor for which an actionable improvement margin has been discovered based on the computed expected margin of improvement; and/or for displaying on the GUI, for the target healthcare delivery unit, a sequence of features to modify with respect to successive risk reduction of the at least one type of health outcome, based on the computed expected margin of improvement.
- GUI graphical user interface
- some examples of the method, apparatuses, and non-transitory computer-readable medium according to the fifth aspect of the invention may further include operations, features, means, or instructions for creating risk models and adjusting the risk models based on newly configured model architecture and model parameters.
- the present invention provides techniques to produce standard and data-driven metrics to identify best performing healthcare provider units, to rank priorities of interventions based on their relationship with patient-centered outcomes and to assess credible margin of improvements for interventions.
- the techniques further include ranking best performing healthcare provider unit by disentangling the effect of modifiable (i.e. key performance indicators in a Continuous Quality Improvement program) and non-modifiable factors (i.e. case mix of personal characteristics such as age, sex, ethnicity and the likes) on patient-centered outcomes (i.e. mortality, hospitalization, quality of life, healthcare costs, etc.), ranking the contribution of intermediate modifiable clinical factors on patient-centered outcomes, comparing clinical target achievement intermediate modifiable clinical factors to an inter-clinical benchmark, and the clinical-user support by periodical recommendation of factors optimally suited to impact risks by modification within a specific clinic.
- modifiable i.e. key performance indicators in a Continuous Quality Improvement program
- non-modifiable factors i.e. case mix of personal characteristics such as age, sex, ethnicity and the likes
- patient-centered outcomes i.e. mortality, hospitalization, quality of life, healthcare costs, etc.
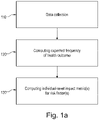
- Fig. 1a provides a flowchart of a computer-implemented method in accordance with an embodiment of the invention.
- the method in accordance with an embodiment of the invention includes collecting data from different data sources related to the plurality of healthcare delivery units, shown as step 110; computing, based on the collected data, for individual patients associated with any one of the plurality of healthcare delivery units, an expected frequency of at least one type of health outcome for each of the individual patients, shown as step 120; and generalizing the computed expected frequencies of the at least one type of health outcome for the individual patients into one or more individual-level impact metrics associated with one or more risk factors for the at least one type of health outcome, wherein the one or more risk factors comprise one or more modifiable risk factors and one or more un-modifiable risk factors, shown as step 130.
- the collected data can include e.g. patient information (such as age, sex, ethnicity, etc.), medical history (such as conditions, their progress, therapies, etc.), physiological measurement results (such as pulse, temperature, body liquid content concentrations, blood pressure, etc.), treatment parameters (particularly dialysis treatment settings, drug dosing, etc.), clinical attributes (such as locality, size, staff size, resources, therapy availability, etc.). All patients' data can be classified as modifiable and non-modifiable risk factors based on substantive medical knowledge abstracted from medical literature and expert opinion which may inform a Continuous Quality Improvement (CQI) program.
- CQI Continuous Quality Improvement
- the application can be customized to accommodate the objective and key performance indicator architecture of any CQI program in healthcare.
- the data sources can be medical files, electronic health records, clinical guidelines, medical databases, literature, treatment devices, direct measurements, drug prescription, manual input, etc.
- information is collected from medical literature, information is processed into model weights as described in the publication WO 2019/072692 A1 .
- the type of health outcome can be related to e.g. mortality, hospitalization, quality of life, healthcare costs, etc.
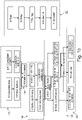
- Fig. 1b provides a flowchart of a computer-implemented method in accordance with a preferred embodiment of the invention.
- the method may comprise consolidating data from the different data sources, shown as step A.
- Data consolidation can vary in terms of sources, types/formats, media, and interfacing means and it can be spatially and temporally distributed. Merging of several data sets can be used to generate new data sets with or without (meta-data) measurable real-world correspondence. Often, non-clinical data is combined with clinical data to generate new data sets with clinical use cases. New data obtained in this way can transcend limitations of the attributes of the originally underlying data by analytical extrapolation. This allows to correlate original, e.g. currently measured from one user group, clinical data to meta-data with indications of progression of this data and/or their expectation for another clinic /user group.
- the method may comprise extracting a set of features from the collected data, shown as step B.
- the extracted features can contain socio-demographic characters, health conditions, laboratory tests, instrumental investigations, progressions stages, therapy efficiency, (e.g. Kt/V, hydration status, bone-metabolism markers, anemia markers, etc.) etc.
- the features can be obtained as results of several logical and mathematical functions on the collected data. At all times, derived features are representative or indicative of concrete underlying health-related measurables.
- Operative definitions adopted in the modeling strategy reproduce CQI architecture and are fully customizable to any CQI program in healthcare. From those features, features concurring to Key Performance Indicator (KPI) definition are deemed susceptive to modifications; all other features are deemed non-modifiable.
- KPI Key Performance Indicator
- the method may comprise customizing operative definitions based on a Continuous Quality Improvements (CQI) architecture and Key Performance Index (KPI) definition, shown as step C.
- CQI Continuous Quality Improvements
- KPI Key Performance Index
- Operative definitions are the sum of algorithmic rules of CQI architectures and KPI definitions. For example, operative definitions would be given by
- the parameters and/or parametric weights (here, the a, b and c in the example equation) are usually defined by clinical guidelines.
- a preC step can be performed before step C to consolidate CQI/KPI.
- the method may comprise obtaining one or more analytical models suitable for a set of features extracted from the data and for the at least one type of health outcome, shown as step D.
- the one or more analytical models may comprise an exponential distribution family, a derivative of an exponential distribution family, a Bayesian network, an artificial neural network, and/or a non-parametric method.
- the non-parametric method may comprise a decision tree, k-Nearest neighbors, and/or a support vector machine.
- the one or more analytical models can be e.g. obtained based on model fit metrics.
- Model fit metrics reflect how "suitable" a model is for describing features extracted from the data. This can be defined by a deviation between data features and model over the range of the data (and beyond). A "decision" to consider a model sufficiently suitable is made by defining thresholds for acceptable deviation.
- the one or more analytical models can be e.g. obtained based on a prediction model.
- the model becomes predictive when it exceeds the range of the ingoing data features.
- the deviation of the prediction scales with distance to the covered data range.
- a decision is made by defining thresholds to acceptable deviation with regard to required distance to covered data range.
- the method may comprise setting up a model architecture based on a Continuous Quality Improvements (CQI) structure, shown as step E.
- the model architecture is defined by a set of equations, ingoing fixed and variable parameters, ranges and starting values for variable parameters. Types of equations, variables and their dependencies are reflective of variables and their dependencies of one ore more CQI structures. Parameter limits of the model variables can be fixed by the CQI structure.
- the method may comprise training n+m risk models based on the obtained one or more analytical models and the model architecture, wherein n represents the number of the at least one type of health outcome and m represents the number of the one or more modifiable risk factors.
- Modeling strategy includes simultaneous probabilistic prediction of one or more patient-centered outcome (i.e. mortality, hospitalization, healthcare cost, quality of life, etc.) by modifiable and non-modifiable risk factors, and concurrent prediction of expected target achievement for all modifiable factors. Therefore, the method incorporates n+m concurrent models, where n represents the number of patient-centered outcomes considered and m represents the number of modifiable factors (e.g. corresponding to KPI) considered in the target CQI program.
- the method may comprise evaluating calibration and accuracy of the n+m risk models in a test set, shown as step G.
- the method may comprise applying the one or more analytical models or the n+m risk models to the collected data to predict the expected frequency for the at least one type of health outcome for the individual patients, shown as step H.
- the method may comprise applying aggregation rules to translate said computed expected frequencies for the individual patients into a healthcare-delivery-unit-level expected frequency for each of the healthcare delivery units, shown as step I; and identifying a level of contribution of each of the one or more risk factors to the healthcare-delivery-unit-level expected frequency of the at least one type of health outcome for each of the healthcare delivery units within the plurality of healthcare delivery units, or a benchmarking subset thereof, and computing the one or more individual-level impact metrics associated with the one or more risk factors based on the identified level of contribution, shown as step J.
- the method may comprise constructing, for each healthcare delivery unit within the plurality of healthcare delivery units, or a subset thereof, a standard population scenario to estimate, based on the one or more individual-level impact metrics, a modified expected frequency of the at least one type of health outcome that would be expected if a distribution of the one or more non-modifiable risk factors was fixed to a distribution observed in the standard population, shown as step K. Further, the method may comprise ranking the healthcare delivery units within the plurality of healthcare delivery units, or the subset thereof, based on the estimated modified expected frequencies of the at least one type of health outcome that would be expected in the standard population.
- the method may comprise aggregating the one or more individual-level impact metrics associated with the one or more risk factors for each healthcare delivery unit within the plurality of healthcare delivery units, or a subset thereof; and normalizing said one or more individual-level impact metrics into a healthcare-delivery-unit-level impact metric for each healthcare delivery unit within the plurality of healthcare delivery units, or the subset thereof, shown as step L.
- the healthcare-delivery-unit-level may be a level associated with healthcare delivery units, healthcare authority units, regional administration units, country healthcare system units, and etc.
- the method may comprise comprising identifying a level of contribution of each of one or more new risk factors to the expected frequency of the at least one type of health outcome for at least one healthcare delivery unit within the plurality of healthcare delivery units.
- the one or more new risk factors are associated with one or more emerging medical needs.
- the method may comprise ranking the emerging medical needs based on the corresponding identified level of contribution to the expected frequency of the at least one type of health outcome, shown as step M.
- the method may comprise, for at least one of the one or more modifiable risk factors, defining a target frequency of the at least one type of health outcome at a target healthcare delivery unit; computing patient-level target achievement probabilities at the target healthcare delivery unit based on the healthcare-delivery-unit-level impact metrics, shown as step N; aggregating the patient-level target achievement probabilities to compute an expected target achievement prevalence at the target healthcare delivery unit, shown as step O; and computing an expected margin of improvement for the target healthcare delivery unit by comparing the expected target achievement prevalence with a prevalence based on a distribution of the one or more non-modifiable risk factors observed in a standard population, shown as step P.
- Patient-level targets are computed by normalizing the standard healthcare-unit targets (i.e. with standard distribution of non-modifiable factors) to non-modifiable factors of the patient within the target healthcare unit.
- the patient-level target achievement probability is the result of a modelled prediction with ingoing individual patient data and target achievement as outcome.
- the method may comprise displaying, on a graphical user interface (GUI), the expected margin of improvement for the at least one modifiable risk factor for the target healthcare delivery unit, shown as step Q; and/or outputting, on a graphical user interface (GUI), guidance for addressing at least one unmet medical need for the target healthcare delivery unit, wherein the unmet medical need is associated with under-achievement in the at least one modifiable risk factor for which an actionable improvement margin has been discovered based on the computed expected margin of improvement, shown as step R; and/or outputting, for the target healthcare delivery unit, a sequence of features to modify with respect to successive risk reduction of the at least one type of health outcome, based on the computed expected margin of improvement, shown as step S.
- GUI graphical user interface
- the method is executed by software by controlling the execution of individual steps of network-connected components of a distributed system of databases, medical treatment and monitoring devices, computing units, and display/input means.
- Suitable databases include medical health records, clinical/regional/(inter)national patient databases, medical literature registries, and others.
- networked dialysis machines for example, but also ventilators or infusion devices are particularly suitable.
- Monitoring devices can be implemented as part of the treatment devices or separately, e.g., as a clinical "dashboard.”
- the display/input means maybe parts of other system components, e.g., operating screen of the treatment devices, or implemented in a separate user device, e.g., tablet/smartphone.
- the steps of the method are envisaged to be executed in a cloud platform and user interaction (input/output) is enabled via web browser interface to the cloud platform.
- User devices are then all common web-enabled devices.
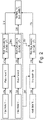
- Fig. 2 is a flowchart showing an example of integration of additional data/risk models into an available system.
- a combination of resulting risk predictions can be employed to calculate (214, 224, 234) a certain health outcome.
- Risk model configurations obtained from one set of input data e.g. input data 1 can be employed (240) for other input data (e.g. input data 2) not underlying the configuration process (210), omitting repetitive configuration process (e.g. the process shown as 220).
- resulting risk models 1,2 can be sufficient to construct (250) any risk model N, reflective of any input data N, without performing an additional model configuration step (230).
- Risk 2 probability can be derived from Risk 1 probability (242).
- resulting Risk 1,2 probabilities can be sufficient to derive (252) any Risk N probability, reflective of any input data N, without performing an additional probability prediction step (252).
- Fig. 3 is a flowchart showing an example of analysis of a newly integrated healthcare unit/clinic with respect to benchmarks.
- Newly integrated healthcare unit/clinic is analyzed with respect to benchmarks(s) based on already integrated healthcare unit data but can (optionally) contribute to benchmarks (and models used in the method); i.e., the method's models are evolving with additional data sources.
- input data 1,2,N(A) of a specific clinic A is employed (310) within the method with optional contributions of benchmarks for features and risks to produce the outcomes of a health outcome probability (350), margins of improvements (360) and recommendations (370) for the specific clinic A.
- Integration of another healthcare unit B with respective input data 1,2,N(B) is performed by employing (340) its data within the method to produce outcomes respective to clinic B.
- input data of clinic B can optionally contribute (330) to benchmark values. This can result in different outcomes for clinic A depending on whether newly integrated data of clinic B is contributing (330) to benchmark values. This can also result in different outcomes for clinic B depending on whether newly integrated data is contributing (330) to benchmark values.
- GUI graphical user interface
- Data and calculated (meta-) indices are displayed by flow and strength, wherein contribution to index total corresponds to thickness of flow arrow. Further, the flows and arrows can be shown in different colors.
- input data 1,2,3,4,5 of different origins and/or types can be differently combined to contribute (410, 420, 430) to certain clinical factors with respective resulting deviations ⁇ CF1, 2, 3 of current clinical factors 1, 2, 3 to benchmark values 1, 2, 3.
- the different contributions (410, 420, 430) can be displayed in different colors (i.e. the corresponding flows and arrows for the contributions 410, 420, 430 can be displayed in different colors, respectively).
- Contributions of certain clinical factors 1, 2, 3 to certain risk factors 1, 2, 3 can be of different combinations and strengths (440, 442, 444, 446, 448, 450, 452). Further, corresponding flows and arrows for the contributions 440, 442, 444, 446, 448, 450, 452 can be displayed in different colors. For example, the contributions 440, 446 and 452, which are related to "Clinical Factor 1”, can be displayed in a first color; the contributions 444 and 450, which are related to "Clinical Factor 2", can be displayed in a second color; and the contributions 442 and 448, which are related to "Clinical Factor 3", can be displayed in a third color.
- the health outcome probability here mortality risk
- results from several respective risk factors with different respective contributions 460.
- Deviations to benchmark values can be calculated for clinical factors ( ⁇ CF1, 2, 3), at the level of risk factors and at the level of the health outcome probability ( ⁇ MR).
- Fig. 5 shows an example of a first option, wherein the recommendation is displayed by margin of improvement (of contributing clinical factors).
- Fig. 6 shows an example of a second option, wherein the recommendation is displayed by degree of contribution and superposition of contribution and margin.
- a certain first stage 1 the margin of improvement for health outcome ⁇ MR, as defined by with respect to a selectable benchmark (530), is displayed with margins of improvement for clinical factors ⁇ CF1, ⁇ CF2, ⁇ CF3. CF3 with the highest margin of improvement ⁇ CF3 is recommended to be addressed.
- a certain second stage 2 e.g. following the addressing of recommended factor at the earlier stage 1, ⁇ MR is reduced and the recommendation is changed to a different factor CF1 with highest margin of improvement ⁇ CF1.
- the margin of improvement for health outcome ⁇ MR is displayed with margins of improvement for clinical factors ⁇ CF1, ⁇ CF2, ⁇ CF3 and their respective contributions 612, 614, 616 to the health outcome. Similar as in Fig. 4 , the contributions 612, 614, 616 can be displayed with different colors and thicknesses.
- CF3 shows the highest margin of improvement ⁇ CF3, i.e. 70%.
- CF 2 shows the highest contribution to the health outcome (614), i.e. the flow of contribution 614 is displayed as thicker than the flows of contributions 612 and 616. Therefore, CF2 is recommended to be addressed.
- a certain second stage 2 e.g. following the addressing of recommended factor at the earlier stage 1, ⁇ MR is reduced and the recommendation is changed to a different factor CF1 with highest contribution to the health outcome (622).
- Fig. 7 shows a comparison of results as a function of a (selectable) recommendation basis.
- recommendation results (720) are shown as a function of a (selectable) recommendation basis (732, 742, 752).
- the basis of recommendation can be selected to include the different aspects of the relations (710) between clinical factors CF1, CF2, CF3 and depending health outcome.
- One recommendation basis can be the margin of improvement ⁇ CF3 (730) for a clinical factor CF3 resulting in a recommendation (732) for addressing clinical factors by their respective margin of improvement.
- Another recommendation basis can be the contribution (714) of a clinical factor CF2 to the health outcome resulting in a recommendation (742) for addressing clinical factors by their respective contribution.
- Yet another recommendation basis can be the combination of contributions (712, 714, 716) of clinical factors CF1, CF2, CF3 and their respective margins of improvement ⁇ CF1, ⁇ CF2, ⁇ CF3 resulting in a recommendation (752) for addressing clinical factors by a criterion reflective of an expected impact. Similar as in Fig. 4 , the contributions 712, 714, 716 can be displayed with different colors and thicknesses.
- Fig. 8 shows a comparison of recommendation results as a function of a (selectable) benchmark group.
- the health outcome here mortality risk
- the recommendations (820, 830) for addressing certain clinical factors CF1, CF2, CF3 depending on recommendation basis (margin of improvement, contribution, combination of both) are different depending on the selected benchmark group and/or resulting margin of improvement for the health outcome ⁇ MR1 (820), ⁇ MR2 (830).
- Fig. 9 shows a first exemplary recommendation per graphical display. As shown in Fig. 9 , the GUI shows a continuous user guidance by displaying of recommendation and reasoning for that:
- a certain health outcome, here mortality, of a certain current healthcare unit is in comparison to different benchmarking health outcomes (910) with resulting margin of improvement ⁇ MR as compared to the respective benchmark.
- the recommendation is displayed in a dynamic GUI (920, 930) with respective graphical elements corresponding to the specific clinic's health outcome, elements corresponding to the benchmarking value, elements corresponding to risk factors contributing to the health outcome, and elements corresponding to contributing clinical factors.
- the elements are preferably arranged in a circular setup with the radii of current and benchmarking health outcome scaling with their numerical value, and particularly the difference between their radii scaling with the margin of improvement ⁇ MR.
- Contributing risk factors and clinical factors are arranged around the health outcome with their circular segment area scaling with the degree of their respective contribution to the health outcome.
- a recommendation of a clinical factor to be addressed is displayed by highlighting the circular segment corresponding to the clinical factor (930), e.g. by framing the corresponding segment (see the boundary of the upper right section being extra frame with a dashed line). This framing can be done with any other highlighting lines instead of the dashed line.
- the described recommendation by GUI is dynamic as it adapts to current clinical data and user selections, and the user is enabled to evaluate the relations between health outcome and risk/clinical factors as well as a projected impact of addressing certain factors.
- the displayed recommendation therefore is transparent with respect to the dynamics of the underlying reasoning.
- Fig. 10 shows a second exemplary recommendation per graphical display. As shown in Fig. 10 , the GUI shows progress of the clinical factors, the resulting improvement in mortality risk, and the changing recommendation.
- the recommendation highlights the clinical factor best to be addressed at the current clinical state (1010).
- a modification of the recommended factor results in an improvement of the health outcome (1020), i.e. the margin if improvement as compared to a benchmark value is reduced.
- the radii of the circular elements of the GUI corresponding to current health outcome and benchmarking value approach each other and a possibly other clinical factor best suited to address in the changed clinical state is highlighted. If there is no margin if improvement left, no recommendation is displayed (1030).
- Fig. 11 shows a third exemplary recommendation per graphical display.
- the GUI elements evolve according to modified clinical factors as recommended (1110, 1110).
- the current clinical health outcome approaches the benchmark value (1114). This improvement and accordingly changing clinical factor impacts, and the resulting recommendation are changing (1114).
- the recommendation is changing (1122) to highlight overperforming factors, i.e. factors that can be reduced without negatively affecting the health outcome.
- the benchmarking value is changed to a benchmark group with positive margin of improvement.
Landscapes
- Engineering & Computer Science (AREA)
- Health & Medical Sciences (AREA)
- Medical Informatics (AREA)
- Public Health (AREA)
- Biomedical Technology (AREA)
- General Health & Medical Sciences (AREA)
- Primary Health Care (AREA)
- Epidemiology (AREA)
- Data Mining & Analysis (AREA)
- General Business, Economics & Management (AREA)
- Business, Economics & Management (AREA)
- Pathology (AREA)
- Databases & Information Systems (AREA)
- Medical Treatment And Welfare Office Work (AREA)
- External Artificial Organs (AREA)
- Measuring And Recording Apparatus For Diagnosis (AREA)
Abstract
Description
- The present invention relates, in general, to Continuous Quality Improvement (CQI) programs in healthcare and, more particularly, to a method, an apparatus and a computer program for analyzing data related to a plurality of healthcare delivery units, e.g. to improve performance of a target healthcare provider unit.
- Clinical data contains a multitude of information pertaining to patient health, clinical resources, and interactions of several groups of clinical users. A use case of clinical data analytics of high contemporary relevance is given in the prediction of aggregated incidence of a future occurrence of a certain health outcome event from past and presently obtained data in healthcare provider units for benchmarking and Continuous Quality Improvement (CQI). For a certain health outcome, a healthcare-delivery-unit-level incidence is associated to an aggregated impact of risk factors distribution in a case mix of the healthcare provider unit. A total health outcome risk for an individual patient is given by the health outcome risk as effect of several chains of causal subevents with respective risks. Several publications in this field disclose the risk prediction of adverse clinical events and/or health outcomes, their progression and the modification of the prediction reliability and efficiency by the choice of different data sets and/or analytical models. The dynamics of underlying input data and the transferability of predictions between different affected user groups and their effect on reliable risk predictions is addressed in
WO 2019/072692 A1 . - While a predicted meta-value related to a risk is helpful to evaluate the occurrence of a certain clinical event, the factors contributing to the risk, and the meta-data generated from them as input into the prediction analysis, vary strongly between different subsets of healthcare provider units and patients in degree of availability and impact. Additionally, with the usual multi-causality of health outcomes, a prediction of occurrence alone cannot certainly help the mitigation.
- Therefore, the underlying task for the present invention is to provide a method, an apparatus and a computer program within Continuous Quality Improvement (CQI) programs in healthcare, incorporating:
- 1) a fair comparison in clinical performance by disentangling true practice-dependent differences in health outcomes from differences solely due to imbalances of unmodifiable factors (i.e. age, gender and the likes) across different healthcare provider units;
- 2) a method to consistently rank emerging medical needs based on priority for each healthcare provider unit based on data-driven expectation on future health outcomes; and
- 3) a method to consistently rank potential policy interventions based on credible, data-driven margin of improvement expectations.
- The invention is defined in the independent claims.
- This Summary is provided to introduce a selection of concepts in a simplified form that are further described herein in the Detailed Description. This Summary is not intended to identify key factors or essential features of the claimed subject matter, nor is it intended to be used to limit the scope of the claimed subject matter.
- According to a first aspect of the invention, a computer-implemented method is provided for analyzing data related to a plurality of healthcare delivery units. The method may include collecting data from different data sources related to the plurality of healthcare delivery units; computing, based on the collected data, for individual patients associated with any one of the plurality of healthcare delivery units, an expected frequency of at least one type of health outcome for each of the individual patients; and generalizing the computed expected frequencies of the at least one type of health outcome for the individual patients into one or more individual-level impact metrics associated with one or more risk factors for the at least one type of health outcome, wherein the one or more risk factors comprise one or more modifiable risk factors and one or more un-modifiable risk factors.
- Further, according to the first aspect of the invention, an apparatus is provided for analyzing data related to a plurality of healthcare delivery units. The apparatus may include a processor, memory in electronic communication with the processor, and instructions stored in the memory. The instructions may be executed by the processor to cause the apparatus to perform the following steps: collecting data from different data sources related to the plurality of healthcare delivery units; computing, based on the collected data, for individual patients associated with any one of the plurality of healthcare delivery units, an expected frequency of at least one type of health outcome for each of the individual patients; and generalizing the computed expected frequencies of the at least one type of health outcome for the individual patients into one or more individual-level impact metrics associated with one or more risk factors for the at least one type of health outcome, wherein the one or more risk factors comprise one or more modifiable risk factors and one or more un-modifiable risk factors.
- Further, according to the first aspect of the invention, an apparatus is provided for analyzing data related to a plurality of healthcare delivery units. The apparatus may include means for collecting data from different data sources related to the plurality of healthcare delivery units; means for computing, based on the collected data, for individual patients associated with any one of the plurality of healthcare delivery units, an expected frequency of at least one type of health outcome for each of the individual patients; and means for generalizing the computed expected frequencies of the at least one type of health outcome for the individual patients into one or more individual-level impact metrics associated with one or more risk factors for the at least one type of health outcome, wherein the one or more risk factors comprise one or more modifiable risk factors and one or more un-modifiable risk factors.
- Further, according to the first aspect of the invention, a non-transitory computer-readable medium storing code for analyzing data related to a plurality of healthcare delivery units is described. The code may include instructions executable by a processor to perform the following steps: collecting data from different data sources related to the plurality of healthcare delivery units; computing, based on the collected data, for individual patients associated with any one of the plurality of healthcare delivery units, an expected frequency of at least one type of health outcome for each of the individual patients; and generalizing the computed expected frequencies of the at least one type of health outcome for the individual patients into one or more individual-level impact metrics associated with one or more risk factors for the at least one type of health outcome, wherein the one or more risk factors comprise one or more modifiable risk factors and one or more un-modifiable risk factors.
- According to a second aspect of the invention, some examples of the method, apparatuses, and non-transitory computer-readable medium according to the first aspect of the invention may further include operations, features, means, or instructions for consolidating data from the different data sources. Further, optionally, some examples of the method, apparatuses, and non-transitory computer-readable medium described herein may further include operations, features, means, or instructions for extracting a set of features from the data from the different data sources.
- According to a third aspect of the invention, some examples of the method, apparatuses, and non-transitory computer-readable medium according to the first or the second aspect of the invention may further include operations, features, means, or instructions for obtaining one or more analytical models suitable for a set of features extracted from the data and for the at least one type of health outcome. The one or more analytical models may preferably comprise an exponential distribution family, a derivative of an exponential distribution family, a Bayesian network, an artificial neural network, and/or a non-parametric method. The non-parametric method may preferably comprise use of a decision tree, k-Nearest neighbors, and/or a support vector machine.
- According to a fourth aspect of the invention, some examples of the method, apparatuses, and non-transitory computer-readable medium according to the third aspect of the invention may further include operations, features, means, or instructions for setting up a model architecture based on a Continuous Quality Improvements (CQI) structure.
- According to a fifth aspect of the invention, some examples of the method, apparatuses, and non-transitory computer-readable medium according to the fourth aspect of the invention may further include operations, features, means, or instructions for training (F) n+m risk models based on the obtained one or more analytical models and the model architecture. Here n represents the number of the at least one type of health outcome and m represents the number of the one or more modifiable risk factors. Further, optionally, some examples of the method, apparatuses, and non-transitory computer-readable medium described herein may further include operations, features, means, or instructions for evaluating calibration and accuracy of the n+m risk models in a test set.
- According to a sixth aspect of the invention, some examples of the method, apparatuses, and non-transitory computer-readable medium according to any of the third to fifth aspects of the invention may further include operations, features, means, or instructions for applying the one or more analytical models to the collected data to predict the expected frequency for the at least one type of health outcome for the individual patients.
- According to an seventh aspect of the invention, some examples of the method, apparatuses, and non-transitory computer-readable medium according to any of the first to sixth aspects of the invention may further include operations, features, means, or instructions for applying aggregation rules to translate said computed expected frequencies for the individual patients into a healthcare-delivery-unit-level expected frequency for each of the healthcare delivery units; identifying a level of contribution of each of the one or more risk factors to the healthcare-delivery-unit-level expected frequency of the at least one type of health outcome for each of the healthcare delivery units within the plurality of healthcare delivery units, or a benchmarking subset thereof and computing the one or more individual-level impact metrics associated with the one or more risk factors based on the identified level of contribution.
- According to an eighth aspect of the invention, some examples of the method, apparatuses, and non-transitory computer-readable medium according to the seventh aspect of the invention may further include operations, features, means, or instructions for constructing, for each healthcare delivery unit within the plurality of healthcare delivery units, or a subset thereof, a standard population scenario to estimate, based on the one or more individual-level impact metrics, a modified expected frequency of the at least one type of health outcome that would be expected if a distribution of the one or more non-modifiable risk factors was fixed to a distribution observed in the standard population. Further, optionally, some examples of the method, apparatuses, and non-transitory computer-readable medium described herein may further include operations, features, means, or instructions for ranking the healthcare delivery units within the plurality of healthcare delivery units, or the subset thereof, based on the estimated modified expected frequencies of the at least one type of health outcome that would be expected in the standard population.
- According to a ninth aspect of the invention, some examples of the method, apparatuses, and non-transitory computer-readable medium according to any of the first to eighth aspect of the invention may further include operations, features, means, or instructions for aggregating the one or more individual-level impact metrics associated with the one or more risk factors for each healthcare delivery unit within the plurality of healthcare delivery units, or a subset thereof; and normalizing said one or more individual-level impact metrics into a healthcare-delivery-unit-level impact metric for each healthcare delivery unit within the plurality of healthcare delivery units, or the subset thereof.
- According to a tenth aspect of the invention, some examples of the method, apparatuses, and non-transitory computer-readable medium according to any of the first to ninth aspects may further include operations, features, means, or instructions for identifying a level of contribution of each of one or more new risk factors to the expected frequency of the at least one type of health outcome for at least one healthcare delivery unit within the plurality of healthcare delivery units, wherein the one or more new risk factors are associated with one or more emerging medical needs, and optionally, ranking the emerging medical needs based on the corresponding identified level of contribution to the expected frequency of the at least one type of health outcome.
- According to an eleventh aspect of the invention, some examples of the method, apparatuses, and non-transitory computer-readable medium according to the nineth or tenth aspect of the invention may further include operations, features, means, or instructions for defining a target frequency of the at least one type of health outcome at a target healthcare delivery unit; computing patient-level target achievement probabilities at the target healthcare delivery unit based on the healthcare-delivery-unit-level impact metrics; aggregating the patient-level target achievement probabilities to compute an expected target achievement prevalence at the target healthcare delivery unit; and computing an expected margin of improvement for the target healthcare delivery unit by comparing the expected target achievement prevalence with a prevalence based on a distribution of the one or more non-modifiable risk factors observed in a standard population.
- According to an twelfth aspect of the invention, some examples of the method, apparatuses, and non-transitory computer-readable medium according to the eleventh aspect of the invention may further include operations, features, means, or instructions for displaying, on a graphical user interface (GUI), the expected margin of improvement for the at least one modifiable risk factor for the target healthcare delivery unit; and/or for displaying on the GUI, guidance for addressing at least one unmet medical need for the target healthcare delivery unit, wherein the unmet medical need is associated with under-achievement in the at least one modifiable risk factor for which an actionable improvement margin has been discovered based on the computed expected margin of improvement; and/or for displaying on the GUI, for the target healthcare delivery unit, a sequence of features to modify with respect to successive risk reduction of the at least one type of health outcome, based on the computed expected margin of improvement.
- According to a thirteenth aspect of the invention, some examples of the method, apparatuses, and non-transitory computer-readable medium according to the fifth aspect of the invention may further include operations, features, means, or instructions for creating risk models and adjusting the risk models based on newly configured model architecture and model parameters.
- In the following, preferred embodiments of the present invention will be explained with reference to the accompanying figures:
- Fig. 1a:
- a flowchart of a computer-implemented method in accordance with an embodiment of the invention;
- Fig. 1b:
- a flowchart of a computer-implemented method in accordance with a preferred embodiment of the invention;
- Fig. 2:
- a flowchart showing an example of integration of additional data/risk models into an available system;
- Fig. 3:
- a flowchart showing an example of analysis of a newly integrated healthcare unit/clinic with respect to benchmarks;
- Fig. 4:
- a schematic overview of relationships between clinical factors and health risks;
- Fig. 5:
- an example result for risk reduction based on clinical factors;
- Fig. 6:
- an example result for risk reduction based on clinical factors and benchmarks;
- Fig. 7:
- a comparison of results as a function of a (selectable) recommendation basis;
- Fig. 8:
- a comparison of results as a function of a (selectable) recommendation basis over time;
- Fig. 9:
- a first exemplary recommendation per graphical display;
- Fig. 10:
- a second exemplary recommendation per graphical display;
- Fig. 11:
- a third exemplary recommendation per graphical display.
- One or more specific embodiments of the present disclosure will be described below. In an effort to provide a concise description of these embodiments, not all features of an actual implementation are described in the specification. It should be appreciated that in the development of any such actual implementation, as in any engineering or design project, numerous implementation-specific decisions must be made to achieve the developers' specific goals, such as compliance with system-related and business-related constraints, which may vary from one implementation to another. Moreover, it should be appreciated that such a development effort might be complex and time consuming, but would nevertheless be a routine undertaking of design, fabrication, and manufacture for those of ordinary skill having the benefit of this disclosure.
- The present invention provides techniques to produce standard and data-driven metrics to identify best performing healthcare provider units, to rank priorities of interventions based on their relationship with patient-centered outcomes and to assess credible margin of improvements for interventions.
- The techniques further include ranking best performing healthcare provider unit by disentangling the effect of modifiable (i.e. key performance indicators in a Continuous Quality Improvement program) and non-modifiable factors (i.e. case mix of personal characteristics such as age, sex, ethnicity and the likes) on patient-centered outcomes (i.e. mortality, hospitalization, quality of life, healthcare costs, etc.), ranking the contribution of intermediate modifiable clinical factors on patient-centered outcomes, comparing clinical target achievement intermediate modifiable clinical factors to an inter-clinical benchmark, and the clinical-user support by periodical recommendation of factors optimally suited to impact risks by modification within a specific clinic.
- Furthermore, potential impact of interventions is anticipated by contrasting observed and expected rate of clinical target achievement based on inter-clinical benchmark comparisons.
-
Fig. 1a provides a flowchart of a computer-implemented method in accordance with an embodiment of the invention. - The method in accordance with an embodiment of the invention includes collecting data from different data sources related to the plurality of healthcare delivery units, shown as
step 110; computing, based on the collected data, for individual patients associated with any one of the plurality of healthcare delivery units, an expected frequency of at least one type of health outcome for each of the individual patients, shown asstep 120; and generalizing the computed expected frequencies of the at least one type of health outcome for the individual patients into one or more individual-level impact metrics associated with one or more risk factors for the at least one type of health outcome, wherein the one or more risk factors comprise one or more modifiable risk factors and one or more un-modifiable risk factors, shown asstep 130. - The collected data can include e.g. patient information (such as age, sex, ethnicity, etc.), medical history (such as conditions, their progress, therapies, etc.), physiological measurement results (such as pulse, temperature, body liquid content concentrations, blood pressure, etc.), treatment parameters (particularly dialysis treatment settings, drug dosing, etc.), clinical attributes (such as locality, size, staff size, resources, therapy availability, etc.). All patients' data can be classified as modifiable and non-modifiable risk factors based on substantive medical knowledge abstracted from medical literature and expert opinion which may inform a Continuous Quality Improvement (CQI) program. The application can be customized to accommodate the objective and key performance indicator architecture of any CQI program in healthcare.
- The data sources can be medical files, electronic health records, clinical guidelines, medical databases, literature, treatment devices, direct measurements, drug prescription, manual input, etc. When information is collected from medical literature, information is processed into model weights as described in the publication
WO 2019/072692 A1 . - The type of health outcome can be related to e.g. mortality, hospitalization, quality of life, healthcare costs, etc.
-
Fig. 1b provides a flowchart of a computer-implemented method in accordance with a preferred embodiment of the invention. - In the preferred embodiment, the method may comprise consolidating data from the different data sources, shown as step A.
- Data consolidation (i.e. aggregation) can vary in terms of sources, types/formats, media, and interfacing means and it can be spatially and temporally distributed. Merging of several data sets can be used to generate new data sets with or without (meta-data) measurable real-world correspondence. Often, non-clinical data is combined with clinical data to generate new data sets with clinical use cases. New data obtained in this way can transcend limitations of the attributes of the originally underlying data by analytical extrapolation. This allows to correlate original, e.g. currently measured from one user group, clinical data to meta-data with indications of progression of this data and/or their expectation for another clinic /user group.
- Optionally, the method may comprise extracting a set of features from the collected data, shown as step B.
- The extracted features can contain socio-demographic characters, health conditions, laboratory tests, instrumental investigations, progressions stages, therapy efficiency, (e.g. Kt/V, hydration status, bone-metabolism markers, anemia markers, etc.) etc. The features can be obtained as results of several logical and mathematical functions on the collected data. At all times, derived features are representative or indicative of concrete underlying health-related measurables. Operative definitions adopted in the modeling strategy reproduce CQI architecture and are fully customizable to any CQI program in healthcare. From those features, features concurring to Key Performance Indicator (KPI) definition are deemed susceptive to modifications; all other features are deemed non-modifiable.
- Optionally, the method may comprise customizing operative definitions based on a Continuous Quality Improvements (CQI) architecture and Key Performance Index (KPI) definition, shown as step C. Operative definitions are the sum of algorithmic rules of CQI architectures and KPI definitions. For example, operative definitions would be given by
- i) equations, parameters, variables, constants for CQI,
- ii) equations, parameters, variables, constants for KPI, and/or
- iii) algorithmic simplifications, e.g. CQIi= CQI(KPI(data(t))) -> CQIi= CQI(t).
- A CQI architecture is defined by the (temporal) dynamics of underlying data (features) and KPIs, one or more (time-dependent) parametric equations and the parametric weights, for example t<t1: CQI= a∗ data1(t) + b∗ KPI1 (t); t>t1: CQI = c∗KPI1(t). The parameters and/or parametric weights (here, the a, b and c in the example equation) are usually defined by clinical guidelines.
- A KPI is an algorithmic derivation from a subset of measurable data/data features. It is defined by the ingoing data subset, one or more parametric equations, and weight parameters to certain features within the equations. Standard pre-defined assumptions may be used for certain parameters if they cannot be derived from the underlying data. For example, a KPI can be defined as KPI = a* data1 + b data2 + c, which is a linear equation, where a and b are measurable parameters, and c is a pre-defined parameter.
- Further, a preC step can be performed before step C to consolidate CQI/KPI.
- Optionally, the method may comprise obtaining one or more analytical models suitable for a set of features extracted from the data and for the at least one type of health outcome, shown as step D.
- The one or more analytical models may comprise an exponential distribution family, a derivative of an exponential distribution family, a Bayesian network, an artificial neural network, and/or a non-parametric method. The non-parametric method may comprise a decision tree, k-Nearest neighbors, and/or a support vector machine.
- The one or more analytical models can be e.g. obtained based on model fit metrics. Model fit metrics reflect how "suitable" a model is for describing features extracted from the data. This can be defined by a deviation between data features and model over the range of the data (and beyond). A "decision" to consider a model sufficiently suitable is made by defining thresholds for acceptable deviation.
- Further, the one or more analytical models can be e.g. obtained based on a prediction model. The model becomes predictive when it exceeds the range of the ingoing data features. The deviation of the prediction scales with distance to the covered data range. A decision is made by defining thresholds to acceptable deviation with regard to required distance to covered data range.
- Optionally, the method may comprise setting up a model architecture based on a Continuous Quality Improvements (CQI) structure, shown as step E. The model architecture is defined by a set of equations, ingoing fixed and variable parameters, ranges and starting values for variable parameters. Types of equations, variables and their dependencies are reflective of variables and their dependencies of one ore more CQI structures. Parameter limits of the model variables can be fixed by the CQI structure.
- Optionally, the method may comprise training n+m risk models based on the obtained one or more analytical models and the model architecture, wherein n represents the number of the at least one type of health outcome and m represents the number of the one or more modifiable risk factors.
- Parameters informing individual level model predictions toward patient-centered outcomes are constructed by a method described in
WO 2019/072692 A1 . Modeling strategy includes simultaneous probabilistic prediction of one or more patient-centered outcome (i.e. mortality, hospitalization, healthcare cost, quality of life, etc.) by modifiable and non-modifiable risk factors, and concurrent prediction of expected target achievement for all modifiable factors. Therefore, the method incorporates n+m concurrent models, where n represents the number of patient-centered outcomes considered and m represents the number of modifiable factors (e.g. corresponding to KPI) considered in the target CQI program. - Optionally, the method may comprise evaluating calibration and accuracy of the n+m risk models in a test set, shown as step G.
- Optionally, the method may comprise applying the one or more analytical models or the n+m risk models to the collected data to predict the expected frequency for the at least one type of health outcome for the individual patients, shown as step H.
- Optionally, the method may comprise applying aggregation rules to translate said computed expected frequencies for the individual patients into a healthcare-delivery-unit-level expected frequency for each of the healthcare delivery units, shown as step I; and identifying a level of contribution of each of the one or more risk factors to the healthcare-delivery-unit-level expected frequency of the at least one type of health outcome for each of the healthcare delivery units within the plurality of healthcare delivery units, or a benchmarking subset thereof, and computing the one or more individual-level impact metrics associated with the one or more risk factors based on the identified level of contribution, shown as step J.
- Optionally, the method may comprise constructing, for each healthcare delivery unit within the plurality of healthcare delivery units, or a subset thereof, a standard population scenario to estimate, based on the one or more individual-level impact metrics, a modified expected frequency of the at least one type of health outcome that would be expected if a distribution of the one or more non-modifiable risk factors was fixed to a distribution observed in the standard population, shown as step K. Further, the method may comprise ranking the healthcare delivery units within the plurality of healthcare delivery units, or the subset thereof, based on the estimated modified expected frequencies of the at least one type of health outcome that would be expected in the standard population.
- Yet in the preferred embodiment, the method may comprise aggregating the one or more individual-level impact metrics associated with the one or more risk factors for each healthcare delivery unit within the plurality of healthcare delivery units, or a subset thereof; and normalizing said one or more individual-level impact metrics into a healthcare-delivery-unit-level impact metric for each healthcare delivery unit within the plurality of healthcare delivery units, or the subset thereof, shown as step L.
- The healthcare-delivery-unit-level may be a level associated with healthcare delivery units, healthcare authority units, regional administration units, country healthcare system units, and etc.
- Optionally, the method may comprise comprising identifying a level of contribution of each of one or more new risk factors to the expected frequency of the at least one type of health outcome for at least one healthcare delivery unit within the plurality of healthcare delivery units. The one or more new risk factors are associated with one or more emerging medical needs. Further, the method may comprise ranking the emerging medical needs based on the corresponding identified level of contribution to the expected frequency of the at least one type of health outcome, shown as step M.
- Yet in the preferred embodiment, the method may comprise, for at least one of the one or more modifiable risk factors, defining a target frequency of the at least one type of health outcome at a target healthcare delivery unit; computing patient-level target achievement probabilities at the target healthcare delivery unit based on the healthcare-delivery-unit-level impact metrics, shown as step N; aggregating the patient-level target achievement probabilities to compute an expected target achievement prevalence at the target healthcare delivery unit, shown as step O; and computing an expected margin of improvement for the target healthcare delivery unit by comparing the expected target achievement prevalence with a prevalence based on a distribution of the one or more non-modifiable risk factors observed in a standard population, shown as step P. Patient-level targets are computed by normalizing the standard healthcare-unit targets (i.e. with standard distribution of non-modifiable factors) to non-modifiable factors of the patient within the target healthcare unit. The patient-level target achievement probability is the result of a modelled prediction with ingoing individual patient data and target achievement as outcome.
- Further, optionally, the method may comprise displaying, on a graphical user interface (GUI), the expected margin of improvement for the at least one modifiable risk factor for the target healthcare delivery unit, shown as step Q; and/or outputting, on a graphical user interface (GUI), guidance for addressing at least one unmet medical need for the target healthcare delivery unit, wherein the unmet medical need is associated with under-achievement in the at least one modifiable risk factor for which an actionable improvement margin has been discovered based on the computed expected margin of improvement, shown as step R; and/or outputting, for the target healthcare delivery unit, a sequence of features to modify with respect to successive risk reduction of the at least one type of health outcome, based on the computed expected margin of improvement, shown as step S.
- In another preferred embodiment, the method is executed by software by controlling the execution of individual steps of network-connected components of a distributed system of databases, medical treatment and monitoring devices, computing units, and display/input means. Suitable databases include medical health records, clinical/regional/(inter)national patient databases, medical literature registries, and others. In the case of treatment devices, networked dialysis machines, for example, but also ventilators or infusion devices are particularly suitable. Monitoring devices can be implemented as part of the treatment devices or separately, e.g., as a clinical "dashboard." Also, the display/input means maybe parts of other system components, e.g., operating screen of the treatment devices, or implemented in a separate user device, e.g., tablet/smartphone.
- In another embodiment, the steps of the method are envisaged to be executed in a cloud platform and user interaction (input/output) is enabled via web browser interface to the cloud platform. User devices are then all common web-enabled devices.
-
Fig. 2 is a flowchart showing an example of integration of additional data/risk models into an available system. - Integration of additional data/risk models into available system can affect parameters of available risk models (& resulting risk probabilities). Missing data parts for newly integrated data can be extrapolated from available data. Newly integrated risk models can be affected by already available risk models and underlying data, vice versa.
- As shown in
Fig. 2 , the production (210, 220, 230) of individual risk models in terms of their architecture and parameter configuration suitable to predict (212, 222, 232) certain risk probabilities. A combination of resulting risk predictions can be employed to calculate (214, 224, 234) a certain health outcome. Risk model configurations obtained from one set of input data (e.g. input data 1) can be employed (240) for other input data (e.g. input data 2) not underlying the configuration process (210), omitting repetitive configuration process (e.g. the process shown as 220). For a sufficient set ofinput data risk models Risk 2 probability can be derived fromRisk 1 probability (242). For a sufficient set ofinput data Risk -
Fig. 3 is a flowchart showing an example of analysis of a newly integrated healthcare unit/clinic with respect to benchmarks. - Newly integrated healthcare unit/clinic is analyzed with respect to benchmarks(s) based on already integrated healthcare unit data but can (optionally) contribute to benchmarks (and models used in the method); i.e., the method's models are evolving with additional data sources.
- As shown in
Fig. 3 ,input data respective input data - The output is displayed on a graphical user interface (GUI), e.g. on a screen to guide the user. The GUI displays for example the following information:
- For single/region of/benchmark for clinic(s): standardized health outcome risk score;
- Risk factors in clinic: current & target w.r.t. benchmark;
- Distribution of risk factors in clinic: observed & predicted;
- Correlation of risk factors and outcomes & comparison to other clinic(s), regions, benchmark;
- Development of above over time -> (evidence on) quality improvement;
- Best-in-comparison clinic -> examples for best clinical practice.
-
Fig. 4 shows a schematic overview of relationships between clinical factors and health risks, wherein MR= mortality risk, CF= clinical factor, ΔCF, ΔMR= difference to benchmark. - Data and calculated (meta-) indices (Clinical Factor/KPI, Risk Factor, Benchmark) are displayed by flow and strength, wherein contribution to index total corresponds to thickness of flow arrow. Further, the flows and arrows can be shown in different colors.
- As shown in
Fig. 4 ,input data clinical factors benchmark values contributions - Contributions of certain
clinical factors certain risk factors contributions contributions Clinical Factor 1", can be displayed in a first color; thecontributions Clinical Factor 2", can be displayed in a second color; and thecontributions Clinical Factor 3", can be displayed in a third color. - The health outcome probability, here mortality risk, results from several respective risk factors with different respective contributions (460). Deviations to benchmark values can be calculated for clinical factors (ΔCF1, 2, 3), at the level of risk factors and at the level of the health outcome probability (ΔMR).
- There are different options for bases of displayed recommendation.
Fig. 5 shows an example of a first option, wherein the recommendation is displayed by margin of improvement (of contributing clinical factors).Fig. 6 shows an example of a second option, wherein the recommendation is displayed by degree of contribution and superposition of contribution and margin. - As shown in
Fig. 5 , at a certain first stage 1 (510) the margin of improvement for health outcome ΔMR, as defined by with respect to a selectable benchmark (530), is displayed with margins of improvement for clinical factors ΔCF1, ΔCF2, ΔCF3. CF3 with the highest margin of improvement ΔCF3 is recommended to be addressed. At a certain second stage 2 (520), e.g. following the addressing of recommended factor at theearlier stage 1, ΔMR is reduced and the recommendation is changed to a different factor CF1 with highest margin of improvement ΔCF1. - As shown in
Fig. 6 , at a certain first stage 1 (610) the margin of improvement for health outcome ΔMR, as defined by with respect to a selectable benchmark (630), is displayed with margins of improvement for clinical factors ΔCF1, ΔCF2, ΔCF3 and theirrespective contributions Fig. 4 , thecontributions - CF3 shows the highest margin of improvement ΔCF3, i.e. 70%. But
CF 2 shows the highest contribution to the health outcome (614), i.e. the flow ofcontribution 614 is displayed as thicker than the flows ofcontributions earlier stage 1, ΔMR is reduced and the recommendation is changed to a different factor CF1 with highest contribution to the health outcome (622). -
Fig. 7 shows a comparison of results as a function of a (selectable) recommendation basis. As shown inFig. 7 , recommendation results (720) are shown as a function of a (selectable) recommendation basis (732, 742, 752). The basis of recommendation can be selected to include the different aspects of the relations (710) between clinical factors CF1, CF2, CF3 and depending health outcome. One recommendation basis can be the margin of improvement ΔCF3 (730) for a clinical factor CF3 resulting in a recommendation (732) for addressing clinical factors by their respective margin of improvement. Another recommendation basis can be the contribution (714) of a clinical factor CF2 to the health outcome resulting in a recommendation (742) for addressing clinical factors by their respective contribution. Yet another recommendation basis can be the combination of contributions (712, 714, 716) of clinical factors CF1, CF2, CF3 and their respective margins of improvement ΔCF1, ΔCF2, ΔCF3 resulting in a recommendation (752) for addressing clinical factors by a criterion reflective of an expected impact. Similar as inFig. 4 , thecontributions -
Fig. 8 shows a comparison of recommendation results as a function of a (selectable) benchmark group. The health outcome, here mortality risk, can be compared to different groups of benchmarking (810), e.g. an average benchmark or a best performing healthcare unit in a comparable group of units. The recommendations (820, 830) for addressing certain clinical factors CF1, CF2, CF3 depending on recommendation basis (margin of improvement, contribution, combination of both) are different depending on the selected benchmark group and/or resulting margin of improvement for the health outcome ΔMR1 (820), ΔMR2 (830). -
Fig. 9 shows a first exemplary recommendation per graphical display. As shown inFig. 9 , the GUI shows a continuous user guidance by displaying of recommendation and reasoning for that: - displayed interface is suitable to offer more to the user than "just" presentation of information; and
- dynamic elements are adapted to current situation to improve the interface of user and the displayed information.
- As shown in
Fig. 9 , a certain health outcome, here mortality, of a certain current healthcare unit is in comparison to different benchmarking health outcomes (910) with resulting margin of improvement ΔMR as compared to the respective benchmark. The recommendation is displayed in a dynamic GUI (920, 930) with respective graphical elements corresponding to the specific clinic's health outcome, elements corresponding to the benchmarking value, elements corresponding to risk factors contributing to the health outcome, and elements corresponding to contributing clinical factors. The elements are preferably arranged in a circular setup with the radii of current and benchmarking health outcome scaling with their numerical value, and particularly the difference between their radii scaling with the margin of improvement ΔMR. Contributing risk factors and clinical factors are arranged around the health outcome with their circular segment area scaling with the degree of their respective contribution to the health outcome. A recommendation of a clinical factor to be addressed, e.g. best suited for improving the health outcome, is displayed by highlighting the circular segment corresponding to the clinical factor (930), e.g. by framing the corresponding segment (see the boundary of the upper right section being extra frame with a dashed line). This framing can be done with any other highlighting lines instead of the dashed line. The described recommendation by GUI is dynamic as it adapts to current clinical data and user selections, and the user is enabled to evaluate the relations between health outcome and risk/clinical factors as well as a projected impact of addressing certain factors. The displayed recommendation therefore is transparent with respect to the dynamics of the underlying reasoning. -
Fig. 10 shows a second exemplary recommendation per graphical display. As shown inFig. 10 , the GUI shows progress of the clinical factors, the resulting improvement in mortality risk, and the changing recommendation. - As shown in
Fig. 10 , the recommendation highlights the clinical factor best to be addressed at the current clinical state (1010). A modification of the recommended factor results in an improvement of the health outcome (1020), i.e. the margin if improvement as compared to a benchmark value is reduced. The radii of the circular elements of the GUI corresponding to current health outcome and benchmarking value approach each other and a possibly other clinical factor best suited to address in the changed clinical state is highlighted. If there is no margin if improvement left, no recommendation is displayed (1030). -
Fig. 11 shows a third exemplary recommendation per graphical display. - As shown in
Fig. 11 , the GUI elements evolve according to modified clinical factors as recommended (1110, 1110). The current clinical health outcome approaches the benchmark value (1114). This improvement and accordingly changing clinical factor impacts, and the resulting recommendation are changing (1114). When the current clinical health outcome further improves (1124) and becomes better than the benchmarking value (1130), the recommendation is changing (1122) to highlight overperforming factors, i.e. factors that can be reduced without negatively affecting the health outcome. Alternatively, e.g. by user selection, the benchmarking value is changed to a benchmark group with positive margin of improvement.
Claims (15)
- A computer-implemented method for analyzing data related to a plurality of healthcare delivery units, the method comprising
collecting (110) data from different data sources related to the plurality of healthcare delivery units;
computing (120), based on the collected data, for individual patients associated with any one of the plurality of healthcare delivery units, an expected frequency of at least one type of health outcome for each of the individual patients; and
generalizing (130) the computed expected frequencies of the at least one type of health outcome for the individual patients into one or more individual-level impact metrics associated with one or more risk factors for the at least one type of health outcome, wherein the one or more risk factors comprise one or more modifiable risk factors and one or more un-modifiable risk factors. - The method of claim 1, wherein collecting data from different data sources comprises consolidating (A) data from the different data sources,
and wherein, optionally, the method further comprises extracting (B) a set of features from the data from the different data sources. - The method of claim 1 or 2, wherein computing the expected frequency of the at least one type of health outcome comprises obtaining (D) one or more analytical models suitable for a set of features extracted from the data and for the at least one type of health outcome, wherein the one or more analytical models preferably comprise an exponential distribution family, a derivative of an exponential distribution family, a Bayesian network, an artificial neural network, and/or a non-parametric method, and wherein the non-parametric method preferably comprises use of a decision tree, k-Nearest neighbors, and/or a support vector machine.
- The method of claim 3, further comprising setting (E) up a model architecture based on a Continuous Quality Improvements (CQI) structure.
- The method of claim 4, further comprising training (F) n+m risk models based on the obtained one or more analytical models and the model architecture, wherein n represents the number of the at least one type of health outcome and m represents the number of the one or more modifiable risk factors, and wherein, optionally, the method further comprises evaluating (G) calibration and accuracy of the n+m risk models in a test set.
- The method of any one of claims 3 to 5, further comprising applying (H) the one or more analytical models to the collected data to predict the expected frequency for the at least one type of health outcome for the individual patients.
- The method of any one of claims 1 to 6, wherein generalizing the computed expected frequencies of the at least one type of health outcome for the individual patients comprises
applying (I) aggregation rules to translate said computed expected frequencies for the individual patients into a healthcare-delivery-unit-level expected frequency for each of the healthcare delivery units;
identifying (J) a level of contribution of each of the one or more risk factors to the healthcare-delivery-unit-level expected frequency of the at least one type of health outcome for each of the healthcare delivery units within the plurality of healthcare delivery units, or a benchmarking subset thereof and computing the one or more individual-level impact metrics associated with the one or more risk factors based on the identified level of contribution. - The method of claim 7, further comprising constructing (K), for each healthcare delivery unit within the plurality of healthcare delivery units, or a subset thereof, a standard population scenario to estimate, based on the one or more individual-level impact metrics, a modified expected frequency of the at least one type of health outcome that would be expected if a distribution of the one or more non-modifiable risk factors was fixed to a distribution observed in the standard population,
wherein, optionally, the method further comprises ranking the healthcare delivery units within the plurality of healthcare delivery units, or the subset thereof, based on the estimated modified expected frequencies of the at least one type of health outcome that would be expected in the standard population. - The method of any one of claims 1 to 8, further comprising
aggregating (L) the one or more individual-level impact metrics associated with the one or more risk factors for each healthcare delivery unit within the plurality of healthcare delivery units, or a subset thereof; and
normalizing (L) said one or more individual-level impact metrics into a healthcare-delivery-unit-level impact metric for each healthcare delivery unit within the plurality of healthcare delivery units, or the subset thereof. - The method of claim 1 to 9, further comprising identifying a level of contribution of each of one or more new risk factors to the expected frequency of the at least one type of health outcome for at least one healthcare delivery unit within the plurality of healthcare delivery units, wherein the one or more new risk factors are associated with one or more emerging medical needs; and
optionally, ranking (M) the emerging medical needs based on the corresponding identified level of contribution to the expected frequency of the at least one type of health outcome. - The method of claim 9 or 10, further comprising, for at least one of the one or more modifiable risk factors,
defining a target frequency of the at least one type of health outcome at a target healthcare delivery unit;
computing (N) patient-level target achievement probabilities at the target healthcare delivery unit based on the healthcare-delivery-unit-level impact metrics;
aggregating (O) the patient-level target achievement probabilities to compute an expected target achievement prevalence at the target healthcare delivery unit; and
computing (P) an expected margin of improvement for the target healthcare delivery unit by comparing the expected target achievement prevalence with a prevalence based on a distribution of the one or more non-modifiable risk factors observed in a standard population. - The method of claim 11, further comprising displaying (Q), on a graphical user interface (GUI), the expected margin of improvement for the at least one modifiable risk factor for the target healthcare delivery unit;
and/ or displaying (R) on the GUI, guidance for addressing at least one unmet medical need for the target healthcare delivery unit, wherein the unmet medical need is associated with under-achievement in the at least one modifiable risk factor for which an actionable improvement margin has been discovered based on the computed expected margin of improvement;
and /or displaying (S) on the GUI, for the target healthcare delivery unit, a sequence of features to modify with respect to successive risk reduction of the at least one type of health outcome, based on the computed expected margin of improvement. - A method of creating risk models in accordance with claim 5, further comprising adjusting the risk models based on newly configured model architecture and model parameters.
- A computer program comprising instructions which, when the program is executed by a computer, cause the computer to carry out the steps of the method of any one of claims 1-13.
- An apparatus comprising means for performing the steps of the method of any one of claims 1-13.
Priority Applications (4)
| Application Number | Priority Date | Filing Date | Title |
|---|---|---|---|
| EP21180742.5A EP4109464A1 (en) | 2021-06-22 | 2021-06-22 | Value-based advanced clinical benchmarking |
| US17/743,751 US12482556B2 (en) | 2021-06-22 | 2022-05-13 | Value-based advanced clinical benchmarking |
| PCT/EP2022/065848 WO2022268530A1 (en) | 2021-06-22 | 2022-06-10 | Value-based advanced clinical benchmarking |
| CN202280043952.4A CN117581312A (en) | 2021-06-22 | 2022-06-10 | Value-Based Advanced Clinic Benchmarks |
Applications Claiming Priority (1)
| Application Number | Priority Date | Filing Date | Title |
|---|---|---|---|
| EP21180742.5A EP4109464A1 (en) | 2021-06-22 | 2021-06-22 | Value-based advanced clinical benchmarking |
Publications (1)
| Publication Number | Publication Date |
|---|---|
| EP4109464A1 true EP4109464A1 (en) | 2022-12-28 |
Family
ID=76553561
Family Applications (1)
| Application Number | Title | Priority Date | Filing Date |
|---|---|---|---|
| EP21180742.5A Pending EP4109464A1 (en) | 2021-06-22 | 2021-06-22 | Value-based advanced clinical benchmarking |
Country Status (4)
| Country | Link |
|---|---|
| US (1) | US12482556B2 (en) |
| EP (1) | EP4109464A1 (en) |
| CN (1) | CN117581312A (en) |
| WO (1) | WO2022268530A1 (en) |
Citations (6)
| Publication number | Priority date | Publication date | Assignee | Title |
|---|---|---|---|---|
| US20110077958A1 (en) * | 2009-09-24 | 2011-03-31 | Agneta Breitenstein | Systems and methods for clinical, operational, and financial benchmarking and comparative analytics |
| US20150186607A1 (en) * | 2012-08-24 | 2015-07-02 | Koninklijke Philips N.V. | Clinical support system and method |
| US20160371453A1 (en) * | 2015-06-19 | 2016-12-22 | Healthgrades Operating Company, Inc. | Analytical data processing for consumer health scores |
| US20180182475A1 (en) * | 2014-06-13 | 2018-06-28 | University Hospitals Cleveland Medical Center | Artificial-intelligence-based facilitation of healthcare delivery |
| WO2019072692A1 (en) | 2017-10-12 | 2019-04-18 | Fresenius Medical Care Deutschland Gmbh | Medical device and computer-implemented method of predicting risk, occurrence or progression of adverse health conditions in test subjects in subpopulations arbitrarily selected from a total population |
| US20210020060A1 (en) * | 2019-07-19 | 2021-01-21 | Immersive Health Group, LLC | Systems and methods for simulated reality based risk mitigation |
Family Cites Families (4)
| Publication number | Priority date | Publication date | Assignee | Title |
|---|---|---|---|---|
| EP1673134A4 (en) * | 2003-09-12 | 2007-03-21 | Marinepolymer Tech Inc | PRESERVATION OF VASCULAR ACCESS IN HEMODIALYSIS PATIENTS |
| WO2013192593A2 (en) | 2012-06-21 | 2013-12-27 | Battelle Memorial Institute | Clinical predictive analytics system |
| US20200302296A1 (en) * | 2019-03-21 | 2020-09-24 | D. Douglas Miller | Systems and method for optimizing educational outcomes using artificial intelligence |
| CN111243753B (en) * | 2020-02-27 | 2024-04-02 | 西安交通大学 | Multi-factor correlation interactive analysis method for medical data |
-
2021
- 2021-06-22 EP EP21180742.5A patent/EP4109464A1/en active Pending
-
2022
- 2022-05-13 US US17/743,751 patent/US12482556B2/en active Active
- 2022-06-10 WO PCT/EP2022/065848 patent/WO2022268530A1/en not_active Ceased
- 2022-06-10 CN CN202280043952.4A patent/CN117581312A/en active Pending
Patent Citations (6)
| Publication number | Priority date | Publication date | Assignee | Title |
|---|---|---|---|---|
| US20110077958A1 (en) * | 2009-09-24 | 2011-03-31 | Agneta Breitenstein | Systems and methods for clinical, operational, and financial benchmarking and comparative analytics |
| US20150186607A1 (en) * | 2012-08-24 | 2015-07-02 | Koninklijke Philips N.V. | Clinical support system and method |
| US20180182475A1 (en) * | 2014-06-13 | 2018-06-28 | University Hospitals Cleveland Medical Center | Artificial-intelligence-based facilitation of healthcare delivery |
| US20160371453A1 (en) * | 2015-06-19 | 2016-12-22 | Healthgrades Operating Company, Inc. | Analytical data processing for consumer health scores |
| WO2019072692A1 (en) | 2017-10-12 | 2019-04-18 | Fresenius Medical Care Deutschland Gmbh | Medical device and computer-implemented method of predicting risk, occurrence or progression of adverse health conditions in test subjects in subpopulations arbitrarily selected from a total population |
| US20210020060A1 (en) * | 2019-07-19 | 2021-01-21 | Immersive Health Group, LLC | Systems and methods for simulated reality based risk mitigation |
Also Published As
| Publication number | Publication date |
|---|---|
| CN117581312A (en) | 2024-02-20 |
| US20220406444A1 (en) | 2022-12-22 |
| WO2022268530A1 (en) | 2022-12-29 |
| US12482556B2 (en) | 2025-11-25 |
Similar Documents
| Publication | Publication Date | Title |
|---|---|---|
| Jain et al. | Awareness of racial and ethnic bias and potential solutions to address bias with use of health care algorithms | |
| AU2012245343B2 (en) | Predictive modeling | |
| US10055547B2 (en) | Intermediate check points in medical care lines for automatically identifying care deficiencies | |
| RU2619644C2 (en) | Clinical decision support system for predictive discharge planning | |
| US20160092641A1 (en) | Facilitating clinically informed financial decisions that improve healthcare performance | |
| Hauskrecht et al. | Outlier-based detection of unusual patient-management actions: an ICU study | |
| US20110218815A1 (en) | Method of data mining in medical applications | |
| US11328825B1 (en) | Machine learning techniques for identifying opportunity patients | |
| US20210256545A1 (en) | Summarizing and presenting recommendations of impact factors from unstructured survey response data | |
| US20190279746A1 (en) | Healthcare network | |
| US20090106004A1 (en) | Systems and methods for evaluating interventions | |
| US20210343420A1 (en) | Systems and methods for providing accurate patient data corresponding with progression milestones for providing treatment options and outcome tracking | |
| US20230196562A1 (en) | Systems and methods for image processing to determine case optimization | |
| US11783262B2 (en) | Automatic detection and generation of medical imaging data analytics | |
| CN117954096A (en) | Health status assessment method, device, electronic equipment and medium | |
| EP3776276A1 (en) | Systems and methods for dynamic generation of structured quality indicators and management thereof | |
| US20250391571A1 (en) | System and method for providing a true health-wellness status of a user | |
| US12482556B2 (en) | Value-based advanced clinical benchmarking | |
| AU2022311798A1 (en) | Systems and methods for providing accurate patient data corresponding with progression milestones for providing treatment options and outcome tracking | |
| US20210383904A1 (en) | Provider-curated applications for accessing patient data in an ehr system | |
| US20180315508A1 (en) | Methods and apparatus for dynamic event driven simulations | |
| US20250046435A1 (en) | Predicting stress states | |
| US12424331B2 (en) | Systems and methods for managing health treatment | |
| Sathyavathi et al. | Machine Learning-Based Techniques for Predictive Diagnostics in Healthcare | |
| Anjos | How to access implementation of ML solutions in healthcare |
Legal Events
| Date | Code | Title | Description |
|---|---|---|---|
| PUAI | Public reference made under article 153(3) epc to a published international application that has entered the european phase |
Free format text: ORIGINAL CODE: 0009012 |
|
| STAA | Information on the status of an ep patent application or granted ep patent |
Free format text: STATUS: THE APPLICATION HAS BEEN PUBLISHED |
|
| AK | Designated contracting states |
Kind code of ref document: A1 Designated state(s): AL AT BE BG CH CY CZ DE DK EE ES FI FR GB GR HR HU IE IS IT LI LT LU LV MC MK MT NL NO PL PT RO RS SE SI SK SM TR |
|
| STAA | Information on the status of an ep patent application or granted ep patent |
Free format text: STATUS: REQUEST FOR EXAMINATION WAS MADE |
|
| 17P | Request for examination filed |
Effective date: 20230623 |
|
| RBV | Designated contracting states (corrected) |
Designated state(s): AL AT BE BG CH CY CZ DE DK EE ES FI FR GB GR HR HU IE IS IT LI LT LU LV MC MK MT NL NO PL PT RO RS SE SI SK SM TR |
|
| STAA | Information on the status of an ep patent application or granted ep patent |
Free format text: STATUS: EXAMINATION IS IN PROGRESS |
|
| 17Q | First examination report despatched |
Effective date: 20251017 |