EP4109058A1 - Image processing device and image processing method - Google Patents
Image processing device and image processing method Download PDFInfo
- Publication number
- EP4109058A1 EP4109058A1 EP20920020.3A EP20920020A EP4109058A1 EP 4109058 A1 EP4109058 A1 EP 4109058A1 EP 20920020 A EP20920020 A EP 20920020A EP 4109058 A1 EP4109058 A1 EP 4109058A1
- Authority
- EP
- European Patent Office
- Prior art keywords
- image
- fundamental frequency
- sound
- sound data
- frequency component
- Prior art date
- Legal status (The legal status is an assumption and is not a legal conclusion. Google has not performed a legal analysis and makes no representation as to the accuracy of the status listed.)
- Granted
Links
Images









Classifications
-
- G—PHYSICS
- G01—MEASURING; TESTING
- G01H—MEASUREMENT OF MECHANICAL VIBRATIONS OR ULTRASONIC, SONIC OR INFRASONIC WAVES
- G01H3/00—Measuring characteristics of vibrations by using a detector in a fluid
- G01H3/04—Frequency
- G01H3/08—Analysing frequencies present in complex vibrations, e.g. comparing harmonics present
-
- G—PHYSICS
- G06—COMPUTING OR CALCULATING; COUNTING
- G06T—IMAGE DATA PROCESSING OR GENERATION, IN GENERAL
- G06T11/00—Two-dimensional [2D] image generation
- G06T11/20—Drawing from basic elements
- G06T11/26—Drawing of charts or graphs
-
- G—PHYSICS
- G01—MEASURING; TESTING
- G01H—MEASUREMENT OF MECHANICAL VIBRATIONS OR ULTRASONIC, SONIC OR INFRASONIC WAVES
- G01H13/00—Measuring resonant frequency
-
- G—PHYSICS
- G06—COMPUTING OR CALCULATING; COUNTING
- G06V—IMAGE OR VIDEO RECOGNITION OR UNDERSTANDING
- G06V10/00—Arrangements for image or video recognition or understanding
- G06V10/70—Arrangements for image or video recognition or understanding using pattern recognition or machine learning
- G06V10/72—Data preparation, e.g. statistical preprocessing of image or video features
-
- G—PHYSICS
- G10—MUSICAL INSTRUMENTS; ACOUSTICS
- G10L—SPEECH ANALYSIS TECHNIQUES OR SPEECH SYNTHESIS; SPEECH RECOGNITION; SPEECH OR VOICE PROCESSING TECHNIQUES; SPEECH OR AUDIO CODING OR DECODING
- G10L21/00—Speech or voice signal processing techniques to produce another audible or non-audible signal, e.g. visual or tactile, in order to modify its quality or its intelligibility
- G10L21/06—Transformation of speech into a non-audible representation, e.g. speech visualisation or speech processing for tactile aids
- G10L21/10—Transforming into visible information
- G10L21/14—Transforming into visible information by displaying frequency domain information
-
- G—PHYSICS
- G10—MUSICAL INSTRUMENTS; ACOUSTICS
- G10L—SPEECH ANALYSIS TECHNIQUES OR SPEECH SYNTHESIS; SPEECH RECOGNITION; SPEECH OR VOICE PROCESSING TECHNIQUES; SPEECH OR AUDIO CODING OR DECODING
- G10L25/00—Speech or voice analysis techniques not restricted to a single one of groups G10L15/00 - G10L21/00
- G10L25/03—Speech or voice analysis techniques not restricted to a single one of groups G10L15/00 - G10L21/00 characterised by the type of extracted parameters
- G10L25/18—Speech or voice analysis techniques not restricted to a single one of groups G10L15/00 - G10L21/00 characterised by the type of extracted parameters the extracted parameters being spectral information of each sub-band
-
- G—PHYSICS
- G10—MUSICAL INSTRUMENTS; ACOUSTICS
- G10L—SPEECH ANALYSIS TECHNIQUES OR SPEECH SYNTHESIS; SPEECH RECOGNITION; SPEECH OR VOICE PROCESSING TECHNIQUES; SPEECH OR AUDIO CODING OR DECODING
- G10L25/00—Speech or voice analysis techniques not restricted to a single one of groups G10L15/00 - G10L21/00
- G10L25/90—Pitch determination of speech signals
Definitions
- the present invention relates to an image processing apparatus and an image processing method.
- Patent Literature 1 A method for determining whether a sound of a device is normal or abnormal has been known (Patent Literature 1).
- the invention described in Patent Literature 1 determines whether a sound of a device is normal or abnormal using a locus vector indicating intensity features in all time directions and a previously learned identification parameter.
- Patent Literature 1 WO 2015/068446
- an object of the present invention is to provide an image processing apparatus and an image processing method of imaging sound data.
- An image processing apparatus calculates a fundamental frequency component included in sound data and a harmonic component corresponding to the fundamental frequency component, converts the fundamental frequency component and the harmonic component into image data, and generates a sound image where the fundamental frequency component and the harmonic component that have been converted into the image data are arranged adjacent each other.
- the present invention enables a machine learning model of sound data to be generated by imaging sound data.
- the image processing apparatus 1 includes a controller 20, a storage device 40, and a display 50.
- the controller 20 acquires sound data via a microphone 10 and analyzes the acquired sound data.
- the controller 20 is a general-purpose microcomputer including a CPU (central processing unit), a memory, and an input/output unit.
- the microcomputer has a computer program installed to function as the image processing apparatus 1. By executing the computer program, the microcomputer functions as multiple information processing circuits provided in the image processing apparatus 1. Note that the example described here is to use software to realize the multiple information processing circuits provided in the image processing apparatus 1; however, it is also possible to prepare dedicated hardware for executing each information processing described below to configure the information processing circuits. Further, the multiple information processing circuits may be configured by individual hardware.
- the controller 20 includes a sound data acquisition unit 21, a frequency characteristics analysis unit 22, a fundamental frequency calculation unit 23, a sound data image generation unit 24, and a machine learning model generation unit 25, as the multiple information processing circuits.
- the sound data acquisition unit 21 acquires sound data via the microphone 10.
- the sound data acquired by the sound data acquisition unit 21 are converted into an electric signal and treated as time-series data.
- the sound data acquired by the sound data acquisition unit 21 is given a label indicating normal or abnormal and is used as machine learning teacher data. Note that the sound data is, for example, sound data of a machine used in a factory.
- the frequency characteristics analysis unit 22 analyzes frequency characteristics of the sound data acquired by the sound data acquisition unit 21.
- signal processing represented by FFT (Fast Fourier Transform) is used, for example.
- FFT Fast Fourier Transform
- the FFT converts time series data into frequency data to provide "frequency-energy characteristics".
- the fundamental frequency calculation unit 23 calculates a fundamental frequency of the sound data using the "frequency-energy characteristics" acquired by the frequency characteristics analysis unit 22.
- the fundamental frequency calculation unit 23 calculates harmonics corresponding to the calculated fundamental frequency.
- the sound data image generation unit 24 generates an image of the sound data using the fundamental frequency calculated by the fundamental frequency calculation unit 23.
- the machine learning model generation unit 25 generates an optimum machine learning model for determining normality and abnormality in the sound data using the image generated by the sound data image generation unit 24.
- the machine learning model generation unit 25 confirms the performance of determining normality and abnormality of sound data by multiple machine learning algorithms using cross verification or the like and outputs a model with the best performance. Note that the machine learning model generation unit 25 may also output other models together.
- the storage device 40 stores the "frequency-energy characteristics" acquired by the frequency characteristics analysis unit 22, the sound data image generated by the sound data image generation unit 24, the machine learning model generated by the machine learning model generation unit 25, and the like.
- the display 50 displays the machine learning model generated by the machine learning model generation unit 25 and its prediction performance and the like.
- An image 60 in Fig. 2A is an example of the image generated by the sound data image generation unit 24. First, a method of generating the image 60 is described. Details of the image 60 is described later.
- the sound data acquisition unit 21 acquires sound data of any machine. The sound data is converted into an electric signal. Note that the image 60 is acquired by converting sound data into image data and may be referred to as a sound image.
- the frequency characteristics analysis unit 22 analyzes the electric signal using the FFT.
- Fig. 2B illustrates an example of an analysis result.
- the vertical axis indicates sound pressures (dB(A)), and the horizontal axis indicates frequencies (Hz).
- the FFT provides the "frequency-energy characteristics" illustrated in Fig. 2B .
- the fundamental frequency calculation unit 23 calculates the fundamental frequency of sound data using the "frequency-energy characteristics" illustrated in Fig. 2B .
- the fundamental frequency refers to a frequency of the lowest frequency component when the signal (which refers to sound data converted into an electric signal here) is represented by the synthesis of sine waves.
- the fundamental frequency is sometimes called a fundamental wave.
- multiple peak frequencies (peaks of a spectrum) generally appears.
- the method of calculating the fundamental frequency is not limited, but for example, as illustrated in Fig. 2B , the minimum peak frequency (400Hz in Fig. 2B ) among the multiple peak frequencies may be calculated as the fundamental frequency.
- a difference of frequencies between peaks may be acquired, and when the difference is the same as the minimum peak frequency, the frequency may be calculated as the fundamental frequency.
- the fundamental frequency calculation unit 23 may calculate 400 Hz as the fundamental frequency.
- the difference is the same as the minimum peak frequency
- the fundamental frequency is set as 400 Hz.
- the fundamental frequency is one per sound data.
- the fundamental frequency calculation unit 23 calculates harmonics corresponding to the calculated fundamental frequency.
- Harmonics means a higher-order frequency component that includes integral multiples of a wave motion having a certain frequency component (here, the fundamental frequency component). Harmonics are sometimes called overtones in the field of music. As illustrated in Fig. 2B , large peaks are observed at frequencies that are integral multiples (2x, 3x, etc.) of the fundamental frequency (400 Hz).
- the fundamental frequency calculation unit 23 calculates frequencies (800 Hz, 1200 Hz, etc.) of integral multiples of as harmonics corresponding to the fundamental frequency.
- the sound data image generation unit 24 generates a two-dimensional image, such as a so-called heat map, as illustrated in Fig. 2A , using the fundamental frequency and harmonics calculated by the fundamental frequency calculation unit 23.
- the vertical axis represents overtones and the horizontal axis represents frequencies. More specifically, the horizontal axis indicates frequencies of 0 to 400 Hz.
- the overtones on the vertical axis mean overtones of the fundamental frequency (400 Hz).
- the image 60 is formed by multiple pixels indicating corresponding frequencies. In the image 60, under a pixel 60a indicating 400 Hz, a pixel 60b indicating 800 Hz (2 times 400 Hz) is arranged adjacently.
- the image 60 may be image data made from a two-dimensional matrix in which two-dimensional predetermined areas (areas where the pixels 60a, 60b are arranged) are set for respective frequency components, and these predetermined areas are arranged adjacently in the vertical and horizontal directions.
- the sound data image generation unit 24 converts the fundamental frequency component and harmonic component calculated by the fundamental frequency calculation unit 23 into image data.
- the fundamental frequency component converted into image data is represented as the pixel 60a (400 Hz).
- the harmonic component converted into the image data is represented as the pixel 60b (800 Hz).
- the image 60 (sound image) is generated in which the fundamental frequency component (pixel 60a indicating 400 Hz) and the harmonic component (pixel 60b indicating 800 Hz) converted into image data are arranged adjacently.
- the sound image is acquired by converting the fundamental frequency component included in sound data and the harmonic component into an image by predetermined processing.
- the image 60 is illustrated in a rectangular shape but is not limited to this.
- the image 60 may have a thin comb shape for increasing resolution.
- Each of the pixels is also illustrated in a rectangle shape but is not limited to this.
- the respective pixels are discretely arranged at a distance from each other but not limited thereto.
- the respective pixels may be continuously arranged without any distance from each other.
- the vertical axis and the horizontal axis may be interchanged.
- the fundamental frequency component and the harmonic component corresponding to the fundamental frequency component are arranged adjacently in the vertical axis but may be arranged adjacently in the horizontal axis.
- each pixel is set as a brightness or color corresponding to the amplitude of the sound data.
- the pixels 60a and 60b having large sound pressures are set to a dark color (for example, red), such as in a heat map.
- Other pixels for example, pixel 60c
- a light color for example, green
- the pixels 60d and 60e are examples of indication of an abnormality in sound data, and brightnesses or colors are set differently from other pixels. The brightnesses or colors of pixels are set so that the operator can grasp the intensity, normality, abnormality, and the like of the sound data at a glance.
- the machine learning model generation unit 25 generates an optimum machine learning model for determining normality and abnormality in sound data using the image 60 generated by the sound data image generation unit 24. As described above, the label indicating normal or abnormal is attached to the sound data. Thus, the machine learning in the first embodiment is so-called supervised learning.
- the machine learning model generation unit 25 generates a machine learning model using a well-known machine learning algorithm.
- Machine learning algorithms to be used include Decision Tree, Random Forest, Gradient Boosted Tree (GBT), General Linear Regression (GLR), Support Vector Machine (SVM), and Deep Learning.
- GBT Gradient Boosted Tree
- GLR General Linear Regression
- SVM Support Vector Machine
- Deep Learning Deep Learning
- the present invention is not limited thereto, and any algorithm capable of supervised learning may be used.
- the machine learning prediction performance is compared by any one of or a combination of items indicating the performance of the machine learning algorithm, such as Accuracy, Precision, and Recall.
- the model with the highest prediction performance is selected based on the comparison result.
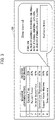
- the machine learning model generation unit 25 displays the generated machine learning model and its prediction performance on the display 50.
- the generated machine learning model (Decision Tree, etc.) and its prediction performance (70%, etc.) are displayed.
- details of the model (Deep Learning) with the highest prediction performance are displayed.
- Deep Learning the form, number of learning, ratio of normal and abnormal data, number of intermediate layers, and a Confusion Matrix acquired by cross validation.
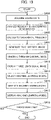
- step S101 the sound data acquisition unit 21 acquires sound data via the microphone 10.
- the acquired sound data are converted into an electric signal and treated as time series data.
- step S103 the frequency characteristics analysis unit 22 analyzes the electric signal acquired in step S101 using the FFT.
- the FFT provides the "frequency-energy characteristics" (see Fig. 2B ).
- step S105 the fundamental frequency calculation unit 23 calculates a fundamental frequency of the sound data using the "frequency-energy characteristics" acquired in step S103.
- the above-described method is used for calculating the fundamental frequency.
- step S107 the sound data image generation unit 24 generates the image 60, such as a heat map, using the fundamental frequency calculated in step S105 (see Fig. 2A ).
- the image 60 In the image 60, a fundamental frequency component and a harmonic component corresponding to the fundamental frequency component are arranged adjacently.
- step S109 the image 60 generated in step S107 is displayed on the display 50.
- Each of the pixels forming the image 60 is set as a brightness or color corresponding to an amplitude of the sound data.
- the operator who sees the image 60 can grasp the intensity, normality, abnormality, and the like of the sound data at a glance.
- the process proceeds to step Sill, and the machine learning model generation unit 25 selects an algorithm for generating a machine learning model.
- the selected algorithm includes Decision Tree, Random Forest, Gradient Boosted Tree (GBT), General Liner Regression (GLR), Support Vector Machine (SVM), and Deep Learning.
- step S113 the machine learning model generation unit 25 generates a machine learning model using the algorithm selected in step Sill.
- step S115 the machine learning model generation unit 25 displays the generated machine learning model and its prediction performance on the display 50 (see Fig. 3 ).
- a series of processing is repeatedly executed until completion (step S117).
- the image processing apparatus 1 provides the following advantageous effects.
- the fundamental frequency calculation unit 23 calculates a fundamental frequency component included in sound data and a harmonic component corresponding to the fundamental frequency component.
- the sound data image generation unit 24 converts the fundamental frequency component and harmonic component calculated by the fundamental frequency calculation unit 23 into image data.
- the sound data image generation unit 24 generates the image 60 (sound image) in which the fundamental frequency component (pixel 60a in Fig. 2A ) and harmonic component (pixel 60b in Fig. 2A ) converted into image data are arranged adjacently.
- the fundamental frequency component (pixel 60a) and the harmonic component (pixel 60b) have an overtone relationship.
- Monophonic tones such as those of automobile horns and stringed instruments, are influenced by their overtones. According to the first embodiment, such a relationship can be displayed as a sound image.
- the sound data image generation unit 24 arranges the fundamental frequency component (pixel 60a) and the harmonic component (pixel 60b) adjacent to each other on the vertical axis or the horizontal axis of the sound image. This enables the relationship between the fundamental frequency and the harmonic component to be displayed as a two-dimensional sound image.
- the sound data image generation unit 24 generates a sound image by converting the fundamental frequency component and the harmonic component into image data where brightnesses or colors corresponding to amplitudes of the sound data are set. This enables the intensity of the sound or the like to be clearly displayed as a sound image.
- the sound data image generation unit 24 arranges multiple frequency components of the sound data in the order of frequency on the vertical axis or the horizontal axis of the sound image. This enables the sound data to be displayed as a two-dimensional sound image.
- the second embodiment differs from the first embodiment in that the controller 20 includes a scale setting unit 26.
- a description of a configuration that overlaps the first embodiment is omitted with reference to reference numerals. The following description focuses on the difference.
- the scale setting unit 26 uses the "frequency-energy characteristics" acquired by the frequency characteristics analysis unit 22 to set a twelve-tone scale of "C, C#, D, D#, E, F, G, G#, A, A#, B, B#, (C)", which corresponds to the "do, re, mi, fa, sol, la, ti (do)” used in music, and octaves (1 to 10 octaves), which are overtones.
- the scale setting unit 26 classifies sounds of respective frequencies into the twelve-tone scale using the twelve-tone scale and octaves.
- An image 61 in Fig. 6 is an example of an image generated by the sound data image generation unit 24.
- the sound data image generation unit 24 generates the image 61 by arranging pixels indicating frequencies so as to correspond to the twelve-tone scale using the twelve-tone scale and octaves set by the scale setting unit 26 and the frequencies classified by the scale setting unit 26.
- the horizontal axis indicates the twelve-tone scale
- the vertical axis indicates octaves (overtones of frequencies).
- the first line of the image 61 indicates a scale from 32 Hz to 65 Hz, and as the line goes down, it indicates overtones. Note that in the example in Fig. 2 , overtones have been described as integral multiples of the fundamental frequency, but in the example in Fig. 6 , an overtone means that it is twice the frequency of the previous one.
- the fundamental frequency is not 400 Hz but any value.
- a pitch name corresponding to the pixel 60a indicating the fundamental frequency is "A”.
- a pitch name corresponding to the pixel 60b indicating a harmonic corresponding to the fundamental frequency is also "A”.
- the pixel 60a and the pixel 60b are arranged adjacent to each other. Generating the image 61 enables the sound data to be represented as a two-dimensional image adapted to human hearing characteristics.
- the image 61 is also illustrated in a rectangular shape like the image 60 (see Fig. 2A ) but is not limited thereto. Modifiable matters in the image 60 also apply to the image 61.
- the machine learning model generation unit 25 generates an optimum machine learning model for determining normality and abnormality in sound data using the image 61. Since the details are the same as those of the first embodiment, the description thereof is omitted.
- steps S201 to S205 and S209 to S219 are the same as those in steps S101 to S105 and S107 to S117 in Fig. 4 , and thus the description thereof is omitted.
- step S207 the scale setting unit 26 sets the twelve-tone scale and octaves that are overtones thereof using the "frequency-energy characteristics" acquired in step S203.
- the scale setting unit 26 classifies sounds of respective frequencies into the twelve-tone scale using the twelve-tone scale and octaves.
- the fundamental frequency component and the harmonic component have the same scale.
- the second embodiment enables music-related events, such as a scale and an octave, to be displayed as an image.
- the third embodiment differs from the first embodiment in that the controller 20 includes a critical band setting unit 27.
- a description of a configuration that overlaps the first embodiment is omitted with reference to reference numerals. The following description focuses on the difference.
- the critical band setting unit 27 sets the twelve-tone scale of "C, C#, D, D#, E, F, G, G#, A, A#, B, B#, (C)", which corresponds to the "do, re, mi, fa, sol, la, ti (do)" used in music, and a critical band (band numbers are 1 to 24), which is human hearing characteristics, using the "frequency-energy characteristics” acquired by the frequency characteristics analysis unit 22.
- the critical band setting unit 27 classifies sounds of respective frequencies into the twelve-tone scale using the twelve-tone scale and the critical band.
- the critical band is defined as a maximum frequency band when the sound intensity of band noise with a constant band sound pressure level is constant regardless of a bandwidth.
- the critical band is defined as a minimum frequency bandwidth of band noise, which becomes a sound pressure level at which a pure sound equal to a center frequency of the band noise is just heard when the bandwidth is increased while the spectrum level of the band noise is kept constant.
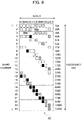
- An image 62 in Fig. 9 is an example of an image generated by the sound data image generation unit 24.
- the sound data image generation unit 24 generates the image 62 by arranging pixels indicating frequencies so as to correspond to the twelve-tone scale using the twelve-tone scale and critical band set by the critical band setting unit 27 and the frequencies classified by the critical band setting unit 27.
- the horizontal axis indicates the twelve-tone scale, and the vertical axis indicates a critical band (band numbers are 1 to 24).
- the "C, C#, D, D#, E, F, G, G#, A, A#, B, B#, C" in Fig. 6 is omitted.
- the horizontal axis indicates 32 Hz to 130 Hz, which is a combination of a first octave and a second octave.
- the number of the critical band indicates the minimum frequency in that critical band.
- the vertical axis is indicated by frequency, the frequency increases in the order of 100 Hz, 200 Hz, 300 Hz, 400 Hz, and 510 Hz.
- the fundamental frequency is not 400 Hz but any value.
- a pixel 60a indicating a fundamental frequency and a pixel 60b indicating a harmonic corresponding to the fundamental frequency are arranged adjacently.
- the image 62 is also illustrated in a rectangular shape like the image 60 (see Fig. 2A ) but is not limited thereto. Modifiable matters in the image 60 also apply to the image 62.
- the machine learning model generation unit 25 generates an optimum machine learning model for determining normality and abnormality in sound data using the image 62.
- the details are the same as those of the first embodiment, and thus the description thereof is omitted.
- steps S301 to S305 and S309 to S319 are the same as those in steps S101 to S105 and S107 to S117 in Fig. 4 , and thus the description thereof is omitted.
- step S307 the critical band setting unit 27 sets the twelve-tone scale and the critical band using the "frequency-energy characteristics" acquired in step S303.
- the critical band setting unit 27 classifies sounds of respective frequencies into the twelve-tone scale using the twelve-tone scale and the critical band.
- the fundamental frequency component and the harmonic component have a relationship with respect to the critical band of human hearing.
- the third embodiment enables such a relationship to be displayed as an image.
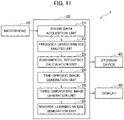
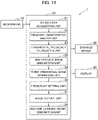
- the fourth embodiment differs from the first embodiment in that the controller 20 includes a time-specific image generation unit 28 and a three-dimensional image generation unit 29 instead of the sound data image generation unit 24 (see Fig. 11 ).
- the controller 20 includes a time-specific image generation unit 28 and a three-dimensional image generation unit 29 instead of the sound data image generation unit 24 (see Fig. 11 ).
- a description of a configuration that overlaps the first embodiment is omitted with reference to reference numerals. The following description focuses on the difference.
- the image 60 in Fig. 12 is the same as that in Fig. 2A .
- the time-specific image generation unit 28 generates the image 60 using the fundamental frequency and harmonics calculated by the fundamental frequency calculation unit 23. Further, the time-specific image generation unit 28 performs the same processing every predetermined time to generate image 63 to 65.
- the three-dimensional image generation unit 29 generates a three-dimensional image 70 using the images 60, and 63 to 65 at every predetermined time generated by the time-specific image generation unit 28. Specifically, the three-dimensional image generation unit 29 adds a time axis to the images 60, and 63 to 65 (two-dimensional images) to generate the three-dimensional image 70. Modifiable matters in the image 60 also apply to the three-dimensional image 70. Due to calculation characteristics of the FFT, the data at every predetermined time are generally calculated by overlapping the data before and after the time axis, and a value at the predetermined time is calculated using data with a time length such that it has a predetermined frequency resolution.
- the machine learning model generation unit 25 generates an optimum machine learning model for determining normality and abnormality in sound data using the three-dimensional image 70.
- the details are the same as those of the first embodiment, and thus the description thereof is omitted.
- steps S401 to S405 and S413 to S419 are the same as those in steps S101 to S105 and S111 to S117 in Fig. 4 , and thus the description thereof is omitted.
- step S407 the time-specific image generation unit 28 generates the images 60, and 63 to 65 at predetermined intervals using the fundamental frequency and harmonics acquired in step S405.
- step S409 the three-dimensional image generation unit 29 generates the three-dimensional image 70 using the images 60, and 63 to 65 generated at every predetermined time in step S407.
- step S411 the three-dimensional image 70 generated in step S409 is displayed on the display 50.
- Each pixel forming the three-dimensional image 70 is set as a brightness or color corresponding to the amplitude of the sound data.
- the operator who sees the three-dimensional image 70 can grasp the intensity, normality, abnormality, and the like of the sound data at a glance.
- the fourth embodiment enables sound data to be displayed as a three-dimensional image.
- the fifth embodiment differs from the fourth embodiment in that the controller 20 further includes a frequency setting unit 30 and an image cutout unit 31 (see Fig. 14 ).
- the controller 20 further includes a frequency setting unit 30 and an image cutout unit 31 (see Fig. 14 ).
- a description of the configuration that overlaps the fourth embodiment is omitted with reference to reference numerals. The following description focuses on the difference.
- the frequency setting unit 30 sets a frequency to be extracted from the three-dimensional image 70.
- the frequency set by the frequency setting unit 30 is any frequency, and the fundamental frequency may be set.
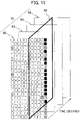
- the image cutout unit 31 cuts out pixels related to the frequency set by the frequency setting unit 30. Specifically, as illustrated in Fig. 15 , the image cutout unit 31 cuts out data 80 of a plurality of pixels corresponding to the frequency set by the frequency setting unit 30. The image cutout unit 31 generates a spectrogram using the cutout data 80.
- a spectrogram is an arrangement in which a spectrum of frequency characteristics is arranged on a time axis, and intensity is represented by colors, like a heat map.
- the machine learning model generation unit 25 generates an optimum machine learning model for determining normality and abnormality in sound data using the spectrogram.
- the details are the same as those of the first embodiment, and thus the description thereof is omitted.
- steps S501 to S509 and S515 to S521 are the same as those in steps S401 to S409 and S413 to S419 in Fig. 13 , the description thereof is omitted.
- step S511 the frequency setting unit 30 sets a frequency to be extracted from the three-dimensional image 70.
- the process proceeds to step S513, and the image cutout unit 31 cuts out pixels relating to the frequency set in step S511.
- the image cutout unit 31 generates a spectrogram using the cutout pixels.
- the fifth embodiment enables analysis to be performed using a spectrogram.
- the sixth embodiment differs from the first embodiment in that the controller 20 includes a new sound data acquisition unit 32, an image processing unit 33, and a determination unit 34.
- the controller 20 includes a new sound data acquisition unit 32, an image processing unit 33, and a determination unit 34.
- a description of a configuration that overlaps the first embodiment is omitted with reference to reference numerals. The following description focuses on the difference.
- the new sound data acquisition unit 32 acquires new sound data via a microphone 11 different from the microphone 10.
- the microphones 10 and 11 are attached to machines of the same type.
- the sound data image generation unit 24 generates an image of the new sound data.
- the image processing unit 33 uses the image of the new sound data as input data of the machine learning model generated by the machine learning model generation unit 25.
- the image processing unit 33 outputs an index, such as the degree of agreement of images, using a predetermined image processing method.
- the determination unit 34 compares the output value output by the image processing unit 33 with a preset threshold value. When the output value is greater than the threshold value, the determination unit 34 determines that the sound data is normal. In contrast, when the output value is equal to or less than the threshold value, the determination unit 34 determines that the sound data is abnormal. Note that the determination method is not limited to a method using a threshold value, and other methods may be used.
- the determination result by the determination unit 34 is displayed on the display 50. Although not illustrated, the determination result by the determination unit 34 may be notified by voice through a speaker. When the determination result by the determination unit 34 is abnormal, a red rotating light may be turned on.
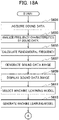
- step S601 to S613 are the same as those in steps S101 to S113 in Fig. 4 , and thus the description thereof is omitted.
- step S615 the new sound data acquisition unit 32 acquires new sound data via the microphone 11.
- the acquired new sound data is converted into an electric signal and treated as time series data.
- step S617 the frequency characteristics analysis unit 22 analyzes the electric signal acquired in step S615 using the FFT.
- the FFT provides the "frequency-energy characteristics".
- step S619 the fundamental frequency calculation unit 23 calculates a fundamental frequency of the new sound data using the "frequency-energy characteristics" acquired in step S617.
- step S621 it is determined whether the fundamental frequency calculated in step S619 agrees with the fundamental frequency of the machine learning model generated in step S613. The reason for this determination is that when the fundamental frequencies are different, the machine learning model cannot perform the normal and abnormal determination processing. Note that "the fundamental frequencies agree with each other" means substantial agreement.
- step S621 When the fundamental frequencies do not agree with each other (NO in step S621), "Determination processing not possible due to disagreement of fundamental frequencies" is displayed on the display 50, and the process proceeds to step S631. In contrast, when the fundamental frequencies agree with each other (YES in step S621), the process proceeds to step S623, and the sound data image generation unit 24 generates an image of the new sound data using the fundamental frequency calculated in step S619.
- step S625 the image processing unit 33 uses the image of the new sound data generated in step S623 as input data for the machine learning model.
- the image processing unit 33 outputs an index, such as the degree of agreement of images, using a predetermined image processing method.
- the determination unit 34 compares the output value output by the image processing unit 33 with a preset threshold value to determine whether the sound data is normal or abnormal.
- step S627 the determination result of step S625 is displayed on the display 50.
- step S629 a file name of the new sound data, a name of the machine learning model, a processing execution time, a value of the fundamental frequency, a determination result, and the like are stored in the storage device 40.
- a series of processing is repeatedly executed until completion (step S631). Note that when the processing is completed, a notice "End of normal/abnormal determination processing" may be displayed on the display 50.
- the sixth embodiment makes it possible to determine whether other sound data are normal or abnormal using a machine learning model acquired by imaging sound data.
- the processing circuit includes a programmed processing device, such as a processing device including an electric circuit.
- the processing circuit also includes devices, such as an application specific integrated circuit (ASIC) arranged to perform the described functions and circuit components.
- ASIC application specific integrated circuit
- a machine learning model is used as a method for determining normality and abnormality in other sound data, but the method is not limited thereto.
- an abnormality in the image may be determined by comparing the fundamental frequency component and harmonic component with other frequency components. This makes it possible to determine whether the sound data is normal or abnormal in a case where there is no overtone relation, such as a critical band.
- the determination unit 34 may determine an abnormality in a predetermined sound included in sound data using the image 60 (sound image).
- the image 60 may be made from a two-dimensional matrix including a fundamental frequency component and harmonic component converted into image data, and other frequency components converted into image data, wherein a predetermined area is set for each frequency component.
- the other frequency components mean frequency components other than the fundamental frequency component and the harmonic component.
Landscapes
- Engineering & Computer Science (AREA)
- Physics & Mathematics (AREA)
- General Physics & Mathematics (AREA)
- Theoretical Computer Science (AREA)
- Multimedia (AREA)
- Health & Medical Sciences (AREA)
- Audiology, Speech & Language Pathology (AREA)
- Computational Linguistics (AREA)
- Signal Processing (AREA)
- Acoustics & Sound (AREA)
- Human Computer Interaction (AREA)
- Computing Systems (AREA)
- Spectroscopy & Molecular Physics (AREA)
- Artificial Intelligence (AREA)
- Computer Vision & Pattern Recognition (AREA)
- Software Systems (AREA)
- Databases & Information Systems (AREA)
- Evolutionary Computation (AREA)
- General Health & Medical Sciences (AREA)
- Medical Informatics (AREA)
- Quality & Reliability (AREA)
- Data Mining & Analysis (AREA)
- Measurement Of Mechanical Vibrations Or Ultrasonic Waves (AREA)
- Image Analysis (AREA)
- Testing Of Devices, Machine Parts, Or Other Structures Thereof (AREA)
Abstract
Description
- The present invention relates to an image processing apparatus and an image processing method.
- A method for determining whether a sound of a device is normal or abnormal has been known (Patent Literature 1). The invention described in
Patent Literature 1 determines whether a sound of a device is normal or abnormal using a locus vector indicating intensity features in all time directions and a previously learned identification parameter. - Patent Literature 1:
WO 2015/068446 - When a machine learning model for determining an abnormality using sound data is generated, it is conceivable to generate a machine learning model by quantifying sound data by physical quantities, such as sound pressure (dB) indicating the magnitude of sound data and frequency (Hz) indicating the pitch of sound data. Although it is possible to effectively generate a machine learning model by imaging sound data, the invention described in
Patent Literature 1 does not mention imaging of sound data. - In response to the above issue, an object of the present invention is to provide an image processing apparatus and an image processing method of imaging sound data.
- An image processing apparatus according to one aspect of the present invention calculates a fundamental frequency component included in sound data and a harmonic component corresponding to the fundamental frequency component, converts the fundamental frequency component and the harmonic component into image data, and generates a sound image where the fundamental frequency component and the harmonic component that have been converted into the image data are arranged adjacent each other.
- The present invention enables a machine learning model of sound data to be generated by imaging sound data.
-
- [
Fig. 1] Fig. 1 is a schematic configuration diagram illustrating animage processing apparatus 1 according to a first embodiment of the present invention. - [
Fig. 2A] Fig. 2A is an example of an image of sound data according to the first embodiment of the present invention. - [
Fig. 2B] Fig. 2B is an example of a frequency analysis result. - [
Fig. 3] Fig. 3 is an example of a machine learning model displayed on adisplay 50. - [
Fig. 4] Fig. 4 is a flowchart illustrating an operation example of theimage processing apparatus 1 according to the first embodiment of the present invention. - [
Fig. 5] Fig. 5 is a schematic configuration diagram illustrating animage processing apparatus 1 according to a second embodiment of the present invention. - [
Fig. 6] Fig. 6 is an example of an image of sound data according to the second embodiment of the present invention. - [
Fig. 7] Fig. 7 is a flowchart illustrating an operation example of theimage processing apparatus 1 according to the second embodiment of the present invention. - [
Fig. 8] Fig. 8 is a schematic configuration diagram illustrating animage processing apparatus 1 according to a third embodiment of the present invention. - [
Fig. 9] Fig. 9 is an example of an image of sound data according to the third embodiment of the present invention. - [
Fig. 10] Fig. 10 is a flowchart illustrating an operation example of theimage processing apparatus 1 according to the third embodiment of the present invention. - [
Fig. 11] Fig. 11 is a schematic configuration diagram illustrating animage processing apparatus 1 according to a fourth embodiment of the present invention. - [
Fig. 12] Fig. 12 is an example of an image of sound data according to the fourth embodiment of the present invention. - [
Fig. 13] Fig. 13 is a flowchart illustrating an operation example of theimage processing apparatus 1 according to the fourth embodiment of the present invention. - [
Fig. 14] Fig. 14 is a schematic configuration diagram of animage processing apparatus 1 according to a fifth embodiment of the present invention. - [
Fig. 15] Fig. 15 is a diagram illustrating an example of a method of cutting out an image of sound data. - [
Fig. 16] Fig. 16 is a flowchart illustrating an operation example of theimage processing apparatus 1 according to the fifth embodiment of the present invention. - [
Fig. 17] Fig. 17 is a schematic configuration diagram of animage processing apparatus 1 according to a sixth embodiment of the present invention. - [
Fig. 18A] Fig. 18A is a flowchart illustrating an operation example of theimage processing apparatus 1 according to the sixth embodiment of the present invention. - [
Fig. 18B] Fig. 18B is a flowchart illustrating an operation example of theimage processing apparatus 1 according to the sixth embodiment of the present invention. - Embodiments of the present invention are described below with reference to the drawings. In the drawings, the same parts are denoted by the same reference numerals, and the description thereof is omitted.
- A configuration example of an
image processing apparatus 1 according to a first embodiment is described with reference toFig. 1 . As illustrated inFig. 1 , theimage processing apparatus 1 includes acontroller 20, astorage device 40, and adisplay 50. - The
controller 20 acquires sound data via amicrophone 10 and analyzes the acquired sound data. Thecontroller 20 is a general-purpose microcomputer including a CPU (central processing unit), a memory, and an input/output unit. The microcomputer has a computer program installed to function as theimage processing apparatus 1. By executing the computer program, the microcomputer functions as multiple information processing circuits provided in theimage processing apparatus 1. Note that the example described here is to use software to realize the multiple information processing circuits provided in theimage processing apparatus 1; however, it is also possible to prepare dedicated hardware for executing each information processing described below to configure the information processing circuits. Further, the multiple information processing circuits may be configured by individual hardware. Thecontroller 20 includes a sounddata acquisition unit 21, a frequencycharacteristics analysis unit 22, a fundamentalfrequency calculation unit 23, a sound dataimage generation unit 24, and a machine learningmodel generation unit 25, as the multiple information processing circuits. - As described above, the sound
data acquisition unit 21 acquires sound data via themicrophone 10. The sound data acquired by the sounddata acquisition unit 21 are converted into an electric signal and treated as time-series data. The sound data acquired by the sounddata acquisition unit 21 is given a label indicating normal or abnormal and is used as machine learning teacher data. Note that the sound data is, for example, sound data of a machine used in a factory. - The frequency
characteristics analysis unit 22 analyzes frequency characteristics of the sound data acquired by the sounddata acquisition unit 21. As an analysis method, signal processing represented by FFT (Fast Fourier Transform) is used, for example. The FFT converts time series data into frequency data to provide "frequency-energy characteristics". - The fundamental
frequency calculation unit 23 calculates a fundamental frequency of the sound data using the "frequency-energy characteristics" acquired by the frequencycharacteristics analysis unit 22. The fundamentalfrequency calculation unit 23 calculates harmonics corresponding to the calculated fundamental frequency. - The sound data
image generation unit 24 generates an image of the sound data using the fundamental frequency calculated by the fundamentalfrequency calculation unit 23. - The machine learning
model generation unit 25 generates an optimum machine learning model for determining normality and abnormality in the sound data using the image generated by the sound dataimage generation unit 24. The machine learningmodel generation unit 25 confirms the performance of determining normality and abnormality of sound data by multiple machine learning algorithms using cross verification or the like and outputs a model with the best performance. Note that the machine learningmodel generation unit 25 may also output other models together. - The
storage device 40 stores the "frequency-energy characteristics" acquired by the frequencycharacteristics analysis unit 22, the sound data image generated by the sound dataimage generation unit 24, the machine learning model generated by the machine learningmodel generation unit 25, and the like. - The
display 50 displays the machine learning model generated by the machine learningmodel generation unit 25 and its prediction performance and the like. - Next, an example of the image generated by the sound data
image generation unit 24 is described with reference toFigs. 2A and2B . - An
image 60 inFig. 2A is an example of the image generated by the sound dataimage generation unit 24. First, a method of generating theimage 60 is described. Details of theimage 60 is described later. The sounddata acquisition unit 21 acquires sound data of any machine. The sound data is converted into an electric signal. Note that theimage 60 is acquired by converting sound data into image data and may be referred to as a sound image. - The frequency
characteristics analysis unit 22 analyzes the electric signal using the FFT.Fig. 2B illustrates an example of an analysis result. InFig. 2B , the vertical axis indicates sound pressures (dB(A)), and the horizontal axis indicates frequencies (Hz). The FFT provides the "frequency-energy characteristics" illustrated inFig. 2B . - The fundamental
frequency calculation unit 23 calculates the fundamental frequency of sound data using the "frequency-energy characteristics" illustrated inFig. 2B . The fundamental frequency refers to a frequency of the lowest frequency component when the signal (which refers to sound data converted into an electric signal here) is represented by the synthesis of sine waves. The fundamental frequency is sometimes called a fundamental wave. According to the FFT, as illustrated inFig. 2B , multiple peak frequencies (peaks of a spectrum) generally appears. The method of calculating the fundamental frequency is not limited, but for example, as illustrated inFig. 2B , the minimum peak frequency (400Hz inFig. 2B ) among the multiple peak frequencies may be calculated as the fundamental frequency. - As another calculation method, a frequency between peaks may be calculated as the fundamental frequency. As illustrated in
Fig. 2B , large peaks appear at 1200 Hz and 1600 Hz. The frequency between the peaks (1600 - 1200 = 400 Hz) may be calculated as the fundamental frequency. - As another calculation method, a difference of frequencies between peaks may be acquired, and when the difference is the same as the minimum peak frequency, the frequency may be calculated as the fundamental frequency. Specifically, as illustrated in
Fig. 2B , since the difference in frequency between the peaks (400 Hz as described above) is the same as the minimum peak frequency (400 Hz), the fundamentalfrequency calculation unit 23 may calculate 400 Hz as the fundamental frequency. Here, "the difference is the same as the minimum peak frequency" is not limited to the exact same. "The difference is the same as the minimum peak frequency" means substantially the same (can be regarded as nearly the same). In the first embodiment, the fundamental frequency is set as 400 Hz. The fundamental frequency is one per sound data. - Next, the fundamental
frequency calculation unit 23 calculates harmonics corresponding to the calculated fundamental frequency. Harmonics means a higher-order frequency component that includes integral multiples of a wave motion having a certain frequency component (here, the fundamental frequency component). Harmonics are sometimes called overtones in the field of music. As illustrated inFig. 2B , large peaks are observed at frequencies that are integral multiples (2x, 3x, etc.) of the fundamental frequency (400 Hz). The fundamentalfrequency calculation unit 23 calculates frequencies (800 Hz, 1200 Hz, etc.) of integral multiples of as harmonics corresponding to the fundamental frequency. - The sound data
image generation unit 24 generates a two-dimensional image, such as a so-called heat map, as illustrated inFig. 2A , using the fundamental frequency and harmonics calculated by the fundamentalfrequency calculation unit 23. InFig. 2A , the vertical axis represents overtones and the horizontal axis represents frequencies. More specifically, the horizontal axis indicates frequencies of 0 to 400 Hz. The overtones on the vertical axis mean overtones of the fundamental frequency (400 Hz). Theimage 60 is formed by multiple pixels indicating corresponding frequencies. In theimage 60, under apixel 60a indicating 400 Hz, apixel 60b indicating 800 Hz (2times 400 Hz) is arranged adjacently. The same applies below, and under thepixel 60b indicating 800 Hz, a pixel indicating 1200 Hz (3times 400 Hz) is arranged adjacently. In the lower right of theimage 60, a pixel indicating 8400 Hz (21times 400 Hz) is arranged. In the horizontal axis and the vertical axis, the pixels are arranged in frequency order. Theimage 60 may be image data made from a two-dimensional matrix in which two-dimensional predetermined areas (areas where thepixels - In this way, the sound data
image generation unit 24 converts the fundamental frequency component and harmonic component calculated by the fundamentalfrequency calculation unit 23 into image data. The fundamental frequency component converted into image data is represented as thepixel 60a (400 Hz). The harmonic component converted into the image data is represented as thepixel 60b (800 Hz). As illustrated inFig. 2A , the image 60 (sound image) is generated in which the fundamental frequency component (pixel 60a indicating 400 Hz) and the harmonic component (pixel 60b indicating 800 Hz) converted into image data are arranged adjacently. The sound image is acquired by converting the fundamental frequency component included in sound data and the harmonic component into an image by predetermined processing. - The
image 60 is illustrated in a rectangular shape but is not limited to this. For example, theimage 60 may have a thin comb shape for increasing resolution. Each of the pixels is also illustrated in a rectangle shape but is not limited to this. Further, the respective pixels are discretely arranged at a distance from each other but not limited thereto. The respective pixels may be continuously arranged without any distance from each other. The vertical axis and the horizontal axis may be interchanged. InFig. 2A , the fundamental frequency component and the harmonic component corresponding to the fundamental frequency component are arranged adjacently in the vertical axis but may be arranged adjacently in the horizontal axis. - In
Fig. 2A , each pixel is set as a brightness or color corresponding to the amplitude of the sound data. For example, thepixels pixel 60c) are set to a light color (for example, green), such as in a heat map. Note that thepixels - Next, a machine learning model is described with reference to
Fig. 3 . The machine learningmodel generation unit 25 generates an optimum machine learning model for determining normality and abnormality in sound data using theimage 60 generated by the sound dataimage generation unit 24. As described above, the label indicating normal or abnormal is attached to the sound data. Thus, the machine learning in the first embodiment is so-called supervised learning. - The machine learning
model generation unit 25 generates a machine learning model using a well-known machine learning algorithm. Machine learning algorithms to be used include Decision Tree, Random Forest, Gradient Boosted Tree (GBT), General Linear Regression (GLR), Support Vector Machine (SVM), and Deep Learning. However, the present invention is not limited thereto, and any algorithm capable of supervised learning may be used. - The machine learning prediction performance is compared by any one of or a combination of items indicating the performance of the machine learning algorithm, such as Accuracy, Precision, and Recall. The model with the highest prediction performance is selected based on the comparison result.
- As illustrated in
Fig. 3 , the machine learningmodel generation unit 25 displays the generated machine learning model and its prediction performance on thedisplay 50. On the left side of thedisplay 50, the generated machine learning model (Decision Tree, etc.) and its prediction performance (70%, etc.) are displayed. On the right side of thedisplay 50, details of the model (Deep Learning) with the highest prediction performance are displayed. As the details of Deep Learning, the form, number of learning, ratio of normal and abnormal data, number of intermediate layers, and a Confusion Matrix acquired by cross validation. - Next, an operation example of the
image processing apparatus 1 according to the first embodiment is described with reference to a flowchart ofFig. 4 . - In step S101, the sound
data acquisition unit 21 acquires sound data via themicrophone 10. The acquired sound data are converted into an electric signal and treated as time series data. The process proceeds to step S103, and the frequencycharacteristics analysis unit 22 analyzes the electric signal acquired in step S101 using the FFT. The FFT provides the "frequency-energy characteristics" (seeFig. 2B ). - The process proceeds to step S105, and the fundamental
frequency calculation unit 23 calculates a fundamental frequency of the sound data using the "frequency-energy characteristics" acquired in step S103. The above-described method is used for calculating the fundamental frequency. The process proceeds to step S107, and the sound dataimage generation unit 24 generates theimage 60, such as a heat map, using the fundamental frequency calculated in step S105 (seeFig. 2A ). In theimage 60, a fundamental frequency component and a harmonic component corresponding to the fundamental frequency component are arranged adjacently. - The process proceeds to step S109, and the
image 60 generated in step S107 is displayed on thedisplay 50. Each of the pixels forming theimage 60 is set as a brightness or color corresponding to an amplitude of the sound data. Thus, the operator who sees theimage 60 can grasp the intensity, normality, abnormality, and the like of the sound data at a glance. - The process proceeds to step Sill, and the machine learning
model generation unit 25 selects an algorithm for generating a machine learning model. The selected algorithm includes Decision Tree, Random Forest, Gradient Boosted Tree (GBT), General Liner Regression (GLR), Support Vector Machine (SVM), and Deep Learning. - The process proceeds to step S113, and the machine learning
model generation unit 25 generates a machine learning model using the algorithm selected in step Sill. The process proceeds to step S115, and the machine learningmodel generation unit 25 displays the generated machine learning model and its prediction performance on the display 50 (seeFig. 3 ). A series of processing is repeatedly executed until completion (step S117). - As described above, the
image processing apparatus 1 according to the first embodiment provides the following advantageous effects. - The fundamental
frequency calculation unit 23 calculates a fundamental frequency component included in sound data and a harmonic component corresponding to the fundamental frequency component. The sound dataimage generation unit 24 converts the fundamental frequency component and harmonic component calculated by the fundamentalfrequency calculation unit 23 into image data. The sound dataimage generation unit 24 generates the image 60 (sound image) in which the fundamental frequency component (pixel 60a inFig. 2A ) and harmonic component (pixel 60b inFig. 2A ) converted into image data are arranged adjacently. By generating a sound image having such an arrangement, it is possible to effectively generate a machine learning model. Thus, it is possible to clearly display or process the amount of sensation, such as a timbre, which cannot be digitized by a time-series sound signal or spectral characteristics by FFT. - The fundamental frequency component (
pixel 60a) and the harmonic component (pixel 60b) have an overtone relationship. Monophonic tones, such as those of automobile horns and stringed instruments, are influenced by their overtones. According to the first embodiment, such a relationship can be displayed as a sound image. - The sound data
image generation unit 24 arranges the fundamental frequency component (pixel 60a) and the harmonic component (pixel 60b) adjacent to each other on the vertical axis or the horizontal axis of the sound image. This enables the relationship between the fundamental frequency and the harmonic component to be displayed as a two-dimensional sound image. - The sound data
image generation unit 24 generates a sound image by converting the fundamental frequency component and the harmonic component into image data where brightnesses or colors corresponding to amplitudes of the sound data are set. This enables the intensity of the sound or the like to be clearly displayed as a sound image. - The sound data
image generation unit 24 arranges multiple frequency components of the sound data in the order of frequency on the vertical axis or the horizontal axis of the sound image. This enables the sound data to be displayed as a two-dimensional sound image. - Next, a second embodiment of the present invention is described with reference to
Fig. 5 . The second embodiment differs from the first embodiment in that thecontroller 20 includes ascale setting unit 26. A description of a configuration that overlaps the first embodiment is omitted with reference to reference numerals. The following description focuses on the difference. - The
scale setting unit 26 uses the "frequency-energy characteristics" acquired by the frequencycharacteristics analysis unit 22 to set a twelve-tone scale of "C, C#, D, D#, E, F, G, G#, A, A#, B, B#, (C)", which corresponds to the "do, re, mi, fa, sol, la, ti (do)" used in music, and octaves (1 to 10 octaves), which are overtones. Thescale setting unit 26 classifies sounds of respective frequencies into the twelve-tone scale using the twelve-tone scale and octaves. - Next, an example of an image generated by the sound data
image generation unit 24 is described with reference toFig. 6 . - An
image 61 inFig. 6 is an example of an image generated by the sound dataimage generation unit 24. The sound dataimage generation unit 24 generates theimage 61 by arranging pixels indicating frequencies so as to correspond to the twelve-tone scale using the twelve-tone scale and octaves set by thescale setting unit 26 and the frequencies classified by thescale setting unit 26. InFig. 6 , the horizontal axis indicates the twelve-tone scale, and the vertical axis indicates octaves (overtones of frequencies). The first line of theimage 61 indicates a scale from 32 Hz to 65 Hz, and as the line goes down, it indicates overtones. Note that in the example inFig. 2 , overtones have been described as integral multiples of the fundamental frequency, but in the example inFig. 6 , an overtone means that it is twice the frequency of the previous one. - In the second embodiment, the fundamental frequency is not 400 Hz but any value. A pitch name corresponding to the
pixel 60a indicating the fundamental frequency is "A". A pitch name corresponding to thepixel 60b indicating a harmonic corresponding to the fundamental frequency is also "A". As illustrated inFig. 6 , thepixel 60a and thepixel 60b are arranged adjacent to each other. Generating theimage 61 enables the sound data to be represented as a two-dimensional image adapted to human hearing characteristics. - The
image 61 is also illustrated in a rectangular shape like the image 60 (seeFig. 2A ) but is not limited thereto. Modifiable matters in theimage 60 also apply to theimage 61. - The machine learning
model generation unit 25 generates an optimum machine learning model for determining normality and abnormality in sound data using theimage 61. Since the details are the same as those of the first embodiment, the description thereof is omitted. - Next, an operation example of the
image processing apparatus 1 according to the second embodiment is described with reference to a flowchart ofFig. 7 . However, the processes in steps S201 to S205 and S209 to S219 are the same as those in steps S101 to S105 and S107 to S117 inFig. 4 , and thus the description thereof is omitted. - In step S207, the
scale setting unit 26 sets the twelve-tone scale and octaves that are overtones thereof using the "frequency-energy characteristics" acquired in step S203. Thescale setting unit 26 classifies sounds of respective frequencies into the twelve-tone scale using the twelve-tone scale and octaves. - In the second embodiment, the fundamental frequency component and the harmonic component have the same scale. The second embodiment enables music-related events, such as a scale and an octave, to be displayed as an image.
- Next, a third embodiment of the present invention is described with reference to
Fig. 8 . The third embodiment differs from the first embodiment in that thecontroller 20 includes a criticalband setting unit 27. A description of a configuration that overlaps the first embodiment is omitted with reference to reference numerals. The following description focuses on the difference. - The critical
band setting unit 27 sets the twelve-tone scale of "C, C#, D, D#, E, F, G, G#, A, A#, B, B#, (C)", which corresponds to the "do, re, mi, fa, sol, la, ti (do)" used in music, and a critical band (band numbers are 1 to 24), which is human hearing characteristics, using the "frequency-energy characteristics" acquired by the frequencycharacteristics analysis unit 22. The criticalband setting unit 27 classifies sounds of respective frequencies into the twelve-tone scale using the twelve-tone scale and the critical band. - The critical band is defined as a maximum frequency band when the sound intensity of band noise with a constant band sound pressure level is constant regardless of a bandwidth. As another definition, the critical band is defined as a minimum frequency bandwidth of band noise, which becomes a sound pressure level at which a pure sound equal to a center frequency of the band noise is just heard when the bandwidth is increased while the spectrum level of the band noise is kept constant.
- Next, an example of an image generated by the sound data
image generation unit 24 is described with reference toFig. 9 . - An
image 62 inFig. 9 is an example of an image generated by the sound dataimage generation unit 24. The sound dataimage generation unit 24 generates theimage 62 by arranging pixels indicating frequencies so as to correspond to the twelve-tone scale using the twelve-tone scale and critical band set by the criticalband setting unit 27 and the frequencies classified by the criticalband setting unit 27. - In
Fig. 9 , the horizontal axis indicates the twelve-tone scale, and the vertical axis indicates a critical band (band numbers are 1 to 24). InFig. 9 , the "C, C#, D, D#, E, F, G, G#, A, A#, B, B#, C" inFig. 6 is omitted. InFig. 9 , the horizontal axis indicates 32 Hz to 130 Hz, which is a combination of a first octave and a second octave. The number of the critical band indicates the minimum frequency in that critical band. When the vertical axis is indicated by frequency, the frequency increases in the order of 100 Hz, 200 Hz, 300 Hz, 400 Hz, and 510 Hz. The reason why the increase in frequency is irregular on the vertical axis is because it simulates human hearing characteristics. Dashed-dotted lines inFig. 9 indicate sensitivity characteristics with respect to the loudness of sound. A band surrounded by a dashed-dotted line indicates having a similar sensitivity characteristic. - In the third embodiment, the fundamental frequency is not 400 Hz but any value. As illustrated in
Fig. 9 , apixel 60a indicating a fundamental frequency and apixel 60b indicating a harmonic corresponding to the fundamental frequency are arranged adjacently. By generating theimage 62 in which the fundamental frequency component and harmonic component having a relationship with respect to the critical band of human hearing are arranged adjacently, it is possible to represent sound data as a two-dimensional image matching human hearing characteristics. - The
image 62 is also illustrated in a rectangular shape like the image 60 (seeFig. 2A ) but is not limited thereto. Modifiable matters in theimage 60 also apply to theimage 62. - The machine learning
model generation unit 25 generates an optimum machine learning model for determining normality and abnormality in sound data using theimage 62. The details are the same as those of the first embodiment, and thus the description thereof is omitted. - Next, an operation example of the
image processing apparatus 1 according to the third embodiment is described with reference to a flowchart ofFig. 10 . However, the processes in steps S301 to S305 and S309 to S319 are the same as those in steps S101 to S105 and S107 to S117 inFig. 4 , and thus the description thereof is omitted. - In step S307, the critical
band setting unit 27 sets the twelve-tone scale and the critical band using the "frequency-energy characteristics" acquired in step S303. The criticalband setting unit 27 classifies sounds of respective frequencies into the twelve-tone scale using the twelve-tone scale and the critical band. - In the third embodiment, the fundamental frequency component and the harmonic component have a relationship with respect to the critical band of human hearing. The third embodiment enables such a relationship to be displayed as an image.
- Next, a fourth embodiment of the present invention is described with reference to
Figs. 11 to 12 . The fourth embodiment differs from the first embodiment in that thecontroller 20 includes a time-specificimage generation unit 28 and a three-dimensionalimage generation unit 29 instead of the sound data image generation unit 24 (seeFig. 11 ). A description of a configuration that overlaps the first embodiment is omitted with reference to reference numerals. The following description focuses on the difference. - The
image 60 inFig. 12 is the same as that inFig. 2A . The time-specificimage generation unit 28 generates theimage 60 using the fundamental frequency and harmonics calculated by the fundamentalfrequency calculation unit 23. Further, the time-specificimage generation unit 28 performs the same processing every predetermined time to generateimage 63 to 65. The three-dimensionalimage generation unit 29 generates a three-dimensional image 70 using theimages image generation unit 28. Specifically, the three-dimensionalimage generation unit 29 adds a time axis to theimages dimensional image 70. Modifiable matters in theimage 60 also apply to the three-dimensional image 70. Due to calculation characteristics of the FFT, the data at every predetermined time are generally calculated by overlapping the data before and after the time axis, and a value at the predetermined time is calculated using data with a time length such that it has a predetermined frequency resolution. - The machine learning
model generation unit 25 generates an optimum machine learning model for determining normality and abnormality in sound data using the three-dimensional image 70. The details are the same as those of the first embodiment, and thus the description thereof is omitted. - Next, an operation example of the
image processing apparatus 1 according to the fourth embodiment is described with reference to a flowchart ofFig. 13 . However, the processes in steps S401 to S405 and S413 to S419 are the same as those in steps S101 to S105 and S111 to S117 inFig. 4 , and thus the description thereof is omitted. - In step S407, the time-specific
image generation unit 28 generates theimages image generation unit 29 generates the three-dimensional image 70 using theimages dimensional image 70 generated in step S409 is displayed on thedisplay 50. Each pixel forming the three-dimensional image 70 is set as a brightness or color corresponding to the amplitude of the sound data. Thus, the operator who sees the three-dimensional image 70 can grasp the intensity, normality, abnormality, and the like of the sound data at a glance. - The fourth embodiment enables sound data to be displayed as a three-dimensional image.
- Next, a fifth embodiment of the present invention is described with reference to
Figs. 14 to 15 . The fifth embodiment differs from the fourth embodiment in that thecontroller 20 further includes afrequency setting unit 30 and an image cutout unit 31 (seeFig. 14 ). A description of the configuration that overlaps the fourth embodiment is omitted with reference to reference numerals. The following description focuses on the difference. - The
frequency setting unit 30 sets a frequency to be extracted from the three-dimensional image 70. The frequency set by thefrequency setting unit 30 is any frequency, and the fundamental frequency may be set. - The
image cutout unit 31 cuts out pixels related to the frequency set by thefrequency setting unit 30. Specifically, as illustrated inFig. 15 , theimage cutout unit 31 cuts outdata 80 of a plurality of pixels corresponding to the frequency set by thefrequency setting unit 30. Theimage cutout unit 31 generates a spectrogram using thecutout data 80. A spectrogram is an arrangement in which a spectrum of frequency characteristics is arranged on a time axis, and intensity is represented by colors, like a heat map. - The machine learning
model generation unit 25 generates an optimum machine learning model for determining normality and abnormality in sound data using the spectrogram. The details are the same as those of the first embodiment, and thus the description thereof is omitted. - Next, an operation example of the
image processing apparatus 1 according to the fifth embodiment is described with reference to a flowchart ofFig. 16 . However, the processes in steps S501 to S509 and S515 to S521 are the same as those in steps S401 to S409 and S413 to S419 inFig. 13 , the description thereof is omitted. - In step S511, the
frequency setting unit 30 sets a frequency to be extracted from the three-dimensional image 70. The process proceeds to step S513, and theimage cutout unit 31 cuts out pixels relating to the frequency set in step S511. Theimage cutout unit 31 generates a spectrogram using the cutout pixels. - The fifth embodiment enables analysis to be performed using a spectrogram.
- Next, a sixth embodiment of the present invention is described with reference to
Fig. 17 . The sixth embodiment differs from the first embodiment in that thecontroller 20 includes a new sounddata acquisition unit 32, animage processing unit 33, and adetermination unit 34. A description of a configuration that overlaps the first embodiment is omitted with reference to reference numerals. The following description focuses on the difference. - The new sound
data acquisition unit 32 acquires new sound data via amicrophone 11 different from themicrophone 10. Themicrophones image generation unit 24 generates an image of the new sound data. - The
image processing unit 33 uses the image of the new sound data as input data of the machine learning model generated by the machine learningmodel generation unit 25. Theimage processing unit 33 outputs an index, such as the degree of agreement of images, using a predetermined image processing method. - The
determination unit 34 compares the output value output by theimage processing unit 33 with a preset threshold value. When the output value is greater than the threshold value, thedetermination unit 34 determines that the sound data is normal. In contrast, when the output value is equal to or less than the threshold value, thedetermination unit 34 determines that the sound data is abnormal. Note that the determination method is not limited to a method using a threshold value, and other methods may be used. - The determination result by the
determination unit 34 is displayed on thedisplay 50. Although not illustrated, the determination result by thedetermination unit 34 may be notified by voice through a speaker. When the determination result by thedetermination unit 34 is abnormal, a red rotating light may be turned on. - Next, an operation example of the
image processing apparatus 1 according to the sixth embodiment is described with reference to flowcharts ofFigs. 18A and18B . However, the processes in step S601 to S613 are the same as those in steps S101 to S113 inFig. 4 , and thus the description thereof is omitted. - In step S615, the new sound
data acquisition unit 32 acquires new sound data via themicrophone 11. The acquired new sound data is converted into an electric signal and treated as time series data. The process proceeds to step S617, and the frequencycharacteristics analysis unit 22 analyzes the electric signal acquired in step S615 using the FFT. The FFT provides the "frequency-energy characteristics". - The process proceeds to step S619, and the fundamental
frequency calculation unit 23 calculates a fundamental frequency of the new sound data using the "frequency-energy characteristics" acquired in step S617. The process proceeds to step S621, and it is determined whether the fundamental frequency calculated in step S619 agrees with the fundamental frequency of the machine learning model generated in step S613. The reason for this determination is that when the fundamental frequencies are different, the machine learning model cannot perform the normal and abnormal determination processing. Note that "the fundamental frequencies agree with each other" means substantial agreement. - When the fundamental frequencies do not agree with each other (NO in step S621), "Determination processing not possible due to disagreement of fundamental frequencies" is displayed on the
display 50, and the process proceeds to step S631. In contrast, when the fundamental frequencies agree with each other (YES in step S621), the process proceeds to step S623, and the sound dataimage generation unit 24 generates an image of the new sound data using the fundamental frequency calculated in step S619. - The process proceeds to step S625, and the
image processing unit 33 uses the image of the new sound data generated in step S623 as input data for the machine learning model. Theimage processing unit 33 outputs an index, such as the degree of agreement of images, using a predetermined image processing method. Thedetermination unit 34 compares the output value output by theimage processing unit 33 with a preset threshold value to determine whether the sound data is normal or abnormal. - The process proceeds to step S627, and the determination result of step S625 is displayed on the
display 50. The process proceeds to step S629, and a file name of the new sound data, a name of the machine learning model, a processing execution time, a value of the fundamental frequency, a determination result, and the like are stored in thestorage device 40. A series of processing is repeatedly executed until completion (step S631). Note that when the processing is completed, a notice "End of normal/abnormal determination processing" may be displayed on thedisplay 50. - The sixth embodiment makes it possible to determine whether other sound data are normal or abnormal using a machine learning model acquired by imaging sound data.
- Each of the functions described in the above embodiments may be implemented by one or more processing circuits. The processing circuit includes a programmed processing device, such as a processing device including an electric circuit. The processing circuit also includes devices, such as an application specific integrated circuit (ASIC) arranged to perform the described functions and circuit components.
- While embodiments of the present invention have been described as above, the statements and drawings that form part of this disclosure should not be understood as limiting the invention. Various alternative embodiments, examples, and operating techniques will become apparent to those skilled in the art from this disclosure.
- In the above-described embodiments, a machine learning model is used as a method for determining normality and abnormality in other sound data, but the method is not limited thereto. For example, an abnormality in the image (sound data) may be determined by comparing the fundamental frequency component and harmonic component with other frequency components. This makes it possible to determine whether the sound data is normal or abnormal in a case where there is no overtone relation, such as a critical band.
- Further, the
determination unit 34 may determine an abnormality in a predetermined sound included in sound data using the image 60 (sound image). - The image 60 (sound image) may be made from a two-dimensional matrix including a fundamental frequency component and harmonic component converted into image data, and other frequency components converted into image data, wherein a predetermined area is set for each frequency component. Note that the other frequency components mean frequency components other than the fundamental frequency component and the harmonic component.
-
- 1
- Image processing apparatus
- 20
- Controller
- 21
- Sound data acquisition unit
- 22
- Frequency characteristics analysis unit
- 23
- Fundamental frequency calculation unit
- 24
- Sound data image generation unit
- 25
- Machine learning model generation unit
- 26
- Scale setting unit
- 27
- Critical band setting unit
- 28
- Time-specific image generation unit
- 30
- Frequency setting unit
- 31
- Image cutout unit
- 32
- New sound data acquisition unit
- 33
- Image processing unit
- 34
- Determination unit
- 40
- Storage device
- 50
- Display
Claims (10)
- An image processing apparatus for acquiring sound data and analyzing the sound data that have been acquired, the image processing apparatus comprising:a controller configured to: calculate a fundamental frequency component included in the sound data and a harmonic component corresponding to the fundamental frequency component;convert the fundamental frequency component and the harmonic component that have been calculated into image data; andgenerate a sound image in which the fundamental frequency component and the harmonic component that have been converted into the image data are arranged adjacent each other.
- The image processing apparatus according to claim 1, wherein the fundamental frequency component and the harmonic component have an overtone relationship, a same pitch name, or a relationship with respect to a critical band of human hearing.
- The image processing apparatus according to claim 1 or 2, wherein the controller arranges the fundamental frequency component and the harmonic component adjacent to each other on a vertical axis or a horizontal axis of the sound image.
- The image processing apparatus according to any one of claims 1 to 3, wherein the controller generates the sound image by converting the fundamental frequency component and the harmonic component into image data in which a brightness or a color corresponding to an amplitude of the sound data is set.
- The image processing apparatus according to claim 1, wherein the controller arranges a plurality of frequency components of the sound data in frequency order on a vertical axis or a horizontal axis of the sound image.
- The image processing apparatus according to claim 1, wherein the sound image includes a two-dimensional matrix including the fundamental frequency component and the harmonic component that have been converted into the image data, and other frequency components that have been converted into image data, the two-dimensional matrix having a predetermined area set for each frequency component.
- The image processing apparatus according to any one of claims 1 to 6, wherein the controller determines an abnormality in a predetermined sound included in the sound data using the sound image.
- The image processing apparatus according to any one of claims 1 to 6, wherein the controller generates a machine learning model by machine learning the sound image and determines an abnormality in the sound image using the machine learning model.
- The image processing apparatus according to claim 1, wherein the sound image includes a two-dimensional matrix including the fundamental frequency component and the harmonic component that have been converted into the image data, and other frequency components that have been converted into image data, the two-dimensional matrix having a predetermined area set for each frequency component, and
the controller determines an abnormality in the sound image by comparing the fundamental frequency component and the harmonic component with the other frequency components. - A method of processing an image, comprising:acquiring sound data;calculating a fundamental frequency component included in the sound data and a harmonic component corresponding to the fundamental frequency component;converting the fundamental frequency component and the harmonic component that have been calculated into image data; andgenerating a sound image where the fundamental frequency component and the harmonic component that have been converted into the image data are arranged adjacent each other.
Applications Claiming Priority (1)
| Application Number | Priority Date | Filing Date | Title |
|---|---|---|---|
| PCT/IB2020/000097 WO2021165712A1 (en) | 2020-02-20 | 2020-02-20 | Image processing device and image processing method |
Publications (3)
| Publication Number | Publication Date |
|---|---|
| EP4109058A1 true EP4109058A1 (en) | 2022-12-28 |
| EP4109058A4 EP4109058A4 (en) | 2023-03-29 |
| EP4109058B1 EP4109058B1 (en) | 2026-04-08 |
Family
ID=77390470
Family Applications (1)
| Application Number | Title | Priority Date | Filing Date |
|---|---|---|---|
| EP20920020.3A Active EP4109058B1 (en) | 2020-02-20 | 2020-02-20 | Image processing apparatus and image processing method |
Country Status (6)
| Country | Link |
|---|---|
| US (1) | US12182909B2 (en) |
| EP (1) | EP4109058B1 (en) |
| JP (1) | JP7425421B2 (en) |
| CN (1) | CN115552204B (en) |
| BR (1) | BR112022016581A2 (en) |
| WO (1) | WO2021165712A1 (en) |
Families Citing this family (1)
| Publication number | Priority date | Publication date | Assignee | Title |
|---|---|---|---|---|
| EP4109058B1 (en) * | 2020-02-20 | 2026-04-08 | NISSAN MOTOR Co., Ltd. | Image processing apparatus and image processing method |
Family Cites Families (30)
| Publication number | Priority date | Publication date | Assignee | Title |
|---|---|---|---|---|
| US4956999A (en) * | 1988-11-30 | 1990-09-18 | Gp Taurio, Inc. | Methods and apparatus for monitoring structural members subject to transient loads |
| US6490359B1 (en) * | 1992-04-27 | 2002-12-03 | David A. Gibson | Method and apparatus for using visual images to mix sound |
| JPH09166483A (en) * | 1995-12-19 | 1997-06-24 | Hitachi Ltd | Device monitoring method and device |
| US5808225A (en) * | 1996-12-31 | 1998-09-15 | Intel Corporation | Compressing music into a digital format |
| JP2002094881A (en) * | 2000-09-14 | 2002-03-29 | Megafusion Corp | Picture and sound interpolation processor and its method |
| SG120121A1 (en) * | 2003-09-26 | 2006-03-28 | St Microelectronics Asia | Pitch detection of speech signals |
| JP4353018B2 (en) * | 2004-07-16 | 2009-10-28 | ヤマハ株式会社 | Musical instrument performance learning apparatus and program thereof |
| EP1686561B1 (en) * | 2005-01-28 | 2012-01-04 | Honda Research Institute Europe GmbH | Determination of a common fundamental frequency of harmonic signals |
| US7126876B1 (en) * | 2005-07-15 | 2006-10-24 | The United States Of America As Represented By The Secretary Of The Navy | Harmonic ambiguity resolver and inter array harmonic tracker |
| US20090249879A1 (en) * | 2007-04-02 | 2009-10-08 | General Electric | Inspection systems and methods for detection of material property anomalies |
| AT509512B1 (en) * | 2010-03-01 | 2012-12-15 | Univ Graz Tech | METHOD FOR DETERMINING BASIC FREQUENCY FLOWS OF MULTIPLE SIGNAL SOURCES |
| JP5834727B2 (en) * | 2011-09-30 | 2015-12-24 | カシオ計算機株式会社 | Performance evaluation apparatus, program, and performance evaluation method |
| KR20130055410A (en) * | 2011-11-18 | 2013-05-28 | 삼성전자주식회사 | Sound quality evaluation apparatus and method thereof |
| FR3005732B1 (en) * | 2013-05-17 | 2016-10-07 | Snecma | METHOD AND SYSTEM FOR VIBRATION ANALYSIS OF AN ENGINE |
| CN105705928B (en) | 2013-11-08 | 2018-07-24 | 三菱电机株式会社 | Abnormal sound diagnostic device |
| EP2963648A1 (en) * | 2014-07-01 | 2016-01-06 | Fraunhofer-Gesellschaft zur Förderung der angewandten Forschung e.V. | Audio processor and method for processing an audio signal using vertical phase correction |
| US10147407B2 (en) | 2016-08-31 | 2018-12-04 | Gracenote, Inc. | Characterizing audio using transchromagrams |
| US11593299B2 (en) * | 2017-03-28 | 2023-02-28 | Nec Corporation | Data analysis device, data analysis method and data analysis program |
| JP6617783B2 (en) * | 2018-03-14 | 2019-12-11 | カシオ計算機株式会社 | Information processing method, electronic device, and program |
| WO2019176029A1 (en) | 2018-03-14 | 2019-09-19 | ヤマハ株式会社 | Sound detection device |
| US11227626B1 (en) * | 2018-05-21 | 2022-01-18 | Snap Inc. | Audio response messages |
| WO2020026829A1 (en) * | 2018-07-31 | 2020-02-06 | パナソニックIpマネジメント株式会社 | Sound data processing method, sound data processing device, and program |
| US12205265B2 (en) * | 2019-07-11 | 2025-01-21 | Lg Electronics Inc. | Artificial intelligence server |
| KR102645589B1 (en) * | 2019-08-30 | 2024-03-07 | 엘지전자 주식회사 | Acoustic control system, apparatus and method |
| CN112649515B (en) * | 2019-10-11 | 2025-12-30 | 新东工业株式会社 | Ultrasonic inspection device and ultrasonic inspection method |
| US11326935B2 (en) * | 2019-10-21 | 2022-05-10 | Wistron Corporation | Method and system for vision-based defect detection |
| JP2020021098A (en) * | 2019-10-29 | 2020-02-06 | カシオ計算機株式会社 | Information processing device, electronic equipment and program |
| US11475910B2 (en) * | 2020-02-11 | 2022-10-18 | Purdue Research Foundation | System and methods for machine anomaly detection based on sound spectrogram images and neural networks |
| EP4109058B1 (en) * | 2020-02-20 | 2026-04-08 | NISSAN MOTOR Co., Ltd. | Image processing apparatus and image processing method |
| TWI778437B (en) * | 2020-10-23 | 2022-09-21 | 財團法人資訊工業策進會 | Defect-detecting device and defect-detecting method for an audio device |
-
2020
- 2020-02-20 EP EP20920020.3A patent/EP4109058B1/en active Active
- 2020-02-20 JP JP2022501379A patent/JP7425421B2/en active Active
- 2020-02-20 US US17/801,035 patent/US12182909B2/en active Active
- 2020-02-20 BR BR112022016581A patent/BR112022016581A2/en not_active Application Discontinuation
- 2020-02-20 WO PCT/IB2020/000097 patent/WO2021165712A1/en not_active Ceased
- 2020-02-20 CN CN202080096988.XA patent/CN115552204B/en active Active
Also Published As
| Publication number | Publication date |
|---|---|
| EP4109058A4 (en) | 2023-03-29 |
| BR112022016581A2 (en) | 2022-10-11 |
| US12182909B2 (en) | 2024-12-31 |
| CN115552204B (en) | 2025-09-12 |
| EP4109058B1 (en) | 2026-04-08 |
| US20230222711A1 (en) | 2023-07-13 |
| JPWO2021165712A1 (en) | 2021-08-26 |
| JP7425421B2 (en) | 2024-01-31 |
| WO2021165712A1 (en) | 2021-08-26 |
| CN115552204A (en) | 2022-12-30 |
Similar Documents
| Publication | Publication Date | Title |
|---|---|---|
| JP6061693B2 (en) | Abnormality diagnosis apparatus and abnormality diagnosis method using the same | |
| JP6882397B2 (en) | Abnormal noise detection system, equipment, method and program | |
| Stolzenburg | Harmony perception by periodicity detection | |
| Kreiman et al. | Perceptual interaction of the harmonic source and noise in voice | |
| Moro-Velázquez et al. | Voice pathology detection using modulation spectrum-optimized metrics | |
| US12105752B2 (en) | Audio analysis method, audio analysis device and non-transitory computer-readable medium | |
| EP4109058B1 (en) | Image processing apparatus and image processing method | |
| Liu et al. | An objective parameter to classify voice signals based on variation in energy distribution | |
| JP4654621B2 (en) | Voice processing apparatus and program | |
| RU2813619C1 (en) | Image processing device and image processing method | |
| JP2015175770A (en) | Sound identification condition setting support device and sound identification condition setting support method | |
| JP5701251B2 (en) | Pronunciation determination device, pronunciation determination method, and program | |
| Aichinger et al. | Comparison of an audio-based and a video-based approach for detecting diplophonia | |
| EP4503045A1 (en) | Material property value prediction method, trained model generation method, program, and device | |
| JP6298527B2 (en) | Body sound analysis apparatus, body sound analysis method, computer program, and recording medium | |
| JP2024039371A (en) | Motor inspection equipment, motor inspection method and motor inspection program | |
| KR101517957B1 (en) | Method and apparatus for quantitative uassessment of acoustical perception and absoulte pitch | |
| Vizza et al. | Dysphonia discovering using a Goertzel algorithm implementation for vocal signals analysis | |
| Marjieh et al. | Timbral effects on consonance illuminate psychoacoustics of music evolution | |
| WO2019176029A1 (en) | Sound detection device | |
| JP5937126B2 (en) | Sound identification condition setting support apparatus and sound identification condition setting support method | |
| JP6759479B1 (en) | Acoustic analysis support system and acoustic analysis support method | |
| Faye et al. | Relative periodicity of empirical audio samples with application to dissonance perception | |
| JP7001806B2 (en) | Respiratory sound analyzer, breath sound analysis method, computer program and recording medium | |
| KR20200061863A (en) | Method and apparatus for adjusting visualization of multi-dimensional data |
Legal Events
| Date | Code | Title | Description |
|---|---|---|---|
| STAA | Information on the status of an ep patent application or granted ep patent |
Free format text: STATUS: THE INTERNATIONAL PUBLICATION HAS BEEN MADE |
|
| PUAI | Public reference made under article 153(3) epc to a published international application that has entered the european phase |
Free format text: ORIGINAL CODE: 0009012 |
|
| STAA | Information on the status of an ep patent application or granted ep patent |
Free format text: STATUS: REQUEST FOR EXAMINATION WAS MADE |
|
| 17P | Request for examination filed |
Effective date: 20220916 |
|
| AK | Designated contracting states |
Kind code of ref document: A1 Designated state(s): AL AT BE BG CH CY CZ DE DK EE ES FI FR GB GR HR HU IE IS IT LI LT LU LV MC MK MT NL NO PL PT RO RS SE SI SK SM TR |
|
| A4 | Supplementary search report drawn up and despatched |
Effective date: 20230228 |
|
| RIC1 | Information provided on ipc code assigned before grant |
Ipc: G10L 21/14 20130101ALI20230222BHEP Ipc: G10L 25/90 20130101ALI20230222BHEP Ipc: G10L 25/18 20130101ALI20230222BHEP Ipc: G10L 25/51 20130101ALI20230222BHEP Ipc: G10L 25/30 20130101ALI20230222BHEP Ipc: G06T 7/00 20060101ALI20230222BHEP Ipc: G01M 99/00 20110101ALI20230222BHEP Ipc: G01H 3/08 20060101AFI20230222BHEP |
|
| DAV | Request for validation of the european patent (deleted) | ||
| DAX | Request for extension of the european patent (deleted) | ||
| STAA | Information on the status of an ep patent application or granted ep patent |
Free format text: STATUS: EXAMINATION IS IN PROGRESS |
|
| 17Q | First examination report despatched |
Effective date: 20240523 |
|
| GRAP | Despatch of communication of intention to grant a patent |
Free format text: ORIGINAL CODE: EPIDOSNIGR1 |
|
| STAA | Information on the status of an ep patent application or granted ep patent |
Free format text: STATUS: GRANT OF PATENT IS INTENDED |
|
| RIC1 | Information provided on ipc code assigned before grant |
Ipc: G01H 3/08 20060101AFI20250827BHEP Ipc: G10L 21/14 20130101ALI20250827BHEP Ipc: G10L 25/18 20130101ALI20250827BHEP Ipc: G10L 25/90 20130101ALI20250827BHEP Ipc: G01H 13/00 20060101ALI20250827BHEP |
|
| INTG | Intention to grant announced |
Effective date: 20250929 |
|
| GRAS | Grant fee paid |
Free format text: ORIGINAL CODE: EPIDOSNIGR3 |
|
| GRAA | (expected) grant |
Free format text: ORIGINAL CODE: 0009210 |
|
| STAA | Information on the status of an ep patent application or granted ep patent |
Free format text: STATUS: THE PATENT HAS BEEN GRANTED |
|
| AK | Designated contracting states |
Kind code of ref document: B1 Designated state(s): AL AT BE BG CH CY CZ DE DK EE ES FI FR GB GR HR HU IE IS IT LI LT LU LV MC MK MT NL NO PL PT RO RS SE SI SK SM TR |
|
| REG | Reference to a national code |
Ref country code: CH Ref legal event code: F10 Free format text: ST27 STATUS EVENT CODE: U-0-0-F10-F00 (AS PROVIDED BY THE NATIONAL OFFICE) Effective date: 20260408 Ref country code: GB Ref legal event code: FG4D |
|
| REG | Reference to a national code |
Ref country code: DE Ref legal event code: R096 Ref document number: 602020070241 Country of ref document: DE |