EP4108753A1 - A method of quantifying the removal of hydrocarbon component from a soiled fabric by a washing process - Google Patents
A method of quantifying the removal of hydrocarbon component from a soiled fabric by a washing process Download PDFInfo
- Publication number
- EP4108753A1 EP4108753A1 EP21181276.3A EP21181276A EP4108753A1 EP 4108753 A1 EP4108753 A1 EP 4108753A1 EP 21181276 A EP21181276 A EP 21181276A EP 4108753 A1 EP4108753 A1 EP 4108753A1
- Authority
- EP
- European Patent Office
- Prior art keywords
- hydrocarbon component
- analysis
- fabric
- soiled
- soiled fabric
- Prior art date
- Legal status (The legal status is an assumption and is not a legal conclusion. Google has not performed a legal analysis and makes no representation as to the accuracy of the status listed.)
- Pending
Links
Images
Classifications
-
- G—PHYSICS
- G01—MEASURING; TESTING
- G01N—INVESTIGATING OR ANALYSING MATERIALS BY DETERMINING THEIR CHEMICAL OR PHYSICAL PROPERTIES
- G01N21/00—Investigating or analysing materials by the use of optical means, i.e. using sub-millimetre waves, infrared, visible or ultraviolet light
- G01N21/17—Systems in which incident light is modified in accordance with the properties of the material investigated
- G01N21/25—Colour; Spectral properties, i.e. comparison of effect of material on the light at two or more different wavelengths or wavelength bands
- G01N21/31—Investigating relative effect of material at wavelengths characteristic of specific elements or molecules, e.g. atomic absorption spectrometry
- G01N21/35—Investigating relative effect of material at wavelengths characteristic of specific elements or molecules, e.g. atomic absorption spectrometry using infrared light
- G01N21/359—Investigating relative effect of material at wavelengths characteristic of specific elements or molecules, e.g. atomic absorption spectrometry using infrared light using near infrared light
-
- D—TEXTILES; PAPER
- D06—TREATMENT OF TEXTILES OR THE LIKE; LAUNDERING; FLEXIBLE MATERIALS NOT OTHERWISE PROVIDED FOR
- D06L—DRY-CLEANING, WASHING OR BLEACHING FIBRES, FILAMENTS, THREADS, YARNS, FABRICS, FEATHERS OR MADE-UP FIBROUS GOODS; BLEACHING LEATHER OR FURS
- D06L1/00—Dry-cleaning or washing fibres, filaments, threads, yarns, fabrics, feathers or made-up fibrous goods
- D06L1/12—Dry-cleaning or washing fibres, filaments, threads, yarns, fabrics, feathers or made-up fibrous goods using aqueous solvents
-
- G—PHYSICS
- G01—MEASURING; TESTING
- G01N—INVESTIGATING OR ANALYSING MATERIALS BY DETERMINING THEIR CHEMICAL OR PHYSICAL PROPERTIES
- G01N21/00—Investigating or analysing materials by the use of optical means, i.e. using sub-millimetre waves, infrared, visible or ultraviolet light
- G01N21/17—Systems in which incident light is modified in accordance with the properties of the material investigated
- G01N21/25—Colour; Spectral properties, i.e. comparison of effect of material on the light at two or more different wavelengths or wavelength bands
- G01N21/31—Investigating relative effect of material at wavelengths characteristic of specific elements or molecules, e.g. atomic absorption spectrometry
- G01N21/33—Investigating relative effect of material at wavelengths characteristic of specific elements or molecules, e.g. atomic absorption spectrometry using ultraviolet light
-
- G—PHYSICS
- G01—MEASURING; TESTING
- G01N—INVESTIGATING OR ANALYSING MATERIALS BY DETERMINING THEIR CHEMICAL OR PHYSICAL PROPERTIES
- G01N21/00—Investigating or analysing materials by the use of optical means, i.e. using sub-millimetre waves, infrared, visible or ultraviolet light
- G01N21/17—Systems in which incident light is modified in accordance with the properties of the material investigated
- G01N21/25—Colour; Spectral properties, i.e. comparison of effect of material on the light at two or more different wavelengths or wavelength bands
- G01N21/31—Investigating relative effect of material at wavelengths characteristic of specific elements or molecules, e.g. atomic absorption spectrometry
- G01N21/35—Investigating relative effect of material at wavelengths characteristic of specific elements or molecules, e.g. atomic absorption spectrometry using infrared light
- G01N21/3563—Investigating relative effect of material at wavelengths characteristic of specific elements or molecules, e.g. atomic absorption spectrometry using infrared light for analysing solids; Preparation of samples therefor
-
- G—PHYSICS
- G01—MEASURING; TESTING
- G01N—INVESTIGATING OR ANALYSING MATERIALS BY DETERMINING THEIR CHEMICAL OR PHYSICAL PROPERTIES
- G01N33/00—Investigating or analysing materials by specific methods not covered by groups G01N1/00 - G01N31/00
- G01N33/36—Textiles
- G01N33/367—Fabric or woven textiles
-
- C—CHEMISTRY; METALLURGY
- C11—ANIMAL OR VEGETABLE OILS, FATS, FATTY SUBSTANCES OR WAXES; FATTY ACIDS THEREFROM; DETERGENTS; CANDLES
- C11D—DETERGENT COMPOSITIONS; USE OF SINGLE SUBSTANCES AS DETERGENTS; SOAP OR SOAP-MAKING; RESIN SOAPS; RECOVERY OF GLYCEROL
- C11D2111/00—Cleaning compositions characterised by the objects to be cleaned; Cleaning compositions characterised by non-standard cleaning or washing processes
- C11D2111/10—Objects to be cleaned
- C11D2111/12—Soft surfaces, e.g. textile
-
- G—PHYSICS
- G01—MEASURING; TESTING
- G01N—INVESTIGATING OR ANALYSING MATERIALS BY DETERMINING THEIR CHEMICAL OR PHYSICAL PROPERTIES
- G01N21/00—Investigating or analysing materials by the use of optical means, i.e. using sub-millimetre waves, infrared, visible or ultraviolet light
- G01N21/17—Systems in which incident light is modified in accordance with the properties of the material investigated
- G01N21/25—Colour; Spectral properties, i.e. comparison of effect of material on the light at two or more different wavelengths or wavelength bands
- G01N21/31—Investigating relative effect of material at wavelengths characteristic of specific elements or molecules, e.g. atomic absorption spectrometry
- G01N21/314—Investigating relative effect of material at wavelengths characteristic of specific elements or molecules, e.g. atomic absorption spectrometry with comparison of measurements at specific and non-specific wavelengths
- G01N2021/3155—Measuring in two spectral ranges, e.g. UV and visible
Definitions
- the present invention provides a method of quantifying the removal of hydrocarbon component from a soiled fabric by a washing process.
- the method of the invention does not require the use of any colourant and can quantify the removal of hydrocarbon component from a soiled fabric in a non-contact and non-destructive manner.
- Greasy soils are commonly experienced by laundry detergent users.
- Common greasy soils can include edible fats and oils of animal and vegetable origin, cosmetic and mechanical greases, and highly convoluted organic body soils.
- Such soils are commonly dyed using oleophilic colourants and analysed colourimetrically.
- this method has limitations, in that it requires prior inclusion of the colourant, and thus can only be achieved for stains prepared in the laboratory setting.
- More complex greasy soils such as mechanical and body soils, are complex mixtures of hydrocarbons, proteins, carbohydrates, pigments, adjuncts, and mixtures thereof.
- the aforementioned colourimetric method cannot be used with such multicomponent real-world soils, or other soils which cannot effectively be dyed or otherwise coloured.
- attenuated total reflectance [ATR] spectroscopy is the analytical standard.
- ATR is a contact technique, and thus can damage the integrity of the sample. Techniques using intense beams of light can also heat the sample causing degradation.
- the present invention provides a method of quantifying the removal of hydrocarbon component from a soiled fabric by a washing process.
- the method of the invention does not require the use of any colourant and can quantify the removal of hydrocarbon component from a soiled fabric in a non-contact and non-destructive manner.
- the present invention provides a method of quantifying the removal of hydrocarbon component from a soiled fabric by a washing process, wherein the soiled fabric comprises at least 0.5wt% hydrocarbon component wherein the method uses near infra-red (NIR) analysis, wherein the method comprises the steps of: (a) performing non-contact NIR analysis of the soiled fabric to determine the concentration of hydrocarbon component present on the soiled fabric at multiple points; (b) washing the soiled fabric to obtain a washed fabric; (c) performing non-contact NIR analysis of the washed fabric to determine the concentration of hydrocarbon component present on the washed fabric at the same multiple points that were used in step (a); and (d)quantifying the removal of hydrocarbon component from the soiled fabric by the washing process.
- NIR near infra-red
- the method of quantifying the removal of hydrocarbon component from a soiled fabric by a washing process comprises the steps of:
- the soiled fabric comprises at least 0.5wt% hydrocarbon component wherein the method uses near infra-red (NIR) analysis.
- NIR near infra-red
- the NIR analysis is carried out at a light wavelength of from 750nm to 2500nm, or from 900nm to 2500nm.
- the method may also perform additional non-contact optical analysis selected from UV analysis, visible-light analysis, and a combination thereof.
- the UV analysis is carried out at a light wavelength of from 250nm to below 400nm.
- the visible-light analysis is carried out at a wavelength of from 400nm to less than 750nm.
- the NIR analysis is non-destructive.
- the NIR analysis is carried out by a spectrometer.
- the spectrometer employs two separate light-source and detector modules to cover the full spectral range.
- the outputs from the two sources are typically combined using a beam-splitter and are directed onto the sample via a two-core bifurcated fiber optic.
- the short-wave end of the spectrum (400 - 1200 nm) is generated by the output of a tungsten-halogen lamp (e.g. Ocean Optics HP2000) combined with a 2.0cm pathlength water filter.
- the water filter typically that has the effect of removing any radiation of wavelengths longer than 1250 nm.
- the output of this lamp is continuous.
- the short wave infra-red (SWIR) component of the spectrum is generated by a second tungsten lamp and interferometer (e.g. ArcOptix F FTIR-OEM200-NIR-20 and FTIR-OEM000-CAF2 respectively).
- This typically creates a modulated output in the range 900 - 2600 nm.
- the two beams are typically combined using a beam splitter and imaged onto the single end of a bifurcated fiber (e.g. Ocean Optics, 400 ⁇ m diameter) with a fiber coupling lens.
- the outputs of the bifurcated fibers illuminate the target area via two collimating lenses (e.g. Ocean Optics) at an angle of ⁇ 45° to the surface normal.
- the collected light is split with a 10% reflective beam-splitter, usually with the minor portion imaged onto a fiber and the spectral profile collected by a spectrograph -CCD (e.g. Ocean Optics May2000 Pro), and the major portion being collected onto a cooled InGaAs photodiode (e.g. Arcoptix FTIR-OEM100-09-025-2TE).
- the two signals can be acquired effectively independently of one another.
- the reduced sensitivity in the NIR/SWIR region can be mitigated by incorporating the cooled InGaAs detector in the probe head itself, avoiding any loss incurred by coupling it by a second fiber optic.
- the UV-NIR spectrum can be recorded using a commercial spectrograph-CCD, (e.g. Ocean Optics MayaPro, HC1 grating, 100 ⁇ m slit), which is fibre coupled to the probe head.
- a commercial spectrograph-CCD e.g. Ocean Optics MayaPro, HC1 grating, 100 ⁇ m slit
- the system can be controlled by a custom interface written in LabVIEW, and acquires spectra continually from the two spectrometers. Background/dark-current spectra and spectra from a white reference tile are typically recorded and stored, allowing the two reflectance spectra to be recorded and displayed in real-time alongside a video-microscope output and when selected the spectra and an image are captured and stored for analysis.
- the spatial resolution of the area being investigated is in the order of from 1.0mm to 2.0mm diameter, and typically multiple points being analyzed.
- the spectrometer is configured such that the detector is local to the sample, and the light is delivered from the spectrometer by fibre optic means. This configuration improves the sensitivity and allows for a smaller probe head to be used.
- Step (a) performs non-contact NIR analysis of the soiled fabric to determine the concentration of hydrocarbon component present on the soiled fabric at multiple points.
- Step (b) washes the soiled fabric to obtain a washed fabric.
- the soiled fabric can be washed by any suitable means. Typically, an aqueous based detergent wash bath is used. Any suitable laundry detergent may be used.
- Step (c) performs non-contact NIR analysis of the washed fabric to determine the concentration of hydrocarbon component present on the washed fabric at the same multiple points that were used in step (a).
- Step (d) quantifies the removal of hydrocarbon component from the soiled fabric by the washing process.
- the soiled fabric comprises from 1.0wt% to 60wt% hydrocarbon component, or from 2.0wt% to 60wt%, or from 3.0wt% to 60wt%, or from 4.0wt% to 60wt%, or even from 5.0wt% to 60wt% hydrocarbon content.
- Any suitable soiled fabric can be used, such as polyester, cotton including poly cotton, and blends including a 35/65 blend of polyester/cotton.
- the hydrophobic content is typically present as part of a complex soil.
- the complex soil may comprise from 0.1wt% to 80wt% hydrocarbon component and from 20wt% to 99.9wt% non-hydrocarbon component.
- the hydrophobic content is selected from diglycerides, triglycerides, fatty acids, saturated and unsaturated hydrocarbons, and any combination thereof.
- the hydrophobic content may be selected from hydrophobic deposition ingredients selected from polymers, surfactants, polydimethylsiloxane and any combination thereof.
- Soiled fabric samples comprising from 1wt% to 60wt% hydrocarbon content were prepared.
- SWIR - FORS Shortwave Infrared Fibre-optic Reflection Spectroscopy
- the data analysis is performed by the following method.
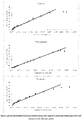
- Figure 1 shows the average measured soil wt% for each calibration sample using the machine learning methodology. For all fabrics investigated there is a good correlation between the known mass soil mass of the calibration samples and the measured soil content between 10 wt% and 60wt%. Above 60wt% a plateau in the measured soil content is observed. With poly-cotton the model is accurate, within 2%.
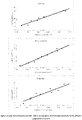
- Figure 2 shows the integrals of the lipid peaks, 1680 - 1860 nm, against the known soil wt% of the calibration samples for cotton, poly-cotton, and polyester.
- the poly-cotton shows the least variation from the linear relationship.
- the cotton samples exhibit slightly higher variation with each sample and between them but not significantly more than the poly-cotton samples.
- the polyester data show greater variation compared to the other two fabrics there is still a clear trend with which to produce a calibration curve, although with a slightly higher margin of error.
Landscapes
- Physics & Mathematics (AREA)
- Spectroscopy & Molecular Physics (AREA)
- Health & Medical Sciences (AREA)
- Life Sciences & Earth Sciences (AREA)
- Chemical & Material Sciences (AREA)
- Analytical Chemistry (AREA)
- Biochemistry (AREA)
- General Health & Medical Sciences (AREA)
- General Physics & Mathematics (AREA)
- Immunology (AREA)
- Pathology (AREA)
- Engineering & Computer Science (AREA)
- Textile Engineering (AREA)
- Food Science & Technology (AREA)
- Medicinal Chemistry (AREA)
- Investigating Or Analysing Materials By Optical Means (AREA)
Abstract
Description
- The present invention provides a method of quantifying the removal of hydrocarbon component from a soiled fabric by a washing process. The method of the invention does not require the use of any colourant and can quantify the removal of hydrocarbon component from a soiled fabric in a non-contact and non-destructive manner.
- Greasy soils are commonly experienced by laundry detergent users. Common greasy soils can include edible fats and oils of animal and vegetable origin, cosmetic and mechanical greases, and highly convoluted organic body soils. Practically, simple greasy food soils, such as olive oil and lard, often appear optically transparent to opaque when present on substrates. This presents challenges for visual and instrumental assessment of such stains following washing process. To address this, such soils are commonly dyed using oleophilic colourants and analysed colourimetrically. However, this method has limitations, in that it requires prior inclusion of the colourant, and thus can only be achieved for stains prepared in the laboratory setting. More complex greasy soils, such as mechanical and body soils, are complex mixtures of hydrocarbons, proteins, carbohydrates, pigments, adjuncts, and mixtures thereof. The aforementioned colourimetric method cannot be used with such multicomponent real-world soils, or other soils which cannot effectively be dyed or otherwise coloured. For such soils, attenuated total reflectance [ATR] spectroscopy is the analytical standard. ATR is a contact technique, and thus can damage the integrity of the sample. Techniques using intense beams of light can also heat the sample causing degradation.
- Thus, there is a need for a non-contact and non-destructive analytical techniques which can be applied in the analysis of both simple and complex soils containing greasy hydrocarbons, which are present on substrates subject to washing process.
- The present invention provides a method of quantifying the removal of hydrocarbon component from a soiled fabric by a washing process. The method of the invention does not require the use of any colourant and can quantify the removal of hydrocarbon component from a soiled fabric in a non-contact and non-destructive manner.
- The present invention provides a method of quantifying the removal of hydrocarbon component from a soiled fabric by a washing process, wherein the soiled fabric comprises at least 0.5wt% hydrocarbon component wherein the method uses near infra-red (NIR) analysis, wherein the method comprises the steps of: (a) performing non-contact NIR analysis of the soiled fabric to determine the concentration of hydrocarbon component present on the soiled fabric at multiple points; (b) washing the soiled fabric to obtain a washed fabric; (c) performing non-contact NIR analysis of the washed fabric to determine the concentration of hydrocarbon component present on the washed fabric at the same multiple points that were used in step (a); and (d)quantifying the removal of hydrocarbon component from the soiled fabric by the washing process.
-
-
Figure 1 shows the average measured soil wt% for each calibration sample using the machine learning methodology. -
Figure 2 shows the integrals of the lipid peaks, 1680 - 1860 nm, against the known soil wt% of the calibration samples for cotton, poly-cotton, and polyester. - Method of Quantifying the Removal of Hydrocarbon Component from a Soiled Fabric by a Washing Process
The method of quantifying the removal of hydrocarbon component from a soiled fabric by a washing process comprises the steps of: - (a) performing non-contact NIR analysis of the soiled fabric to determine the concentration of hydrocarbon component present on the soiled fabric at multiple points;
- (b) washing the soiled fabric to obtain a washed fabric;
- (c) performing non-contact NIR analysis of the washed fabric to determine the concentration of hydrocarbon component present on the washed fabric at the same multiple points that were used in step (a); and
- (d) quantifying the removal of hydrocarbon component from the soiled fabric by the washing process.
- The soiled fabric comprises at least 0.5wt% hydrocarbon component wherein the method uses near infra-red (NIR) analysis.
- Typically, during steps (a) and (c), the NIR analysis is carried out at a light wavelength of from 750nm to 2500nm, or from 900nm to 2500nm.
- The method may also perform additional non-contact optical analysis selected from UV analysis, visible-light analysis, and a combination thereof. Preferably, the UV analysis is carried out at a light wavelength of from 250nm to below 400nm. Preferably, the visible-light analysis is carried out at a wavelength of from 400nm to less than 750nm.
- Preferably the NIR analysis is non-destructive.
- Typically, the NIR analysis is carried out by a spectrometer. Typically, the spectrometer employs two separate light-source and detector modules to cover the full spectral range. The outputs from the two sources are typically combined using a beam-splitter and are directed onto the sample via a two-core bifurcated fiber optic. Typically, the short-wave end of the spectrum (400 - 1200 nm) is generated by the output of a tungsten-halogen lamp (e.g. Ocean Optics HP2000) combined with a 2.0cm pathlength water filter. The water filter typically that has the effect of removing any radiation of wavelengths longer than 1250 nm. Typically, the output of this lamp is continuous. Typically, the short wave infra-red (SWIR) component of the spectrum is generated by a second tungsten lamp and interferometer (e.g. ArcOptix F FTIR-OEM200-NIR-20 and FTIR-OEM000-CAF2 respectively). This typically creates a modulated output in the range 900 - 2600 nm. The two beams are typically combined using a beam splitter and imaged onto the single end of a bifurcated fiber (e.g. Ocean Optics, 400 µm diameter) with a fiber coupling lens. Typically, the outputs of the bifurcated fibers illuminate the target area via two collimating lenses (e.g. Ocean Optics) at an angle of ± 45° to the surface normal.
- Typically, the back-scattered light from the sample is collected by an off-axis parabolic mirror (e.g. Thorlabs, f=50.4 mm, ϕ=0.5"). This is typically arranged so that its focus is at the point of overlap of the two illumination beams. Typically, the collected light is split with a 10% reflective beam-splitter, usually with the minor portion imaged onto a fiber and the spectral profile collected by a spectrograph -CCD (e.g. Ocean Optics May2000 Pro), and the major portion being collected onto a cooled InGaAs photodiode (e.g. Arcoptix FTIR-OEM100-09-025-2TE).
- By using a CW source and quasi-CW detector for the vis-NIR spectral region and a modulated source with an AC-coupled detector for the NIR-SWIR, the two signals can be acquired effectively independently of one another. The reduced sensitivity in the NIR/SWIR region can be mitigated by incorporating the cooled InGaAs detector in the probe head itself, avoiding any loss incurred by coupling it by a second fiber optic. The UV-NIR spectrum can be recorded using a commercial spectrograph-CCD, (e.g. Ocean Optics MayaPro, HC1 grating, 100 µm slit), which is fibre coupled to the probe head. The superior sensitivity and excellent signal to noise performance of this spectrometer accommodates the losses of the fibre coupling whilst offering excellent spectral resolution.
- The system can be controlled by a custom interface written in LabVIEW, and acquires spectra continually from the two spectrometers. Background/dark-current spectra and spectra from a white reference tile are typically recorded and stored, allowing the two reflectance spectra to be recorded and displayed in real-time alongside a video-microscope output and when selected the spectra and an image are captured and stored for analysis.
- Typically, the spatial resolution of the area being investigated is in the order of from 1.0mm to 2.0mm diameter, and typically multiple points being analyzed.
- Typically, the spectrometer is configured such that the detector is local to the sample, and the light is delivered from the spectrometer by fibre optic means. This configuration improves the sensitivity and allows for a smaller probe head to be used.
- Step (a) performs non-contact NIR analysis of the soiled fabric to determine the concentration of hydrocarbon component present on the soiled fabric at multiple points.
- Step (b) washes the soiled fabric to obtain a washed fabric. The soiled fabric can be washed by any suitable means. Typically, an aqueous based detergent wash bath is used. Any suitable laundry detergent may be used.
- Step (c) performs non-contact NIR analysis of the washed fabric to determine the concentration of hydrocarbon component present on the washed fabric at the same multiple points that were used in step (a).
- Step (d) quantifies the removal of hydrocarbon component from the soiled fabric by the washing process.
- Preferably, during step (d), the amount of hydrocarbon component removed from the soiled fabric by the washing process is quantified by:

- Typically, the soiled fabric comprises from 1.0wt% to 60wt% hydrocarbon component, or from 2.0wt% to 60wt%, or from 3.0wt% to 60wt%, or from 4.0wt% to 60wt%, or even from 5.0wt% to 60wt% hydrocarbon content. Any suitable soiled fabric can be used, such as polyester, cotton including poly cotton, and blends including a 35/65 blend of polyester/cotton.
- The hydrophobic content is typically present as part of a complex soil. The complex soil may comprise from 0.1wt% to 80wt% hydrocarbon component and from 20wt% to 99.9wt% non-hydrocarbon component.
- Typically, the hydrophobic content is selected from diglycerides, triglycerides, fatty acids, saturated and unsaturated hydrocarbons, and any combination thereof.
- The hydrophobic content may be selected from hydrophobic deposition ingredients selected from polymers, surfactants, polydimethylsiloxane and any combination thereof.
- Soiled fabric samples comprising from 1wt% to 60wt% hydrocarbon content were prepared.
-
- 1. SWIR reflectance spectra are recorded from 400 - 2500 nm, the average of 2 spectra, integrating over 500 ms
- 2. Background spectra of a white certified reflectance standard (SRS-99-010) is recorded
- 3. Each model soil calibration sample is placed under the instrument and the separation between the detector and the sample set to 5 cm
- 4. Five spectra are recorded for each sample at five different locations around the centre of the fabric sample
- The data analysis is performed by the following method.
- 1. Recorded spectra, 900 - 2500 nm, are first smoothed using a 4-point moving average function
- 2. The spectra are then normalised using a Standard Normal Variate (SNV) function
- 3. For quantitative analysis the original spectra measured as % reflectance is transformed into Kubelka-Munk units as these band intensities are proportional to concentration
- 4. Integration of the peaks between 1680 - 1860 nm are performed
- 5. The integrated peaks area is plotted against the known weight % of the samples to produce a calibration curve for the analysis of unknown samples
- Three calibration sets are prepared from 1 wt% up to 70 wt% on cotton, polycotton, and polyester. Calibration samples below 15 wt% are prepared using a droplet printer technique. Above 15 wt% a pipette is used to add the required volume of soil solution onto the fabric. For each calibration sample the SWIR spectrum is recorded at five points on the surface as detailed above.
-
Figure 1 shows the average measured soil wt% for each calibration sample using the machine learning methodology. For all fabrics investigated there is a good correlation between the known mass soil mass of the calibration samples and the measured soil content between 10 wt% and 60wt%. Above 60wt% a plateau in the measured soil content is observed. With poly-cotton the model is accurate, within 2%. -
Figure 2 shows the integrals of the lipid peaks, 1680 - 1860 nm, against the known soil wt% of the calibration samples for cotton, poly-cotton, and polyester. For all three fabrics a strong linear relationship between the integrated lipid peak areas and the soil content are observed. The poly-cotton shows the least variation from the linear relationship. The cotton samples exhibit slightly higher variation with each sample and between them but not significantly more than the poly-cotton samples. Whilst the polyester data show greater variation compared to the other two fabrics there is still a clear trend with which to produce a calibration curve, although with a slightly higher margin of error. - The following tables compare the soil content of the calibration samples, the mean soil content as measured by a machine learning model, the mean lipid peak integrals, as well as the associated standard deviations for both measurements.
Cotton Printed Wt% SWIR model Wt% SWIR model S.D SWIR Integral A.U SWIR Integral S.D 0.89% 0.39 0.17 8.16 0.75 2.10% 1.32 0.64 8.30 0.49 2.71% 4.16 1.02 9.43 0.65 3.90% 6.98 1.28 9.50 0.57 4.13% 7.36 0.68 10.13 0.34 5.15% 9.73 0.43 10.50 0.47 5.15% 10.61 0.50 10.50 0.80 8.87% 13.15 0.52 12.14 0.69 9.25% 14.29 2.27 11.99 1.11 11.10% 14.60 0.61 13.15 0.28 14.97% 17.37 0.96 14.21 0.90 19.90% 22.39 0.57 17.38 0.62 24.55% 26.53 0.77 20.16 0.59 28.11% 30.85 0.81 22.44 0.48 34.38% 39.42 3.79 26.36 2.14 46.94% 48.66 2.27 30.61 0.75 60.78% 60.32 0.65 35.97 0.83 82.63% 63.91 0.10 40.54 0.43 87.63% 63.13 0.30 39.39 1.10 PolyCotton Printed Wt% SWIR model Wt% SWIR model S.D SWIR Integral A.U SWIR Integral S.D 0.67% 1.91 0.25 -7.71 1.50 2.24% 3.03 0.19 -6.17 1.15 3.40% 3.80 0.24 -5.56 0.79 4.11% 4.58 0.19 -3.52 0.34 4.76% 5.09 0.30 -2.16 1.15 5.84% 6.50 0.40 -1.28 0.53 6.76% 8.62 0.49 0.33 1.02 7.64% 9.19 0.71 2.67 0.96 7.78% 9.38 0.76 1.20 0.87 8.56% 10.26 0.33 2.63 0.55 15.99% 18.12 0.72 5.80 0.52 20.18% 22.86 0.81 8.16 1.12 23.94% 26.25 0.69 9.38 1.07 28.12% 29.17 0.54 9.85 0.39 35.91% 38.85 0.93 17.40 1.01 52.89% 56.29 2.49 23.72 0.86 58.97% 60.82 0.97 25.77 0.46 62.44% 63.06 0.63 28.90 0.33 67.34% 60.31 2.51 20.09 4.96 Polyester Printed Wt% SWIR model Wt% SWIR model S.D SWIR Integral A.U SWIR Integral S.D 1.29% 0.84 0.26 7.29 1.87 2.55% 3.66 1.01 10.40 1.00 2.72% 3.89 0.77 11.14 1.08 3.71% 7.91 1.07 14.30 1.13 4.48% 8.11 1.06 13.71 1.13 6.61% 10.34 0.64 14.92 1.30 6.38% 10.66 0.13 17.53 0.99 7.87% 11.40 0.30 16.45 1.54 9.02% 15.41 1.63 20.74 1.35 10.38% 16.13 1.12 20.63 1.34 12.24% 19.24 0.74 24.28 0.58 20.45% 26.60 1.92 28.95 1.01 25.68% 30.94 2.01 33.50 0.70 34.09% 40.05 1.29 37.44 0.84 34.29% 41.92 2.56 37.20 1.41 45.88% 48.22 1.33 41.37 0.36 60.00% 57.98 0.59 44.97 0.36 71.41% 62.51 0.29 48.35 0.84 82.87% 64.84 0.34 49.28 0.50 - The dimensions and values disclosed herein are not to be understood as being strictly limited to the exact numerical values recited. Instead, unless otherwise specified, each such dimension is intended to mean both the recited value and a functionally equivalent range surrounding that value. For example, a dimension disclosed as "40 mm" is intended to mean "about 40 mm".
Claims (11)
- A method of quantifying the removal of hydrocarbon component from a soiled fabric by a washing process, wherein the soiled fabric comprises at least 0.5wt% hydrocarbon component wherein the method uses near infra-red (NIR) analysis, wherein the method comprises the steps of:(a) performing non-contact NIR analysis of the soiled fabric to determine the concentration of hydrocarbon component present on the soiled fabric at multiple points;(b) washing the soiled fabric to obtain a washed fabric;(c) performing non-contact NIR analysis of the washed fabric to determine the concentration of hydrocarbon component present on the washed fabric at the same multiple points that were used in step (a); and(d) quantifying the removal of hydrocarbon component from the soiled fabric by the washing process.
- A method according to claim 1, wherein the hydrophobic content is present as part of a complex soil, wherein the complex soil comprises from 0.1wt% to 80wt% hydrocarbon component and from 20wt% to 99.9wt% non-hydrocarbon component,
- A method according to any preceding claim, wherein the hydrophobic content is selected from diglycerides, triglycerides, fatty acids, saturated and unsaturated hydrocarbons, and any combination thereof.
- A method according to any preceding claim, wherein the hydrophobic content is selected from hydrophobic deposition ingredients selected from polymers, surfactants, polydimethylsiloxane and any combination thereof.
- A method according to any preceding claim, wherein the soiled fabric comprises from 1.0wt% to 60wt% hydrocarbon component.
- A method according to any preceding claim, wherein during steps (a) and (c), the NIR analysis is carried out at a light wavelength of from 750nm to 2500nm,
- A method according to claim 5, wherein during steps (a) and (c), the NIR analysis is carried out at a light wavelength of from 900nm to 2500nm
- A method according to any preceding claim, wherein the method also performs additional non-contact optical analysis selected from UV analysis, visible-light analysis, and a combination thereof.
- A method according to claim 7, wherein the UV analysis is carried out at a light wavelength of from 250nm to below 400nm, and wherein the visible-light analysis is carried out at a wavelength of from 400nm to less than 750nm.
- A method according to any preceding claim, wherein the NIR analysis is non-destructive.
- A method according to any preceding claim, wherein during step (d), the amount of hydrocarbon component removed from the soiled fabric by the washing process is quantified by:

Priority Applications (3)
| Application Number | Priority Date | Filing Date | Title |
|---|---|---|---|
| EP21181276.3A EP4108753A1 (en) | 2021-06-23 | 2021-06-23 | A method of quantifying the removal of hydrocarbon component from a soiled fabric by a washing process |
| PCT/US2022/034436 WO2022271766A1 (en) | 2021-06-23 | 2022-06-22 | A method of quantifying the removal of hydrocarbon component from a soiled fabric by a washing process |
| US18/210,240 US12467861B2 (en) | 2021-06-23 | 2023-06-15 | Method of quantifying the removal of hydrocarbon component from a soiled fabric by a washing process |
Applications Claiming Priority (1)
| Application Number | Priority Date | Filing Date | Title |
|---|---|---|---|
| EP21181276.3A EP4108753A1 (en) | 2021-06-23 | 2021-06-23 | A method of quantifying the removal of hydrocarbon component from a soiled fabric by a washing process |
Publications (1)
| Publication Number | Publication Date |
|---|---|
| EP4108753A1 true EP4108753A1 (en) | 2022-12-28 |
Family
ID=76584450
Family Applications (1)
| Application Number | Title | Priority Date | Filing Date |
|---|---|---|---|
| EP21181276.3A Pending EP4108753A1 (en) | 2021-06-23 | 2021-06-23 | A method of quantifying the removal of hydrocarbon component from a soiled fabric by a washing process |
Country Status (3)
| Country | Link |
|---|---|
| US (1) | US12467861B2 (en) |
| EP (1) | EP4108753A1 (en) |
| WO (1) | WO2022271766A1 (en) |
Citations (5)
| Publication number | Priority date | Publication date | Assignee | Title |
|---|---|---|---|---|
| US20040119972A1 (en) * | 2002-12-11 | 2004-06-24 | Unilever Home & Personal Care Usa, Division Of Conopco, Inc. | Identification method |
| US20170275565A1 (en) * | 2016-03-24 | 2017-09-28 | The Procter & Gamble Company | Compositions containing an etheramine |
| CN107782692A (en) * | 2017-10-19 | 2018-03-09 | 山西大学 | A kind of assay method of new washing dirt-removing power and application |
| US20180238796A1 (en) * | 2015-08-24 | 2018-08-23 | Conopco, Inc., D/B/A Unilever | Method and apparatus for stain treatment |
| EP3224335B1 (en) * | 2014-11-26 | 2018-10-03 | Unilever NV | Method for treating fabric having oily stains |
Family Cites Families (1)
| Publication number | Priority date | Publication date | Assignee | Title |
|---|---|---|---|---|
| US9828571B2 (en) * | 2015-06-05 | 2017-11-28 | Illinois Tool Works, Inc. | Heavy duty laundry detergent |
-
2021
- 2021-06-23 EP EP21181276.3A patent/EP4108753A1/en active Pending
-
2022
- 2022-06-22 WO PCT/US2022/034436 patent/WO2022271766A1/en not_active Ceased
-
2023
- 2023-06-15 US US18/210,240 patent/US12467861B2/en active Active
Patent Citations (5)
| Publication number | Priority date | Publication date | Assignee | Title |
|---|---|---|---|---|
| US20040119972A1 (en) * | 2002-12-11 | 2004-06-24 | Unilever Home & Personal Care Usa, Division Of Conopco, Inc. | Identification method |
| EP3224335B1 (en) * | 2014-11-26 | 2018-10-03 | Unilever NV | Method for treating fabric having oily stains |
| US20180238796A1 (en) * | 2015-08-24 | 2018-08-23 | Conopco, Inc., D/B/A Unilever | Method and apparatus for stain treatment |
| US20170275565A1 (en) * | 2016-03-24 | 2017-09-28 | The Procter & Gamble Company | Compositions containing an etheramine |
| CN107782692A (en) * | 2017-10-19 | 2018-03-09 | 山西大学 | A kind of assay method of new washing dirt-removing power and application |
Non-Patent Citations (1)
| Title |
|---|
| CHARLES C GORDON ET AL: "Performance aspects of water conservation techniques for appliances NBS IR 81-2291", 31 December 1981 (1981-12-31), pages 1 - 46, XP061041208, Retrieved from the Internet <URL:https://nvlpubs.nist.gov/nistpubs/Legacy/IR/nbsir81-2291.pdf> [retrieved on 19811231], DOI: 10.6028/NBS.IR.81-2291 * |
Also Published As
| Publication number | Publication date |
|---|---|
| US12467861B2 (en) | 2025-11-11 |
| WO2022271766A1 (en) | 2022-12-29 |
| US20230324294A1 (en) | 2023-10-12 |
Similar Documents
| Publication | Publication Date | Title |
|---|---|---|
| Yildiz et al. | Method for determining oxidation of vegetable oils by near‐infrared spectroscopy | |
| Leona et al. | Fiber optics reflectance spectroscopy: a unique tool for the investigation of Japanese paintings | |
| US7808634B2 (en) | Method and apparatus for automated spectral calibration | |
| US5995645A (en) | Method of cancer cell detection | |
| Workman Jr | A review of process near infrared spectroscopy: 1980–1994 | |
| CN109906370B (en) | Optical coherence tomography imaging device and measurement method | |
| BR9707245A (en) | Process and apparatus for multispectral analysis in non-invasive infrared spectroscopy | |
| US20200103276A1 (en) | Optical probe, raman spectroscopy system, and method of using the same | |
| US8440959B2 (en) | Method and apparatus for automated spectral calibration | |
| CN106361279A (en) | Full-investigation depth dispersion compensation method by optical coherence tomography system | |
| García-González et al. | Infrared, raman, and fluorescence spectroscopies: Methodologies and applications | |
| US11525665B2 (en) | Optical coherence tomographic apparatus and optical coherence tomographic method performing spectrum conversion based on single gaussian distribution curve | |
| WO2006132967A2 (en) | Method and apparatus for frequency-converting infrared light | |
| Chillè et al. | An analytical evaluation of Er: YAG laser cleaning tests on a nineteenth century varnished painting | |
| JP3754581B2 (en) | Analysis method for multi-component organic solutions | |
| Sarkar et al. | Monitoring of fruit freshness using phase information in polarization reflectance spectroscopy | |
| Peruzzi et al. | Non-invasive identification of dyed textiles by using VIS-NIR FORS and hyperspectral imaging techniques | |
| Samaei et al. | Continuous-wave parallel interferometric near-infrared spectroscopy (CW π NIRS) with a fast two-dimensional camera | |
| US12467861B2 (en) | Method of quantifying the removal of hydrocarbon component from a soiled fabric by a washing process | |
| Zhang et al. | Sub-surface imaging of soiled cotton fabric using full-field optical coherence tomography | |
| US10706524B2 (en) | Systems and methods for analyzing stained fabric articles | |
| JP2020193928A (en) | Two-dimensional spectroscopic measurement system and data processing method | |
| Qin et al. | Measurement of the optical properties of apples using hyperspectral diffuse reflectance imaging | |
| US9007582B2 (en) | Apparatus and method for suppression of background noise in microscopy imaging | |
| Atkinson | A multi-modal instrument combining optical coherence tomography and microscopic spectral imaging for cultural heritage applications |
Legal Events
| Date | Code | Title | Description |
|---|---|---|---|
| PUAI | Public reference made under article 153(3) epc to a published international application that has entered the european phase |
Free format text: ORIGINAL CODE: 0009012 |
|
| STAA | Information on the status of an ep patent application or granted ep patent |
Free format text: STATUS: THE APPLICATION HAS BEEN PUBLISHED |
|
| AK | Designated contracting states |
Kind code of ref document: A1 Designated state(s): AL AT BE BG CH CY CZ DE DK EE ES FI FR GB GR HR HU IE IS IT LI LT LU LV MC MK MT NL NO PL PT RO RS SE SI SK SM TR |
|
| P01 | Opt-out of the competence of the unified patent court (upc) registered |
Effective date: 20230429 |
|
| STAA | Information on the status of an ep patent application or granted ep patent |
Free format text: STATUS: REQUEST FOR EXAMINATION WAS MADE |
|
| 17P | Request for examination filed |
Effective date: 20230627 |
|
| RBV | Designated contracting states (corrected) |
Designated state(s): AL AT BE BG CH CY CZ DE DK EE ES FI FR GB GR HR HU IE IS IT LI LT LU LV MC MK MT NL NO PL PT RO RS SE SI SK SM TR |