EP4105643A1 - Method for enhancing the photoresistance of a fluorescent species and fluorescence microscopy system suitable for implementing said method - Google Patents
Method for enhancing the photoresistance of a fluorescent species and fluorescence microscopy system suitable for implementing said method Download PDFInfo
- Publication number
- EP4105643A1 EP4105643A1 EP21305834.0A EP21305834A EP4105643A1 EP 4105643 A1 EP4105643 A1 EP 4105643A1 EP 21305834 A EP21305834 A EP 21305834A EP 4105643 A1 EP4105643 A1 EP 4105643A1
- Authority
- EP
- European Patent Office
- Prior art keywords
- enhancing
- exciting
- illumination
- intensity
- wavelength
- Prior art date
- Legal status (The legal status is an assumption and is not a legal conclusion. Google has not performed a legal analysis and makes no representation as to the accuracy of the status listed.)
- Withdrawn
Links
Images



Classifications
-
- G—PHYSICS
- G01—MEASURING; TESTING
- G01N—INVESTIGATING OR ANALYSING MATERIALS BY DETERMINING THEIR CHEMICAL OR PHYSICAL PROPERTIES
- G01N21/00—Investigating or analysing materials by the use of optical means, i.e. using sub-millimetre waves, infrared, visible or ultraviolet light
- G01N21/62—Systems in which the material investigated is excited whereby it emits light or causes a change in wavelength of the incident light
- G01N21/63—Systems in which the material investigated is excited whereby it emits light or causes a change in wavelength of the incident light optically excited
- G01N21/64—Fluorescence; Phosphorescence
- G01N21/645—Specially adapted constructive features of fluorimeters
- G01N21/6456—Spatial resolved fluorescence measurements; Imaging
- G01N21/6458—Fluorescence microscopy
-
- G—PHYSICS
- G02—OPTICS
- G02B—OPTICAL ELEMENTS, SYSTEMS OR APPARATUS
- G02B21/00—Microscopes
- G02B21/06—Means for illuminating specimens
-
- G—PHYSICS
- G01—MEASURING; TESTING
- G01N—INVESTIGATING OR ANALYSING MATERIALS BY DETERMINING THEIR CHEMICAL OR PHYSICAL PROPERTIES
- G01N21/00—Investigating or analysing materials by the use of optical means, i.e. using sub-millimetre waves, infrared, visible or ultraviolet light
- G01N21/62—Systems in which the material investigated is excited whereby it emits light or causes a change in wavelength of the incident light
- G01N21/63—Systems in which the material investigated is excited whereby it emits light or causes a change in wavelength of the incident light optically excited
- G01N21/64—Fluorescence; Phosphorescence
- G01N2021/6417—Spectrofluorimetric devices
- G01N2021/6419—Excitation at two or more wavelengths
-
- G—PHYSICS
- G01—MEASURING; TESTING
- G01N—INVESTIGATING OR ANALYSING MATERIALS BY DETERMINING THEIR CHEMICAL OR PHYSICAL PROPERTIES
- G01N21/00—Investigating or analysing materials by the use of optical means, i.e. using sub-millimetre waves, infrared, visible or ultraviolet light
- G01N21/62—Systems in which the material investigated is excited whereby it emits light or causes a change in wavelength of the incident light
- G01N21/63—Systems in which the material investigated is excited whereby it emits light or causes a change in wavelength of the incident light optically excited
- G01N21/64—Fluorescence; Phosphorescence
- G01N21/6408—Fluorescence; Phosphorescence with measurement of decay time, time resolved fluorescence
-
- G—PHYSICS
- G01—MEASURING; TESTING
- G01N—INVESTIGATING OR ANALYSING MATERIALS BY DETERMINING THEIR CHEMICAL OR PHYSICAL PROPERTIES
- G01N2201/00—Features of devices classified in G01N21/00
- G01N2201/02—Mechanical
- G01N2201/023—Controlling conditions in casing
- G01N2201/0231—Thermostating
-
- G—PHYSICS
- G02—OPTICS
- G02B—OPTICAL ELEMENTS, SYSTEMS OR APPARATUS
- G02B21/00—Microscopes
- G02B21/16—Microscopes adapted for ultraviolet illumination ; Fluorescence microscopes
Definitions
- the invention relates to the technical field of fluorescence microscopy.
- the invention relates to a method for enhancing the photoresistance of a fluorescent species, and fluorescence microscopy system suitable for implementing said method.
- Fluorescence microscopy is a method for observing a sample, in which the sample emits fluorescence upon being illuminated with an external light source of appropriate wavelength.
- the sample may be coupled to (or labelled, or tagged with) fluorescent species (or fluorophores, or fluorochromes).
- fluorescent species or fluorophores, or fluorochromes.
- Fluorophores may for instance be organic molecules, proteins, or nanoparticles able to emit light as a result of an excitation by an external illumination.
- fluorescence occurs when a fluorophore, initially in a ground state A, is excited into a singlet excited state B by way of an absorption of photons from an exciting illumination having a wavelength in an absorption band of the fluorophore.
- the fluorophore then relaxes back to the initial ground state A by an emission F of fluorescence light and by heat dissipation, or transits into a long-lived triplet excited state C via a phenomenon called intersystem crossing (ISC).
- ISC intersystem crossing
- a photobleached state is an irreversible non-fluorescent state of the fluorophore, from which it is not possible to return to the initial fluorescent state neither spontaneously nor by the effect of a light excitation.
- fluorescent species such as organic fluorophores and fluorescent proteins degrade into photoproducts after typically 10 5 excitationemission cycles which for a molar absorption coefficient of the fluorophore of 100 000 mol -1 .L.cm -1 and an excitation intensity of 1 W.cm -2 at 500 nm leads to the extinction of the fluorophore in about 100 seconds.
- the fluorescence signal decay as a function of time may be characterized by measuring the fluorescence half-life defined as the characteristic time at which the fluorescence signal is equal to half of the initial fluorescence signal.
- Photobleaching concerns all fluorophores and fluorescence imaging techniques and leads to various problems. It limits the duration and/or the time resolution of the experiments, which hinders the proper monitoring of biological dynamics. It limits the number of photons emitted by the fluorophores, which degrades the image quality. It complicates the quantitative analysis of fluorescence variations. In addition, photobleached fluorophore states may be damaging to the sample under study and contribute to phototoxicity.
- Another existing solution consists in quenching the triplet state of the fluorescent species by means of electron transfer reactions (reduction followed by oxidation, or vice versa).
- This strategy uses mixtures of reductants and oxidants, such as Trolox or the ROXS system (1 mM ascorbic acid + 1 mM methylviologen), a description of which may be found in the scientific publications " Nonblinking and long-lasting single-molecule fluorescence imaging", Rasnik et al., Nat. Methods 2006, 3, 891 “ and " A reducing and oxidizing system minimizes photobleaching and blinking of fluorescent dyes", Vogelsang et al., Angew. Chem. Int. Ed. 2008, 47, 5465 “. It requires cell fixation and oxygen removal.
- a third strategy can be used to specifically reduce the photobleaching of green fluorescent proteins.
- cell culture media were developed which lack riboflavin and pyridoxal.
- Such culture media are described in the scientific publications " Cell culture medium affects GFP photostability: a solution”, Bogdanov et al., Nat. Methods 2009, 6, 859 “, " Anti-fading media for live cell GFP imaging”, Bogdanov et al., Plos One 2012, 7, e53004 “ and " Influence of cell growth conditions and medium composition on EGFP photostability in live cells", Mamontova et al., BioTechniques 2015, 58, 258 "
- One object of the invention is to provide a method for microscopic fluorescence imaging, a method for implementing said method, and a corresponding fluorescence microscopy system which enhance the photoresistance of the used fluorescent species, i.e. slow down the photobleaching of the fluorescent species, without chemically altering the sample environment nor requiring any specific sample preparation.
- a method for enhancing the photoresistance of a fluorescent species observed by fluorescence microscopy in a sample containing several molecules of the fluorescent species according to a fluorescence microscopy technique comprising:
- absorption band should be understood as an about 50 nm wavelength interval centered on a peak absorption value, the peak absorption value being a wavelength value for which the absorption reaches a maximum for the considered fluorescent species.
- a fluorescent species may have more than one absorption peak, and therefore more than one absorption band.
- the intensity should be understood as the irradiance, or power density, that is to say the power received by a surface per unit area.
- R max is the maximum value of the ratio R( ⁇ ) for an optimum enhancing wavelength value.
- the transient state is depleted and the transition of the fluorescent species into the photobleached state is delayed. Consequently, the photostability, or photoresistance of the fluorescent species is increased and the photobleaching is slowed down. Reducing the photobleaching rate allows the study of samples for longer periods of time and with a better time resolution, and enhances the quality of the recorded images.
- the enhancing wavelength ⁇ + is an optimum enhancing wavelength chosen so as to maximize the ratio R( ⁇ ).
- the enhancing illumination is conducted at an optimum enhancing intensity which is the smallest value of the enhancing intensity I + respecting R'(2I) ⁇ ⁇ R'(I) where:
- the illumination period P i is superior to the half-life period P 1/2 of the fluorescent species when illuminated by the sole exciting illumination, preferably superior to 3 times the half-life period P 1/2 , and more preferably to 10 times the half-life period P 1/2 .
- the illumination period P i is superior to 1 second.
- the exciting intensity I e is inferior or equal to 1000 W.cm -2 and preferably inferior to 100 W.cm -2 .
- the enhancing intensity I + respects the relation: 3I e ⁇ I + ⁇ 100 I e .
- the enhancing wavelength ⁇ + is chosen in the near infrared, preferably the enhancing wavelength ⁇ + is between 700 nm and 1000 nm.
- an enhancing wavelength in the near infrared and preferably between 700 and 1000 nm, advantageously leads to a higher value of the ratio R( ⁇ ) and a slower photobleaching of fluorescent proteins.
- near infrared illumination is less phototoxic than ultraviolet-visible illumination and has a higher penetration depth in biological samples than ultraviolet-visible light.
- the exciting and enhancing illuminations are continuous illuminations.
- the exciting and enhancing illuminations are conducted simultaneously.
- the illuminations are time-modulated illuminations.
- the fluorescent species is a fluorescent protein
- the enhancing illumination wavelength ⁇ + is in the near infrared
- the exciting intensity I e is inferior or equal to 100 W.cm -2
- the enhancing intensity I + is respecting the relation 3I e ⁇ I + ⁇ 100I e
- a method for implementing the method according to the invention on a fluorescence microscopy system implementing the fluorescence microscopy technique comprising an illumination system able to deliver at least two light beams in a same illumination region which each wavelength may be chosen among n different illumination wavelengths ⁇ k and each intensity is lower or equal to a maximum intensity I max ( ⁇ k ) reachable by the illumination system for the n illumination wavelengths ⁇ k , the method comprising:
- the method further comprises choosing an optimum enhancing intensity as the smallest value of the enhancing intensity I + respecting R'(2I) ⁇ ⁇ R'(I) where:
- the first intensity I 1 respects the relation le ⁇ I 1 ⁇ 3I e and preferably equals 3I e .
- a fluorescence microscopy system suitable for implementing the methods according to the invention, the system comprising an illumination system able to deliver in a same region at least:
- the illumination system comprises at least two light sources, one being a tunable light source able to deliver an enhancing illumination with an enhancing wavelength ⁇ + tunable between at least 700 nm and 1000 nm and an enhancing intensity I + tunable between at least 20 W.cm -2 and 10 kW.cm -2 .
- the invention aims at slowing down the photobleaching of a fluorescent species when used in fluorescence microscopy, by illuminating the observed sample with both an exciting beam and an enhancing beam.
- a fluorescence microscopy system 1 for microscopic imaging of a sample 2 as shown on figure 2 .
- This system 1 comprises a first light source 3 configured to perform an exciting illumination by emitting an exciting beam 4 having an exciting wavelength ⁇ e and a second light source 5 configured to perform an enhancing illumination by emitting an enhancing beam 6 having an enhancing wavelength ⁇ + .
- the system 1 is a wide-field fluorescence microscope comprising the first light source 3 able to deliver the exciting beam 4 having the exciting wavelength selected among n wavelengths ⁇ k comprised for example between 380 nm and 650 nm.
- the first light source is able to deliver a light beam having an exciting intensity le lower than or equal to a maximum intensity I max ( ⁇ k ) which is different for each of the n wavelengths ⁇ k .
- the first light source 3 comprises ten light-emitting diodes (LED) 31 one only being shown on the figure.
- Each LED is configured to deliver a beam 32 collimated by a lens 7 and filtered by an excitation filter 8 in order to form the exciting beam 4.
- the exciting beam 4 is focused by a lens 33 and directed toward the sample 2 thanks to a first dichroic mirror 9 configured to reflect the exciting beam 4.
- the second light source 5 is a laser source, here a tunable laser source, able to deliver the enhancing beam having the enhancing wavelength continuously tunable between 700 nm and 1000 nm and an enhancing intensity I + comprised between 20 W.cm -2 and 10000 W.cm -2 .
- the enhancing beam 6 is directed toward the sample 2 after a first reflection on a conventional mirror 10, focusing by lens 34 and a second reflection on a second dichroic mirror 11 configured to reflect the enhancing beam 6 and to transmit the exciting beam 4.
- the exciting beam 4 passes through the second dichroic mirror 11 after reflection on the first dichroic mirror 9.
- lenses 33 and 34 are to focus the exciting beam 4 and the enhancing beam 6 in the rear focal plane of the objective 13 so as to obtain parallel beams at the exit of the objective for wide-field illumination of the sample 2.
- the objective also collects the fluorescence signal emitted by the sample 2 and collimates it into a fluorescence beam 14.
- An emission filter 15 is configured to filter the fluorescence beam and a second lens 16 is configured to focus the filtered fluorescence beam on a CCD camera 17.
- the camera is part of a measurement module 26 configured to measure the quantity Q of fluorescence light emitted by the fluorescent species, and comprising a processing module configured to normalize the measured signal and to perform operation on the measured signal or on the normalized measured signal, as explained below.
- the system further comprises an observation area configured to receive the sample 2 ( figure 3 ).
- the sample 2 is arranged on a glass coverslip 18 held on the observation area and placed in the path of the exciting beam 4 and in the path of the enhancing beam 6 so that at least a portion of the sample is illuminated by both the exciting beam 4 and the enhancing beam 6.
- the system 1 is therefore configured to illuminate the sample 2, for instance continuously, with both the first light 4 and the second light 6.
- the inventors had the merit to demonstrate that it is possible to enhance the photoresistance of the fluorescent species by illuminating the sample 2 with an excitation beam 4 and an enhancing beam 6.
- This double illumination with the exciting and the enhancing beams allows longer observation periods than the ones achieved with the sole exciting illumination at a same intensity in both cases.
- the system 1 is configured to deliver the exciting beam 4 as a wide field illumination which creates a first illuminated area or region 19.
- the system 1 is further configured to deliver the enhancing beam creating a second illuminated area 20, smaller than the first illuminated area 19 and comprised in the first illuminated area 19.
- each of the illuminated areas should cover a surface of at least 2 ⁇ 10 -3 mm 2 .
- the first illuminated area covers a circular surface having a diameter of 200 ⁇ m and the second illuminated area covers a circular surface having a diameter of 50 ⁇ m.
- the sample 2 is illuminated with the exciting light beam 4 at an exciting wavelength ⁇ e selected among the n different illumination wavelengths ⁇ k so as to be in an absorption band of the fluorescent species, in order to trigger a fluorescence emission by the fluorescent species.
- the exciting wavelength ⁇ e is selected among the n wavelengths ⁇ k to be the closest from the absorption peak of the fluorescent species.
- the exciting wavelength ⁇ e value is preferably selected within a range of about 50 nm centered around the maximum absorption value.
- the exciting intensity I e is set according to the fluorescence microscopy technique (epifluorescence microscopy, confocal microscopy, etc). Those skilled in the art know how to choose the exciting intensity. For instance, in wide-field microscopy the exciting intensity I e is typically less than 10 W.cm -2 , while in laser scanning confocal microscopy the exciting intensity I e is typically higher than 1 kW.cm -2 .
- the fluorophore is the Enhanced Green Fluorescent Protein (EGFP) embedded in a polyacrylamide gel.
- EGFP Enhanced Green Fluorescent Protein
- the absorption peak of the EGFP is known as being 488 nm, therefore the exciting wavelength is selected at 480 nm which is the wavelength nearest to the absorption peak among those available in the system 1.
- the implementation is conducted using wide field illumination with an exciting intensity of 32 W.cm -2 .
- the exciting wavelength ⁇ e and the exciting intensity I e being set, the best setting for the enhancing beam 6 has to be determined.
- the enhancing beam 6 should be configured to be absorbed by the fluorescent species so as to trigger a transition of the fluorescent species from the transient state back into the initial state. It is advantageous to first configure the enhancing wavelength ⁇ + namely the wavelength within the range of available wavelengths which has the enhancing effect demonstrated by the inventors. Once this enhancing wavelength is identified, it may be advantageous to optimise the enhancing intensity I + in order to limit the light received by the sample and hence the possible side effects of the enhancing illumination.
- an arbitrary predetermined enhancing intensity value may be selected during the configuration of the enhancing wavelength, and preferably a low enhancing intensity value.
- the arbitrary enhancing intensity value is set to 20 W.cm -2 .
- the quantity Q of fluorescence light emitted by the fluorescent species, as a function of the enhancing wavelength ⁇ + , during the illumination period P i is measured.
- the enhancing wavelength ⁇ + value should be selected as enhancing the photoresistance of the fluorescent species, that is to say it should be selected so as to maximize the quantity of fluorescence triggered by the exciting illumination only in presence of the enhancing illumination during the illumination period P i . Therefore, although the method concerns a double illumination with the exciting illumination and the enhancing illumination, the fluorescence that may be triggered directly by the enhancing illumination should not be considered.
- Figure 4 shows the evolution of the value of the ratio R( ⁇ + ) as a function of the enhancing wavelength ⁇ + , for a predetermined enhancing intensity I + value.
- an optimum enhancing wavelength ⁇ + value for which the fluorescence enhancement is at least half of its maximum value i.e. an enhancing wavelength value for which R( ⁇ + )>1+(R max ( ⁇ + )-1)/2, where R max ( ⁇ + ) is the maximum value of R for the predetermined enhancing intensity value.
- fluorescence enhancement should be understood as the difference between the number of photons emitted in presence of both the exciting and enhancing illumination and the number of photons emitted in presence of the exciting illumination only.
- the optimum enhancing wavelength ⁇ + value is equal to 900 nm.
- the enhancing intensity is limited to values higher than the exciting intensity I e .
- the enhancing intensity is limited to values respecting 3I e ⁇ I + ⁇ 100I e .
- Figure 5 shows the evolution of the value of the ratio R'(I+) as a function of the values of the enhancing intensity I + .
- the optimum enhancing intensity I + is chosen so as to respect R'(2I + ) ⁇ aR'(I+), where
- the enhancing wavelength ⁇ + value and the enhancing intensity I + value have been determined for a specific fluorescent species (here, EGFP), they may be used in order to enhance the photoresistance of this fluorescent species, for instance in a microscopy experiment that involves a sample labelled with this fluorescent species or for any type of experimentation, observation or measurement which may be conducted with this specific fluorescent species.
- a specific fluorescent species here, EGFP
- figure 6 shows the evolution of the normalized measured signal in an embodiment of a method for enhancing the photoresistance of a fluorescent species according to the invention, here EGFP embedded in a polyacrylamide gel.
- a second curve 22 shows the evolution of the normalized measured signal S(t) representative of the instant fluorescence emission triggered by both the exciting illumination and the enhancing illumination.
- the above-described embodiment applies to the determination of the enhancing wavelength ⁇ + and the enhancing intensity I + of the EGFP.
- the determination method may apply to any other fluorophore.
- the fluorophore was embedded in a polyacrylamide gel.
- the invention is not limited to fluorescent species embedded in polyacrylamide gel and the advantageous effects provided by the invention may be obtained with fluorescent species coupled to any suitable support, for instance biological samples such as bacteria or eukaryotic cells.
- Figures 7 to 10 show the results of the implementation of the method in several biological samples.
- the figures 7 and 8 show the results of the implementation of the invention with fixed eukaryotic cells, namely HeLa cells labelled with cytoplasmic EGFP.
- the exciting wavelength ⁇ e is equal to 480 nm
- the exciting intensity I e is equal to 32 W.cm -2
- the enhancing wavelength ⁇ + is equal to 900 nm
- the enhancing intensity I + is equal to 2 kW.cm -2 .
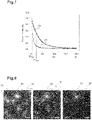
- Figure 8 shows three micrographs captured during the execution of the embodiment described in connection to figure 7 .
- the scale bars located on the bottom right of each micrograph are 20 ⁇ m long.
- the beams 4 and 6 are delivered according to the configuration of figure 3 .
- the bright spots are HeLa cells 23 labelled with cytoplasmic EGFP and emitting fluorescence. All the cells are illuminated with the exciting beam (wide field illumination) and the cells located in the second illuminated area 20 (represented by a dotted circle) are illuminated by both the exciting beam 4 and the enhancing beam 6.
- Figure 9 shows the results of the implementation of the invention with another sample of fixed eukaryotic cells, here U2OS cells, labelled with cytoplasmic EGFP.
- the exciting wavelength ⁇ e is equal to 480 nm
- the exciting intensity I e is equal to 32 W.cm -2
- the enhancing wavelength ⁇ + is equal to 900 nm
- the enhancing intensity I + is equal to 125 W.cm -2 .
- Figure 10 shows the results of the implementation of the invention with a sample of live bacteria, here Escherichia coli BL21 bacteria placed on a PBS-agarose pad (Phosphate-Buffered Saline agarose pad) and labelled with EGFP.
- a sample of live bacteria here Escherichia coli BL21 bacteria placed on a PBS-agarose pad (Phosphate-Buffered Saline agarose pad) and labelled with EGFP.
- PBS-agarose pad Phosphate-Buffered Saline agarose pad
- the exciting wavelength ⁇ e is equal to 480 nm
- the exciting intensity I e is equal to 32 W.cm -2
- the enhancing wavelength ⁇ + is equal to 900 nm
- the enhancing intensity I + is equal to 125 W.cm -2 .
- the invention is not limited to implementations with the Enhanced Green Fluorescent Protein (EGFP) but may be implemented with other green fluorescent proteins.
- EGFP Enhanced Green Fluorescent Protein
- the exciting wavelength ⁇ e is equal to 480 nm
- the exciting intensity I e is equal to 32 W.cm -2
- the enhancing wavelength ⁇ + is equal to 900 nm and the enhancing intensity I + is equal to 125 W.cm -2
- the invention is not limited to green fluorescent proteins but may be implemented with fluorescent proteins of other colours, for instance red or yellow.
- the exciting wavelength ⁇ e is equal to 480 nm
- the exciting intensity I e is equal to 37 W.cm -2
- the enhancing intensity I + is equal to 125 W.cm -2
- the enhancing wavelength is equal to 900 nm
- the fluorescent protein being Venus in live Escherichia coli bacteria
- the half-lives ratio is equal to 1.8.
- the exciting wavelength ⁇ e is equal to 480 nm
- the exciting intensity I e is equal to 37 W.cm -2
- the enhancing intensity I + is equal to 125 W.cm -2
- the enhancing wavelength is equal to 900 nm
- the fluorescent protein being the EYFP (Enhanced Yellow Fluorescent Protein) in live Escherichia coli bacteria
- the half-lives ratio is equal to 1.8.
- the exciting wavelength ⁇ e is equal to 560 nm
- the exciting intensity I e is equal to 5.8 W.cm -2
- the enhancing wavelength ⁇ + is equal to 725 nm and the enhancing intensity I + is equal to 250 W.cm -2 ,
- fluorophores being fluorescent proteins.
- the invention is not limited to fluorescent proteins and the invention is implementable with other fluorescent species, for instance organic fluorophores such as cyanines, fluoresceins or rhodamines.
- samples are in no way limiting, and the invention may be implemented with other samples.
- some embodiments of the invention may use live eukaryotic cells as samples.
- the invention may be performed with different kinds of illumination, for instance a scanning illumination, a pulsed illumination, or a time-modulated illumination. More precisely, the exciting and enhancing illuminations may be of different kind and may be carried out simultaneously or not. In embodiments where at least one illumination is a scanning illumination, the corresponding illuminated area should be understood as an area covered by said scanning illumination.
Landscapes
- Physics & Mathematics (AREA)
- Health & Medical Sciences (AREA)
- Analytical Chemistry (AREA)
- General Physics & Mathematics (AREA)
- Chemical & Material Sciences (AREA)
- Biochemistry (AREA)
- Life Sciences & Earth Sciences (AREA)
- General Health & Medical Sciences (AREA)
- Nuclear Medicine, Radiotherapy & Molecular Imaging (AREA)
- Immunology (AREA)
- Pathology (AREA)
- Optics & Photonics (AREA)
- Investigating, Analyzing Materials By Fluorescence Or Luminescence (AREA)
- Microscoopes, Condenser (AREA)
Abstract
It is provided a method for enhancing the photoresistance of a fluorescent species when used in fluorescence microscopy of a sample (2) containing several molecules of the fluorescent species according to a fluorescence microscopy technique, the method comprising illuminating at least partially the sample with an exciting light beam (4) and illuminating at least partially the same region of the sample with an enhancing light beam (6).It is also provided a fluorescence microscopy system (1) suitable to implement the above method.
Description
- The invention relates to the technical field of fluorescence microscopy.
- More precisely the invention relates to a method for enhancing the photoresistance of a fluorescent species, and fluorescence microscopy system suitable for implementing said method.
- It is concerned with the reduction of the photobleaching of fluorescent labels during the observation of samples by means of fluorescence microscopy.
- Fluorescence microscopy is a method for observing a sample, in which the sample emits fluorescence upon being illuminated with an external light source of appropriate wavelength. To obtain the fluorescence, the sample may be coupled to (or labelled, or tagged with) fluorescent species (or fluorophores, or fluorochromes). Fluorophores may for instance be organic molecules, proteins, or nanoparticles able to emit light as a result of an excitation by an external illumination.
- As shown on
figure 1 , fluorescence occurs when a fluorophore, initially in a ground state A, is excited into a singlet excited state B by way of an absorption of photons from an exciting illumination having a wavelength in an absorption band of the fluorophore. The fluorophore then relaxes back to the initial ground state A by an emission F of fluorescence light and by heat dissipation, or transits into a long-lived triplet excited state C via a phenomenon called intersystem crossing (ISC). The long-lived triplet excited state can either - relax back into the ground state A,
- transit into a photobleached state E (the fluorophore is thus degraded into a photoproduct), or
- be re-excited by absorption of photons into a higher lying triplet excited state D, from which the fluorophore can either be restored via reverse intersystem crossing (RISC) to the singlet excited state B or degrade to photoproduct(s) (photobleached state E).
- A photobleached state is an irreversible non-fluorescent state of the fluorophore, from which it is not possible to return to the initial fluorescent state neither spontaneously nor by the effect of a light excitation.,
- For instance, fluorescent species such as organic fluorophores and fluorescent proteins degrade into photoproducts after typically 105 excitationemission cycles which for a molar absorption coefficient of the fluorophore of 100 000 mol-1.L.cm-1 and an excitation intensity of 1 W.cm-2 at 500 nm leads to the extinction of the fluorophore in about 100 seconds.
- Photobleaching results from the gradual extinction of all fluorophores in the sample, by transition from their fluorescent state to photobleached states. The fluorescence signal decay as a function of time may be characterized by measuring the fluorescence half-life defined as the characteristic time at which the fluorescence signal is equal to half of the initial fluorescence signal.
- Photobleaching concerns all fluorophores and fluorescence imaging techniques and leads to various problems. It limits the duration and/or the time resolution of the experiments, which hinders the proper monitoring of biological dynamics. It limits the number of photons emitted by the fluorophores, which degrades the image quality. It complicates the quantitative analysis of fluorescence variations. In addition, photobleached fluorophore states may be damaging to the sample under study and contribute to phototoxicity.
- Several solutions exist to reduce photobleaching. For instance, it is possible to remove oxygen from the sample to avoid the formation of singlet oxygen by interaction of oxygen with the triplet state of the fluorophore. This is usually done by means of enzymes added to the cell culture medium, which reduce oxygen to water, as described in the scientific publications " Mechanochemical coupling in actomyosin energy transduction studied by in vitro movement assay", Harada et al., J. Mol. Biol. 1990, 216, 49 and " Oxyrase cell membrane preparations simplify cultivation of anaerobic bacteria", Thurston et al., Lab. Med. 2000, 31, 509 ".
- Another existing solution consists in quenching the triplet state of the fluorescent species by means of electron transfer reactions (reduction followed by oxidation, or vice versa). This strategy uses mixtures of reductants and oxidants, such as Trolox or the ROXS system (1 mM ascorbic acid + 1 mM methylviologen), a description of which may be found in the scientific publications " Nonblinking and long-lasting single-molecule fluorescence imaging", Rasnik et al., Nat. " and " A reducing and oxidizing system minimizes photobleaching and blinking of fluorescent dyes", Vogelsang et al., Angew. Chem. Int. Ed. 2008, 47, 5465 ". It requires cell fixation and oxygen removal.
- A third strategy can be used to specifically reduce the photobleaching of green fluorescent proteins. Based on the observation that their photobleaching is accelerated in presence of biologically relevant electron acceptors such as flavins, cell culture media were developed which lack riboflavin and pyridoxal. Such culture media are described in the scientific publications " Cell culture medium affects GFP photostability: a solution", Bogdanov et al., Nat. Methods 2009, 6, 859", " Anti-fading media for live cell GFP imaging", Bogdanov et al., Plos One 2012, 7, e53004 " and " Influence of cell growth conditions and medium composition on EGFP photostability in live cells", Mamontova et al., BioTechniques 2015, 58, 258 "
- Hence, existing anti-photobleaching technologies are based on chemically modifying the sample environment. They require time-consuming preparations before imaging and they have side effects on cell physiology which preclude their use for long-term experiments on live cells, as well as the long-term culture of cells in the media used for imaging. Each single product is compatible with only a limited number of fluorophores and biological samples. Moreover, while changing the environment can be a solution for cell cultures or microorganisms, it is not easily applicable to visualize cells in a tissue or in a multicellular organism, where diffusion of the chemicals limits the efficiency of this approach.
- One object of the invention is to provide a method for microscopic fluorescence imaging, a method for implementing said method, and a corresponding fluorescence microscopy system which enhance the photoresistance of the used fluorescent species, i.e. slow down the photobleaching of the fluorescent species, without chemically altering the sample environment nor requiring any specific sample preparation.
- According to an aspect of the invention, it is provided a method for enhancing the photoresistance of a fluorescent species observed by fluorescence microscopy in a sample containing several molecules of the fluorescent species according to a fluorescence microscopy technique, the method comprising:
- illuminating at least a region of the sample with an exciting light beam at an exciting wavelength λe being in an absorption band of the fluorescent species, with a given exciting intensity Ie according to the fluorescence microscopy technique,
- and illuminating at least partially the same region of the sample with an enhancing light beam with an enhancing intensity I+ and an enhancing wavelength λ+ where:
- the enhancing intensity I+ is equal to or higher than the exciting intensity Ie;
- the enhancing wavelength λ+ is higher than the exciting wavelength λe,
- the enhancing wavelength is chosen so that the ratio R(λ) = [Q1+2(λ)-Q2(λ)]/Q1 is higher than 1+(Rmax-1)/2 where:
- Rmax is the maximum value of R(λ),
- Q1 is the quantity of fluorescence light emitted by the fluorescent species during an illumination period Pi when illuminated by the sole exciting illumination at the exciting illumination wavelength λe with the exciting intensity le;
- Q2(λ) is the quantity of fluorescence light emitted by the fluorescent species during the illumination period Pi when illuminated by the sole enhancing illumination with a wavelength λ, at the enhancing intensity I+;
- Q1+2(λ) is the quantity of fluorescence light emitted by the fluorescent species during the illumination period Pi when illuminated by both the enhancing illumination with wavelength λ and the enhancing intensity I+ and the exciting illumination with the exciting wavelength λe and the exciting intensity le.
- In the context of the invention, the term "absorption band" should be understood as an about 50 nm wavelength interval centered on a peak absorption value, the peak absorption value being a wavelength value for which the absorption reaches a maximum for the considered fluorescent species. A fluorescent species may have more than one absorption peak, and therefore more than one absorption band.
- In the context of the invention, the intensity should be understood as the irradiance, or power density, that is to say the power received by a surface per unit area.
- In the context of the invention, Rmax is the maximum value of the ratio R(λ) for an optimum enhancing wavelength value.
- Thanks to the enhancing illumination, the transient state is depleted and the transition of the fluorescent species into the photobleached state is delayed. Consequently, the photostability, or photoresistance of the fluorescent species is increased and the photobleaching is slowed down. Reducing the photobleaching rate allows the study of samples for longer periods of time and with a better time resolution, and enhances the quality of the recorded images.
- According to an embodiment of the invention, the enhancing wavelength λ+ is an optimum enhancing wavelength chosen so as to maximize the ratio R(λ).
- According to an embodiment of the invention, the enhancing illumination is conducted at an optimum enhancing intensity which is the smallest value of the enhancing intensity I+ respecting R'(2I) ≤ αR'(I) where:
- a is inferior or equal to 2, preferably inferior or equal to 1.5 and more preferably equal to 1.1.
- R'(I) = (Q'1+2(I)- Q'2(I))/Q1 where:
- Q'2(I) is the quantity of fluorescence light emitted by the fluorescent species during the illumination period Pi when illuminated by the sole enhancing illumination with the enhancing wavelength λ+ and with an intensity I superior to the exciting intensity Ie,
- Q'1+2(I) is the quantity of fluorescence light emitted by the fluorescent species during the illumination period Pi when illuminated by both the enhancing illumination with the enhancing wavelength λ+ and intensity I and the exciting illumination with the exciting wavelength λe and the exciting intensity le.
- According to an embodiment, the illumination period Pi is superior to the half-life period P1/2 of the fluorescent species when illuminated by the sole exciting illumination, preferably superior to 3 times the half-life period P1/2, and more preferably to 10 times the half-life period P1/2.
- According to an embodiment of the invention, the illumination period Pi is superior to 1 second.
- According to an embodiment, the exciting intensity Ie is inferior or equal to 1000 W.cm-2 and preferably inferior to 100 W.cm-2.
- According to an embodiment, the enhancing intensity I+ respects the relation: 3Ie ≤ I+ ≤ 100 Ie.
- According to an embodiment, the enhancing wavelength λ+ is chosen in the near infrared, preferably the enhancing wavelength λ+ is between 700 nm and 1000 nm.
- An enhancing wavelength in the near infrared, and preferably between 700 and 1000 nm, advantageously leads to a higher value of the ratio R(λ) and a slower photobleaching of fluorescent proteins. In addition, near infrared illumination is less phototoxic than ultraviolet-visible illumination and has a higher penetration depth in biological samples than ultraviolet-visible light.
- According to an embodiment, the exciting and enhancing illuminations are continuous illuminations.
- According to an embodiment, the exciting and enhancing illuminations are conducted simultaneously.
- According to an embodiment, the illuminations are time-modulated illuminations.
- According to an embodiment, the fluorescent species is a fluorescent protein, the enhancing illumination wavelength λ+ is in the near infrared, the exciting intensity Ie is inferior or equal to 100 W.cm-2, the enhancing intensity I+ is respecting the relation 3Ie ≤ I+ ≤ 100Ie
- According to another aspect of the invention, it is provided a method for implementing the method according to the invention on a fluorescence microscopy system implementing the fluorescence microscopy technique, the system comprising an illumination system able to deliver at least two light beams in a same illumination region which each wavelength may be chosen among n different illumination wavelengths λk and each intensity is lower or equal to a maximum intensity Imax(λk) reachable by the illumination system for the n illumination wavelengths λk, the method comprising:
- illuminating a region of a sample containing several molecules of the fluorescent species with an exciting light beam at an exciting wavelength λe being both in an absorption band of the fluorescent species and among the n different illumination wavelengths λk, with a given exciting intensity Ie according to the fluorescence microscopy technique and measuring the quantity Q1 of fluorescence light emitted by the fluorescent species during an illumination period Pi,
- determining the wavelength for an enhancing illumination as the enhancing wavelength λ+ which:
- is higher than the exciting wavelength λe and among the n illumination wavelengths λk;
- maximizes the ratio R = [Q1+2(A)- Q2(λ)]/Q1 where:
- Q2(λ) is the quantity of fluorescence light emitted by the fluorescent species during the illumination period Pi when illuminated by the sole enhancing illumination with a wavelength λ among the n illumination wavelengths λk, with a first intensity I1 equal or superior to the exciting intensity Ie and lower than the minimum of the maximum intensities Imax(λk);
- Q1+2(λ) is the quantity of fluorescence light emitted by the fluorescent species during the illumination period Pi when illuminated by both the enhancing illumination with wavelength λ and the first intensity I1 and the exciting illumination with the exciting wavelength λe and the exciting intensity Ie;
- setting the system so that when using the fluorescent species the illumination system delivers at least:
- an exciting beam having the exciting wavelength λe and the exciting intensity le;
- an enhancing beam having the enhancing wavelength λ+ and the maximum enhancing intensity Imax(λ+) reachable for the enhancing wavelength λ+.
- According to an embodiment, the method further comprises choosing an optimum enhancing intensity as the smallest value of the enhancing intensity I+ respecting R'(2I) ≤ αR'(I) where:
- a is inferior or equal to 2, preferably inferior or equal to 1.5 and more preferably equal to 1.1.
- R'(I) = (Q'1+2(I)- Q'2(I))/Q1 where:
- Q'2(I) is the quantity of fluorescence light emitted by the fluorescent species during the illumination period Pi when illuminated by the sole enhancing illumination with the enhancing wavelength λ+ and with an intensity I superior to the exciting intensity le and lower to Imax(λ+),
- Q'1+2(I) is the quantity of fluorescence light emitted by the fluorescent species during the illumination period Pi when illuminated by both the enhancing illumination with the enhancing wavelength λ+ and intensity I and the exciting illumination with the exciting wavelength λe and the exciting intensity le;
- setting the system so that the illumination system delivers at least:
- an exciting beam having the exciting wavelength λe and the exciting intensity le;
- an enhancing beam having the enhancing wavelength λ+ and the optimum enhancing intensity.
- According to an embodiment, the first intensity I1 respects the relation le ≤ I1 ≤ 3Ie and preferably equals 3Ie.
- According to another aspect of the invention, it is provided a fluorescence microscopy system suitable for implementing the methods according to the invention, the system comprising an illumination system able to deliver in a same region at least:
- an exciting beam having the exciting wavelength λe and the exciting intensity Ie;
- an enhancing beam having the enhancing wavelength λ+ and the enhancing intensity I+.
- According to an embodiment, the illumination system comprises at least two light sources, one being a tunable light source able to deliver an enhancing illumination with an enhancing wavelength λ+ tunable between at least 700 nm and 1000 nm and an enhancing intensity I+ tunable between at least 20 W.cm-2 and 10 kW.cm-2.
- The following description with reference to the accompanying drawings will make it clear what the invention consists of and how it can be achieved. The invention is not limited to the embodiments illustrated in the drawings. Accordingly, it should be understood that where features mentioned in the claims are followed by reference signs, such signs are included solely for the purpose of enhancing the intelligibility of the claims and are in no way limiting on the scope of the claims.
- In the accompanying drawings:
-
Figure 1 , previously described, shows the mechanism of fluorescence emission by a fluorescent species excited with an excitation light, -
figure 2 is a schematic illustration of a fluorescence microscopy system suitable for implementing the enhancing method according to the invention, -
figure 3 shows an observation area of the fluorescence microscopy system offigure 2 , -
figure 4 shows the influence of the enhancing wavelength on the fluorescence of a fluorescent species, -
figure 5 shows the influence of the enhancing intensity on the fluorescence of the fluorescent species, -
figure 6 shows the evolution of instant fluorescence of the fluorescent species, when exposed to the exciting illumination, and when exposed to the exciting illumination and the enhancing illumination, following an embodiment of the method according to the invention, -
figure 7 shows the evolution of instant fluorescence of a biological sample labelled with the fluorescent species, when exposed to the exciting illumination, and when exposed to the exciting illumination and the enhancing illumination, following an embodiment of the method according to the invention, -
figure 8 shows micrographs illustrating the evolution of instant fluorescence of the embodiment offigure 7 , -
figure 9 shows the evolution of instant fluorescence of another biological sample labelled with the fluorescent species, when exposed to the exciting illumination and when exposed to the exciting illumination and the enhancing illumination, following an embodiment of the method according to the invention, -
figure 10 shows the evolution of instant fluorescence of another biological sample labelled with the fluorescent species, when exposed to the exciting illumination and when exposed to the exciting illumination and the enhancing illumination, following another embodiment of the method according to the invention, - As explained before, the invention aims at slowing down the photobleaching of a fluorescent species when used in fluorescence microscopy, by illuminating the observed sample with both an exciting beam and an enhancing beam.
- In order to do so, it may be used a fluorescence microscopy system 1 for microscopic imaging of a
sample 2 as shown onfigure 2 . This system 1 comprises a firstlight source 3 configured to perform an exciting illumination by emitting anexciting beam 4 having an exciting wavelength λe and a secondlight source 5 configured to perform an enhancing illumination by emitting an enhancing beam 6 having an enhancing wavelength λ+. - In this embodiment, the system 1 is a wide-field fluorescence microscope comprising the first
light source 3 able to deliver theexciting beam 4 having the exciting wavelength selected among n wavelengths λk comprised for example between 380 nm and 650 nm. For example, the first light source is able to deliver an exciting beam at n=10 different wavelengths being: 390 nm or 438 nm or 475 nm or 480 nm or 513 nm or 549 nm or 560 nm or 570 nm or 575 nm or 632 nm. For each wavelength the first light source is able to deliver a light beam having an exciting intensity le lower than or equal to a maximum intensity Imax(λk) which is different for each of the n wavelengths λk. - For instance here, the first
light source 3 comprises ten light-emitting diodes (LED) 31 one only being shown on the figure. Each LED is configured to deliver abeam 32 collimated by alens 7 and filtered by anexcitation filter 8 in order to form theexciting beam 4. Theexciting beam 4 is focused by alens 33 and directed toward thesample 2 thanks to a firstdichroic mirror 9 configured to reflect theexciting beam 4. - In the present example, the second
light source 5 is a laser source, here a tunable laser source, able to deliver the enhancing beam having the enhancing wavelength continuously tunable between 700 nm and 1000 nm and an enhancing intensity I+ comprised between 20 W.cm-2 and 10000 W.cm-2. - The enhancing beam 6 is directed toward the
sample 2 after a first reflection on aconventional mirror 10, focusing bylens 34 and a second reflection on a seconddichroic mirror 11 configured to reflect the enhancing beam 6 and to transmit theexciting beam 4. In this example, theexciting beam 4 passes through the seconddichroic mirror 11 after reflection on the firstdichroic mirror 9. - The purpose of
lenses exciting beam 4 and the enhancing beam 6 in the rear focal plane of the objective 13 so as to obtain parallel beams at the exit of the objective for wide-field illumination of thesample 2. The objective also collects the fluorescence signal emitted by thesample 2 and collimates it into afluorescence beam 14. Anemission filter 15 is configured to filter the fluorescence beam and asecond lens 16 is configured to focus the filtered fluorescence beam on aCCD camera 17. - The camera is part of a measurement module 26 configured to measure the quantity Q of fluorescence light emitted by the fluorescent species, and comprising a processing module configured to normalize the measured signal and to perform operation on the measured signal or on the normalized measured signal, as explained below.
- The system further comprises an observation area configured to receive the sample 2 (
figure 3 ). For instance, thesample 2 is arranged on aglass coverslip 18 held on the observation area and placed in the path of theexciting beam 4 and in the path of the enhancing beam 6 so that at least a portion of the sample is illuminated by both theexciting beam 4 and the enhancing beam 6. The system 1 is therefore configured to illuminate thesample 2, for instance continuously, with both thefirst light 4 and the second light 6. - The inventors had the merit to demonstrate that it is possible to enhance the photoresistance of the fluorescent species by illuminating the
sample 2 with anexcitation beam 4 and an enhancing beam 6. This double illumination with the exciting and the enhancing beams allows longer observation periods than the ones achieved with the sole exciting illumination at a same intensity in both cases. - Thereafter will be disclosed a method for determining the suitable wavelengths and the suitable intensities of the
light beams 4, 6, in which the above-described system 1 for fluorescence microscopy is used for observing thesample 2 being labelled with a chosen fluorescent species. Thesample 2 may be labelled using any labelling method known in the art, and the man skilled in the art knows how to choose the appropriate method according to the considered application and the used fluorescent species. - As shown on
figure 3 , the system 1 is configured to deliver theexciting beam 4 as a wide field illumination which creates a first illuminated area orregion 19. The system 1 is further configured to deliver the enhancing beam creating a secondilluminated area 20, smaller than the first illuminatedarea 19 and comprised in the first illuminatedarea 19. Preferably, each of the illuminated areas should cover a surface of at least 2×10⁻³ mm2. For instance here, the first illuminated area covers a circular surface having a diameter of 200 µm and the second illuminated area covers a circular surface having a diameter of 50 µm. - The
sample 2 is illuminated with theexciting light beam 4 at an exciting wavelength λe selected among the n different illumination wavelengths λk so as to be in an absorption band of the fluorescent species, in order to trigger a fluorescence emission by the fluorescent species. For instance, the exciting wavelength λe is selected among the n wavelengths λk to be the closest from the absorption peak of the fluorescent species. Those skilled in the art know how to choose the appropriate value for the exciting wavelength as many databases disclose this information which is also given by the providers of fluorescent species. - The exciting wavelength λe value is preferably selected within a range of about 50 nm centered around the maximum absorption value.
- The exciting intensity Ie is set according to the fluorescence microscopy technique (epifluorescence microscopy, confocal microscopy, etc). Those skilled in the art know how to choose the exciting intensity. For instance, in wide-field microscopy the exciting intensity Ie is typically less than 10 W.cm-2, while in laser scanning confocal microscopy the exciting intensity Ie is typically higher than 1 kW.cm-2.
- As a first example of implementation the fluorophore is the Enhanced Green Fluorescent Protein (EGFP) embedded in a polyacrylamide gel. The absorption peak of the EGFP is known as being 488 nm, therefore the exciting wavelength is selected at 480 nm which is the wavelength nearest to the absorption peak among those available in the system 1. The implementation is conducted using wide field illumination with an exciting intensity of 32 W.cm-2.
- The exciting wavelength λe and the exciting intensity Ie being set, the best setting for the enhancing beam 6 has to be determined. The enhancing beam 6 should be configured to be absorbed by the fluorescent species so as to trigger a transition of the fluorescent species from the transient state back into the initial state. It is advantageous to first configure the enhancing wavelength λ+ namely the wavelength within the range of available wavelengths which has the enhancing effect demonstrated by the inventors. Once this enhancing wavelength is identified, it may be advantageous to optimise the enhancing intensity I+ in order to limit the light received by the sample and hence the possible side effects of the enhancing illumination. At first for determining the enhancing wavelength, an arbitrary predetermined enhancing intensity value may be selected during the configuration of the enhancing wavelength, and preferably a low enhancing intensity value. Here, the arbitrary enhancing intensity value is set to 20 W.cm-2.
- Thus, in a first step of the method, the quantity Q of fluorescence light emitted by the fluorescent species, as a function of the enhancing wavelength λ+, during the illumination period Pi is measured.
- The quantity Q of fluorescence light should be understood here as the integral, as a function of time, of a signal S(λ, t) representative of the instant fluorescence emitted by the fluorescent species during the illumination period Pi. Therefore, the quantity of fluorescence light Q is:

- The enhancing wavelength λ+ value should be selected as enhancing the photoresistance of the fluorescent species, that is to say it should be selected so as to maximize the quantity of fluorescence triggered by the exciting illumination only in presence of the enhancing illumination during the illumination period Pi. Therefore, although the method concerns a double illumination with the exciting illumination and the enhancing illumination, the fluorescence that may be triggered directly by the enhancing illumination should not be considered.
- Thus, a comparison is performed between
- a measurement of a first quantity Q1 of fluorescence light emitted by the fluorescent species illuminated with the exciting beam only (in the
first illumination area 19 and outside thesecond illumination area 20. It is the fluorescence triggered by the exciting illumination only in absence of the enhancing illumination) during an illumination period Pi, - a measurement of a second quantity of fluorescence light Q2 emitted by the fluorescent species illuminated with the enhancing beam 6 only (fluorescence triggered by the enhancing beam only) during a same illumination period Pi, and
- a measurement of a quantity Q1+2 of fluorescence light emitted by the fluorescent species illuminated with both the
exciting beam 4 and the enhancing beam 6 (in thesecond illumination area 20. It is the fluorescence triggered by the exciting illumination and by the enhancing illumination) during the illumination period Pi. - This comparison is quantified as the ratio: R(λ+) = (Q1+2(λ+)-Q2(λ+))/Q1.The ratio R is studied for all the available values of the enhancing wavelength λ+.
- To this end, several measurements of the instant fluorescence emitted by the fluorescent species as a function of time with both the
exciting beam 4 and the enhancing beam 6, or with only one of thebeams 4, 6, are performed. Since the photobleached state is irreversible, two distinct measurements may not be performed on the same location of thesample 2. -
Figure 4 shows the evolution of the value of the ratio R(λ+) as a function of the enhancing wavelength λ+, for a predetermined enhancing intensity I+ value. - For instance, it is retained an optimum enhancing wavelength λ+ value for which the fluorescence enhancement is at least half of its maximum value, , i.e. an enhancing wavelength value for which R(λ+)>1+(Rmax(λ+)-1)/2, where Rmax(λ+) is the maximum value of R for the predetermined enhancing intensity value.
- In the context of the invention, the term "fluorescence enhancement" should be understood as the difference between the number of photons emitted in presence of both the exciting and enhancing illumination and the number of photons emitted in presence of the exciting illumination only.
- More preferably, it is retained the optimum enhancing wavelength value for which R(λ+) = Rmax(λ+). Here, as apparent on
figure 4 , the optimum enhancing wavelength λ+ value is equal to 900 nm. - Once the optimum enhancing wavelength is determined and set, it is advantageous to determine an optimum enhancing intensity I+ in relation with said optimum enhancing wavelength λ+ value previously determined.
- In order to do so, the value of the ratio R'(I+) = (Q'1+2(I+)-Q'2(I+))/Q'1 is studied for all the available values of the enhancing intensity I+ (which depend on the configuration of the system). Preferably, the enhancing intensity is limited to values higher than the exciting intensity Ie. For instance, the enhancing intensity is limited to values respecting 3Ie ≤ I+ ≤ 100Ie.
-
Figure 5 shows the evolution of the value of the ratio R'(I+) as a function of the values of the enhancing intensity I+. - It may be observed that the value of the ratio R'(I+) increases with the enhancing intensity I+. In order to limit sample illumination and any side effect that might arise from it, choosing the maximum available value for the enhancing intensity I+ may however not always be the best choice.
- Since the value of the ratio R'(I+) forms a plateau above a certain value of the enhancing intensity, further increasing the enhancing intensity is not advantageous. It is preferable to choose a minimum enhancing intensity value leading to a ratio R'(I+) belonging to the stage.
- To this end, the optimum enhancing intensity I+ is chosen so as to respect R'(2I+) ≤ aR'(I+), where
- a is equal to 1.1,
- R'(I) = (Q'1+2(I)-Q'2(I))/Q1 where:
- Q'2(I) is the quantity of fluorescence light emitted by the fluorescent species during the illumination period Pi when illuminated by the sole enhancing illumination with the enhancing wavelength λ+ and with an intensity I superior to the exciting intensity Ie,
- Q'1+2(I) is the quantity of fluorescence light emitted by the fluorescent species during the illumination period Pi when illuminated by both the enhancing illumination with the enhancing wavelength λ+ and the enhancing intensity I and the exciting illumination with the exciting wavelength λe and the exciting intensity Ie. Then, the system 1 is set so that the first
light source 3 delivers theexciting beam 4 having the exciting wavelength λe and the exciting intensity Ie, and so that the secondlight source 5 delivers the enhancing beam 6 having the enhancing wavelength λ+, for instance the optimum enhancing wavelength, and the optimum enhancing intensity I+. - Here, the selected enhancing intensity is equal to 2 kW.cm-2 and R(I+) = 3.5.
- Once the enhancing wavelength λ+ value and the enhancing intensity I+ value have been determined for a specific fluorescent species (here, EGFP), they may be used in order to enhance the photoresistance of this fluorescent species, for instance in a microscopy experiment that involves a sample labelled with this fluorescent species or for any type of experimentation, observation or measurement which may be conducted with this specific fluorescent species.
- The effect of the enhancing illumination demonstrated by the inventors, is evidenced by the study of the ratio R as disclosed before but this is not the only way to evidence it. For instance,
figure 6 shows the evolution of the normalized measured signal in an embodiment of a method for enhancing the photoresistance of a fluorescent species according to the invention, here EGFP embedded in a polyacrylamide gel. In this embodiment, the intensities and wavelength values are those determined previously in the determination method described in connection tofigures 4 and5 (Ie = 32 W.cm-2, λe = 480 nm, I+ = 2000 W.cm-2, λ+ = 900 nm). - On
figure 6 , afirst curve 21 shows the evolution of the normalized measured signal S(t), (normalized to 1 at t=0, although any normalization may be employed) representative of the instant fluorescence emission triggered by the exciting illumination only, as a function of time, and asecond curve 22 shows the evolution of the normalized measured signal S(t) representative of the instant fluorescence emission triggered by both the exciting illumination and the enhancing illumination. - It is apparent on
figure 6 that the half-life P1/2 of the fluorescence signal S(t) without the enhancing illumination (curve 21) is about 100 s and that the half-life P'1/2 of the fluorescence signal S(t) with both the exciting illumination and the enhancing illumination (curve 22) is about 300 s. Therefore, ratio P'1/2/P1/2 of the half-lives with and without the enhancing illumination is equal to 3, in the above-mentioned conditions. - Those values of the half-life ratio P'1/2/P1/2 are a consequence of an increase in the fluorophore photoresistance and a slowed down photobleaching due to the double illumination of the fluorophore. It is therefore possible to acquire fluorescence data over a longer period.
- The above-described embodiment applies to the determination of the enhancing wavelength λ+ and the enhancing intensity I+ of the EGFP. However, the determination method may apply to any other fluorophore.
- Moreover, in the above-described example, the fluorophore was embedded in a polyacrylamide gel. However, the invention is not limited to fluorescent species embedded in polyacrylamide gel and the advantageous effects provided by the invention may be obtained with fluorescent species coupled to any suitable support, for instance biological samples such as bacteria or eukaryotic cells.
- As a demonstration of the relevance of the invention for enhancing the photoresistance of fluorophores in biological samples,
Figures 7 to 10 show the results of the implementation of the method in several biological samples. - The
figures 7 and 8 show the results of the implementation of the invention with fixed eukaryotic cells, namely HeLa cells labelled with cytoplasmic EGFP. - For this implementation, the exciting wavelength λe is equal to 480 nm, the exciting intensity Ie is equal to 32 W.cm-2, the enhancing wavelength λ+ is equal to 900 nm and the enhancing intensity I+ is equal to 2 kW.cm-2.
- It is apparent on
figure 7 that the half-life P1/2 of the normalized fluorescence signal S(t) in the presence of the exciting illumination only (curve 21) is about 50 s and that the half-life P'1/2 of the normalized fluorescence signal S(t) in the presence of both the exciting illumination and enhancing illumination (curve 22) is about 225 s. Therefore, the half-lives ratio P'1/2/P1/2 is equal to 4.5 in the above-mentioned conditions. -
Figure 8 shows three micrographs captured during the execution of the embodiment described in connection tofigure 7 . A first micrograph is taken at an instant t=0, a second micrograph is taken at an instant t= 80 s, and a third micrograph is taken at an instant t = 240 s. The scale bars located on the bottom right of each micrograph are 20 µm long. In order to show the effect of the double illumination, thebeams 4 and 6 are delivered according to the configuration offigure 3 . - On each micrograph, the bright spots are
HeLa cells 23 labelled with cytoplasmic EGFP and emitting fluorescence. All the cells are illuminated with the exciting beam (wide field illumination) and the cells located in the second illuminated area 20 (represented by a dotted circle) are illuminated by both theexciting beam 4 and the enhancing beam 6. - It is clear on
figure 8 that the fluorescence of the cell in the second illuminated area decreases slower than the fluorescence of the cells outside the second illuminatedarea 20. After a period of 240 s, only the cell located in the second illuminatedarea 20 still emits fluorescence, the other cells being totally photobleached. -
Figure 9 shows the results of the implementation of the invention with another sample of fixed eukaryotic cells, here U2OS cells, labelled with cytoplasmic EGFP. - In this example, the exciting wavelength λe is equal to 480 nm, the exciting intensity Ie is equal to 32 W.cm-2, the enhancing wavelength λ+ is equal to 900 nm and the enhancing intensity I+ is equal to 125 W.cm-2.
- It is apparent on
figure 9 that the half-life P1/2 of the normalized fluorescence signal S(t) in the presence of the exciting illumination only (curve 21) is about 60 seconds and that the half-life P'1/2 of the normalized fluorescence signal S(t) in the presence of both the exciting illumination and the enhancing illumination (curve 22) is 200 seconds. -
Figure 10 shows the results of the implementation of the invention with a sample of live bacteria, here Escherichia coli BL21 bacteria placed on a PBS-agarose pad (Phosphate-Buffered Saline agarose pad) and labelled with EGFP. - In this example, the exciting wavelength λe is equal to 480 nm, the exciting intensity Ie is equal to 32 W.cm-2, the enhancing wavelength λ+ is equal to 900 nm and the enhancing intensity I+ is equal to 125 W.cm-2.
- It is apparent on
figure 10 that the half-life P1/2 of the normalized fluorescence signal S(t) without the enhancing illumination (curve 21) is about 48 s and that the half-life P'1/2 of the normalized fluorescence signal S(t) with both the exciting illumination and the enhancing illumination (curve 22) is about 132 s. Therefore, the ratio P'1/2/P1/2 of the half-lives with and without the enhancing illumination is equal to 2.8. - The invention is not limited to implementations with the Enhanced Green Fluorescent Protein (EGFP) but may be implemented with other green fluorescent proteins.
- For instance, in an embodiment with live Escherichia coli bacteria labelled with green fluorescent proteins in which the exciting wavelength λe is equal to 480 nm, the exciting intensity Ie is equal to 32 W.cm-2, the enhancing wavelength λ+ is equal to 900 nm and the enhancing intensity I+ is equal to 125 W.cm-2,
- the fluorescent protein being the sfGFP (Superfolder Green Fluorescent Protein), the half-lives ratio is equal to 3.1,
- the fluorescent protein being the acGFP (Aequorea Coerulescens Green Fluorescent Protein), the half-lives ratio is equal to 2.8,
- the fluorescent protein being the emGFP (Emerald Green fluorescent Protein), the half-lives ratio is equal to 1.8,
- the fluorescent protein being mClover, the half-lives ratio is equal to 2.6.
- The invention is not limited to green fluorescent proteins but may be implemented with fluorescent proteins of other colours, for instance red or yellow.
- For instance, in an embodiment where the exciting wavelength λe is equal to 480 nm, the exciting intensity Ie is equal to 37 W.cm-2, the enhancing intensity I+ is equal to 125 W.cm-2, and the enhancing wavelength is equal to 900 nm, the fluorescent protein being Venus in live Escherichia coli bacteria, the half-lives ratio is equal to 1.8.
- In another embodiment where the exciting wavelength λe is equal to 480 nm, the exciting intensity Ie is equal to 37 W.cm-2, the enhancing intensity I+ is equal to 125 W.cm-2, and the enhancing wavelength is equal to 900 nm, the fluorescent protein being the EYFP (Enhanced Yellow Fluorescent Protein) in live Escherichia coli bacteria, the half-lives ratio is equal to 1.8.
- In other embodiments with red fluorescent proteins in live Escherichia coli bacteria where the exciting wavelength λe is equal to 560 nm, the exciting intensity Ie is equal to 5.8 W.cm-2, the enhancing wavelength λ+ is equal to 725 nm and the enhancing intensity I+ is equal to 250 W.cm-2,
- the fluorescent protein being mCherry, the half-lives ratio is equal to 13.1,
- the fluorescent protein being mRFP1, the half-lives ratio is equal to 8.3.
- The embodiments described above in connection to
figures 1 to 10 are implemented with fluorophores being fluorescent proteins. However, the invention is not limited to fluorescent proteins and the invention is implementable with other fluorescent species, for instance organic fluorophores such as cyanines, fluoresceins or rhodamines. - The previously described samples are in no way limiting, and the invention may be implemented with other samples. For instance, some embodiments of the invention may use live eukaryotic cells as samples.
- Although the previously described embodiments relate to a continuous illumination, the invention may be performed with different kinds of illumination, for instance a scanning illumination, a pulsed illumination, or a time-modulated illumination. More precisely, the exciting and enhancing illuminations may be of different kind and may be carried out simultaneously or not. In embodiments where at least one illumination is a scanning illumination, the corresponding illuminated area should be understood as an area covered by said scanning illumination.
Claims (17)
- Method for enhancing the photoresistance of a fluorescent species when used in fluorescence microscopy of a sample (2) containing several molecules of the fluorescent species according to a fluorescence microscopy technique, the method comprising:- illuminating at least a region of the sample with an exciting light beam (4) at an exciting wavelength λe being in an absorption band of the fluorescent species, with a given exciting intensity Ie according to the fluorescence microscopy technique,- and illuminating at least partially the same region of the sample (2) with an enhancing light beam (6) with an enhancing intensity I+ and an enhancing wavelength λ+ where:- the enhancing intensity I+ is equal to or higher than the exciting intensity (Ie);- the enhancing wavelength λ+ is higher than the exciting wavelength λe,- the enhancing wavelength λ+ is chosen so that the ratio R(λ) = [Q1+2(λ)-Q2(λ)]/Q1 is higher than 1+(Rmax-1)/2 where:- Rmax is the maximum value of the ratio R(λ),- Q1 is the quantity of fluorescence light emitted by the fluorescent species during an illumination period (Pi) when illuminated by the sole exciting illumination at the exciting wavelength (λe) with the exciting intensity (Ie);- Q2(λ) is the quantity of fluorescence light emitted by the fluorescent species during the illumination period (Pi) when illuminated by the sole enhancing illumination with the enhancing wavelength (λ+), at the enhancing intensity (I+) ;- Q1+2(λ) is the quantity of fluorescence light emitted by the fluorescent species during the illumination period Pi when illuminated by both the enhancing illumination with wavelength λ+ and intensity I+ and the exciting illumination with wavelength λe and intensity Ie.
- Method according to claim 1, wherein the enhancing wavelength is an optimum enhancing wavelength chosen so as to maximize the ratio R(λ).
- Method according to any one of the preceding claims, wherein the enhancing illumination is conducted at an optimum enhancing intensity which is the smallest value of the enhancing intensity I+ respecting R'(2I) ≤ αR'(I) where :- a is inferior or equal to 2, preferably inferior or equal to 1.5 and more preferably equal to 1.1.- R'(I) = (Q1+2(I)- Q2(I))/Q1 where :- Q'2(I) is the quantity of fluorescence light emitted by the fluorescent species during the illumination period Pi when illuminated by the sole enhancing illumination with the enhancing wavelength λ+ and with an intensity I superior to the exciting intensity Ie,- Q'1+2(I) is the quantity of fluorescence light emitted by the fluorescent species during the illumination period Pi when illuminated by both the enhancing illumination with the enhancing wavelength λ+ and intensity I and the exciting illumination with the exciting wavelength λe and the exciting intensity Ie;
- Method according to any of the preceding claims, wherein the illumination period Pi is superior to the half-life period P1/2 of the fluorescent species when illuminated by the sole exciting illumination, preferably superior to 3 times the half-life-period P1/2, and more preferably to 10 times the half-life period P1/2.
- Method according to any one of the preceding claims, wherein the illumination period is superior to 1 s.
- Method according to any one of the preceding claims, wherein the exciting intensity Ie is inferior or equal to 1000 W.cm-2 and preferably inferior to 100 W.cm-2.
- Method according to any one of the preceding claims, wherein the enhancing intensity I+ fulfills the relation: 3Ie ≤ I+ ≤ 100 Ie..
- Method according to any one of the preceding claims wherein the enhancing wavelength (λ+) is chosen in the near infrared, preferably the enhancing wavelength λ+ is between 700 nm and 1000 nm.
- Method according to any one of the preceding claims, wherein the exciting and enhancing illuminations are continuous illuminations.
- Method according to any one of the preceding claims, wherein the exciting and enhancing illuminations are conducted simultaneously.
- Method according to any one of the preceding claims, wherein the illuminations are time-modulated illuminations.
- Method according to any one of the preceding claims wherein:- the fluorescent species is a fluorescent protein,- the enhancing illumination wavelength λ+ is in the near infrared,- the exciting intensity Ie is inferior or equal to 100 W.cm-2,- the enhancing intensity I+ fulfills the relation 3Ie ≤ I+ ≤ 100Ie.
- Method for implementing the method according to any one of the preceding claims on a fluorescence microscopy system (1) implementing the fluorescence microscopy technique, the system comprising an illumination system (3, 5) able to deliver at least two light beams (4, 6) in a same illumination region which each wavelength λe and λ+ may be chosen among n different illumination wavelengths λk and each intensity Ie and I+ is lower or equal to the maximum intensity Imax(λk) reachable by the illumination system at wavelength λk, the method comprising:- illuminating a region of a sample (2) containing several molecules of the fluorescent species with an exciting light beam (4) at an exciting wavelength λe being both in an absorption band of the fluorescent species and among the n different illumination wavelengths, with a given intensity Ie according to the fluorescence microscopy technique and measuring the quantity (Q1) of fluorescence light emitted by the fluorescent species during an illumination period Pi,- determining an enhancing wavelength λ+ for an enhancing illumination as the enhancing wavelength λ+ which :- is higher than the exciting wavelength λe and among the n illumination wavelengths;- maximizes the ratio R = [Q1+2(λ)-Q2(λ)]/Q1 where:- Q2(λ) is the quantity of fluorescence light emitted by the fluorescent species during the illumination period Pi when illuminated by the sole enhancing illumination with a wavelength λ among the n illumination wavelengths, with a first intensity I1 equal or superior to the exciting intensity Ie and lower than the minimum of the maximum intensities Imax(λk) for the different λk;- Q1+2(λ) is the quantity of fluorescence light emitted by the fluorescent species during the illumination period Pi when illuminated by both the enhancing illumination with the wavelength λ and the first intensity I1 and the exciting illumination with the exciting wavelength λe and the exciting intensity Ie;- setting the system (1) so that when using the fluorescent species, the illumination system delivers at least:- an exciting beam (4) having the exciting wavelength λe and the exciting intensity Ie;- an enhancing beam (6) having the enhancing wavelength λ+ and the maximum enhancing intensity Imax(λ+) reachable for the enhancing wavelength λ+.
- Method according to claim 13 further comprising choosing an optimum enhancing intensity I+ as the smallest value of the enhancing intensity I+ respecting R'(2I) ≤ αR'(I) where :- a is inferior or equal to 2, preferably inferior or equal to 1.5 and more preferably equal to 1.1.- R'(I) = (Q'1+2(I)-Q2(I))/Q1 where :- Q'2(I) is the quantity of fluorescence light emitted by the fluorescent species during the illumination period Pi when illuminated by the sole enhancing illumination with the enhancing wavelength λ+ and with an intensity I superior to the exciting intensity Ie and lower than Imax(λ+),- Q'1+2(I) is the quantity of fluorescence light emitted by the fluorescent species during the illumination period Pi when illuminated by both the enhancing illumination with enhancing wavelength λ+ and intensity I and the exciting illumination with exciting wavelength λe and exciting intensity Ie;- setting the system (1) so that the illumination system (3, 5) delivers at least:- an exciting beam (4) having the exciting wavelength λe and the exciting intensity Ie;- an enhancing beam (6) having the optimum enhancing wavelength λ+ and the optimum enhancing intensity I+.
- Method according to claim 13 or 14 wherein the first intensity I1 fulfills the relation Ie ≤ I1 ≤ 5le.and preferably equals 3Ie.
- Fluorescence microscopy system suitable for implementing the method according to any of the preceding claims, the system (1) comprising an illumination system (3, 5) able to deliver in a same region at least:- an exciting beam (4) having the exciting wavelength λe and the exciting intensity Ie;- an enhancing beam (6) having the enhancing wavelength λ+ and the enhancing intensity I+.
- Fluorescence microscopy system according to the preceding claim, wherein the illumination system (3, 5) comprises at least two light sources (3, 5), one being a tunable light source (5) able to deliver an enhancing illumination with an enhancing wavelength λ+ tunable between at least 700 nm and 1000 nm and an enhancing intensity I+ tunable between at least 20 W.cm-2 and 10 kW.cm-2.
Priority Applications (5)
| Application Number | Priority Date | Filing Date | Title |
|---|---|---|---|
| EP21305834.0A EP4105643A1 (en) | 2021-06-17 | 2021-06-17 | Method for enhancing the photoresistance of a fluorescent species and fluorescence microscopy system suitable for implementing said method |
| JP2023577856A JP2024529242A (en) | 2021-06-17 | 2022-06-17 | Method for enhancing the photoresistance of fluorescent proteins and a fluorescence microscope system suitable for carrying out said method |
| EP22733462.0A EP4356113A1 (en) | 2021-06-17 | 2022-06-17 | Method for enhancing the photoresistance of a fluorescent protein and fluorescence microscopy system suitable for implementing said method |
| PCT/EP2022/066617 WO2022263661A1 (en) | 2021-06-17 | 2022-06-17 | Method for enhancing the photoresistance of a fluorescent protein and fluorescence microscopy system suitable for implementing said method |
| US18/571,139 US20240288371A1 (en) | 2021-06-17 | 2022-06-17 | Method for enhancing the photoresistance of a fluorescent protein and fluorescence microscopy system suitable for implementing said method |
Applications Claiming Priority (1)
| Application Number | Priority Date | Filing Date | Title |
|---|---|---|---|
| EP21305834.0A EP4105643A1 (en) | 2021-06-17 | 2021-06-17 | Method for enhancing the photoresistance of a fluorescent species and fluorescence microscopy system suitable for implementing said method |
Publications (1)
| Publication Number | Publication Date |
|---|---|
| EP4105643A1 true EP4105643A1 (en) | 2022-12-21 |
Family
ID=76807576
Family Applications (2)
| Application Number | Title | Priority Date | Filing Date |
|---|---|---|---|
| EP21305834.0A Withdrawn EP4105643A1 (en) | 2021-06-17 | 2021-06-17 | Method for enhancing the photoresistance of a fluorescent species and fluorescence microscopy system suitable for implementing said method |
| EP22733462.0A Pending EP4356113A1 (en) | 2021-06-17 | 2022-06-17 | Method for enhancing the photoresistance of a fluorescent protein and fluorescence microscopy system suitable for implementing said method |
Family Applications After (1)
| Application Number | Title | Priority Date | Filing Date |
|---|---|---|---|
| EP22733462.0A Pending EP4356113A1 (en) | 2021-06-17 | 2022-06-17 | Method for enhancing the photoresistance of a fluorescent protein and fluorescence microscopy system suitable for implementing said method |
Country Status (4)
| Country | Link |
|---|---|
| US (1) | US20240288371A1 (en) |
| EP (2) | EP4105643A1 (en) |
| JP (1) | JP2024529242A (en) |
| WO (1) | WO2022263661A1 (en) |
Family Cites Families (4)
| Publication number | Priority date | Publication date | Assignee | Title |
|---|---|---|---|---|
| US6844963B2 (en) * | 2000-03-23 | 2005-01-18 | Olympus Optical Co., Ltd. | Double-resonance-absorption microscope |
| JP2001272347A (en) * | 2000-03-23 | 2001-10-05 | Olympus Optical Co Ltd | Double resonance absorption microscope |
| DE102006011176B4 (en) * | 2006-03-10 | 2008-01-24 | MAX-PLANCK-Gesellschaft zur Förderung der Wissenschaften e.V. | Method and apparatus for spatially high resolution imaging of a structure labeled with a fluorescent dye |
| JPWO2018122905A1 (en) * | 2016-12-26 | 2019-10-31 | 三菱電機エンジニアリング株式会社 | Lighting device |
-
2021
- 2021-06-17 EP EP21305834.0A patent/EP4105643A1/en not_active Withdrawn
-
2022
- 2022-06-17 US US18/571,139 patent/US20240288371A1/en active Pending
- 2022-06-17 JP JP2023577856A patent/JP2024529242A/en active Pending
- 2022-06-17 WO PCT/EP2022/066617 patent/WO2022263661A1/en not_active Ceased
- 2022-06-17 EP EP22733462.0A patent/EP4356113A1/en active Pending
Non-Patent Citations (12)
| Title |
|---|
| BOGDANOV ET AL.: "Anti-fading media for live cell GFP imaging", PLOS ONE, vol. 7, 2012, pages e53004 |
| BOGDANOV ET AL.: "Cell culture medium affects GFP photostability: a solution", NAT. METHODS, vol. 6, 2009, pages 859 |
| CHRIS I. RICHARDS ET AL: "Optically Modulated Fluorophores for Selective Fluorescence Signal Recovery", JOURNAL OF THE AMERICAN CHEMICAL SOCIETY, vol. 131, no. 13, 8 April 2009 (2009-04-08), pages 4619 - 4621, XP055366310, ISSN: 0002-7863, DOI: 10.1021/ja809785s * |
| GISKE ARNOLD: "CryoSTED microscopy A new spectroscopic approach for improving the resolution of STED microscopy using low temperature", 1 January 2007 (2007-01-01), XP055866414, Retrieved from the Internet <URL:http://archiv.ub.uni-heidelberg.de/volltextserver/7969/1/CryoSTED_microscopy_PhDThesis_agiske.pdf> [retrieved on 20211126] * |
| HARADA ET AL.: "Mechanochemical coupling in actomyosin energy transduction studied by in vitro movement assay", J. MOL. BIOL., vol. 216, 1990, pages 49 |
| MAMONTOVA ET AL.: "Influence of cell growth conditions and medium composition on EGFP photostability in live cells", BIOTECHNIQUES, vol. 58, 2015, pages 258 |
| MONDAL PARTHA: "Minimizing photobleaching in fluorescence microscopy by depleting triplet states", APPLIED PHYSICS LETTERS, AMERICAN INSTITUTE OF PHYSICS, 2 HUNTINGTON QUADRANGLE, MELVILLE, NY 11747, vol. 92, no. 1, 7 January 2008 (2008-01-07), pages 13902 - 13902, XP012105770, ISSN: 0003-6951, DOI: 10.1063/1.2830996 * |
| RASNIK ET AL.: "Nonblinking and long-lasting single-molecule fluorescence imaging", NAT. METHODS, vol. 3, 2006, pages 891, XP002505789, DOI: 10.1038//NMETH934 |
| RICHARDS CHRIS I. ET AL: "Synchronously Amplified Fluorescence Image Recovery (SAFIRe)", JOURNAL OF PHYSICAL CHEMISTRY PART B, vol. 114, no. 1, 14 January 2010 (2010-01-14), US, pages 660 - 665, XP055866486, ISSN: 1520-6106, Retrieved from the Internet <URL:https://pubs.acs.org/doi/pdf/10.1021/jp909167j> DOI: 10.1021/jp909167j * |
| RINGEMANN C ET AL: "Enhancing fluorescence brightness: effect of reverse intersystem crossing studied by fluorescence fluctuation spectroscopy", CHEMPHYSCHEM, WILEY - V C H VERLAG GMBH & CO. KGAA, DE, vol. 9, 1 January 2008 (2008-01-01), pages 612 - 624, XP008108392, ISSN: 1439-4235, DOI: 10.1002/CPHC.200700596 * |
| THURSTON ET AL.: "Oxyrase cell membrane preparations simplify cultivation of anaerobic bacteria", LAB. MED., vol. 31, 2000, pages 509 |
| VOGELSANG ET AL.: "A reducing and oxidizing system minimizes photobleaching and blinking of fluorescent dyes", ANGEW. CHEM. INT. ED., vol. 47, 2008, pages 5465, XP002505788, DOI: 10.1002/anie.200801518 |
Also Published As
| Publication number | Publication date |
|---|---|
| JP2024529242A (en) | 2024-08-06 |
| EP4356113A1 (en) | 2024-04-24 |
| US20240288371A1 (en) | 2024-08-29 |
| WO2022263661A1 (en) | 2022-12-22 |
Similar Documents
| Publication | Publication Date | Title |
|---|---|---|
| US11988604B2 (en) | Optical microscopy with phototransformable optical labels | |
| US8174692B2 (en) | High spatial resolution imaging of a structure of interest in a specimen | |
| JP5787257B2 (en) | High spatial resolution imaging of target structures in a sample | |
| Fürstenberg et al. | Single-molecule localization microscopy–near-molecular spatial resolution in light microscopy with photoswitchable fluorophores | |
| Stockhammer et al. | Appreciating the small things in life: STED microscopy in living cells | |
| Halstead et al. | TRICK: a single-molecule method for imaging the first round of translation in living cells and animals | |
| US20240288371A1 (en) | Method for enhancing the photoresistance of a fluorescent protein and fluorescence microscopy system suitable for implementing said method | |
| JP2008083047A (en) | Method for examining structure labeled with by fluorogenic material of specimen at high spatial resolution | |
| Bitzenhofer et al. | Development and characterization of flavin-binding fluorescent proteins, part ii: advanced characterization | |
| Hartwich et al. | Determination of two-photon photoactivation rates of fluorescent proteins | |
| Klementieva et al. | Fluorophores for single-molecule localization microscopy | |
| Jablonski | Optically modulated fluorescent proteins | |
| Gadella et al. | Multi-photon excitation microscopy for advanced biomedical imaging | |
| Chen | Optically controlling dark state lifetimes of photoswitchable fluorescent proteins and Its application to biological systems | |
| Tanke | Imaging of lanthanide luminescence by time-resolved microscopy | |
| Endesfelder | Photoswitching fluorophores in super-Resolution fluorescence microscopy | |
| WO2025227196A1 (en) | Electrochemical fluorescence modulation for multicolour imaging techniques | |
| Zhang | Implementations and applications of Out of Phase Imaging after Optical Modulation (OPIOM) in fluorescence macro-imaging and fluorescence endomicroscopy | |
| Cotlet et al. | Spectroscopy and microscopy of the autofluorescent protein DsRed from Discosoma genus coral | |
| Piston et al. | Photoactivation in fluorescence microscopy | |
| Jacobson | Fluorescence microscopy | |
| Single-Molecule | SUNGCHUL HOHNG AND TAEKJIP HA | |
| Tiwari | Foundations and Structural Applications of Fluorescence Optical Imaging in Biological Systems | |
| Palikaras | Foundation for Research and Technology-Hellas, Heraklion, Crete, Greece Nektarios Tavernarakis, Institute of Molecular Biology and Biotechnology, Foundation for Research and Technology-Hellas, Heraklion, Crete, Greece and Medical School, University of Crete, Heraklion, Crete, Greece | |
| Diaspro et al. | and Jurek Dobrucki |
Legal Events
| Date | Code | Title | Description |
|---|---|---|---|
| PUAI | Public reference made under article 153(3) epc to a published international application that has entered the european phase |
Free format text: ORIGINAL CODE: 0009012 |
|
| STAA | Information on the status of an ep patent application or granted ep patent |
Free format text: STATUS: THE APPLICATION HAS BEEN PUBLISHED |
|
| AK | Designated contracting states |
Kind code of ref document: A1 Designated state(s): AL AT BE BG CH CY CZ DE DK EE ES FI FR GB GR HR HU IE IS IT LI LT LU LV MC MK MT NL NO PL PT RO RS SE SI SK SM TR |
|
| STAA | Information on the status of an ep patent application or granted ep patent |
Free format text: STATUS: THE APPLICATION IS DEEMED TO BE WITHDRAWN |
|
| 18D | Application deemed to be withdrawn |
Effective date: 20230622 |