EP4102456A1 - Calculation program, calculation method, and calculation device - Google Patents
Calculation program, calculation method, and calculation device Download PDFInfo
- Publication number
- EP4102456A1 EP4102456A1 EP22165070.8A EP22165070A EP4102456A1 EP 4102456 A1 EP4102456 A1 EP 4102456A1 EP 22165070 A EP22165070 A EP 22165070A EP 4102456 A1 EP4102456 A1 EP 4102456A1
- Authority
- EP
- European Patent Office
- Prior art keywords
- autoencoder
- distributed representation
- partial image
- feature value
- images
- Prior art date
- Legal status (The legal status is an assumption and is not a legal conclusion. Google has not performed a legal analysis and makes no representation as to the accuracy of the status listed.)
- Pending
Links
Images






Classifications
-
- G—PHYSICS
- G06—COMPUTING OR CALCULATING; COUNTING
- G06T—IMAGE DATA PROCESSING OR GENERATION, IN GENERAL
- G06T7/00—Image analysis
- G06T7/0002—Inspection of images, e.g. flaw detection
- G06T7/0012—Biomedical image inspection
-
- G—PHYSICS
- G06—COMPUTING OR CALCULATING; COUNTING
- G06T—IMAGE DATA PROCESSING OR GENERATION, IN GENERAL
- G06T2207/00—Indexing scheme for image analysis or image enhancement
- G06T2207/10—Image acquisition modality
- G06T2207/10016—Video; Image sequence
-
- G—PHYSICS
- G06—COMPUTING OR CALCULATING; COUNTING
- G06T—IMAGE DATA PROCESSING OR GENERATION, IN GENERAL
- G06T2207/00—Indexing scheme for image analysis or image enhancement
- G06T2207/10—Image acquisition modality
- G06T2207/10132—Ultrasound image
-
- G—PHYSICS
- G06—COMPUTING OR CALCULATING; COUNTING
- G06T—IMAGE DATA PROCESSING OR GENERATION, IN GENERAL
- G06T2207/00—Indexing scheme for image analysis or image enhancement
- G06T2207/20—Special algorithmic details
- G06T2207/20081—Training; Learning
-
- G—PHYSICS
- G06—COMPUTING OR CALCULATING; COUNTING
- G06T—IMAGE DATA PROCESSING OR GENERATION, IN GENERAL
- G06T2207/00—Indexing scheme for image analysis or image enhancement
- G06T2207/20—Special algorithmic details
- G06T2207/20084—Artificial neural networks [ANN]
-
- G—PHYSICS
- G06—COMPUTING OR CALCULATING; COUNTING
- G06T—IMAGE DATA PROCESSING OR GENERATION, IN GENERAL
- G06T2207/00—Indexing scheme for image analysis or image enhancement
- G06T2207/30—Subject of image; Context of image processing
- G06T2207/30004—Biomedical image processing
- G06T2207/30048—Heart; Cardiac
-
- G—PHYSICS
- G06—COMPUTING OR CALCULATING; COUNTING
- G06T—IMAGE DATA PROCESSING OR GENERATION, IN GENERAL
- G06T2207/00—Indexing scheme for image analysis or image enhancement
- G06T2207/30—Subject of image; Context of image processing
- G06T2207/30004—Biomedical image processing
- G06T2207/30101—Blood vessel; Artery; Vein; Vascular
-
- G—PHYSICS
- G06—COMPUTING OR CALCULATING; COUNTING
- G06T—IMAGE DATA PROCESSING OR GENERATION, IN GENERAL
- G06T2207/00—Indexing scheme for image analysis or image enhancement
- G06T2207/30—Subject of image; Context of image processing
- G06T2207/30168—Image quality inspection
Definitions
- the embodiments discussed herein are related to a computer-readable recording medium, a calculation method, and a calculation device.
- An ultrasonic examination for examining the presence or absence of abnormality in an internal structure without destroying an object has been known.
- the ultrasonic examination is performed by capturing an image of a two-dimensional scanned cross-section of an object to be examined, and checking the image of the scanned cross-section.
- the image of the scanned cross-section is strongly affected by a change in the image capturing environment.
- the image of the scanned cross-section which is an ultrasonic examination image, is often checked visually.
- a technology for providing valuable information for diagnosis a technology of generating a three-dimensional model from the scanning results using computed tomography (CT) and magnetic resonance imaging (MRI), and providing information on any cut surface has been known.
- CT computed tomography
- MRI magnetic resonance imaging
- an object detection technology for detecting what kind of object appears in an image has been known.
- a deformable parts model DPM
- YOLO You Only Look Once
- a technology for determining whether abnormality is present in an object in an image, using the results obtained by the object detection technology has been known.
- Such a technology is used in medical diagnosis using ultrasound images, examination of defects in manufactured products, and the like.
- an abnormality determination process using the object detection technology there is a process of using detection map information in which the detection result of each of a plurality of types of feature values and the time series of a plurality of frame images are associated with each of the frame images included in moving image data obtained by capturing images of an object.
- This process determines the presence or absence of abnormality, by calculating a distributed representation indicating a set of points obtained by compressing and projecting the distribution state of the detection results, when the position of a section area with a predetermined width set in the detection map information is changed in time series, onto a low-dimensional space, and from the trajectory of the distributed representation ( Japanese Laid-open Patent Publication No. 2020-028680 ; M. A. Sadeghi and D.
- a calculation program causes a computer to execute a process including: acquiring a first distributed representation of a partial image corresponding to a specific site of an object to be examined included in each of a plurality of images, by executing machine learning performed by an autoencoder using the partial image of an area corresponding to the specific site, for each of one or more specific sites; and acquiring a second distributed representation of the plurality of images, based on the first distributed representation and a result of machine learning performed by the autoencoder, using the plurality of images, wherein abnormality determination on the object to be examined included in an image to be determined is executed, based on the first distributed representation and the second distributed representation.
- FIG. 1 is a diagram illustrating a configuration example of a calculation device 10 according to a first example. As illustrated in FIG. 1 , the calculation device 10 receives data input from a sensor 21. Moreover, the calculation device 10 outputs data to a display 22.
- the calculation device 10 calculates a distributed representation from an image, and determines whether abnormality is present in an object in an image based on the distributed representation.
- the calculation device 10 can calculate a distributed representation from a plurality of images in time series. Such images in time series may be frame images forming moving image data.
- the sensor 21 is a device for acquiring a signal for generating an image in which abnormality is determined.
- the sensor 21 is a probe that emits ultrasonic waves to an object, and that receives reflected waves of the ultrasonic waves.
- the probe may be used for medical examinations and a non-destructive examination of an object.
- the sensor 21 may be a red-green-blue (RGB) camera for capturing an image of an object.
- RGB red-green-blue
- the sensor 21 may input the collected signal to the calculation device 10 as it is, or may input data on an image generated from the signal to the calculation device 10. That is, the calculation device 10 may generate an image based on the signal received from the sensor 21, or may receive an image from the sensor 21.
- the calculation device 10 includes an input unit 11, an output unit 12, a storage unit 13, and a control unit 14.
- the input unit 11 is an interface for data input.
- the input unit 11 receives data input from the sensor 21.
- the input unit 11 may also receive data input via an input device such as a mouse and a keyboard.
- the output unit 12 is an interface for data output.
- the output unit 12 outputs data to an output device such as the display 22.
- the storage unit 13 is an example of a storage device that stores data, a computer program executed by the control unit 14, and the like.
- the storage unit 13 is a hard disk, memory, and the like.
- the storage unit 13 includes detection map information 131, model information 132, and normal image information 133.
- the detection map information 131 is an example of information in which the detection result of each of a plurality of types of feature values and the time series of a plurality of frame images are associated with each of the frame images included in moving image data obtained by capturing images of an object.
- the detection map information 131 is assumed to be a set of xml data corresponding to each of the frame images.
- a plurality of types of feature values may be written in each xml data.
- FIG. 2 is a diagram illustrating an example of detection map information.
- the detection map information 131 is a set of xml data.
- a filename element of the xml data a file path of a corresponding frame image is written.
- the senor 21 may be a probe for medical examinations.
- the detection map information 131 may be a feature value obtained from an ultrasound image.
- the feature value may include probability that is calculated according to the level of likelihood of each site appearing in a frame image, which is set in advance.
- the feature value may also include coordinates of two apexes of a rectangle indicating an area where each site is assumed to appear in a frame image.
- a name element of the xml data the name of the site is written.
- the site information in which the probability is not zero or the probability is equal to or more than a certain value may be written.
- a probability element indicates the probability of the site written in the name element. The probability is increased with an increase in the likelihood of the corresponding site appearing in the frame image.
- An xmin element and a ymin element represent coordinates of an apex of the rectangle.
- an xmax element and a ymax element represent coordinates of an apex that does not share the side with the apex represented by the xmin element and the ymin element. That is, when the coordinates of the two apexes are decided, the position and size of the rectangle are decided.
- the coordinates represented by the xmin element and the ymin element indicate the apex of the rectangle at the upper left.
- the coordinates represented by the xmax element and the ymax element indicate the apex of the rectangle at the lower right.
- An example of the xml data illustrated in FIG. 2 corresponds to a file of a frame image named "frame001.jpg".
- an example of the xml data in FIG. 2 indicates that a site A is present in a rectangular area the apex of which is at a point (384, 219) and a point (517, 362), and that the probability of the site is 0.772151112556.
- an example of xml data in FIG. 2 indicates that a site C is present in a rectangular area the apex of which is at a point (242, 94) and a point (298, 174), and that the probability of the site is 0.101077094674.
- the coordinates may also be expressed in pixel units.
- the model information 132 is information such as a parameter for building a model used for calculating a distributed representation.
- the model is an autoencoder.
- the model information 132 includes a parameter such as weight set for each unit of the autoencoder.
- the normal image information 133 is information on a frame image of an object in a normal state.
- the normal image information 133 may be a frame image, a feature value of the frame image, or distributed representation obtained from the feature value of the frame image.
- the information described above to be stored in the storage unit 13 is merely an example, and the storage unit 13 can store various types of information in addition to the information described above.
- control unit 14 is implemented when a computer program stored in an internal storage device is executed by a central processing unit (CPU), a micro processing unit (MPU), a graphics processing unit (GPU), and the like using random-access memory (RAM) as a work area.
- control unit 14 may also be implemented by an integrated circuit such as an application specific integrated circuit (ASIC) and a field programmable gate array (FPGA).
- ASIC application specific integrated circuit
- FPGA field programmable gate array
- the control unit 14 includes a generation unit 141, a detection unit 142, a setting unit 143, an acquisition unit 144, a calculation unit 145, a determination unit 146, and a display control unit 147.
- Each processing unit is an example of an electronic circuit in a processor or an example of a process executed by a processor.
- the generation unit 141 generates a frame image based on data input from the sensor 21. When a frame image is input from the sensor 21, there is no need for the generation unit 141 to generate a frame image.
- the detection unit 142 extracts a feature value from the frame image, and stores the feature value in the storage unit 13 as the detection map information 131.
- the detection unit 142 detects the feature value including the probability using a detection model already trained with an image of each site.
- the detection model may also be a model that uses an object detection algorithm such as You Only Look Once (YOLO), Single Shot Multibox Detector (SSD), and Faster-Regional Convolutional Neural Network (Faster-RCNN).
- the detection unit 142 detects probability, which is an index corresponding to the level of likelihood of each of a plurality of objects appearing in each of the frame images, which is set in advance.
- the objects correspond to the sites to be detected.
- the detection unit 142 also detects the size and position of a rectangular area in the frame image, in which the likelihood of the presence of an object is equal to or more than a predetermined value.
- FIG. 3 is a diagram illustrating an example of a site detection map according to the first example.
- the site detection map 30 in FIG. 3 is obtained by mapping the probability of each site in time series. That is, the site detection map 30 may be referred to as a two-dimensional map obtained by mapping the detection results on a two-dimensional plane in which the first axis is a plurality of types of feature values, and the second axis is the time series.
- such a drawing is referred to as a Barcode like timeline.
- the Barcode like timeline may also be simply referred to as a timeline.
- FIG. 4 is a diagram for explaining a method of calculating a distributed representation.
- the setting unit 143 sets a section area with a predetermined width in the time series, for the detection map information 131.
- a section area is referred to as a kernel.
- the kernel may also be referred to as a window and the like.
- the detection map information 131 is an example of information in which the detection result of each of the types of feature values and the time series of the frame images are associated with each of the frame images included in moving image data obtained by capturing images of an object.
- the acquisition unit 144 acquires the distribution state of the detection results in the section area, for each of a plurality of positions in the section area, when the position of the set section area is changed in time series.
- the probability and the coordinates of the rectangular area are examples of the distribution state.
- the positions of the section area correspond to each time. That is, the acquisition unit 144 acquires the probability of each site in the frame image corresponding to each time, and the size and position of the rectangular area, from the detection map information 131 as the distribution state.
- the calculation unit 145 calculates the distributed representation indicating a set of points obtained by projecting the distribution state of each of the positions onto a low-dimensional space. As illustrated in FIG. 4 , the calculation unit 145 calculates the distributed representation indicating a set of points projected onto a two-dimensional space, by inputting the distribution state, that is, all the information in the kernel, to an autoencoder 40 in which the intermediate layer is formed by two units.
- the autoencoder 40 is built based on the model information 132.
- the autoencoder 40 includes an input layer 410, an intermediate unit 421, an intermediate unit 422, and an output layer 430.
- the distributed representation is an intermediate feature value output from the intermediate unit 421 and the intermediate unit 422. Then, the display control unit 147 draws the trajectory of distributed representation, by plotting the transition of the intermediate feature values (x, y) of the kernels on a graph.
- the determination unit 146 determines whether the moving image data to be determined is obtained by capturing images of an object in an abnormal state, by comparing the acquired distributed representation and the distributed representation obtained from the moving image data to be determined, which is obtained by capturing images of the object. Moreover, the display control unit 147 displays the trajectory of the points projected onto the two-dimensional space in time series on a screen. In this manner, the abnormal state may be automatically determined by the determination unit 146. Alternatively, abnormality determination, analysis, and the like may also be manually performed by a user who viewed the screen displayed by the display control unit 147.
- the distributed representation of the intermediate state is simultaneously acquired, by gradually processing the Barcode like timeline per site, and per group. Consequently, it is possible to determine which site information is contributing to the distributed representation. Moreover, by fixing the distributed representation vectors corresponding to a sample in the ideal state into one, it is possible to control the acquired distributed representation.
- the sample in the ideal state is information in which all target sites such as blood vessels and the heart appear in an image.
- FIG. 5 is a diagram illustrating an example of a configuration of an autoencoder according to the first example.
- the calculation device 10 acquires the partial intermediate representation of each site, for example, a blood vessel 1 and a blood vessel 2, which are important sites.
- FIG. 6 is a diagram illustrating an example of a partial distributed representation of each site according to the first example. Then, at the time of determination, the calculation device 10 integrates the data on the partial intermediate representation of each site into one, compresses the whole, acquires the entire intermediate representation, and restores the whole. Consequently, it is possible to analyze the site using the partial intermediate representation, and it is possible to analyze the whole heart using the entire intermediate representation.
- a model is built and optimized such that the reconstruction loss, in the example of FIG. 5 , the loss of the blood vessel 1 and the blood vessel 1; the blood vessel 2 and the blood vessel 2; the blood vessel 1, the blood vessel 2, and a heart 1; and each of the blood vessel 1, the blood vessel 2, and the heart 1 is reduced.
- a model may also be built and optimized such that not only the reconstruction loss, but also the ideal data loss from the input to the entire intermediate representation illustrated in FIG. 5 is reduced.
- a process of optimizing the process of reducing the ideal data loss that is, the process via the entire intermediate representation may be performed, only when the ideal data is input.
- the process is intended to prevent the entire intermediate representation from being formed into various shapes by a random number, for example, to prevent the trajectory of the blood vessel in the disease state and the trajectory of the blood vessel in the ideal state from coming too close to each other or crossing with each other.
- the ideal state is input and is optimized.
- FIG. 7 is a diagram illustrating an example of an entire distributed representation according to the first example. As illustrated in FIG. 7 , it is possible to control how the entire intermediate representation is expressed, by adding the distributed representation loss in the specified ideal state to the whole reconstruction loss, only when the ideal data is input during training. For example, in the entire intermediate representation illustrated in FIG. 7 , a model is built such that the trajectory in the ideal state is drawn at a specific location during the ideal state, at the time of determination, and that the loss approaches zero, with a reduction in the distance from the trajectory in the ideal state, at the time of training.
- the model may be built such that the trajectory in the abnormal state is drawn at a location different from that of the ideal state during the abnormal state, at the time of determination, and that the loss approaches zero, with a reduction in the distance from the trajectory in the ideal state, at the time of training.
- the model may also be built by another device instead of the calculation device 10.
- FIG. 8 is a block diagram illustrating a configuration example of a learning device.
- the learning device 50 includes an input unit 51, an output unit 52, a storage unit 53, and a control unit 54.
- the input unit 51 is an interface for data input.
- the output unit 52 is an interface for data output.
- the storage unit 53 is an example of a storage device that stores data, a computer program executed by the control unit 54, and the like.
- the storage unit 53 is a hard disk and memory.
- the storage unit 53 includes detection map information 531 and model information 532.
- the detection map information 531 is data having the same format as that of the detection map information 131. However, the detection map information 531 is a feature value detected from a frame image in a normal state prepared for training and the like.
- the model information 532 is a parameter for building the autoencoder 40 and the like. However, while the model information 132 is a trained parameter, the model information 532 may be an untrained or training parameter.
- control unit 54 is implemented when a computer program stored in the internal storage device is executed by the CPU, MPU, GPU, or the like using RAM as a work area. Moreover, for example, the control unit 54 may also be implemented by an integrated circuit such as the ASIC and FPGA.
- the control unit 54 includes a setting unit 541, an acquisition unit 542, a calculation unit 543, and an updating unit 544.
- the setting unit 541, the acquisition unit 542, and the calculation unit 543 each have the function similar to that of the setting unit 143, the acquisition unit 144, and the calculation unit 145.
- the updating unit 544 updates the model information 532.
- FIG. 9 is a flowchart illustrating a flow of a detection process according to the first example.
- the detection process is a process mainly performed by the generation unit 141 and the detection unit 142 of the calculation device 10.
- the calculation device 10 receives input of sensor data (step S101). Next, the calculation device 10 generates an image of each frame from the sensor data (step S102). Then, the calculation device 10 detects a feature value of each site in each image, and stores the detected feature value in the storage unit 13 as the detection map information 131 (step S103). After executing step S103, the detection process illustrated in FIG. 9 will be finished.
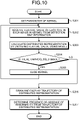
- FIG. 10 is a flowchart illustrating a flow of an abnormality determination process according to the first example.
- the abnormality determination process is a process mainly performed by the calculation unit 145 and the determination unit 146 of the calculation device 10.
- the calculation device 10 sets a parameter of a kernel (step S201).
- the calculation device 10 acquires the feature value of each site in each image in the kernel from the detection map information 131 (step S202).
- the calculation device 10 calculates the distributed representation, by encoding the feature value using the model (step S203).
- a partial distributed representation and an entire distributed representation are calculated.
- the partial distributed representation is calculated by encoding the feature value in the kernel per important site such as a blood vessel and the heart.
- the entire distributed representation is calculated by integrating data on the partial intermediate representation of each site into one, and encoding the whole.
- the calculation device 10 determines whether there is an unprocessed image (step S204). If there is an unprocessed image (Yes at step S204), the calculation device 10 slides the kernel (step S205), returns to step S202, and repeats the process.
- step S206 as the trajectory of the distributed representation, trajectories of the partial distributed representation and the entire distributed representation calculated at step S203 are drawn, and the distributed representations as illustrated in FIG. 6 and FIG. 7 are drawn.
- step S207 the calculation device 10 determines the presence or absence of abnormality from the trajectory of the distributed representation. After executing step S207, the abnormality determination process illustrated in FIG. 10 will be finished.
- FIG. 11 is a flowchart illustrating a flow of a machine learning process according to the first example.
- the learning device 50 adds each loss function calculated from the decoded result of each of the partial intermediate representations in FIG. 5 and the loss function calculated from the decoded result of each of the entire intermediate representations in FIG. 5 , and performs optimization so that the added loss function is reduced.
- the learning device 50 sets a parameter of a kernel (step S301).
- the learning device 50 acquires the feature value of each site in each image in the kernel, from the detection map information 531 (step S302).
- the learning device 50 calculates the distributed representation, by encoding the feature value using the model (step S303).
- the learning device 50 calculates a loss function from the decoded result of the distributed function using the model (step S304). For example, in the example of FIG.
- the learning device 50 updates the model so that the loss function calculated at step S304 is reduced (step S305).
- the loss functions of the blood vessel 1 at the input side and the blood vessel 1 at the output side; the blood vessel 2 at the input side and the blood vessel 2 at the output side; the blood vessel 1, the blood vessel 2, and the heart 1 at the input side; and the blood vessel 1, the blood vessel 2, and the heart 1 at the output side are optimized and reduced.
- the learning device 50 may also update the model so that the ideal data loss from the input to the entire intermediate representation is reduced, as described above with reference to FIG. 5 .
- the learning device 50 determines whether there is an unprocessed image (step S306). If there is an unprocessed image (Yes at step S306), the learning device 50 slides the kernel (step S307), returns to step S302, and repeats the process. On the other hand, if there is no more unprocessed image (No at step S306), the learning device 50 determines whether the completion condition of the learning process is satisfied (step S308).
- the learning device 50 returns to step S301, and repeats the process.
- the completion condition of the learning process is satisfied when the process from step S301 to S307 is repeated for a predetermined number of times.
- the completion condition of the learning process is satisfied (Yes at step S308), the machine learning process illustrated in FIG. 11 will be finished.
- the calculation device 10 acquires a first distributed representation of a partial image corresponding to a specific site of an object to be examined included in each of a plurality of images, by executing machine learning performed by an autoencoder using a partial image of an area corresponding to the specific site, for each of one or more specific sites.
- the calculation device 10 also acquires a second distributed representation of the images, based on the first distributed representation and the result of machine learning performed by the autoencoder, using the images.
- abnormality determination on the object to be examined included in an image to be determined is executed, based on the first distributed representation and the second distributed representation.
- the distributed representation of the intermediate state can be simultaneously acquired by gradually processing per site, using the autoencoder. Hence, it is possible to analyze which site has contributed to the distributed representation.
- the process of executing machine learning performed by the autoencoder using the partial image includes a process of inputting the feature value acquired from the partial image into the autoencoder.
- the process of inputting the feature value acquired from the partial image into the autoencoder includes a process of inputting the feature value acquired from a partial image of a predetermined time width in time series data with respect to the images into the autoencoder.
- the process of acquiring the first distributed representation includes a process of acquiring the first distributed representation by plotting the first intermediate feature value acquired by executing machine learning performed by the autoencoder using the partial image, on a graph for each predetermined time width.
- the process of acquiring the second distributed representation includes a process of acquiring the second distributed representation by plotting the second intermediate feature value acquired by executing machine learning performed by the autoencoder, using the first distributed representation and the result, on a graph for each predetermined time width.
- the process of inputting the feature value acquired from the partial image into the autoencoder includes a process of inputting at least one of the probability that is the likelihood of the corresponding specific site appearing in the partial image, and the position and size of the partial image with respect to the whole images into the autoencoder, as the feature value.
- the learning device 50 executes at least one of a process of inputting a feature value when the object to be examined is in a normal state into the autoencoder, and a process of inputting a feature value when the object to be examined is in an abnormal state into the autoencoder.
- the learning device 50 can be defined such that the trajectory in the ideal state is drawn at a specific location during the ideal state, and the trajectory in the abnormal state is drawn at a location other than that of the ideal state during the abnormal state.
- the components of the illustrated devices are functionally conceptual, and need not be physically configured as illustrated. That is, the specific mode of dispersion and integration of each device is not limited to the ones illustrated in the drawings. All or a part of the devices may be functionally or physically dispersed or integrated in an optional unit, depending on various kinds of loads and the status of use. All or an optional part of each processing function carried out in each device are implemented by a CPU and a computer program analyzed and executed by the CPU, or may be implemented as hardware by the wired logic.
- FIG. 12 is a diagram for explaining an example of a hardware configuration.
- the calculation device 10 includes a communication interface 10a, a hard disk drive (HDD) 10b, memory 10c, and a processor 10d.
- the units illustrated in FIG. 12 are connected to each other via a bus and the like.
- the learning device 50 may also have a similar configuration.
- the communication interface 10a is a network interface card and the like, and communicates with another server.
- the HDD 10b stores a computer program that operates the functions illustrated in FIG. 1 and database (DB).
- the processor 10d is a hardware circuit that operates the process of executing the functions described in FIG. 1 and the like, by reading a computer program for executing the process similar to that of each processing unit illustrated in FIG. 1 from the HDD 10b and the like, and by developing the computer program in the memory 10c. That is, this process executes the function similar to that of each processing unit included in the calculation device 10. More specifically, the processor 10d reads a computer program having the function similar to that of the generation unit 141 and the detection unit 142 from the HDD 10b and the like. Then, the processor 10d executes a process that executes the process similar to that of the generation unit 141, the detection unit 142, and the like.
- the calculation device 10 operates as a calculation device that executes an operation control process, by reading and executing the computer program that executes the process similar to that of each of the processing units illustrated in FIG. 1 .
- the calculation device 10 may also implement the function similar to that of the example described above, by reading a computer program from a recording medium by a medium reading device, and executing the read computer program.
- the computer program in the other example is not only executed by the calculation device 10.
- the present embodiment is similarly applicable when another computer or a server executes the computer program, or the other computer and the server cooperatively execute the computer program.
- the computer program that executes the process similar to that of each of the processing units illustrated in FIG. 1 can also be distributed via a network such as Internet. Furthermore, this computer program can also be recorded on a computer-readable recording medium such as a hard disk, a flexible disk (FD), a compact disc-read only memory (CD-ROM), a magneto-optical disk (MO), and a digital versatile disc (DVD), and executed by being read out from the recording medium by a computer.
- a computer-readable recording medium such as a hard disk, a flexible disk (FD), a compact disc-read only memory (CD-ROM), a magneto-optical disk (MO), and a digital versatile disc (DVD)
Landscapes
- Engineering & Computer Science (AREA)
- Quality & Reliability (AREA)
- General Health & Medical Sciences (AREA)
- Medical Informatics (AREA)
- Nuclear Medicine, Radiotherapy & Molecular Imaging (AREA)
- Radiology & Medical Imaging (AREA)
- Health & Medical Sciences (AREA)
- Computer Vision & Pattern Recognition (AREA)
- Physics & Mathematics (AREA)
- General Physics & Mathematics (AREA)
- Theoretical Computer Science (AREA)
- Image Analysis (AREA)
- Ultra Sonic Daignosis Equipment (AREA)
Abstract
Description
- The embodiments discussed herein are related to a computer-readable recording medium, a calculation method, and a calculation device.
- An ultrasonic examination for examining the presence or absence of abnormality in an internal structure without destroying an object has been known. For example, the ultrasonic examination is performed by capturing an image of a two-dimensional scanned cross-section of an object to be examined, and checking the image of the scanned cross-section. For example, because a probe used for capturing images is scanned by a person, the image of the scanned cross-section is strongly affected by a change in the image capturing environment. As a result, the image of the scanned cross-section, which is an ultrasonic examination image, is often checked visually. Moreover, as a technology for providing valuable information for diagnosis, a technology of generating a three-dimensional model from the scanning results using computed tomography (CT) and magnetic resonance imaging (MRI), and providing information on any cut surface has been known.
- Moreover, an object detection technology for detecting what kind of object appears in an image has been known. For example, in the object detection technology, as a technique for detecting an object in an image by machine learning, a deformable parts model (DPM) and You Only Look Once (YOLO) have been developed.
- Moreover, a technology for determining whether abnormality is present in an object in an image, using the results obtained by the object detection technology has been known. Such a technology is used in medical diagnosis using ultrasound images, examination of defects in manufactured products, and the like.
- Furthermore, as an abnormality determination process using the object detection technology, there is a process of using detection map information in which the detection result of each of a plurality of types of feature values and the time series of a plurality of frame images are associated with each of the frame images included in moving image data obtained by capturing images of an object. This process determines the presence or absence of abnormality, by calculating a distributed representation indicating a set of points obtained by compressing and projecting the distribution state of the detection results, when the position of a section area with a predetermined width set in the detection map information is changed in time series, onto a low-dimensional space, and from the trajectory of the distributed representation (
Japanese Laid-open Patent Publication No. 2020-028680 - However, in the abnormality determination using the distributed representation, information such as positional information, size information, and probability of the detection site are encoded into distributed representations all at once, and become a black box. As a result, it is not possible to control the obtained compressed information, and there is no knowing which site information is affecting which part of the distributed representation.
- Accordingly, it is an object in one aspect of an embodiment of the invention to provide a computer-readable recording medium, a calculation method, and a calculation device capable of analyzing which site has contributed to the distributed representation.
- According to an aspect of the embodiments, a calculation program causes a computer to execute a process including: acquiring a first distributed representation of a partial image corresponding to a specific site of an object to be examined included in each of a plurality of images, by executing machine learning performed by an autoencoder using the partial image of an area corresponding to the specific site, for each of one or more specific sites; and acquiring a second distributed representation of the plurality of images, based on the first distributed representation and a result of machine learning performed by the autoencoder, using the plurality of images, wherein abnormality determination on the object to be examined included in an image to be determined is executed, based on the first distributed representation and the second distributed representation.
-
-
FIG. 1 is a diagram illustrating a configuration example of acalculation device 10 according to a first example; -
FIG. 2 is a diagram illustrating an example ofdetection map information 131 according to the first example; -
FIG. 3 is a diagram illustrating an example of a site detection map according to the first example; -
FIG. 4 is a diagram illustrating an example of a method of calculating a distributed representation according to the first example; -
FIG. 5 is a diagram illustrating an example of a configuration of an autoencoder according to the first example; -
FIG. 6 is a diagram illustrating an example of a partial distributed representation of each site according to the first example; -
FIG. 7 is a diagram illustrating an example of an entire distributed representation according to the first example; -
FIG. 8 is a diagram illustrating a configuration example of alearning device 50 according to the first example; -
FIG. 9 is a flowchart illustrating a flow of a detection process according to the first example; -
FIG. 10 is a flowchart illustrating a flow of an abnormality determination process according to the first example; -
FIG. 11 is a flowchart illustrating a flow of a machine learning process according to the first example; and -
FIG. 12 is a diagram for explaining an example of a hardware configuration. - Preferred embodiments will be explained with reference to accompanying drawings. However, the present embodiment is not limited to the examples. Moreover, the examples can be appropriately combined within a consistent range.
- First, a configuration of a calculation device according to an example will be described with reference to
FIG. 1. FIG. 1 is a diagram illustrating a configuration example of acalculation device 10 according to a first example. As illustrated inFIG. 1 , thecalculation device 10 receives data input from a sensor 21. Moreover, thecalculation device 10 outputs data to a display 22. - The
calculation device 10 calculates a distributed representation from an image, and determines whether abnormality is present in an object in an image based on the distributed representation. In particular, thecalculation device 10 can calculate a distributed representation from a plurality of images in time series. Such images in time series may be frame images forming moving image data. - The sensor 21 is a device for acquiring a signal for generating an image in which abnormality is determined. For example, the sensor 21 is a probe that emits ultrasonic waves to an object, and that receives reflected waves of the ultrasonic waves. For example, the probe may be used for medical examinations and a non-destructive examination of an object. Moreover, for example, the sensor 21 may be a red-green-blue (RGB) camera for capturing an image of an object.
- The sensor 21 may input the collected signal to the
calculation device 10 as it is, or may input data on an image generated from the signal to thecalculation device 10. That is, thecalculation device 10 may generate an image based on the signal received from the sensor 21, or may receive an image from the sensor 21. - As illustrated in
FIG. 1 , thecalculation device 10 includes an input unit 11, anoutput unit 12, astorage unit 13, and a control unit 14. The input unit 11 is an interface for data input. For example, the input unit 11 receives data input from the sensor 21. Moreover, the input unit 11 may also receive data input via an input device such as a mouse and a keyboard. Furthermore, theoutput unit 12 is an interface for data output. For example, theoutput unit 12 outputs data to an output device such as the display 22. - The
storage unit 13 is an example of a storage device that stores data, a computer program executed by the control unit 14, and the like. For example, thestorage unit 13 is a hard disk, memory, and the like. Thestorage unit 13 includesdetection map information 131,model information 132, andnormal image information 133. - The
detection map information 131 is an example of information in which the detection result of each of a plurality of types of feature values and the time series of a plurality of frame images are associated with each of the frame images included in moving image data obtained by capturing images of an object. For example, thedetection map information 131 is assumed to be a set of xml data corresponding to each of the frame images. Moreover, a plurality of types of feature values may be written in each xml data. -
FIG. 2 is a diagram illustrating an example of detection map information. As illustrated inFIG. 2 , thedetection map information 131 is a set of xml data. In a filename element of the xml data, a file path of a corresponding frame image is written. - In this example, the sensor 21 may be a probe for medical examinations. Moreover, the
detection map information 131 may be a feature value obtained from an ultrasound image. The feature value may include probability that is calculated according to the level of likelihood of each site appearing in a frame image, which is set in advance. Furthermore, the feature value may also include coordinates of two apexes of a rectangle indicating an area where each site is assumed to appear in a frame image. - In a name element of the xml data, the name of the site is written. In the xml data, only the site information in which the probability is not zero or the probability is equal to or more than a certain value may be written. Moreover, a probability element indicates the probability of the site written in the name element. The probability is increased with an increase in the likelihood of the corresponding site appearing in the frame image.
- An xmin element and a ymin element represent coordinates of an apex of the rectangle. Moreover, an xmax element and a ymax element represent coordinates of an apex that does not share the side with the apex represented by the xmin element and the ymin element. That is, when the coordinates of the two apexes are decided, the position and size of the rectangle are decided. For example, the coordinates represented by the xmin element and the ymin element indicate the apex of the rectangle at the upper left. Moreover, the coordinates represented by the xmax element and the ymax element indicate the apex of the rectangle at the lower right.
- An example of the xml data illustrated in
FIG. 2 corresponds to a file of a frame image named "frame001.jpg". Moreover, an example of the xml data inFIG. 2 indicates that a site A is present in a rectangular area the apex of which is at a point (384, 219) and a point (517, 362), and that the probability of the site is 0.772151112556. Moreover, an example of xml data inFIG. 2 indicates that a site C is present in a rectangular area the apex of which is at a point (242, 94) and a point (298, 174), and that the probability of the site is 0.101077094674. For example, the coordinates may also be expressed in pixel units. - The
model information 132 is information such as a parameter for building a model used for calculating a distributed representation. In the present example, it is assumed that the model is an autoencoder. In this case, themodel information 132 includes a parameter such as weight set for each unit of the autoencoder. - The
normal image information 133 is information on a frame image of an object in a normal state. Thenormal image information 133 may be a frame image, a feature value of the frame image, or distributed representation obtained from the feature value of the frame image. - The information described above to be stored in the
storage unit 13 is merely an example, and thestorage unit 13 can store various types of information in addition to the information described above. - For example, the control unit 14 is implemented when a computer program stored in an internal storage device is executed by a central processing unit (CPU), a micro processing unit (MPU), a graphics processing unit (GPU), and the like using random-access memory (RAM) as a work area. Moreover, for example, the control unit 14 may also be implemented by an integrated circuit such as an application specific integrated circuit (ASIC) and a field programmable gate array (FPGA). The control unit 14 includes a
generation unit 141, a detection unit 142, asetting unit 143, an acquisition unit 144, acalculation unit 145, adetermination unit 146, and a display control unit 147. Each processing unit is an example of an electronic circuit in a processor or an example of a process executed by a processor. - The
generation unit 141 generates a frame image based on data input from the sensor 21. When a frame image is input from the sensor 21, there is no need for thegeneration unit 141 to generate a frame image. - The detection unit 142 extracts a feature value from the frame image, and stores the feature value in the
storage unit 13 as thedetection map information 131. The detection unit 142 detects the feature value including the probability using a detection model already trained with an image of each site. For example, the detection model may also be a model that uses an object detection algorithm such as You Only Look Once (YOLO), Single Shot Multibox Detector (SSD), and Faster-Regional Convolutional Neural Network (Faster-RCNN). - The detection unit 142 detects probability, which is an index corresponding to the level of likelihood of each of a plurality of objects appearing in each of the frame images, which is set in advance. The objects correspond to the sites to be detected. Moreover, the detection unit 142 also detects the size and position of a rectangular area in the frame image, in which the likelihood of the presence of an object is equal to or more than a predetermined value.
- The
setting unit 143, the acquisition unit 144, and thecalculation unit 145 perform a process of calculating a distributed representation. In this example, at least a part of feature values included in thedetection map information 131 can be mapped in time series.FIG. 3 is a diagram illustrating an example of a site detection map according to the first example. Thesite detection map 30 inFIG. 3 is obtained by mapping the probability of each site in time series. That is, thesite detection map 30 may be referred to as a two-dimensional map obtained by mapping the detection results on a two-dimensional plane in which the first axis is a plurality of types of feature values, and the second axis is the time series. In this example, such a drawing is referred to as a Barcode like timeline. Moreover, the Barcode like timeline may also be simply referred to as a timeline. - In the
site detection map 30, the color of the bar may be darker in color with an increase in the probability. Hereinafter, a method of calculating a distributed representation will be described under an assumption that the autoencoder for calculating a distributed representation is already trained. A training method of the autoencoder will be described below.FIG. 4 is a diagram for explaining a method of calculating a distributed representation. - The
setting unit 143 sets a section area with a predetermined width in the time series, for thedetection map information 131. Such a section area is referred to as a kernel. The kernel may also be referred to as a window and the like. Moreover, thedetection map information 131 is an example of information in which the detection result of each of the types of feature values and the time series of the frame images are associated with each of the frame images included in moving image data obtained by capturing images of an object. - In the
detection map information 131, the acquisition unit 144 acquires the distribution state of the detection results in the section area, for each of a plurality of positions in the section area, when the position of the set section area is changed in time series. The probability and the coordinates of the rectangular area are examples of the distribution state. Moreover, the positions of the section area correspond to each time. That is, the acquisition unit 144 acquires the probability of each site in the frame image corresponding to each time, and the size and position of the rectangular area, from thedetection map information 131 as the distribution state. - The
calculation unit 145 calculates the distributed representation indicating a set of points obtained by projecting the distribution state of each of the positions onto a low-dimensional space. As illustrated inFIG. 4 , thecalculation unit 145 calculates the distributed representation indicating a set of points projected onto a two-dimensional space, by inputting the distribution state, that is, all the information in the kernel, to anautoencoder 40 in which the intermediate layer is formed by two units. Theautoencoder 40 is built based on themodel information 132. Moreover, theautoencoder 40 includes aninput layer 410, anintermediate unit 421, anintermediate unit 422, and anoutput layer 430. The distributed representation is an intermediate feature value output from theintermediate unit 421 and theintermediate unit 422. Then, the display control unit 147 draws the trajectory of distributed representation, by plotting the transition of the intermediate feature values (x, y) of the kernels on a graph. - The
determination unit 146 determines whether the moving image data to be determined is obtained by capturing images of an object in an abnormal state, by comparing the acquired distributed representation and the distributed representation obtained from the moving image data to be determined, which is obtained by capturing images of the object. Moreover, the display control unit 147 displays the trajectory of the points projected onto the two-dimensional space in time series on a screen. In this manner, the abnormal state may be automatically determined by thedetermination unit 146. Alternatively, abnormality determination, analysis, and the like may also be manually performed by a user who viewed the screen displayed by the display control unit 147. - In the case of the method of calculating a distributed representation as illustrated in
FIG. 4 , information such as the probability in the kernel, the position and size of the site, and the like are input into theautoencoder 40 all at once, and are encoded into distributed representations. Hence, there is no knowing which site information is contributing to the distributed representation. Moreover, a way of forming the distributed representation is probabilistically defined, and the position expressed by a normal or abnormal distributed representation vector will not be specified. - Thus, by using the autoencoder as illustrated in
FIG. 5 , the distributed representation of the intermediate state is simultaneously acquired, by gradually processing the Barcode like timeline per site, and per group. Consequently, it is possible to determine which site information is contributing to the distributed representation. Moreover, by fixing the distributed representation vectors corresponding to a sample in the ideal state into one, it is possible to control the acquired distributed representation. The sample in the ideal state is information in which all target sites such as blood vessels and the heart appear in an image. -
FIG. 5 is a diagram illustrating an example of a configuration of an autoencoder according to the first example. As illustrated inFIG. 5 , at the time of determination, thecalculation device 10 acquires the partial intermediate representation of each site, for example, ablood vessel 1 and ablood vessel 2, which are important sites.FIG. 6 is a diagram illustrating an example of a partial distributed representation of each site according to the first example. Then, at the time of determination, thecalculation device 10 integrates the data on the partial intermediate representation of each site into one, compresses the whole, acquires the entire intermediate representation, and restores the whole. Consequently, it is possible to analyze the site using the partial intermediate representation, and it is possible to analyze the whole heart using the entire intermediate representation. - Moreover, at the time of training, a model is built and optimized such that the reconstruction loss, in the example of
FIG. 5 , the loss of theblood vessel 1 and theblood vessel 1; theblood vessel 2 and theblood vessel 2; theblood vessel 1, theblood vessel 2, and aheart 1; and each of theblood vessel 1, theblood vessel 2, and theheart 1 is reduced. - Moreover, because the ideal data of the normal or abnormal state is known, at the time of training, a model may also be built and optimized such that not only the reconstruction loss, but also the ideal data loss from the input to the entire intermediate representation illustrated in
FIG. 5 is reduced. In this case, a process of optimizing the process of reducing the ideal data loss, that is, the process via the entire intermediate representation may be performed, only when the ideal data is input. The process is intended to prevent the entire intermediate representation from being formed into various shapes by a random number, for example, to prevent the trajectory of the blood vessel in the disease state and the trajectory of the blood vessel in the ideal state from coming too close to each other or crossing with each other. Hence, to acquire the intended entire intermediate representation, the ideal state is input and is optimized. -
FIG. 7 is a diagram illustrating an example of an entire distributed representation according to the first example. As illustrated inFIG. 7 , it is possible to control how the entire intermediate representation is expressed, by adding the distributed representation loss in the specified ideal state to the whole reconstruction loss, only when the ideal data is input during training. For example, in the entire intermediate representation illustrated inFIG. 7 , a model is built such that the trajectory in the ideal state is drawn at a specific location during the ideal state, at the time of determination, and that the loss approaches zero, with a reduction in the distance from the trajectory in the ideal state, at the time of training. Moreover, the model may be built such that the trajectory in the abnormal state is drawn at a location different from that of the ideal state during the abnormal state, at the time of determination, and that the loss approaches zero, with a reduction in the distance from the trajectory in the ideal state, at the time of training. The model may also be built by another device instead of thecalculation device 10. - With reference to
FIG. 8 , a configuration of a learning device for training theautoencoder 40 will be described.FIG. 8 is a block diagram illustrating a configuration example of a learning device. As illustrated inFIG. 8 , thelearning device 50 includes an input unit 51, an output unit 52, astorage unit 53, and a control unit 54. The input unit 51 is an interface for data input. The output unit 52 is an interface for data output. - The
storage unit 53 is an example of a storage device that stores data, a computer program executed by the control unit 54, and the like. For example, thestorage unit 53 is a hard disk and memory. Thestorage unit 53 includesdetection map information 531 andmodel information 532. - The
detection map information 531 is data having the same format as that of thedetection map information 131. However, thedetection map information 531 is a feature value detected from a frame image in a normal state prepared for training and the like. - Similar to the
model information 132, themodel information 532 is a parameter for building theautoencoder 40 and the like. However, while themodel information 132 is a trained parameter, themodel information 532 may be an untrained or training parameter. - For example, the control unit 54 is implemented when a computer program stored in the internal storage device is executed by the CPU, MPU, GPU, or the like using RAM as a work area. Moreover, for example, the control unit 54 may also be implemented by an integrated circuit such as the ASIC and FPGA. The control unit 54 includes a
setting unit 541, anacquisition unit 542, acalculation unit 543, and an updatingunit 544. - It is assumed that the
setting unit 541, theacquisition unit 542, and thecalculation unit 543 each have the function similar to that of thesetting unit 143, the acquisition unit 144, and thecalculation unit 145. Based on the calculation result of thecalculation unit 145, the updatingunit 544 updates themodel information 532. - Next, with reference to
FIG. 9 , a flow of a detection process of thecalculation device 10 will be described.FIG. 9 is a flowchart illustrating a flow of a detection process according to the first example. The detection process is a process mainly performed by thegeneration unit 141 and the detection unit 142 of thecalculation device 10. - As illustrated in
FIG. 9 , first, thecalculation device 10 receives input of sensor data (step S101). Next, thecalculation device 10 generates an image of each frame from the sensor data (step S102). Then, thecalculation device 10 detects a feature value of each site in each image, and stores the detected feature value in thestorage unit 13 as the detection map information 131 (step S103). After executing step S103, the detection process illustrated inFIG. 9 will be finished. - Next, with reference to
FIG. 10 , a flow of an abnormality determination process of thecalculation device 10 will be described.FIG. 10 is a flowchart illustrating a flow of an abnormality determination process according to the first example. The abnormality determination process is a process mainly performed by thecalculation unit 145 and thedetermination unit 146 of thecalculation device 10. - As illustrated in
FIG. 10 , first, thecalculation device 10 sets a parameter of a kernel (step S201). Next, thecalculation device 10 acquires the feature value of each site in each image in the kernel from the detection map information 131 (step S202). - Then, the
calculation device 10 calculates the distributed representation, by encoding the feature value using the model (step S203). In this example, at step S203, to calculate the distributed representation, a partial distributed representation and an entire distributed representation are calculated. The partial distributed representation is calculated by encoding the feature value in the kernel per important site such as a blood vessel and the heart. The entire distributed representation is calculated by integrating data on the partial intermediate representation of each site into one, and encoding the whole. - Next, the
calculation device 10 determines whether there is an unprocessed image (step S204). If there is an unprocessed image (Yes at step S204), thecalculation device 10 slides the kernel (step S205), returns to step S202, and repeats the process. - On the other hand, if there is no more unprocessed image (No at step S204), the
calculation device 10 draws and displays the trajectory of the distributed representation (step S206). At step S206, as the trajectory of the distributed representation, trajectories of the partial distributed representation and the entire distributed representation calculated at step S203 are drawn, and the distributed representations as illustrated inFIG. 6 andFIG. 7 are drawn. - Then, the
calculation device 10 determines the presence or absence of abnormality from the trajectory of the distributed representation (step S207). After executing step S207, the abnormality determination process illustrated inFIG. 10 will be finished. - Next, with reference to
FIG. 11 , a flow of a machine learning process of thelearning device 50 will be described.FIG. 11 is a flowchart illustrating a flow of a machine learning process according to the first example. Thelearning device 50 adds each loss function calculated from the decoded result of each of the partial intermediate representations inFIG. 5 and the loss function calculated from the decoded result of each of the entire intermediate representations inFIG. 5 , and performs optimization so that the added loss function is reduced. - As illustrated in
FIG. 11 , first, thelearning device 50 sets a parameter of a kernel (step S301). Next, thelearning device 50 acquires the feature value of each site in each image in the kernel, from the detection map information 531 (step S302). Then, thelearning device 50 calculates the distributed representation, by encoding the feature value using the model (step S303). Moreover, thelearning device 50 calculates a loss function from the decoded result of the distributed function using the model (step S304). For example, in the example ofFIG. 5 , the loss function of each of theblood vessel 1 at the input side and theblood vessel 1 at the output side; theblood vessel 2 at the input side and theblood vessel 2 at the output side; theblood vessel 1, theblood vessel 2, and theheart 1 at the input side; and theblood vessel 1, theblood vessel 2, and theheart 1 at the outside side, which is the loss function of reconstruction, is calculated and added. - Moreover, the
learning device 50 updates the model so that the loss function calculated at step S304 is reduced (step S305). In the example ofFIG. 5 , the loss functions of theblood vessel 1 at the input side and theblood vessel 1 at the output side; theblood vessel 2 at the input side and theblood vessel 2 at the output side; theblood vessel 1, theblood vessel 2, and theheart 1 at the input side; and theblood vessel 1, theblood vessel 2, and theheart 1 at the output side are optimized and reduced. Furthermore, when the ideal data in the normal or abnormal state is input, thelearning device 50 may also update the model so that the ideal data loss from the input to the entire intermediate representation is reduced, as described above with reference toFIG. 5 . - Next, the
learning device 50 determines whether there is an unprocessed image (step S306). If there is an unprocessed image (Yes at step S306), thelearning device 50 slides the kernel (step S307), returns to step S302, and repeats the process. On the other hand, if there is no more unprocessed image (No at step S306), thelearning device 50 determines whether the completion condition of the learning process is satisfied (step S308). - If the completion process of the learning process is not satisfied (No at step S308), the
learning device 50 returns to step S301, and repeats the process. For example, the completion condition of the learning process is satisfied when the process from step S301 to S307 is repeated for a predetermined number of times. When the completion condition of the learning process is satisfied (Yes at step S308), the machine learning process illustrated inFIG. 11 will be finished. - As described above, the
calculation device 10 acquires a first distributed representation of a partial image corresponding to a specific site of an object to be examined included in each of a plurality of images, by executing machine learning performed by an autoencoder using a partial image of an area corresponding to the specific site, for each of one or more specific sites. Thecalculation device 10 also acquires a second distributed representation of the images, based on the first distributed representation and the result of machine learning performed by the autoencoder, using the images. Moreover, abnormality determination on the object to be examined included in an image to be determined is executed, based on the first distributed representation and the second distributed representation. - In the abnormality determination using the trajectory of the distributed representation of a detection site by using the object detection technology, the distributed representation of the intermediate state can be simultaneously acquired by gradually processing per site, using the autoencoder. Hence, it is possible to analyze which site has contributed to the distributed representation.
- Moreover, the process of executing machine learning performed by the autoencoder using the partial image, which is executed by the
calculation device 10, includes a process of inputting the feature value acquired from the partial image into the autoencoder. - Consequently, in the abnormal determination using the trajectory of the distributed representation, it is possible to analyze which site has contributed to the distributed representation, per site.
- Moreover, the process of inputting the feature value acquired from the partial image into the autoencoder, which is executed by the
calculation device 10, includes a process of inputting the feature value acquired from a partial image of a predetermined time width in time series data with respect to the images into the autoencoder. - Consequently, it is possible to draw the trajectory of the distributed representation, and perform abnormality determination using the trajectory of the distributed representation.
- Furthermore, the process of acquiring the first distributed representation, which is executed by the
calculation device 10, includes a process of acquiring the first distributed representation by plotting the first intermediate feature value acquired by executing machine learning performed by the autoencoder using the partial image, on a graph for each predetermined time width. Also, the process of acquiring the second distributed representation, which is executed by thecalculation device 10, includes a process of acquiring the second distributed representation by plotting the second intermediate feature value acquired by executing machine learning performed by the autoencoder, using the first distributed representation and the result, on a graph for each predetermined time width. - Consequently, it is possible to draw the trajectory of the distributed representation, and perform abnormality determination using the trajectory of the distributed representation.
- Still furthermore, the process of inputting the feature value acquired from the partial image into the autoencoder, which is executed by the
calculation device 10, includes a process of inputting at least one of the probability that is the likelihood of the corresponding specific site appearing in the partial image, and the position and size of the partial image with respect to the whole images into the autoencoder, as the feature value. - Consequently, in the abnormality determination using the trajectory of the distributed representation, it is possible to analyze which site has contributed to the distributed representation, per site.
- Still furthermore, the
learning device 50 executes at least one of a process of inputting a feature value when the object to be examined is in a normal state into the autoencoder, and a process of inputting a feature value when the object to be examined is in an abnormal state into the autoencoder. - Consequently, in the distributed representation, the
learning device 50 can be defined such that the trajectory in the ideal state is drawn at a specific location during the ideal state, and the trajectory in the abnormal state is drawn at a location other than that of the ideal state during the abnormal state. - The information including processing procedures, control procedures, specific names, and various types of data and parameters described in the above documents and drawings may be optionally changed unless otherwise specified. Moreover, specific examples, distribution, numerical values, and the like described in the examples are merely examples, and may be optionally changed.
- Moreover, the components of the illustrated devices are functionally conceptual, and need not be physically configured as illustrated. That is, the specific mode of dispersion and integration of each device is not limited to the ones illustrated in the drawings. All or a part of the devices may be functionally or physically dispersed or integrated in an optional unit, depending on various kinds of loads and the status of use. All or an optional part of each processing function carried out in each device are implemented by a CPU and a computer program analyzed and executed by the CPU, or may be implemented as hardware by the wired logic.
-
FIG. 12 is a diagram for explaining an example of a hardware configuration. As illustrated inFIG. 12 , thecalculation device 10 includes acommunication interface 10a, a hard disk drive (HDD) 10b,memory 10c, and aprocessor 10d. Moreover, the units illustrated inFIG. 12 are connected to each other via a bus and the like. Thelearning device 50 may also have a similar configuration. - The
communication interface 10a is a network interface card and the like, and communicates with another server. TheHDD 10b stores a computer program that operates the functions illustrated inFIG. 1 and database (DB). - The
processor 10d is a hardware circuit that operates the process of executing the functions described inFIG. 1 and the like, by reading a computer program for executing the process similar to that of each processing unit illustrated inFIG. 1 from theHDD 10b and the like, and by developing the computer program in thememory 10c. That is, this process executes the function similar to that of each processing unit included in thecalculation device 10. More specifically, theprocessor 10d reads a computer program having the function similar to that of thegeneration unit 141 and the detection unit 142 from theHDD 10b and the like. Then, theprocessor 10d executes a process that executes the process similar to that of thegeneration unit 141, the detection unit 142, and the like. - In this manner, the
calculation device 10 operates as a calculation device that executes an operation control process, by reading and executing the computer program that executes the process similar to that of each of the processing units illustrated inFIG. 1 . Moreover, thecalculation device 10 may also implement the function similar to that of the example described above, by reading a computer program from a recording medium by a medium reading device, and executing the read computer program. The computer program in the other example is not only executed by thecalculation device 10. For example, the present embodiment is similarly applicable when another computer or a server executes the computer program, or the other computer and the server cooperatively execute the computer program. - Moreover, the computer program that executes the process similar to that of each of the processing units illustrated in
FIG. 1 can also be distributed via a network such as Internet. Furthermore, this computer program can also be recorded on a computer-readable recording medium such as a hard disk, a flexible disk (FD), a compact disc-read only memory (CD-ROM), a magneto-optical disk (MO), and a digital versatile disc (DVD), and executed by being read out from the recording medium by a computer. - While examples of the present invention have been described, embodiments of the present invention may be implemented in various other forms in addition to the examples described above.
- In one aspect, in the abnormality determination using distributed representation of a detection site by using the object detection technology, it is possible to analyze which site has contributed to the distributed representation.
Claims (13)
- A calculation program that causes a computer (10) to execute a process comprising:acquiring a first distributed representation of a partial image corresponding to a specific site of an object to be examined included in each of a plurality of images, by executing machine learning performed by an autoencoder using the partial image of an area corresponding to the specific site, for each of one or more specific sites; andacquiring a second distributed representation of the plurality of images, based on the first distributed representation and a result of machine learning performed by the autoencoder, using the plurality of images, whereinabnormality determination on the object to be examined included in an image to be determined is executed, based on the first distributed representation and the second distributed representation.
- The calculation program according to claim 1, wherein the executing machine learning performed by the autoencoder using the partial image includes inputting a feature value acquired from the partial image into the autoencoder.
- The calculation program according to claim 2, wherein the inputting the feature value acquired from the partial image into the autoencoder includes inputting the feature value acquired from the partial image of a predetermined time width in time series data with respect to the plurality of images into the autoencoder.
- The calculation program according to claim 3, whereinthe acquiring the first distributed representation includes acquiring the first distributed representation by plotting a first intermediate feature value acquired by executing machine learning performed by the autoencoder using the partial image, on a graph for each predetermined time width, andthe acquiring the second distributed representation includes acquiring the second distributed representation by plotting a second intermediate feature value acquired by executing machine learning performed by the autoencoder using the first distributed representation and the result, on a graph for each predetermined time width.
- The calculation program according to any one of claims 1 to 4, wherein the inputting a feature value acquired from the partial image into the autoencoder includes inputting probability that is likelihood of a corresponding specific site appearing in the partial image, a position and size of the partial image with respect to whole images into the autoencoder, or both thereof, as the feature value.
- The calculation program according to claim 1, wherein the process further includes inputting a feature value when the object to be examined is in a normal state into the autoencoder, inputting a feature value when the object to be examined is in an abnormal state into the autoencoder, or both thereof.
- A calculation method that causes a computer (10) to execute a process comprising:acquiring a first distributed representation of a partial image corresponding to a specific site of an object to be examined included in each of a plurality of images, by executing machine learning performed by an autoencoder using the partial image of an area corresponding to the specific site, for each of one or more specific sites; andacquiring a second distributed representation of the plurality of images, based on the first distributed representation and a result of machine learning performed by the autoencoder, using the plurality of images, whereinabnormality determination on the object to be examined included in an image to be determined is executed, based on the first distributed representation and the second distributed representation.
- A calculation device (10) comprising:a control unit (14) configured to execute a process including:acquiring a first distributed representation of a partial image corresponding to a specific site of an object to be examined included in each of a plurality of images, by executing machine learning performed by an autoencoder using the partial image of an area corresponding to the specific site, for each of one or more specific sites; andacquiring a second distributed representation of the plurality of images, based on the first distributed representation and a result of machine learning performed by the autoencoder, using the plurality of images, whereinabnormality determination on the object to be examined included in an image to be determined is executed, based on the first distributed representation and the second distributed representation.
- The calculation device (10) according to claim 8, wherein the executing machine learning performed by the autoencoder using the partial image includes inputting a feature value acquired from the partial image into the autoencoder.
- The calculation device (10) according to claim 9, wherein the inputting the feature value acquired from the partial image into the autoencoder includes inputting the feature value acquired from the partial image of a predetermined time width in time series data with respect to the plurality of images into the autoencoder.
- The calculation device (10) according to claim 10, whereinthe acquiring the first distributed representation includes acquiring the first distributed representation by plotting a first intermediate feature value acquired by executing machine learning performed by the autoencoder using the partial image, on a graph for each predetermined time width, andthe acquiring the second distributed representation includes acquiring the second distributed representation by plotting a second intermediate feature value acquired by executing machine learning performed by the autoencoder using the first distributed representation and the result, on a graph for each predetermined time width.
- The calculation device (10) according to any one of claims 8 to 11, wherein the inputting the feature value acquired from the partial image into the autoencoder includes inputting probability that is likelihood of the corresponding specific site appearing in the partial image, a position and size of the partial image with respect to the whole images into the autoencoder, or both thereof, as the feature value.
- The calculation device (10) according to claim 8, further including a control unit (14) configured to execute a process including inputting a feature value when the object to be examined is in a normal state into the autoencoder, inputting a feature value when the object to be examined is in an abnormal state into the autoencoder, or both thereof.
Applications Claiming Priority (1)
| Application Number | Priority Date | Filing Date | Title |
|---|---|---|---|
| JP2021097657A JP7739775B2 (en) | 2021-06-10 | 2021-06-10 | Calculation program, calculation method, and calculation device |
Publications (1)
| Publication Number | Publication Date |
|---|---|
| EP4102456A1 true EP4102456A1 (en) | 2022-12-14 |
Family
ID=81387109
Family Applications (1)
| Application Number | Title | Priority Date | Filing Date |
|---|---|---|---|
| EP22165070.8A Pending EP4102456A1 (en) | 2021-06-10 | 2022-03-29 | Calculation program, calculation method, and calculation device |
Country Status (3)
| Country | Link |
|---|---|
| US (1) | US12315146B2 (en) |
| EP (1) | EP4102456A1 (en) |
| JP (1) | JP7739775B2 (en) |
Citations (1)
| Publication number | Priority date | Publication date | Assignee | Title |
|---|---|---|---|---|
| JP2020028680A (en) | 2018-08-24 | 2020-02-27 | 富士通株式会社 | Inspection support program, inspection support method, and inspection support device |
Family Cites Families (8)
| Publication number | Priority date | Publication date | Assignee | Title |
|---|---|---|---|---|
| US10460251B2 (en) | 2015-06-19 | 2019-10-29 | Preferred Networks Inc. | Cross-domain time series data conversion apparatus, methods, and systems |
| EP3400878B1 (en) * | 2017-05-10 | 2020-03-25 | Esaote S.p.A. | Method for postural independent location of targets in diagnostic imagines acquired by multimodal acquisitions and system for carrying out the said method |
| US10762398B2 (en) | 2018-04-30 | 2020-09-01 | Elekta Ab | Modality-agnostic method for medical image representation |
| JP2020028679A (en) | 2018-08-24 | 2020-02-27 | 富士通株式会社 | Abnormality discrimination program, abnormality discrimination method, and abnormality discrimination device |
| JP7063393B2 (en) | 2018-10-05 | 2022-05-09 | 日本電気株式会社 | Teacher data expansion device, teacher data expansion method and program |
| JP2020177282A (en) | 2019-04-15 | 2020-10-29 | アイシン・エィ・ダブリュ株式会社 | Abnormality discrimination system and its construction method |
| JP7544338B2 (en) | 2019-09-27 | 2024-09-04 | 国立大学法人 東京大学 | Information processing device, information processing system, information processing method, and program |
| EP3827745A1 (en) * | 2019-11-27 | 2021-06-02 | Siemens Healthcare GmbH | Method and device for producing a dental chart |
-
2021
- 2021-06-10 JP JP2021097657A patent/JP7739775B2/en active Active
-
2022
- 2022-03-29 EP EP22165070.8A patent/EP4102456A1/en active Pending
- 2022-03-31 US US17/709,769 patent/US12315146B2/en active Active
Patent Citations (1)
| Publication number | Priority date | Publication date | Assignee | Title |
|---|---|---|---|---|
| JP2020028680A (en) | 2018-08-24 | 2020-02-27 | 富士通株式会社 | Inspection support program, inspection support method, and inspection support device |
Non-Patent Citations (4)
| Title |
|---|
| ALI MOHAMMED ET AL: "TimeCluster: dimension reduction applied to temporal data for visual analytics", VISUAL COMPUTER, SPRINGER, BERLIN, DE, vol. 35, no. 6, 9 May 2019 (2019-05-09), pages 1013 - 1026, XP036800800, ISSN: 0178-2789, [retrieved on 20190509], DOI: 10.1007/S00371-019-01673-Y * |
| JOSEPH REDMONSANTOSH DIVVALAROSS GIRSHICKALI FARHADI: "You Only Look Once: Unified, Real-Time Object Detection", ARXIV: 1506.02640V5 [CS.CV, 9 May 2016 (2016-05-09) |
| KOMATSU MASAAKI ET AL: "Detection of Cardiac Structural Abnormalities in Fetal Ultrasound Videos Using Deep Learning", APPLIED SCIENCES, vol. 11, no. 1, 2 January 2021 (2021-01-02), pages 371, XP055814422, DOI: 10.3390/app11010371 * |
| M. A. SADEGHID. FORSYTH: "Computer Vision-ECCV", 2014, SPRINGER, article "30Hz Object Detection with DPM V5", pages: 65 - 79 |
Also Published As
| Publication number | Publication date |
|---|---|
| US20220398723A1 (en) | 2022-12-15 |
| JP7739775B2 (en) | 2025-09-17 |
| US12315146B2 (en) | 2025-05-27 |
| JP2022189200A (en) | 2022-12-22 |
Similar Documents
| Publication | Publication Date | Title |
|---|---|---|
| CN109493328B (en) | Medical image display method, viewing device, and computer device | |
| US7133546B2 (en) | Digital medical image analysis | |
| US7283652B2 (en) | Method and system for measuring disease relevant tissue changes | |
| JP6930283B2 (en) | Image processing device, operation method of image processing device, and image processing program | |
| US7346203B2 (en) | Methods and apparatus for processing image data to aid in detecting disease | |
| US20240303973A1 (en) | Actor-critic approach for generating synthetic images | |
| CN102460471B (en) | System for computer-aided pulmonary nodule detection in chest tomosynthesis imaging | |
| CN108615237A (en) | A kind of method for processing lung images and image processing equipment | |
| WO2012064986A2 (en) | System and method of ultrasound image processing | |
| CN112508884A (en) | Comprehensive detection device and method for cancerous region | |
| CN111918611B (en) | Abnormality display control method, recording medium and device for chest X-ray images | |
| US20230334665A1 (en) | Learning device, learning method, learning program, and medical use image processing device | |
| US12374465B2 (en) | System and method for detection of a heart failure risk | |
| US11657909B2 (en) | Medical image processing apparatus and medical image processing method | |
| US12374460B2 (en) | Uncertainty estimation in medical imaging | |
| CN114359129B (en) | DR image analysis method and electronic device | |
| CN115439423A (en) | A recognition method, device, equipment and storage medium based on CT images | |
| Dovganich et al. | Automatic quality control in lung X-ray imaging with deep learning | |
| EP4102456A1 (en) | Calculation program, calculation method, and calculation device | |
| KR102632864B1 (en) | 3D Segmentation System and its method for Fracture Fragments using Semantic Segmentation | |
| JP2003265463A (en) | Image diagnosis support system and image diagnosis support program | |
| CN1836258A (en) | Method and system for detecting lung nodules and colon polyps using structure tensors | |
| Mithila et al. | U-net based autonomous fetal segmentation from 2d and 3d ultrasound images | |
| Yadav et al. | Enhancing Medical Imaging Accessibility: An AI-Powered Automated Tactile and 3D-Printable X-Ray System | |
| Peischl et al. | Investigating the Propagation of CT Acquisition Artifacts along the Medical Imaging Pipeline. |
Legal Events
| Date | Code | Title | Description |
|---|---|---|---|
| PUAI | Public reference made under article 153(3) epc to a published international application that has entered the european phase |
Free format text: ORIGINAL CODE: 0009012 |
|
| STAA | Information on the status of an ep patent application or granted ep patent |
Free format text: STATUS: THE APPLICATION HAS BEEN PUBLISHED |
|
| AK | Designated contracting states |
Kind code of ref document: A1 Designated state(s): AL AT BE BG CH CY CZ DE DK EE ES FI FR GB GR HR HU IE IS IT LI LT LU LV MC MK MT NL NO PL PT RO RS SE SI SK SM TR |
|
| STAA | Information on the status of an ep patent application or granted ep patent |
Free format text: STATUS: REQUEST FOR EXAMINATION WAS MADE |
|
| 17P | Request for examination filed |
Effective date: 20230321 |
|
| RBV | Designated contracting states (corrected) |
Designated state(s): AL AT BE BG CH CY CZ DE DK EE ES FI FR GB GR HR HU IE IS IT LI LT LU LV MC MK MT NL NO PL PT RO RS SE SI SK SM TR |
|
| STAA | Information on the status of an ep patent application or granted ep patent |
Free format text: STATUS: EXAMINATION IS IN PROGRESS |
|
| 17Q | First examination report despatched |
Effective date: 20250402 |