EP4092430A1 - Data recovery method and measurement instrument - Google Patents
Data recovery method and measurement instrument Download PDFInfo
- Publication number
- EP4092430A1 EP4092430A1 EP21174334.9A EP21174334A EP4092430A1 EP 4092430 A1 EP4092430 A1 EP 4092430A1 EP 21174334 A EP21174334 A EP 21174334A EP 4092430 A1 EP4092430 A1 EP 4092430A1
- Authority
- EP
- European Patent Office
- Prior art keywords
- modulated signal
- digitally modulated
- signal
- mathematical model
- data
- Prior art date
- Legal status (The legal status is an assumption and is not a legal conclusion. Google has not performed a legal analysis and makes no representation as to the accuracy of the status listed.)
- Pending
Links
- 238000000034 method Methods 0.000 title claims abstract description 51
- 238000011084 recovery Methods 0.000 title claims abstract description 42
- 238000005259 measurement Methods 0.000 title claims abstract description 41
- 238000013178 mathematical model Methods 0.000 claims abstract description 46
- 230000004044 response Effects 0.000 claims abstract description 32
- 238000005070 sampling Methods 0.000 claims description 33
- 238000012360 testing method Methods 0.000 claims description 12
- 238000007476 Maximum Likelihood Methods 0.000 claims description 6
- 230000008569 process Effects 0.000 claims description 3
- 239000000523 sample Substances 0.000 description 25
- 230000002123 temporal effect Effects 0.000 description 10
- 238000010586 diagram Methods 0.000 description 5
- 230000007704 transition Effects 0.000 description 4
- 238000005516 engineering process Methods 0.000 description 2
- 230000006870 function Effects 0.000 description 2
- 238000004590 computer program Methods 0.000 description 1
- 230000001143 conditioned effect Effects 0.000 description 1
- 230000015654 memory Effects 0.000 description 1
Images

Classifications
-
- H—ELECTRICITY
- H04—ELECTRIC COMMUNICATION TECHNIQUE
- H04L—TRANSMISSION OF DIGITAL INFORMATION, e.g. TELEGRAPHIC COMMUNICATION
- H04L1/00—Arrangements for detecting or preventing errors in the information received
- H04L1/004—Arrangements for detecting or preventing errors in the information received by using forward error control
- H04L1/0045—Arrangements at the receiver end
- H04L1/0054—Maximum-likelihood or sequential decoding, e.g. Viterbi, Fano, ZJ algorithms
-
- G—PHYSICS
- G01—MEASURING; TESTING
- G01R—MEASURING ELECTRIC VARIABLES; MEASURING MAGNETIC VARIABLES
- G01R31/00—Arrangements for testing electric properties; Arrangements for locating electric faults; Arrangements for electrical testing characterised by what is being tested not provided for elsewhere
- G01R31/28—Testing of electronic circuits, e.g. by signal tracer
- G01R31/317—Testing of digital circuits
- G01R31/31708—Analysis of signal quality
- G01R31/31709—Jitter measurements; Jitter generators
-
- G—PHYSICS
- G01—MEASURING; TESTING
- G01R—MEASURING ELECTRIC VARIABLES; MEASURING MAGNETIC VARIABLES
- G01R13/00—Arrangements for displaying electric variables or waveforms
- G01R13/02—Arrangements for displaying electric variables or waveforms for displaying measured electric variables in digital form
- G01R13/0218—Circuits therefor
- G01R13/0272—Circuits therefor for sampling
-
- G—PHYSICS
- G01—MEASURING; TESTING
- G01R—MEASURING ELECTRIC VARIABLES; MEASURING MAGNETIC VARIABLES
- G01R31/00—Arrangements for testing electric properties; Arrangements for locating electric faults; Arrangements for electrical testing characterised by what is being tested not provided for elsewhere
- G01R31/28—Testing of electronic circuits, e.g. by signal tracer
- G01R31/317—Testing of digital circuits
- G01R31/3181—Functional testing
- G01R31/3183—Generation of test inputs, e.g. test vectors, patterns or sequences
- G01R31/318371—Methodologies therefor, e.g. algorithms, procedures
-
- H—ELECTRICITY
- H04—ELECTRIC COMMUNICATION TECHNIQUE
- H04L—TRANSMISSION OF DIGITAL INFORMATION, e.g. TELEGRAPHIC COMMUNICATION
- H04L1/00—Arrangements for detecting or preventing errors in the information received
- H04L1/20—Arrangements for detecting or preventing errors in the information received using signal quality detector
- H04L1/205—Arrangements for detecting or preventing errors in the information received using signal quality detector jitter monitoring
Definitions
- the invention generally relates to a data recovery method for recovering data comprised in a digitally modulated signal.
- the invention further relates to a measurement instrument and to a measurement system.
- Data recovery methods for recovering data comprised in a digitally modulated signals are known in a large variety from the state of the art.
- the digitally modulated signal is then sampled at the recovered clock times. Finally, the symbols comprised in the digitally modulated signal are determined by comparing the sampled values with one or several decision thresholds.
- symbol error rate The number of symbols that are falsely determined per time interval is known as the so-called symbol error rate or symbol sequence error rate.
- the digitally modulated signal comprises large disturbances
- the usual techniques known from the state of the art might not be sufficient any more.
- these further techniques usually are computationally expensive.
- the object of the present invention is to provide a data recovery method that allows for smaller symbol error rates while keeping the necessary computational resources low.
- the problem is solved by a data recovery method for recovering data comprised in a digitally modulated signal.
- the digitally modulated signal comprises a symbol sequence.
- the data recovery method comprises the following steps:
- disurbance is understood to denote all kinds of perturbations of the digitally modulated signal that relate to an amplitude deviation of the digitally modulated signal and/or to a time shift of the digitally modulated signal.
- the disturbances may comprise jitter and/or noise.
- the disturbances may comprise horizontal jitter, vertical jitter, horizontal noise and/or vertical noise.
- jitter may be caused by "horizontal” temporal perturbations and/or by “vertical” amplitude perturbations.
- noise may be caused by “horizontal” temporal perturbations and/or by “vertical” amplitude perturbations.
- the method according to the present invention enhances the precision of the data recovery by accounting for the disturbances in the digitally modulated signal.
- the symbol error rate is reduced because the disturbances are incorporated into the data recovery method by means of the mathematical model.
- the disturbances are modelled within the mathematical model such that the computational resources necessary for recovering the data under consideration of the disturbances are reduced.
- the random disturbance is modelled as a Gaussian disturbance, i.e. as a disturbance having a Gaussian probability distribution.
- a Gaussian distribution can be treated statistically with a rather low amount of computational resources.
- the inter-symbol interference component is modelled as Gaussian noise, i.e. as a disturbance having a Gaussian probability distribution.
- Gaussian noise i.e. as a disturbance having a Gaussian probability distribution.
- the dependence of the at least one step response on the symbol sequence is neglected within the mathematical model.
- a step response that is associated with the transition of a first symbol value to a second symbol value may be different from a step response that is associated with the transition of the second symbol value to the first symbol value.
- this dependence is neglected, thereby reducing the computational resources necessary to carry out the data recovery.
- the data recovery method according to the present invention allows for recovering the data even in the presence of large disturbances, while keeping the computational expenses low.
- the data recovery method according to the present invention allows for recovering the data even if an eye diagram associated with the digitally modulated signal is closed.
- the mathematical model describes the digitally modulated signal in terms of the symbol sequence, the disturbances as well as the step response and/or the impulse response, for instance in terms of the symbol sequence, the disturbances and the step response or rather in terms of the symbol sequence, the disturbances and the impulse response.
- the digitally modulated signal is a pulse-amplitude-modulation (PAM)-N coded signal or a non-return-to-zero (NRZ) signal, wherein N is an integer that is greater than or equal to two.
- PAM pulse-amplitude-modulation
- N non-return-to-zero
- the digitally modulated signal may have N different signal levels. Accordingly, each symbol of the digitally modulated signal may take one of the N different signal levels.
- the digitally modulated signal may have two different signal levels.
- the symbols of the digitally modulated signal are bits having one of two possible values.
- the digitally modulated signal is sampled with a predefined sampling rate, thereby obtaining a set of signal samples associated with the digitally modulated signal, wherein the data is recovered based on the set of signal samples.
- the set of signal samples may comprise several subsets of signal samples, wherein each subset may be associated with one symbol of the symbol sequence. In other words, a separate subset of signal samples may be determined for each symbol of the symbol sequence. Accordingly, the value of each symbol may be determined based on the respective subset of signal samples associated with the symbol, thereby recovering the data.
- individual sample points of the set of signal samples are assigned to symbols of the symbol sequence in order to recover the data.
- a separate subset of signal samples may be determined for each symbol of the symbol sequence by assigning the individual sample points of the set of signal samples to symbols of the symbol sequence. Accordingly, the value of each symbol may be determined based on the respective subset of signal samples associated with the respective symbol.
- the predefined sampling rate is greater than a symbol rate of the digitally modulated signal.
- a separate subset of signal samples may be determined for each symbol of the symbol sequence, wherein each subset comprises at least two sample points.
- each subset may comprise more than two sample points.
- each subset comprises f S / f sym sample points, wherein f S is the sampling rate and f symb is the symbol rate.
- the predefined sampling rate is smaller than or equal to the Nyquist rate.
- the sampling rate is higher than the Nyquist rate, i.e. higher than twice the highest meaningful (i.e. data carrying) frequency of the digitally modulated signal, the digitally modulated signal can be reconstructed completely.
- high sampling frequencies e.g. several 10 GS/s, require rather expensive analog-to-digital converters. It has turned out that a sampling rate between the symbol rate and the Nyquist rate is sufficient in order to recover the data with high precision.
- the data is recovered by means of a maximum likelihood technique applied to the set of signal samples.
- a separate subset of signal samples may be determined for each symbol of the symbol sequence by assigning the individual sample points of the set of signal samples to symbols of the symbol sequence.
- the maximum likelihood technique may be applied to the individual subsets in order to determine the respectively associated symbol, thereby recovering the data comprised in the digitally modulated signal.
- the data is recovered without comparing samples of the set of signal samples with a decision threshold.
- the data may be recovered by means of the maximum likelihood technique without defining decision thresholds for the digitally modulated signal.
- sample points that lie within a predefined area around a signal edge are neglected for recovering the data.
- the amplitude of the digitally modulated signal usually varies significantly in the vicinity of a signal edge, while the amplitude remains rather constant in a center area of the respective symbol.
- sample points that are associated with a center area of the respective symbol may yield more reliable information on the value of the respective symbol.
- the sample points that lie within a predefined area around a signal edge may be weighted with a weighting factor that is smaller than a weighting factor for samples in a center area of the respective symbol. In other words, no information is discarded, but the less reliable pieces of information (i.e. the samples in the vicinity of the signal edge) are weighted with a smaller weighting factor.
- a signal level histogram of the digitally modulated signal is determined in order to recover the data.
- the signal level histogram is a function that maps the amplitude of the digitally modulated signal to the number of times the respective amplitude has been observed.
- the maximum likelihood technique may be applied to the signal level histogram in order to recover the data.
- the random disturbance component may comprise a vertical random perturbation and a horizontal random perturbation.
- horizontal indicates that the cause is a temporal perturbation
- vertical indicates that the cause is an amplitude perturbation
- the random disturbance may be caused by "horizontal” temporal perturbations and/or by “vertical” amplitude perturbations.
- the random disturbances may comprise random jitter and/or random noise.
- the disturbances may comprise horizontal random jitter, vertical random jitter, horizontal random noise and/or vertical random noise.
- the problem further is solved by a measurement instrument.
- the measurement instrument comprises a signal input and a signal processing module.
- the signal input is configured to receive a digitally modulated signal, wherein the digitally modulated signal comprises a symbol sequence.
- the signal processing module is configured to process the digitally modulated signal based on a mathematical model, thereby recovering data comprised in the digitally modulated signal.
- the mathematical model describes the digitally modulated signal in terms of the symbol sequence.
- the mathematical model further describes the digitally modulated signal in terms of a step response and/or an impulse response.
- the mathematical model also takes disturbances into account.
- the disturbances comprise a random disturbance component modelled as a Gaussian disturbance.
- the disturbances further comprise an inter-symbol interference component modelled as Gaussian noise. A dependence of the at least one step response on the symbol sequence is neglected within the mathematical model.
- the measurement instrument is configured to perform the data recovery method described above.
- the measurement instrument is an oscilloscope, a signal analyzer, or a vector network analyzer.
- the measurement instrument may be established as any other type of measurement instrument that is suitable for performing the data recovery method described above.
- the measurement instrument further comprises a sampling unit, wherein the sampling unit is configured to sample the digitally modulated signal with a predefined sampling rate, thereby obtaining a set of signal samples associated with the digitally modulated signal, and wherein the signal processing module is configured to recover the data based on the set of signal samples.
- the set of signal samples may comprise several subsets of signal samples, wherein each subset may be associated with one symbol of the symbol sequence. In other words, a separate subset of signal samples may be determined for each symbol of the symbol sequence. Accordingly, the value of each symbol may be determined based on the respective subset of signal samples associated with the symbol, thereby recovering the data.
- the predefined sampling rate may be greater than a symbol rate of the modulated signal.
- a separate subset of signal samples may be determined for each symbol of the symbol sequence, wherein each subset comprises at least two sample points.
- each subset may comprise more than two samples.
- each subset comprises f S / f sym sample points, wherein f S is the sampling rate and f symb is the symbol rate.
- the predefined sampling rate is smaller than or equal to the Nyquist rate.
- the sampling rate is higher than the Nyquist rate, i.e. higher than twice the highest meaningful (i.e. data carrying) frequency of the digitally modulated signal, the digitally modulated signal can be reconstructed completely.
- high sampling frequencies e.g. several 10 GS/s, require rather expensive analog-to-digital converters. It has turned out that a sampling rate between the symbol rate and the Nyquist rate is sufficient in order to recover the data with high precision.
- the problem further is solved by a measurement system.
- the measurement system comprises a measurement instrument described above and a device under test, wherein the device under test is configured to generate the digitally modulated signal.
- the measurement instrument is configured to perform the data recovery method described above.
- the phrase "at least one of A, B, and C", for example, means (A), (B), (C), (A and B), (A and C), (B and C), or (A, B, and C), including all further possible permutations when more than three elements are listed.
- the term “at least one of A and B” generally means “A and/or B", namely "A” alone, “B” alone or "A and B”.
- FIG. 1 schematically shows a measurement system 10.
- the measurement system 10 comprises a device under test 12 and a measurement instrument 14.
- the device under test 12 is an electronic device that is configured to generate a digitally modulated signal, wherein the digitally modulated signal comprises a symbol sequence.
- the digitally modulated signal is a pulse-amplitude-modulation (PAM)-N coded signal or a non-return-to-zero (NRZ) signal, wherein N is an integer that is greater than or equal to two.
- PAM pulse-amplitude-modulation
- N non-return-to-zero
- the digitally modulated signal may have N different signal levels. Accordingly, each symbol of the digitally modulated signal is associated with one of the N different signal levels. In other words, there are N different possible symbol values.
- the digitally modulated signal may have two different signal levels.
- the symbols of the digitally modulated signal are bits having one of two possible values.
- the measurement instrument 14 may be an oscilloscope, a signal analyzer, or a vector network analyzer. However, the measurement instrument 14 may be established as any other type of measurement instrument that is suitable for performing the data recovery method described hereinafter.
- the device under test 12 is connected with the measurement instrument 14 in a signal transmitting manner.
- connection in a signal transmitting manner is understood to denote a cable-based or wireless connection that is configured to transmit signals between the respective devices or components.
- the measurement instrument 14 may be connected to a measurement probe, wherein the measurement probe may contact one or several predefined contact points of the device under test 12 in order to pick up a signal from the device under test 12.
- the measurement instrument 14 comprises a signal input 16 that is connected with the device under test 12, an analog-to-digital converter (ADC) 18, and a signal processing module 20.
- ADC analog-to-digital converter
- module and/or “unit” are/is understood to describe suitable hardware, suitable software, or a combination of hardware and software that is configured to have a certain functionality.
- the hardware may, inter alia, comprise a CPU, a GPU, an FPGA, an ASIC, or other types of electronic circuitry.
- the measurement system 10 is configured to recover data comprised in the digitally modulated signal generated by the device under test 12, even if the digitally modulated signal comprises large disturbances.
- the disturbances may comprise jitter and/or noise.
- the disturbances may comprise horizontal jitter, vertical jitter, horizontal noise and/or vertical noise.
- jitter may be caused by "horizontal” temporal perturbations and/or by “vertical” amplitude perturbations.
- noise may be caused by “horizontal” temporal perturbations and/or by “vertical” amplitude perturbations.
- the measurement system 10 is configured to recover the data comprised in the digitally modulated signal while taking such disturbances into account.
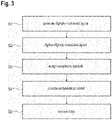
- the measurement system 10 is configured to perform a data recovery method that is described in the following with reference to Figure 3 .
- the digitally modulated signal is generated by means of the device under test 12 and forwarded to the signal input 16 (step S1).
- the digitally modulated signal is received by means of the signal input 16 and digitized by means of the analog-to-digital converter 18, thereby obtaining a digitized digitally modulated signal (step S2).
- the digitally modulated signal is sampled with a predefined sampling rate f S , thereby obtaining a set of signal samples that is associated with the digitally modulated signal.
- the predefined sampling rate may be greater than a symbol rate f sym of the modulated signal. Thus, there may be at least two different sample points associated with each symbol of the symbol sequence.
- n f S / f sym sample points associated with each symbol on average.
- the sampling rate f S of the ADC 18 may be chosen to be an integer multiple of the symbol rate f sym , such that the number n of samples associated with each symbol is an integer.
- the predefined sampling rate f S may be smaller than or equal to the Nyquist rate.
- the sampling rate is higher than the Nyquist rate, i.e. higher than twice the highest meaningful (i.e. data carrying) frequency of the digitally modulated signal, the digitally modulated signal can be reconstructed completely.
- the digitized digitally modulated signal is forwarded to the signal processing module 20.
- the individual sample points of the set of signal samples are assigned to the corresponding symbols of the symbol sequence (step S3).
- a separate subset of signal samples is determined for each symbol of the symbol sequence by assigning the individual sample points of the set of signal samples to the corresponding symbols of the symbol sequence.
- each subset may be associated with one symbol of the symbol sequence.
- a mathematical model is provided, wherein the mathematical model describes the digitally modulated signal in terms of the symbol sequence and in terms of a step response and/or an impulse response, and wherein the mathematical model also takes disturbances into account (step S4).
- the mathematical model takes a random disturbance component into account.
- the random disturbance component may comprise a vertical random perturbation and a horizontal random perturbation.
- horizontal indicates that the cause is a temporal perturbation
- vertical indicates that the cause is an amplitude perturbation
- the random disturbance may be caused by "horizontal” temporal perturbations and/or by “vertical” amplitude perturbations.
- the random disturbances may comprise random jitter and/or random noise.
- the disturbances may comprise horizontal random jitter, vertical random jitter, horizontal random noise and/or vertical random noise.
- the mathematical model takes inter-symbol interferences into account.
- T a is the sampling period
- s [ k ] is the symbol at index k
- s is the vector of the transmitted symbol sequence
- h sr ( t, s ) is the step response for the symbol vector s at time t
- T clk [ k ] is the reference clock time at symbol index k
- y - ⁇ is the initial signal value.
- the deterministic horizontal disturbance at index k is denoted by ⁇ h,D [ k ]
- the random horizontal disturbance at index k is denoted by ⁇ h,D [ k ]
- the deterministic vertical disturbance at time t is denoted by ⁇ v,D ( t )
- the random vertical disturbance at time t is denoted by ⁇ v,R ( t ).
- a step response that is associated with the transition of a first symbol value to a second symbol value may be different from a step response that is associated with the transition of the second symbol value to the first symbol value.
- this dependence is neglected within the mathematical model.
- the received samples that are part of S l are collected in the vector y l , and its probability density function conditioned on the symbol s [ l ] for known impulse response h ( kT a - T clk [ l ] + ⁇ h,D [ l ], ⁇ T ,clk [ l + 1] - ⁇ T, ⁇ [ l + 1]) is (for zero-mean random disturbance and ISI) given by p y l
- the data comprised in the digitally modulated signal is recovered based on the mathematical model and based on the subsets of signal samples described above (step S5).
- the values of the individual symbols of the symbol sequence are determined based on the mathematical model and based on the subsets of signal samples described above.
- the data is recovered by applying a maximum likelihood technique to the different subsets of signal samples.
- s l arg min s l ⁇ k ⁇ S l y kT a ⁇ s l ⁇ h kT a ⁇ T clk l + ⁇ h ; D l , ⁇ T , clk l + 1 ⁇ ⁇ T , ⁇ , h , D l + 1 ⁇ ⁇ v , D kT a 2 2 ⁇ T , k 2 .
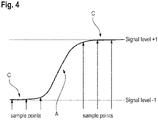
- sample points that lie within a predefined area A around a signal edge may be neglected for recovering the data.
- the neglected sample points are not used for determining the symbol values according to equation (E.9).
- the amplitude of the digitally modulated signal usually varies significantly in the predefined area A, while the amplitude remains rather constant in a center area C of the respective symbols.
- sample points that are associated with a center area C of the respective symbol may yield more reliable information on the value of the respective symbol.
- the sample points that lie within the predefined area A around a signal edge may be weighted with a weighting factor that is smaller than a weighting factor for samples in the center area C of the respective symbol.
- the digitally modulated signal can take one of two different symbol values, namely "Signal level +1" and “Signal level -1", and three samples are taken per symbol.
- the digitally modulated signal may have more than two different possible signal levels.
- equation (E.9) can further be simplified by assuming a constant term s l ⁇ h kT a ⁇ T clk l + ⁇ h , D l , ⁇ T , clk l + 1 ⁇ ⁇ T , ⁇ , h , D l + 1 + ⁇ v , D kT a across k and l for each possible symbol value.
- This allows one to obtain a value for equation (E.10) for each possible symbol based on a signal level histogram.
- a signal level histogram of the digitally modulated signal may be determined in order to recover the data.
- the data recovery described above enhances the precision of the data recovery by accounting for the disturbances in the digitally modulated signal.
- the symbol error rate is reduced because the disturbances are incorporated into the data recovery method by means of the mathematical model.
- the disturbances are modelled within the mathematical model such that the computational resources necessary for recovering the data under consideration of the disturbances are reduced.
- the data recovery method described above allows for recovering the data even in the presence of large disturbances, while keeping the computational expenses low.
- the data recovery method described above allows for recovering the data even if an eye diagram associated with the digitally modulated signal is closed.
- circuitry e.g., one or more circuits
- circuitry operably couple two or more components, generate information, process information, analyze information, generate signals, encode/decode signals, convert signals, transmit and/or receive signals, control other devices, etc.
- Circuitry of any type can be used.
- circuitry includes, among other things, one or more computing devices such as a processor (e.g., a microprocessor), a central processing unit (CPU), a digital signal processor (DSP), an application-specific integrated circuit (ASIC), a field-programmable gate array (FPGA), a system on a chip (SoC), or the like, or any combinations thereof, and can include discrete digital or analog circuit elements or electronics, or combinations thereof.
- a processor e.g., a microprocessor
- CPU central processing unit
- DSP digital signal processor
- ASIC application-specific integrated circuit
- FPGA field-programmable gate array
- SoC system on a chip
- circuitry includes hardware circuit implementations (e.g., implementations in analog circuitry, implementations in digital circuitry, and the like, and combinations thereof).
- circuitry includes combinations of circuits and computer program products having software or firmware instructions stored on one or more computer readable memories that work together to cause a device to perform one or more protocols, methodologies or technologies described herein.
- circuitry includes circuits, such as, for example, microprocessors or portions of microprocessor, that require software, firmware, and the like for operation.
- circuitry includes one or more processors or portions thereof and accompanying software, firmware, hardware, and the like.
- the present application may reference quantities and numbers. Unless specifically stated, such quantities and numbers are not to be considered restrictive, but exemplary of the possible quantities or numbers associated with the present application. Also in this regard, the present application may use the term “plurality” to reference a quantity or number. In this regard, the term “plurality” is meant to be any number that is more than one, for example, two, three, four, five, etc. The terms “about”, “approximately”, “near” etc., mean plus or minus 5% of the stated value.
Landscapes
- Physics & Mathematics (AREA)
- Engineering & Computer Science (AREA)
- General Physics & Mathematics (AREA)
- General Engineering & Computer Science (AREA)
- Nonlinear Science (AREA)
- Artificial Intelligence (AREA)
- Computer Networks & Wireless Communication (AREA)
- Signal Processing (AREA)
- Digital Transmission Methods That Use Modulated Carrier Waves (AREA)
Abstract
- providing a mathematical model of the digitally modulated signal, wherein the mathematical model describes the digitally modulated signal in terms of the symbol sequence, wherein the mathematical model further describes the digitally modulated signal in terms of a step response and/or an impulse response, and wherein the mathematical model also takes disturbances into account; and
- processing the digitally modulated signal based on the mathematical model, thereby recovering the data comprised in the digitally modulated signal;
wherein the disturbances comprise a random disturbance component modelled as a Gaussian disturbance, wherein the disturbances further comprise an intersymbol interference component modelled as Gaussian noise, and wherein a dependence of the at least one step response on the symbol sequence is neglected within the mathematical model.
Description
- The invention generally relates to a data recovery method for recovering data comprised in a digitally modulated signal. The invention further relates to a measurement instrument and to a measurement system.
- Data recovery methods for recovering data comprised in a digitally modulated signals are known in a large variety from the state of the art.
- Usually, a clock recovery is performed in order to obtain clock times. The digitally modulated signal is then sampled at the recovered clock times. Finally, the symbols comprised in the digitally modulated signal are determined by comparing the sampled values with one or several decision thresholds.
- The number of symbols that are falsely determined per time interval is known as the so-called symbol error rate or symbol sequence error rate.
- If the digitally modulated signal comprises large disturbances, the usual techniques known from the state of the art might not be sufficient any more. There are further techniques that enhance the precision of the data recovery. However, these further techniques usually are computationally expensive.
- Thus, the object of the present invention is to provide a data recovery method that allows for smaller symbol error rates while keeping the necessary computational resources low.
- According to the present invention, the problem is solved by a data recovery method for recovering data comprised in a digitally modulated signal. The digitally modulated signal comprises a symbol sequence. The data recovery method comprises the following steps:
- receiving the digitally modulated signal;
- providing a mathematical model of the digitally modulated signal, wherein the mathematical model describes the digitally modulated signal in terms of the symbol sequence, wherein the mathematical model further describes the digitally modulated signal in terms of a step response and/or an impulse response, and wherein the mathematical model also takes disturbances into account; and
- processing the digitally modulated signal based on the mathematical model, thereby recovering the data comprised in the digitally modulated signal;
- Therein and in the following, the term "disturbance" is understood to denote all kinds of perturbations of the digitally modulated signal that relate to an amplitude deviation of the digitally modulated signal and/or to a time shift of the digitally modulated signal.
- For example, the disturbances may comprise jitter and/or noise. Particularly, the disturbances may comprise horizontal jitter, vertical jitter, horizontal noise and/or vertical noise.
- Therein, the term "horizontal" indicates that the cause is a temporal perturbation, while the term "vertical" indicates that the cause is an amplitude perturbation.
- Put another way, jitter may be caused by "horizontal" temporal perturbations and/or by "vertical" amplitude perturbations. Likewise, noise may be caused by "horizontal" temporal perturbations and/or by "vertical" amplitude perturbations.
- The method according to the present invention enhances the precision of the data recovery by accounting for the disturbances in the digitally modulated signal. In other words, the symbol error rate is reduced because the disturbances are incorporated into the data recovery method by means of the mathematical model.
- However, the disturbances are modelled within the mathematical model such that the computational resources necessary for recovering the data under consideration of the disturbances are reduced.
- More precisely, there are three simplifications within the mathematical model. First, the random disturbance is modelled as a Gaussian disturbance, i.e. as a disturbance having a Gaussian probability distribution. Such a Gaussian distribution can be treated statistically with a rather low amount of computational resources.
- Second, the inter-symbol interference component is modelled as Gaussian noise, i.e. as a disturbance having a Gaussian probability distribution. As already explained above, such a Gaussian distribution can be treated statistically with a rather low amount of computational resources.
- Third, the dependence of the at least one step response on the symbol sequence is neglected within the mathematical model. In general, a step response that is associated with the transition of a first symbol value to a second symbol value may be different from a step response that is associated with the transition of the second symbol value to the first symbol value. However, this dependence is neglected, thereby reducing the computational resources necessary to carry out the data recovery.
- Thus, the data recovery method according to the present invention allows for recovering the data even in the presence of large disturbances, while keeping the computational expenses low.
- In other words, the data recovery method according to the present invention allows for recovering the data even if an eye diagram associated with the digitally modulated signal is closed.
- In fact, the mathematical model describes the digitally modulated signal in terms of the symbol sequence, the disturbances as well as the step response and/or the impulse response, for instance in terms of the symbol sequence, the disturbances and the step response or rather in terms of the symbol sequence, the disturbances and the impulse response.
- According to an aspect of the present invention, the digitally modulated signal is a pulse-amplitude-modulation (PAM)-N coded signal or a non-return-to-zero (NRZ) signal, wherein N is an integer that is greater than or equal to two.
- Accordingly, if the digitally modulated signal is PAM-N coded, the digitally modulated signal may have N different signal levels. Accordingly, each symbol of the digitally modulated signal may take one of the N different signal levels.
- If the digitally modulated signal is a NRZ signal, the digitally modulated signal may have two different signal levels. Thus, the symbols of the digitally modulated signal are bits having one of two possible values.
- According to another aspect of the present invention, the digitally modulated signal is sampled with a predefined sampling rate, thereby obtaining a set of signal samples associated with the digitally modulated signal, wherein the data is recovered based on the set of signal samples. The set of signal samples may comprise several subsets of signal samples, wherein each subset may be associated with one symbol of the symbol sequence. In other words, a separate subset of signal samples may be determined for each symbol of the symbol sequence. Accordingly, the value of each symbol may be determined based on the respective subset of signal samples associated with the symbol, thereby recovering the data.
- In an embodiment of the present invention, individual sample points of the set of signal samples are assigned to symbols of the symbol sequence in order to recover the data. A separate subset of signal samples may be determined for each symbol of the symbol sequence by assigning the individual sample points of the set of signal samples to symbols of the symbol sequence. Accordingly, the value of each symbol may be determined based on the respective subset of signal samples associated with the respective symbol.
- In a further embodiment of the present invention, the predefined sampling rate is greater than a symbol rate of the digitally modulated signal. Thus, there are at least two different sample points associated with each symbol of the symbol sequence. This way, the data can be recovered with a reduced symbol error rate, as more information with respect to each symbol is available.
- Particularly, a separate subset of signal samples may be determined for each symbol of the symbol sequence, wherein each subset comprises at least two sample points.
- Of course, each subset may comprise more than two sample points. On average, each subset comprises fS /fsym sample points, wherein fS is the sampling rate and fsymb is the symbol rate.
- Particularly, the predefined sampling rate is smaller than or equal to the Nyquist rate. In general, if the sampling rate is higher than the Nyquist rate, i.e. higher than twice the highest meaningful (i.e. data carrying) frequency of the digitally modulated signal, the digitally modulated signal can be reconstructed completely. However, such high sampling frequencies, e.g. several 10 GS/s, require rather expensive analog-to-digital converters. It has turned out that a sampling rate between the symbol rate and the Nyquist rate is sufficient in order to recover the data with high precision.
- According to another aspect of the present invention, the data is recovered by means of a maximum likelihood technique applied to the set of signal samples. A separate subset of signal samples may be determined for each symbol of the symbol sequence by assigning the individual sample points of the set of signal samples to symbols of the symbol sequence. The maximum likelihood technique may be applied to the individual subsets in order to determine the respectively associated symbol, thereby recovering the data comprised in the digitally modulated signal.
- In an embodiment of the present invention, the data is recovered without comparing samples of the set of signal samples with a decision threshold. Thus, the data may be recovered by means of the maximum likelihood technique without defining decision thresholds for the digitally modulated signal.
- According to another aspect of the present invention, sample points that lie within a predefined area around a signal edge are neglected for recovering the data. The amplitude of the digitally modulated signal usually varies significantly in the vicinity of a signal edge, while the amplitude remains rather constant in a center area of the respective symbol. Thus, sample points that are associated with a center area of the respective symbol may yield more reliable information on the value of the respective symbol. By neglecting the sample points that lie within a predefined area around a signal edge, the less reliable information is discarded, and the overall precision of the data recovery method is enhanced.
- Alternatively, the sample points that lie within a predefined area around a signal edge may be weighted with a weighting factor that is smaller than a weighting factor for samples in a center area of the respective symbol. In other words, no information is discarded, but the less reliable pieces of information (i.e. the samples in the vicinity of the signal edge) are weighted with a smaller weighting factor.
- In a further embodiment of the present invention, a signal level histogram of the digitally modulated signal is determined in order to recover the data. The signal level histogram is a function that maps the amplitude of the digitally modulated signal to the number of times the respective amplitude has been observed. For example, the maximum likelihood technique may be applied to the signal level histogram in order to recover the data.
- The random disturbance component may comprise a vertical random perturbation and a horizontal random perturbation. Therein, the term "horizontal" indicates that the cause is a temporal perturbation, while the term "vertical" indicates that the cause is an amplitude perturbation.
- Put another way, the random disturbance may be caused by "horizontal" temporal perturbations and/or by "vertical" amplitude perturbations.
- For example, the random disturbances may comprise random jitter and/or random noise. Particularly, the disturbances may comprise horizontal random jitter, vertical random jitter, horizontal random noise and/or vertical random noise.
- According to the present invention, the problem further is solved by a measurement instrument. The measurement instrument comprises a signal input and a signal processing module. The signal input is configured to receive a digitally modulated signal, wherein the digitally modulated signal comprises a symbol sequence. The signal processing module is configured to process the digitally modulated signal based on a mathematical model, thereby recovering data comprised in the digitally modulated signal. The mathematical model describes the digitally modulated signal in terms of the symbol sequence. The mathematical model further describes the digitally modulated signal in terms of a step response and/or an impulse response. The mathematical model also takes disturbances into account. The disturbances comprise a random disturbance component modelled as a Gaussian disturbance. The disturbances further comprise an inter-symbol interference component modelled as Gaussian noise. A dependence of the at least one step response on the symbol sequence is neglected within the mathematical model.
- Particularly, the measurement instrument is configured to perform the data recovery method described above.
- Regarding the further advantages and properties of the measurement instrument, reference is made to the explanations given above with respect to the data recovery method, which also hold for the measurement instrument and vice versa.
- According to an aspect of the present invention, the measurement instrument is an oscilloscope, a signal analyzer, or a vector network analyzer. However, the measurement instrument may be established as any other type of measurement instrument that is suitable for performing the data recovery method described above.
- According to another aspect of the present invention, the measurement instrument further comprises a sampling unit, wherein the sampling unit is configured to sample the digitally modulated signal with a predefined sampling rate, thereby obtaining a set of signal samples associated with the digitally modulated signal, and wherein the signal processing module is configured to recover the data based on the set of signal samples. The set of signal samples may comprise several subsets of signal samples, wherein each subset may be associated with one symbol of the symbol sequence. In other words, a separate subset of signal samples may be determined for each symbol of the symbol sequence. Accordingly, the value of each symbol may be determined based on the respective subset of signal samples associated with the symbol, thereby recovering the data.
- The predefined sampling rate may be greater than a symbol rate of the modulated signal. Thus, there are at least two different sample points associated with each symbol of the symbol sequence. This way, the data can be recovered with a reduced symbol error rate, as more information with respect to each symbol is available.
- Particularly, a separate subset of signal samples may be determined for each symbol of the symbol sequence, wherein each subset comprises at least two sample points.
- Of course, each subset may comprise more than two samples. On average, each subset comprises fS /fsym sample points, wherein fS is the sampling rate and fsymb is the symbol rate.
- Particularly, the predefined sampling rate is smaller than or equal to the Nyquist rate. In general, if the sampling rate is higher than the Nyquist rate, i.e. higher than twice the highest meaningful (i.e. data carrying) frequency of the digitally modulated signal, the digitally modulated signal can be reconstructed completely. However, such high sampling frequencies, e.g. several 10 GS/s, require rather expensive analog-to-digital converters. It has turned out that a sampling rate between the symbol rate and the Nyquist rate is sufficient in order to recover the data with high precision.
- According to the present invention, the problem further is solved by a measurement system. The measurement system comprises a measurement instrument described above and a device under test, wherein the device under test is configured to generate the digitally modulated signal.
- Particularly, the measurement instrument is configured to perform the data recovery method described above.
- Regarding the further advantages and properties of the measurement system, reference is made to the explanations given above with respect to the data recovery method, which also hold for the measurement system and vice versa.
- The foregoing aspects and many of the attendant advantages of the claimed subject matter will become more readily appreciated as the same become better understood by reference to the following detailed description, when taken in conjunction with the accompanying drawings, wherein:
-
Figure 1 schematically shows a measurement system according to the present invention; -
Figure 2 schematically shows an eye diagram that is associated with a digitally modulated signal; -
Figure 3 shows a flow chart of a data recovery method according to the present invention; and -
Figure 4 shows a diagram of an exemplary digitally modulated signal plotted against time. - The detailed description set forth below in connection with the appended drawings, where like numerals reference like elements, is intended as a description of various embodiments of the disclosed subject matter and is not intended to represent the only embodiments. Each embodiment described in this disclosure is provided merely as an example or illustration and should not be construed as preferred or advantageous over other embodiments. The illustrative examples provided herein are not intended to be exhaustive or to limit the claimed subject matter to the precise forms disclosed.
- For the purposes of the present disclosure, the phrase "at least one of A, B, and C", for example, means (A), (B), (C), (A and B), (A and C), (B and C), or (A, B, and C), including all further possible permutations when more than three elements are listed. In other words, the term "at least one of A and B" generally means "A and/or B", namely "A" alone, "B" alone or "A and B".
-
Figure 1 schematically shows ameasurement system 10. Themeasurement system 10 comprises a device undertest 12 and ameasurement instrument 14. - In general, the device under
test 12 is an electronic device that is configured to generate a digitally modulated signal, wherein the digitally modulated signal comprises a symbol sequence. - The digitally modulated signal is a pulse-amplitude-modulation (PAM)-N coded signal or a non-return-to-zero (NRZ) signal, wherein N is an integer that is greater than or equal to two.
- Accordingly, if the digitally modulated signal is PAM-N coded, the digitally modulated signal may have N different signal levels. Accordingly, each symbol of the digitally modulated signal is associated with one of the N different signal levels. In other words, there are N different possible symbol values.
- If the digitally modulated signal is a NRZ signal, the digitally modulated signal may have two different signal levels. Thus, the symbols of the digitally modulated signal are bits having one of two possible values.
- The
measurement instrument 14 may be an oscilloscope, a signal analyzer, or a vector network analyzer. However, themeasurement instrument 14 may be established as any other type of measurement instrument that is suitable for performing the data recovery method described hereinafter. - The device under
test 12 is connected with themeasurement instrument 14 in a signal transmitting manner. - Therein and in the following, the term "connected in a signal transmitting manner" is understood to denote a cable-based or wireless connection that is configured to transmit signals between the respective devices or components.
- For example, the
measurement instrument 14 may be connected to a measurement probe, wherein the measurement probe may contact one or several predefined contact points of the device undertest 12 in order to pick up a signal from the device undertest 12. - The
measurement instrument 14 comprises asignal input 16 that is connected with the device undertest 12, an analog-to-digital converter (ADC) 18, and asignal processing module 20. - Therein and in the following, the term(s) "module" and/or "unit" are/is understood to describe suitable hardware, suitable software, or a combination of hardware and software that is configured to have a certain functionality.
- The hardware may, inter alia, comprise a CPU, a GPU, an FPGA, an ASIC, or other types of electronic circuitry.
- In general, the
measurement system 10 is configured to recover data comprised in the digitally modulated signal generated by the device undertest 12, even if the digitally modulated signal comprises large disturbances. - As is illustrated in
Figure 2 , such large disturbances usually manifest in that an eye diagram associated with the digitally modulated signal is closed. - For example, the disturbances may comprise jitter and/or noise. Particularly, the disturbances may comprise horizontal jitter, vertical jitter, horizontal noise and/or vertical noise.
- Therein, the term "horizontal" indicates that the cause is a temporal perturbation, while the term "vertical" indicates that the cause is an amplitude perturbation.
- Put another way, jitter may be caused by "horizontal" temporal perturbations and/or by "vertical" amplitude perturbations. Likewise, noise may be caused by "horizontal" temporal perturbations and/or by "vertical" amplitude perturbations.
- The
measurement system 10 is configured to recover the data comprised in the digitally modulated signal while taking such disturbances into account. - More precisely, the
measurement system 10 is configured to perform a data recovery method that is described in the following with reference toFigure 3 . - The digitally modulated signal is generated by means of the device under
test 12 and forwarded to the signal input 16 (step S1). - The digitally modulated signal is received by means of the
signal input 16 and digitized by means of the analog-to-digital converter 18, thereby obtaining a digitized digitally modulated signal (step S2). - Thus, the digitally modulated signal is sampled with a predefined sampling rate fS , thereby obtaining a set of signal samples that is associated with the digitally modulated signal.
- The predefined sampling rate may be greater than a symbol rate fsym of the modulated signal. Thus, there may be at least two different sample points associated with each symbol of the symbol sequence.
- More precisely, there are n = fS /fsym sample points associated with each symbol on average.
- The sampling rate fS of the
ADC 18 may be chosen to be an integer multiple of the symbol rate fsym, such that the number n of samples associated with each symbol is an integer. - Particularly, the predefined sampling rate fS may be smaller than or equal to the Nyquist rate.
- In general, if the sampling rate is higher than the Nyquist rate, i.e. higher than twice the highest meaningful (i.e. data carrying) frequency of the digitally modulated signal, the digitally modulated signal can be reconstructed completely.
- However, such high sampling frequencies, e.g. several GS/s or even several 10 GS/s, require rather expensive analog-to-digital converters. It has turned out that a sampling rate between the symbol rate and the Nyquist rate is sufficient for the data recovery method.
- The digitized digitally modulated signal is forwarded to the
signal processing module 20. - The individual sample points of the set of signal samples are assigned to the corresponding symbols of the symbol sequence (step S3).
- Thus, a separate subset of signal samples is determined for each symbol of the symbol sequence by assigning the individual sample points of the set of signal samples to the corresponding symbols of the symbol sequence.
- In other words, each subset may be associated with one symbol of the symbol sequence.
- A mathematical model is provided, wherein the mathematical model describes the digitally modulated signal in terms of the symbol sequence and in terms of a step response and/or an impulse response, and wherein the mathematical model also takes disturbances into account (step S4).
- Particularly, the mathematical model takes a random disturbance component into account.
- The random disturbance component may comprise a vertical random perturbation and a horizontal random perturbation. Therein, the term "horizontal" indicates that the cause is a temporal perturbation, while the term "vertical" indicates that the cause is an amplitude perturbation.
- Put another way, the random disturbance may be caused by "horizontal" temporal perturbations and/or by "vertical" amplitude perturbations.
- For example, the random disturbances may comprise random jitter and/or random noise. Particularly, the disturbances may comprise horizontal random jitter, vertical random jitter, horizontal random noise and/or vertical random noise.
- Moreover, the mathematical model takes inter-symbol interferences into account.
- Within the mathematical model, the digitally modulated signal is modelled by the following equation:

- Therein, Ta is the sampling period, s[k] is the symbol at index k, s is the vector of the transmitted symbol sequence, h sr(t, s) is the step response for the symbol vector s at time t, T clk[k] is the reference clock time at symbol index k, and y -∞ is the initial signal value.
- The deterministic horizontal disturbance at index k is denoted by εh,D [k], the random horizontal disturbance at index k is denoted by εh,D [k], the deterministic vertical disturbance at time t is denoted by εv,D (t), and the random vertical disturbance at time t is denoted by εv,R (t).
- Using a first-order Taylor approximation for εh,R [l], one obtains the approximation

- The signal model can then be reformulated in terms of an impulse response instead of a step response as follows:

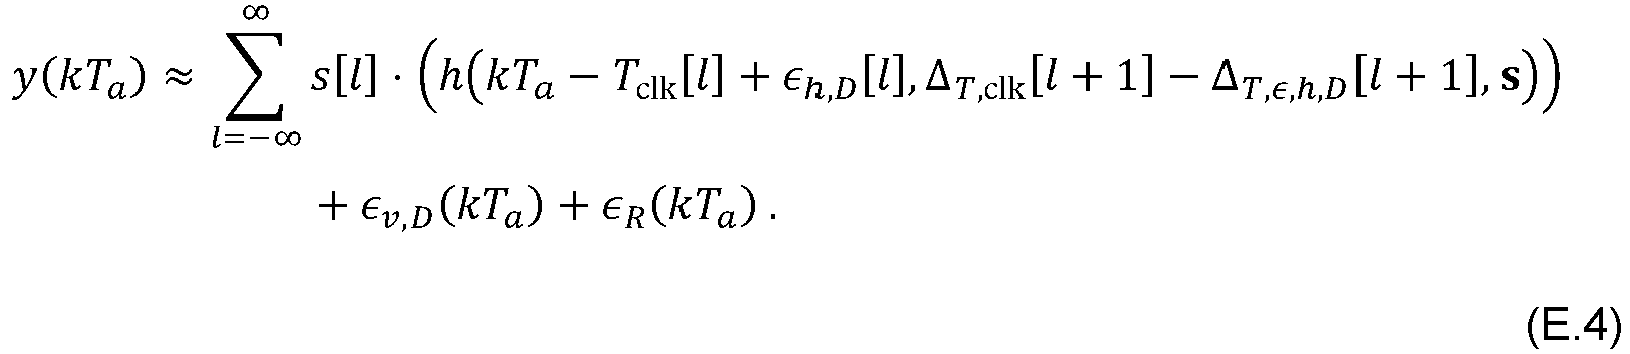

- In order to recover the data comprised in the digitally modulated signal with high precision while keeping the necessary computational resources as low as possible, the following three simplifications are applied to the mathematical model described above:
- First, the random disturbance is modelled as a Gaussian disturbance, i.e. as a disturbance having a Gaussian probability distribution.
- Second, the inter-symbol interference component is modelled as Gaussian noise, i.e. as a disturbance having a Gaussian probability distribution.
- Further, a dependence of the at least one step response on the symbol sequence is neglected within the mathematical model.
- In general, a step response that is associated with the transition of a first symbol value to a second symbol value may be different from a step response that is associated with the transition of the second symbol value to the first symbol value. However, this dependence is neglected within the mathematical model.
- By applying the simplification described above, one obtains:


variance 

- The data comprised in the digitally modulated signal is recovered based on the mathematical model and based on the subsets of signal samples described above (step S5).
- In other words, the values of the individual symbols of the symbol sequence are determined based on the mathematical model and based on the subsets of signal samples described above.
- Particularly, the data is recovered by applying a maximum likelihood technique to the different subsets of signal samples.
- As a result, the individual symbols are determined according to the equation

- As is illustrated in
Figure 4 , sample points that lie within a predefined area A around a signal edge may be neglected for recovering the data. The neglected sample points are not used for determining the symbol values according to equation (E.9). - The amplitude of the digitally modulated signal usually varies significantly in the predefined area A, while the amplitude remains rather constant in a center area C of the respective symbols.
- Thus, sample points that are associated with a center area C of the respective symbol may yield more reliable information on the value of the respective symbol.
- Alternatively, the sample points that lie within the predefined area A around a signal edge may be weighted with a weighting factor that is smaller than a weighting factor for samples in the center area C of the respective symbol.
- In other words, no information is discarded in equation (E.9) in this case, but the samples in the vicinity of the signal edge are weighted with a smaller weighting factor.
- In the exemplary case illustrated in
Figure 4 , the digitally modulated signal can take one of two different symbol values, namely "Signal level +1" and "Signal level -1", and three samples are taken per symbol. - However, it is to be understood that any other number of samples may be taken per symbol. Moreover, the digitally modulated signal may have more than two different possible signal levels.
- Optionally, equation (E.9) can further be simplified by assuming a constant term

- Thus, in this case a signal level histogram of the digitally modulated signal may be determined in order to recover the data.
- The data recovery described above enhances the precision of the data recovery by accounting for the disturbances in the digitally modulated signal. In other words, the symbol error rate is reduced because the disturbances are incorporated into the data recovery method by means of the mathematical model.
- However, the disturbances are modelled within the mathematical model such that the computational resources necessary for recovering the data under consideration of the disturbances are reduced.
- Thus, the data recovery method described above allows for recovering the data even in the presence of large disturbances, while keeping the computational expenses low.
- In otherwords, the data recovery method described above allows for recovering the data even if an eye diagram associated with the digitally modulated signal is closed.
- Certain embodiments disclosed herein, particularly the respective module(s), utilize circuitry (e.g., one or more circuits) in order to implement standards, protocols, methodologies or technologies disclosed herein, operably couple two or more components, generate information, process information, analyze information, generate signals, encode/decode signals, convert signals, transmit and/or receive signals, control other devices, etc. Circuitry of any type can be used.
- In an embodiment, circuitry includes, among other things, one or more computing devices such as a processor (e.g., a microprocessor), a central processing unit (CPU), a digital signal processor (DSP), an application-specific integrated circuit (ASIC), a field-programmable gate array (FPGA), a system on a chip (SoC), or the like, or any combinations thereof, and can include discrete digital or analog circuit elements or electronics, or combinations thereof. In an embodiment, circuitry includes hardware circuit implementations (e.g., implementations in analog circuitry, implementations in digital circuitry, and the like, and combinations thereof).
- In an embodiment, circuitry includes combinations of circuits and computer program products having software or firmware instructions stored on one or more computer readable memories that work together to cause a device to perform one or more protocols, methodologies or technologies described herein. In an embodiment, circuitry includes circuits, such as, for example, microprocessors or portions of microprocessor, that require software, firmware, and the like for operation. In an embodiment, circuitry includes one or more processors or portions thereof and accompanying software, firmware, hardware, and the like.
- The present application may reference quantities and numbers. Unless specifically stated, such quantities and numbers are not to be considered restrictive, but exemplary of the possible quantities or numbers associated with the present application. Also in this regard, the present application may use the term "plurality" to reference a quantity or number. In this regard, the term "plurality" is meant to be any number that is more than one, for example, two, three, four, five, etc. The terms "about", "approximately", "near" etc., mean plus or minus 5% of the stated value.
Claims (15)
- A data recovery method for recovering data comprised in a digitally modulated signal, wherein the digitally modulated signal comprises a symbol sequence, wherein the data recovery method comprises the following steps:- receiving the digitally modulated signal;- providing a mathematical model of the digitally modulated signal, wherein the mathematical model describes the digitally modulated signal in terms of the symbol sequence, wherein the mathematical model further describes the digitally modulated signal in terms of a step response and/or an impulse response, and wherein the mathematical model also takes disturbances into account; and- processing the digitally modulated signal based on the mathematical model, thereby recovering the data comprised in the digitally modulated signal;wherein the disturbances comprise a random disturbance component modelled as a Gaussian disturbance,
wherein the disturbances further comprise an inter-symbol interference component modelled as Gaussian noise, and
wherein a dependence of the at least one step response on the symbol sequence is neglected within the mathematical model. - The data recovery method of claim 1, wherein the digitally modulated signal is a PAM-N coded signal or a non-return-to-zero (NRZ) signal, wherein N is an integer that is greater than or equal to two.
- The data recovery method according to any one of the preceding claims, wherein the digitally modulated signal is sampled with a predefined sampling rate, thereby obtaining a set of signal samples associated with the digitally modulated signal, and wherein the data is recovered based on the set of signal samples.
- The data recovery method of claim 3, wherein individual sample points of the set of signal samples are assigned to symbols of the symbol sequence in order to recover the data.
- The data recovery method according to claim 3 or 4, wherein the predefined sampling rate is greater than a symbol rate of the modulated signal.
- The data recovery method according to any one of the claims 3 to 5, wherein the predefined sampling rate is smaller than or equal to the Nyquist rate.
- The data recovery method according to any one of the claims 3 to 6, wherein the data is recovered by means of a maximum likelihood technique applied to the set of signal samples.
- The data recovery method according to claim 7, wherein the data is recovered without comparing samples of the set of signal samples with a decision threshold.
- The data recovery method according to any one of the claims 3 to 8, wherein sample points that lie within a predefined area around a signal edge are neglected for recovering the data.
- The data recovery method according to any one of the preceding claims, wherein a signal level histogram of the digitally modulated signal is determined in order to recover the data.
- The data recovery method according to any one of the preceding claims, wherein the random disturbance component comprises a vertical random perturbation and a horizontal random perturbation.
- A measurement instrument, comprising a signal input and a signal processing module,
wherein the signal input is configured to receive a digitally modulated signal, wherein the digitally modulated signal comprises a symbol sequence,
wherein the signal processing module is configured to process the digitally modulated signal based on a mathematical model, thereby recovering data comprised in the digitally modulated signal,
wherein the mathematical model describes the digitally modulated signal in terms of the symbol sequence, wherein the mathematical model further describes the digitally modulated signal in terms of a step response and/or an impulse response, and wherein the mathematical model also takes disturbances into account,
wherein the disturbances comprise a random disturbance component modelled as a Gaussian disturbance,
wherein the disturbances further comprise an inter-symbol interference component modelled as Gaussian noise, and
wherein a dependence of the at least one step response on the symbol sequence is neglected within the mathematical model. - The measurement instrument of claim 12, wherein the measurement instrument is an oscilloscope, a signal analyzer, or a vector network analyzer.
- The measurement instrument of claim 12 or 13, further comprising a sampling unit, wherein the sampling unit is configured to sample the digitally modulated signal with a predefined sampling rate, thereby obtaining a set of signal samples associated with the digitally modulated signal, and wherein the signal processing module is configured to recover the data based on the set of signal samples.
- A measurement system, comprising a measurement instrument according to any one of the claims 12 to 14 and a device under test, wherein the device under test is configured to generate the digitally modulated signal.
Priority Applications (2)
| Application Number | Priority Date | Filing Date | Title |
|---|---|---|---|
| EP21174334.9A EP4092430A1 (en) | 2021-05-18 | 2021-05-18 | Data recovery method and measurement instrument |
| US17/730,964 US11846671B2 (en) | 2021-05-18 | 2022-04-27 | Data recovery method and measurement instrument |
Applications Claiming Priority (1)
| Application Number | Priority Date | Filing Date | Title |
|---|---|---|---|
| EP21174334.9A EP4092430A1 (en) | 2021-05-18 | 2021-05-18 | Data recovery method and measurement instrument |
Publications (1)
| Publication Number | Publication Date |
|---|---|
| EP4092430A1 true EP4092430A1 (en) | 2022-11-23 |
Family
ID=76011694
Family Applications (1)
| Application Number | Title | Priority Date | Filing Date |
|---|---|---|---|
| EP21174334.9A Pending EP4092430A1 (en) | 2021-05-18 | 2021-05-18 | Data recovery method and measurement instrument |
Country Status (2)
| Country | Link |
|---|---|
| US (1) | US11846671B2 (en) |
| EP (1) | EP4092430A1 (en) |
Citations (2)
| Publication number | Priority date | Publication date | Assignee | Title |
|---|---|---|---|---|
| US20060251200A1 (en) * | 2005-02-25 | 2006-11-09 | Miller Martin T | Measuring components of jitter |
| US20100246650A1 (en) * | 2009-03-31 | 2010-09-30 | Stefan Erb | Method and Device for Predicting a Figure of Merit From a Distribution |
Family Cites Families (4)
| Publication number | Priority date | Publication date | Assignee | Title |
|---|---|---|---|---|
| US6961317B2 (en) * | 2001-09-28 | 2005-11-01 | Agilent Technologies, Inc. | Identifying and synchronizing permuted channels in a parallel channel bit error rate tester |
| US20060122814A1 (en) * | 2004-12-03 | 2006-06-08 | Beens Jason A | Method and apparatus for digital signal processing analysis and development |
| US9442136B2 (en) | 2013-09-01 | 2016-09-13 | Keysight Technologies, Inc. | Real-time oscilloscope for generating a fast real-time eye diagram |
| US9798848B1 (en) * | 2014-09-02 | 2017-10-24 | Cadence Design Systems, Inc. | Method, system, and computer program product for performing channel analyses for an electronic circuit design including a parallel interface |
-
2021
- 2021-05-18 EP EP21174334.9A patent/EP4092430A1/en active Pending
-
2022
- 2022-04-27 US US17/730,964 patent/US11846671B2/en active Active
Patent Citations (2)
| Publication number | Priority date | Publication date | Assignee | Title |
|---|---|---|---|---|
| US20060251200A1 (en) * | 2005-02-25 | 2006-11-09 | Miller Martin T | Measuring components of jitter |
| US20100246650A1 (en) * | 2009-03-31 | 2010-09-30 | Stefan Erb | Method and Device for Predicting a Figure of Merit From a Distribution |
Non-Patent Citations (3)
| Title |
|---|
| DUAN YAN ET AL: "Accurate jitter decomposition in high-speed links", 2017 IEEE 35TH VLSI TEST SYMPOSIUM (VTS), IEEE, 9 April 2017 (2017-04-09), pages 1 - 6, XP033098036, DOI: 10.1109/VTS.2017.7928918 * |
| MISTRY DEEPAK ET AL: "A novel jitter separation method based on Gaussian mixture model", 2015 INTERNATIONAL CONFERENCE ON PERVASIVE COMPUTING (ICPC), IEEE, 8 January 2015 (2015-01-08), pages 1 - 4, XP032763139, DOI: 10.1109/PERVASIVE.2015.7087091 * |
| WAVECREST CORPORATION: "Understanding Jitter", INTERNET CITATION, 1 January 2001 (2001-01-01), XP002208141, Retrieved from the Internet <URL:http://www.wavecrest.com/technical/VISI_6_Getting_Started_Guides/6understanding.PDF> [retrieved on 20020731] * |
Also Published As
| Publication number | Publication date |
|---|---|
| US20220373596A1 (en) | 2022-11-24 |
| US11846671B2 (en) | 2023-12-19 |
Similar Documents
| Publication | Publication Date | Title |
|---|---|---|
| US20230318887A1 (en) | Clock data recovery with decision feedback equalization | |
| EP1267172B1 (en) | Apparatus and method for spectrum analysis-based serial data jitter measurement | |
| EP1384338B1 (en) | Method and system for decoding multilevel signals | |
| US7254168B2 (en) | Method for decomposing timing jitter on arbitrary serial data sequences | |
| US20110317751A1 (en) | Adaptive equalizer for high-speed serial data | |
| US6898535B2 (en) | Method and apparatus for decomposing signal jitter using multiple acquisitions | |
| EP1554589B1 (en) | Method and apparatus for determining inter-symbol interference for estimating data dependent jitter | |
| EP3334051A2 (en) | Method and system for bi-phase mark coding (bmc) decoding | |
| US20110150060A1 (en) | Voltage Margin Monitoring for an ADC-Based Serializer/Deserializer in Mission Mode | |
| US10958551B2 (en) | Jitter determination method and measurement instrument | |
| US11316768B2 (en) | Bit error rate determination method and measurement instrument | |
| US20240372750A1 (en) | Efficient learning algorithm for channel estimation in wireless communication systems | |
| CN111147411A (en) | A Dynamic Threshold Acquisition Method for Determining Confidence of ADS-B Signal Demodulation Results | |
| JPH06237231A (en) | Waveform discriminating device | |
| US11846671B2 (en) | Data recovery method and measurement instrument | |
| US11012165B2 (en) | Jitter determination method and measurement instrument | |
| US11316506B1 (en) | Signal analysis method and signal analysis module | |
| Fucai et al. | Classification using wavelet packet decomposition and support vector machine for digital modulations | |
| US20210018548A1 (en) | Signal analysis method and measurement instrument | |
| EP3562111B1 (en) | Bit synchronization for on/off key (ook) communication | |
| US11121783B2 (en) | Jitter determination method and measurement instrument | |
| US7379830B2 (en) | Period determination of a periodic NRZ signal | |
| US20260135646A1 (en) | Method, computer program product, and test device for generating a test data set for testing a receiver, and test data set | |
| US12278724B2 (en) | Method and apparatus for estimating frequency offset through accumulating complete frequency deviation values of samples obtained from sampling frequency-modulated repetition-coded segment of packet | |
| US20260135628A1 (en) | Most likelihood sequence estimation on real-time oscilloscopes |
Legal Events
| Date | Code | Title | Description |
|---|---|---|---|
| PUAI | Public reference made under article 153(3) epc to a published international application that has entered the european phase |
Free format text: ORIGINAL CODE: 0009012 |
|
| STAA | Information on the status of an ep patent application or granted ep patent |
Free format text: STATUS: THE APPLICATION HAS BEEN PUBLISHED |
|
| AK | Designated contracting states |
Kind code of ref document: A1 Designated state(s): AL AT BE BG CH CY CZ DE DK EE ES FI FR GB GR HR HU IE IS IT LI LT LU LV MC MK MT NL NO PL PT RO RS SE SI SK SM TR |
|
| STAA | Information on the status of an ep patent application or granted ep patent |
Free format text: STATUS: REQUEST FOR EXAMINATION WAS MADE |
|
| 17P | Request for examination filed |
Effective date: 20230427 |
|
| RBV | Designated contracting states (corrected) |
Designated state(s): AL AT BE BG CH CY CZ DE DK EE ES FI FR GB GR HR HU IE IS IT LI LT LU LV MC MK MT NL NO PL PT RO RS SE SI SK SM TR |
|
| P01 | Opt-out of the competence of the unified patent court (upc) registered |
Effective date: 20230525 |
|
| STAA | Information on the status of an ep patent application or granted ep patent |
Free format text: STATUS: EXAMINATION IS IN PROGRESS |
|
| 17Q | First examination report despatched |
Effective date: 20250228 |