EP4086827A1 - Method for researching resource endowment and economic growth - Google Patents
Method for researching resource endowment and economic growth Download PDFInfo
- Publication number
- EP4086827A1 EP4086827A1 EP21921683.5A EP21921683A EP4086827A1 EP 4086827 A1 EP4086827 A1 EP 4086827A1 EP 21921683 A EP21921683 A EP 21921683A EP 4086827 A1 EP4086827 A1 EP 4086827A1
- Authority
- EP
- European Patent Office
- Prior art keywords
- resource
- structural
- effect
- economic
- growth
- Prior art date
- Legal status (The legal status is an assumption and is not a legal conclusion. Google has not performed a legal analysis and makes no representation as to the accuracy of the status listed.)
- Pending
Links
Images

Classifications
-
- G—PHYSICS
- G06—COMPUTING OR CALCULATING; COUNTING
- G06Q—INFORMATION AND COMMUNICATION TECHNOLOGY [ICT] SPECIALLY ADAPTED FOR ADMINISTRATIVE, COMMERCIAL, FINANCIAL, MANAGERIAL OR SUPERVISORY PURPOSES; SYSTEMS OR METHODS SPECIALLY ADAPTED FOR ADMINISTRATIVE, COMMERCIAL, FINANCIAL, MANAGERIAL OR SUPERVISORY PURPOSES, NOT OTHERWISE PROVIDED FOR
- G06Q10/00—Administration; Management
- G06Q10/06—Resources, workflows, human or project management; Enterprise or organisation planning; Enterprise or organisation modelling
- G06Q10/063—Operations research, analysis or management
- G06Q10/0637—Strategic management or analysis, e.g. setting a goal or target of an organisation; Planning actions based on goals; Analysis or evaluation of effectiveness of goals
-
- G—PHYSICS
- G06—COMPUTING OR CALCULATING; COUNTING
- G06Q—INFORMATION AND COMMUNICATION TECHNOLOGY [ICT] SPECIALLY ADAPTED FOR ADMINISTRATIVE, COMMERCIAL, FINANCIAL, MANAGERIAL OR SUPERVISORY PURPOSES; SYSTEMS OR METHODS SPECIALLY ADAPTED FOR ADMINISTRATIVE, COMMERCIAL, FINANCIAL, MANAGERIAL OR SUPERVISORY PURPOSES, NOT OTHERWISE PROVIDED FOR
- G06Q10/00—Administration; Management
- G06Q10/06—Resources, workflows, human or project management; Enterprise or organisation planning; Enterprise or organisation modelling
- G06Q10/063—Operations research, analysis or management
- G06Q10/0639—Performance analysis of employees; Performance analysis of enterprise or organisation operations
-
- G—PHYSICS
- G06—COMPUTING OR CALCULATING; COUNTING
- G06Q—INFORMATION AND COMMUNICATION TECHNOLOGY [ICT] SPECIALLY ADAPTED FOR ADMINISTRATIVE, COMMERCIAL, FINANCIAL, MANAGERIAL OR SUPERVISORY PURPOSES; SYSTEMS OR METHODS SPECIALLY ADAPTED FOR ADMINISTRATIVE, COMMERCIAL, FINANCIAL, MANAGERIAL OR SUPERVISORY PURPOSES, NOT OTHERWISE PROVIDED FOR
- G06Q10/00—Administration; Management
- G06Q10/06—Resources, workflows, human or project management; Enterprise or organisation planning; Enterprise or organisation modelling
- G06Q10/067—Enterprise or organisation modelling
-
- G—PHYSICS
- G06—COMPUTING OR CALCULATING; COUNTING
- G06Q—INFORMATION AND COMMUNICATION TECHNOLOGY [ICT] SPECIALLY ADAPTED FOR ADMINISTRATIVE, COMMERCIAL, FINANCIAL, MANAGERIAL OR SUPERVISORY PURPOSES; SYSTEMS OR METHODS SPECIALLY ADAPTED FOR ADMINISTRATIVE, COMMERCIAL, FINANCIAL, MANAGERIAL OR SUPERVISORY PURPOSES, NOT OTHERWISE PROVIDED FOR
- G06Q50/00—Information and communication technology [ICT] specially adapted for implementation of business processes of specific business sectors, e.g. utilities or tourism
- G06Q50/02—Agriculture; Fishing; Forestry; Mining
Definitions
- the present disclosure belongs to the field of environmental economy, and particularly relates to a method for studying resource endowments and economic growth.
- an objective of the present disclosure is to provide a method for studying resource endowments and economic growth.
- the natural resource abundance N i is selected from resource reserve data ascertained in Summary of China Mining Industry (Fourth).
- comparative analysis is performed on the structural effect sorting result, the environmental effect sorting result and the integrated growth effect result through a structural equation measuring model.
- Beneficial effects of the present disclosure are as follows: According to the present disclosure, influence paths and multiple effects of natural resources on economic factors are systematically analyzed and deconstructed and complex influence paths of natural resources on economic growth are analyzed from the perspectives of direct influences, indirect influences and overall influences by using the multi-dimensional analysis paradigm of a structural equation, which is of great significance to transforming the economic structure, guaranteeing energy safety and constructing a resource-conserving society.
- Y i denotes economic development level
- N i denotes natural resource abundance
- resource reserve data ascertained in Summary of China Mining Industry is used for measuring natural resource endowments of cities.
- the Summary of China Mining Industry (Fourth) recorded resource reserves of various coal mines from 1929 to 1931, and since then, the resources have supported the start of industrialization and the whole stage of gradual construction of the industrial chain. Therefore, the resource reserves recorded in the Summary of China Mining Industry (Fourth) are used for measuring the modern natural resource abundance, not only because the resources of these two periods are highly correlated, but also because the early data can represent the informal system, conventions and traditions brought about by natural resources.
- the long historical sight distance eliminates the reverse causality that the economy affects the resource reserves, and solves the endogenous problems that may be caused by current reserve data.
- the natural resources include coal, petroleum, non-ferrous metals, etc.
- coal with the growth effect being the most obvious is selected as an alternative variable of the natural resources.
- Coal can better represent natural resources for the following reasons: first, China is a large coal producer, so the records of coal mine data are the most abundant and detailed; second, as the basic energy, coal accounts for about 70% of primary energy; and third, the energy structure strategy of "coal based and diversified development" established during the "Eleventh Five-Year Plan" period continues to this day.
- the locations of coal mines are positioned through the Summary of China Mining Industry (Fourth), longitude and latitude data of each coal mine is collected, the urban center is represented by the location of the municipal government, the distance between each coal mine and the adjacent urban center is measured, and reserves of coal mines 300, 200, 100 and 50 kilometers away from the urban center are calculated.
- the economic development level is measured by two groups of data of the mean value of gross regional domestic products and the logarithm of the mean value of regional gross domestic products of each city from 2001 to 2017, which are from the China City Statistical Yearbook of the corresponding year.
- Table 1 reports benchmark regression results calculated through the least square method. In the above benchmark regression, a linear relationship between coal reserves and economic growth is not significant, which is also one of the reasons why the research on China's resource curses has not been finalized for a long time.
- a structural equation model is used in the present disclosure to describe influence paths of regional natural resource endowments on different dimensions of regional economic growth.
- the structural equation model achieves the purpose of describing multi-dimensional correlation simultaneously by integrating and combining a series of linear equations.
- the logical system of a structural equation can measure the correlation between observable variables and latent variables, and can also quantify the correlation between the latent variables.
- the former is summarized as a measuring model, and the latter is called a structural model.
- formula (2) and formula (3) are measuring models.
- Formula (2) describes endogenous variable
- formula (3) describes exogenous variable.
- y is an endogenous variable containing a p-dimensional column vector
- x is an exogenous variable containing a q-dimensional column vector.
- ⁇ y and ⁇ x are a p ⁇ m coefficient matrix and a q ⁇ n coefficient matrix respectively
- the p-dimensional column vector ⁇ and the q-dimensional column vector ⁇ represent residuals respectively.
- Formula (4) is a structural model, which describes a relationship between exogenous latent variables and endogenous latent variables, and by fixing a variance as 1, the structural model standardizes the latent variables (Jöreskog; Sörbom. 1996).
- ⁇ represents an endogenous latent variable containing an m-dimensional column vector
- ⁇ represents an exogenous latent variable containing an n-dimensional column vector
- B is an m ⁇ m coefficient matrix describing the relationship between the endogenous latent variables
- an m ⁇ n coefficient matrix ⁇ describes the influence of the exogenous latent variables on the endogenous latent variables
- the m-dimensional column vector ⁇ is a residual term.
- Hypothesis 1 to Hypothesis 4 illustrate an action path of natural resources ultimately affecting economic development via the industrial structure, hereinafter referred to as structural effect.
- Hypothesis 1 Hypothesis 5 and Hypothesis 6 describe an action mechanism of natural resources affecting the economy through environmental variables, hereinafter referred to as environmental effect.
- Hypothesis 1 to Hypothesis 6 construct an overall framework of natural resources acting on economic growth, hereinafter referred to as growth effect.
- the above hypotheses construct a one-way noncyclic structural system with resource endowment as the starting point and economic growth as the end point, and its scientificity will be verified in an empirical part, and the influence mechanism may be summarized as FIG. 2 .
- Equation (1) to Equation (4) describe the structural effect
- Equation (1), Equation (5) and Equation (6) describe the environmental effect
- Equation (1) to Equation (6) correspond to the growth effect.
- the influence of the natural resource endowments on the economic growth is as shown in FIG. 2 , and this multi-channel and multi-angle action is summarized into three influence mechanisms of different spans.
- a direct influence that does not involve intermediate variables is called a primary channel, and a structural equation estimator of the primary channel and a standardized value obtained after z-score processing will be reported in the present disclosure.
- an indirect influence that involves one intermediate variable is summarized as a secondary channel, while an overall influence of the resource endowments on the economic growth successively involves two intermediate variables, and is summarized as a tertiary channel.
- the present disclosure deconstructs the association among the direct influence, the indirect influence and the overall influence through matrix operations.
- the present disclosure In order to realize horizontal comparison among the plurality of channels and avoid the impact of different data units, the present disclosure not only reports the direct influence of the primary channel in the structural equation, but also compares the standardized value of the direct influence of the primary channel.
- a z-score method is adopted in the present disclosure to calculate a standardized coefficient, and its economic significance can be interpreted as an influence degree measured by the standard deviation unit (Lomax et al., 2004).
- Formula (11) is a standardized formula
- X i is direct regression coefficient
- X' i is the standardized coefficient.
- an operation mode of the indirect influence and the overall influence may be deduced.
- r > 1 represents the indirect effect.
- t ⁇ i ⁇ j represents an overall effect between an ith exogenous variable and a jth exogenous variable, and p ⁇ i ⁇ j represents an indirect effect between corresponding exogenous variables; and t ⁇ i ⁇ j represents an overall effect of the influence of the jth exogenous variable on an ith endogenous variable, and p ⁇ i ⁇ j represents an indirect effect of the corresponding exogenous variable on the endogenous variable.
- Micro enterprise site selection will be close to the origin of raw materials from the perspective of saving transportation costs, and the macro level is reflected in the attraction and aggregation of the mining industry to the manufacturing industry. Therefore, both the development of the mining industry itself and the radiation of the mining industry to the rest of the secondary industry are reflected in the positive impact of the mining industry on the secondary industry. On the other hand, just because the surroundings of the mining industry are suitable for the expansion of the secondary industry, it has a crowding-out effect on the tertiary industry from the perspectives of space, capital and labor. Therefore, mineral resource endowments have diametrically opposite influences on the secondary industry and the tertiary industry, which constitutes the distinctive feature of "one industry dominating" in resource-based cities.
- the second column to the fourth column of Table 3 report non-standardized coefficients of the structural effect of natural resources
- the second column is direct influence coefficients
- the third column is indirect influence coefficients
- the fourth column is overall influence coefficients with the direct and indirect effects superimposed.
- Direct effect Indirect effect Total effect mine300 ⁇ minin g 0.327 ⁇ 0.255 ⁇ - 0.255 ⁇ mine300 ⁇ se_gd P - - 0.282 ⁇ 0.282 ⁇ mine300 ⁇ te_gdp - - -0.126 ⁇ -0.126 ⁇ mine300 ⁇ gdp - - 5662.483 5662.483 mining ⁇ se_gdp 0.337 ⁇ 1.107 ⁇ - 1.107 ⁇ mining ⁇ te_gdp -0.197 ⁇ -0.496 ⁇ - -0.496 ⁇ mining ⁇ gdp - - 22246.730 22246.730 se gdp ⁇ gdp 0.366 ⁇ 624465.400 ⁇ - 624465.400 ⁇ te gdp ⁇ gdp 0.605 ⁇ 1349642.000 ⁇ - 1349642.000 ⁇ Note: ⁇ , ⁇ and ⁇ denote significance at levels of 1%, 5% and 10% respectively.
- the second column to the fourth column of Table 4 report non-standardized coefficients of the environmental effect
- the second column, the third column and the fourth column are the direct, indirect and overall influence coefficients respectively. It can be seen from the overall influence coefficient that, taking environmental pollution as an intermediate variable, the historical mineral resource reserves and the current mining industry development both have a clear restraining effect on economic growth. Different from the structural effect, in the environmental effect, the resource endowments have a one-way restraining effect on the economic growth. Therefore, the negative effects in the "two sides" of resource exploitation will gradually become prominent with the increase of environmental requirements due to the saturation of ecological carrying capacity.
- Direct effect Indirect effect Total effect mine300 ⁇ mining 0.327 ⁇ 0.255 ⁇ - 0.255 ⁇ mine300 ⁇ so2 dis - - 1844.275 ⁇ 1844.275 ⁇ mine300 ⁇ gdp - -15695.380 ⁇ 15695.380 ⁇ mining ⁇ so2 dis 0.384 ⁇ 7245.777 ⁇ - 7245.777 ⁇ mining ⁇ gdp - - -61663.920 ⁇ 61663.920 ⁇ so2 dis ⁇ gdp -0.032 ⁇ -8.510 ⁇ - -8.510 ⁇ popu ⁇ gdp 0.059 ⁇ 2955.473 ⁇ - 2955.473 ⁇ em ⁇ gdp 0.213 ⁇ 52400.710 ⁇ - 52400.710 ⁇ area u ⁇ gdp 0.250 ⁇ 28966.200 ⁇ - 28066.200 ⁇ indus ⁇ gdp 0.563 ⁇ 0.384 ⁇ - 0.384 ⁇ Note: ⁇ ,
- the growth effect in Table 5 integrates the structural effect and the environmental effect, and embodies all influence paths of resource endowments on economic growth.
- the first column of Table 5 reports standardized path coefficients
- the second column, the third column and the fourth column are non-standardized coefficients of the direct, indirect and overall influences respectively.
- abundant natural resources bring convenience to the mining industry.
- the mining industry significantly restrains the tertiary industry while effectively driving the secondary industry, and the significance of the influence on the overall economy disappears after offsetting the merits and demerits; and as a source of pollution, the mining industry directly restricts the development of economy.
- the statistics in Table 6 measure the goodness of fit of the structural effect, the environmental effect and the growth effect, where Likelihood ratio is a X 2 test on the benchmark model and the saturation model; AIC (Akaike information criterion) represents Akaike information index, and BIC (Bayesian information criterion) represents Bayesian information index; and SRMR (standardized root mean squared residual) is root mean square of standardized residuals.
- AIC Alkaike information criterion
- BIC Bayesian information criterion
- SRMR standardized root mean squared residual
- AIC and BIC indexes of the structural effect have the best goodness of fit, indicating that this influence path is the most significant; the goodness of fit of the environmental effect is slightly weak, indicating that there are differences in the performance of cities in this path; and the growth effect contains the above two effects, with AIC and BIC indexes also showing the strongest residual.
- the growth effect containing the structural effect and the environmental effect is the weakest in terms of accuracy and information quantity, which proves the significance of distinguishing the structural effect and the environmental effect from the perspective of statistics.
- the root mean squares of standardized residuals of the three models shown by the SRMR index are within a reasonable range. Similar to the results of the AIC and BIC indexes, the SRMR index also shows the phenomenon that the residual of the structural effect is the smallest, the residual of the environmental effect is in the middle, and the residual of the growth effect is the largest.
- influence paths and multiple effects of natural resources on economic factors are systematically analyzed and deconstructed and complex influence paths of natural resources on economic growth are analyzed from the perspectives of direct influences, indirect influences and overall influences by using the multi-dimensional analysis paradigm of a structural equation, which is of great significance to transforming the economic structure, guaranteeing energy safety and constructing a resource-conserving society.
- references terms such as "an embodiment”, “an example”, and “a specific example” mean that specific features, structures, materials, or characteristics that are described with reference to the embodiment or the example are included in at least one embodiment or example of the present disclosure.
- schematic descriptions of the foregoing terms do not necessarily point at a same embodiment or example.
- the described specific features, structures, materials, or characteristics may be combined in a proper manner in any one or more of the embodiments or examples.
Landscapes
- Business, Economics & Management (AREA)
- Human Resources & Organizations (AREA)
- Engineering & Computer Science (AREA)
- Strategic Management (AREA)
- Economics (AREA)
- Entrepreneurship & Innovation (AREA)
- Educational Administration (AREA)
- Tourism & Hospitality (AREA)
- Theoretical Computer Science (AREA)
- Marketing (AREA)
- General Physics & Mathematics (AREA)
- General Business, Economics & Management (AREA)
- Development Economics (AREA)
- Physics & Mathematics (AREA)
- Quality & Reliability (AREA)
- Operations Research (AREA)
- Game Theory and Decision Science (AREA)
- Marine Sciences & Fisheries (AREA)
- Agronomy & Crop Science (AREA)
- Animal Husbandry (AREA)
- Life Sciences & Earth Sciences (AREA)
- Mining & Mineral Resources (AREA)
- Health & Medical Sciences (AREA)
- General Health & Medical Sciences (AREA)
- Primary Health Care (AREA)
- Management, Administration, Business Operations System, And Electronic Commerce (AREA)
- Information Retrieval, Db Structures And Fs Structures Therefor (AREA)
Abstract
Description
- The present disclosure belongs to the field of environmental economy, and particularly relates to a method for studying resource endowments and economic growth.
- As an industry connecting natural resources and economic systems, the mining industry, on the one hand, inputs essential energy and resource foundations for economic activities, and on the other hand, also outputs various contaminants and waste. As a region rich in natural endowments, resource-based cities generally show a state of sluggish growth under the tide of industrial structural transformation, and some cities even have "zero growth" or "negative growth" for years. With the saturation of ecological carrying capacity and the enhancement of people's environmental awareness, the development of the mining industry and resource-based cities is in a dilemma. Repeated waves of globalization, abnormal fluctuations in energy prices and poor commodity circulation add difficulties and uncertainties to transformation and development paths of the resource industry. Clarifying the multifaceted role of resource endowments in the social and economic system and analyzing complex influence paths of natural resources on economic growth are of great significance to transforming the economic structure, guaranteeing energy safety and constructing a resource-conserving society.
- Aiming at the deficiency of the prior art, an objective of the present disclosure is to provide a method for studying resource endowments and economic growth.
- The objective of the present disclosure can be achieved through the following technical solutions:
- In a method for studying resource endowments and economic growth, urban resource and economic data are collected, and a structural benchmark model Yi is constructed from independent variables and dependent variables in the collected data;
- a positive correlation relationship between standard deviation units of urban modern resource practitioners and standard deviation units of urban historical resource reserves is obtained through the structural benchmark model Yi, and obtained results are analyzed and sorted to obtain a structural effect sorting result;
- an increase relationship between standard deviation units of urban resource contaminants and the standard deviation units of the urban modern resource practitioners is obtained through the structural benchmark model Yi, and obtained results are analyzed and sorted to obtain an environmental effect sorting result;
- structural effects and environmental effects are integrated, all influence paths of the resource endowments on economic growth are embodied, and obtained results are analyzed and sorted to obtain an overall growth effect result; and
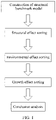
- a relationship between the resource endowments and the economic growth is obtained by performing comparative analysis on the structural effect sorting result, the environmental effect sorting result and an integrated growth effect result, as shown in
FIG. 1 . - In some disclosures, the structural benchmark model Yi is constructed from the independent variables and the dependent variables in the collected data by adopting a least square method, Yi = α + βNi + εi , in the formula, Yi denotes economic development level, and Ni denotes natural resource abundance.
- In some disclosures, the natural resource abundance Ni is selected from resource reserve data ascertained in Summary of China Mining Industry (Fourth).
- In some disclosures, comparative analysis is performed on the structural effect sorting result, the environmental effect sorting result and the integrated growth effect result through a structural equation measuring model.
- Beneficial effects of the present disclosure are as follows:
According to the present disclosure, influence paths and multiple effects of natural resources on economic factors are systematically analyzed and deconstructed and complex influence paths of natural resources on economic growth are analyzed from the perspectives of direct influences, indirect influences and overall influences by using the multi-dimensional analysis paradigm of a structural equation, which is of great significance to transforming the economic structure, guaranteeing energy safety and constructing a resource-conserving society. - To describe the technical solutions in embodiments of the present disclosure or in the prior art more clearly, the following briefly describes accompanying drawings required for describing the embodiments or the prior art. Apparently, a person of ordinary skill in the art may still derive other drawings from these accompanying drawings without creative efforts.
-
FIG. 1 is a schematic flow diagram of an embodiment of the present disclosure; and -
FIG. 2 is a schematic diagram of an influence mechanism of natural resources on economic development according to an embodiment of the present disclosure. - The following clearly and completely describes the technical solutions in the embodiments of the present disclosure with reference to the accompanying drawings in the embodiments of the present disclosure. Apparently, the described embodiments are merely some of the embodiments of the present disclosure rather than all of the embodiments. All other embodiments obtained by a person of ordinary skill in the art based on the embodiments of the present disclosure without creative efforts shall fall within the protection scope of the present disclosure.
- In the present disclosure, characteristic facts of the correlation between natural resources and economic growth are studied at first, and data processing is performed on 4437 sample points in 261 prefecture-level cities from 2001 to 2017 by utilizing STATA15.0.
- In order to investigate the association between independent variables and dependent variables, in the present disclosure, a benchmark model is constructed at first by adopting a least square method (OLS):

- Yi denotes economic development level, and Ni denotes natural resource abundance.
- According to some existing literatures and disclosures, Ding Congming et al. (2018) used dummy variables to describe "whether is a resource-based city", and this method simply described the continuous variable of resource abundance as a discrete variable. Yu Xiangyu et al. (2019) used the consumption of coal, petroleum and natural gas to describe energy endowments, while Bildirici et al. (2019) used precious metal production data to measure precious metal resource endowments of the United States. The above methods have greatly enriched our way of measuring natural resource endowments, but there are also some shortcomings. On the one hand, natural resources are measured from the two perspectives of resource stocks and exploitation flows, and when analyzing the proposition of "resource curse", stock analysis is more appropriate. As a proposition in the long-term development process (Santos & Rafael, 2018; Li Hong and Zou Qing, 2018), resource-restricted poverty is not easy to affect by current or phased resource exploitation flows. The rational expectation for stable incomes of the mining industry brought by the abundant mineral stocks, as well as the subsequent long evolution of the industrial pattern and the formation of path dependence are the key reasons for the occurrence of curses or blessing (Jacquet et al., 2018). Therefore, in the existing literatures, the resource endowments are measured with flow data, which will lead to the measurement error problem. On the other hand, the year-by-year mining of mines will inevitably bring about continuous changes in the stock (You Guangyong et al., 2016), while the strong mining demand in developed regions will bring about endogenous problems, that is, resources will affect economic development, and economic development, in turn, will promote resource mining (Liu Jianfen et al., 2017). Therefore, measuring the resource endowments with data in the observation period in the existing literatures will lead to the endogenous problems due to two-way causality.
- In the present disclosure, for the selection of the natural resource abundance, resource reserve data ascertained in Summary of China Mining Industry (Fourth) is used for measuring natural resource endowments of cities. The Summary of China Mining Industry (Fourth) recorded resource reserves of various coal mines from 1929 to 1931, and since then, the resources have supported the start of industrialization and the whole stage of gradual construction of the industrial chain. Therefore, the resource reserves recorded in the Summary of China Mining Industry (Fourth) are used for measuring the modern natural resource abundance, not only because the resources of these two periods are highly correlated, but also because the early data can represent the informal system, conventions and traditions brought about by natural resources. In addition, the long historical sight distance eliminates the reverse causality that the economy affects the resource reserves, and solves the endogenous problems that may be caused by current reserve data.
- It is worth noting that in terms of the selection of the type of natural resources, the natural resources include coal, petroleum, non-ferrous metals, etc., and in the present disclosure, coal with the growth effect being the most obvious is selected as an alternative variable of the natural resources. Coal can better represent natural resources for the following reasons: first, China is a large coal producer, so the records of coal mine data are the most abundant and detailed; second, as the basic energy, coal accounts for about 70% of primary energy; and third, the energy structure strategy of "coal based and diversified development" established during the "Eleventh Five-Year Plan" period continues to this day.
- According to the present disclosure, the locations of coal mines are positioned through the Summary of China Mining Industry (Fourth), longitude and latitude data of each coal mine is collected, the urban center is represented by the location of the municipal government, the distance between each coal mine and the adjacent urban center is measured, and reserves of coal mines 300, 200, 100 and 50 kilometers away from the urban center are calculated. Consistent with the existing literatures, the economic development level is measured by two groups of data of the mean value of gross regional domestic products and the logarithm of the mean value of regional gross domestic products of each city from 2001 to 2017, which are from the China City Statistical Yearbook of the corresponding year.
- Table 1 reports benchmark regression results calculated through the least square method. In the above benchmark regression, a linear relationship between coal reserves and economic growth is not significant, which is also one of the reasons why the research on China's resource curses has not been finalized for a long time.
Table 1 Benchmark Regression GDP InGDP Coal reserves within 300 kilometers 126156.0 0.0204376 (177315.5) (0.0124531) Coal reserves within 200 kilometers -41455.48 0.0116947 (199836.8) (0.0126160) Coal reserves within 100 kilometers -30034.4 0.0080063 (275293.7) (0.0154329) Coal reserves within 50 kilometers -178313.5 -0.0099357 (344523.4) (0.0186210) Note: ∗∗∗, ∗∗ and ∗ denote significance at levels of 1%, 5% and 10% respectively. In parentheses is a robust standard error of a coefficient. - A structural equation model is used in the present disclosure to describe influence paths of regional natural resource endowments on different dimensions of regional economic growth. As a typical system analysis method, the structural equation model achieves the purpose of describing multi-dimensional correlation simultaneously by integrating and combining a series of linear equations. The logical system of a structural equation can measure the correlation between observable variables and latent variables, and can also quantify the correlation between the latent variables. The former is summarized as a measuring model, and the latter is called a structural model.
- A typical structural equation measuring model consists of a measuring model and a structural model:



- As shown above, formula (2) and formula (3) are measuring models. Formula (2) describes endogenous variable, and formula (3) describes exogenous variable. y is an endogenous variable containing a p-dimensional column vector, and x is an exogenous variable containing a q-dimensional column vector. Λy and Λx are a p × m coefficient matrix and a q × n coefficient matrix respectively, and the p-dimensional column vector ε and the q-dimensional column vector δ represent residuals respectively. Formula (4) is a structural model, which describes a relationship between exogenous latent variables and endogenous latent variables, and by fixing a variance as 1, the structural model standardizes the latent variables (Jöreskog; Sörbom. 1996). η represents an endogenous latent variable containing an m-dimensional column vector, and ξ represents an exogenous latent variable containing an n-dimensional column vector. B is an m × m coefficient matrix describing the relationship between the endogenous latent variables, an m × n coefficient matrix Γ describes the influence of the exogenous latent variables on the endogenous latent variables, and the m-dimensional column vector ζ is a residual term.
- The advantage of adopting the structural equation in the present disclosure is that traditional single linear equations are replaced with simultaneous equations, which can overcome the errors caused by missing influence mechanisms, missing key variables and multicollinearity problems, and a complex influence system among variables is better described; and it is avoided that under the background of rapid industrial upgrading and tighter environmental constraints, the effects of different transmission mechanisms between resources and economy are completely different, and ignoring specific influence paths will affect the accuracy of conclusions because of regression problems, such as compressing a multi-dimensional influence path between resources and growth to a two-dimensional linear equation (Alshehry & Belloumi, 2015; Corrigan, 2014; Sala-i-Martin & Subramanian, 2013; Aleksynska & Havrylchyk, 2013).
- In the present disclosure, the role of resource endowments on the regional economic development level is studied, which involves a plurality of influence paths that are associated with each other and locally overlapped. On the one hand, coal mines, petroleum and other resources, existed as natural factors, are associated with the economic society via the mining industry. On the other hand, the influence of the mining industry on the society includes not only an environmental path with resource consumption and pollution emissions as intermediate variables, but also a structural path with industrial structure adjustment as intermediate variables. Only by comprehensively deconstructing the above multi-dimensional path can the complex relationship between natural resource endowments and economic development be accurately summarized, and the logical framework and theoretical background of different views such as "resource blessing" and "resource curse" be clarified.
- The existing literatures show the multi-dimensional association between resources and economy, and the above structural equation logic framework is adopted in the present disclosure to quantify these channels. In general, an influence mechanism of natural resources on economic development is as follows:
- Hypothesis 1: rich mineral resources are a key factor to promote the development of the mining industry.
- Hypothesis 2: the development of the mining industry will drive the development of the secondary industry via synergy.
- Hypothesis 3: the development of the mining industry will restrain the development of the tertiary industry through a crowding-out effect.
- Hypothesis 4: the development of the secondary industry and the tertiary industry jointly affects economic growth.
- Hypothesis 5: regions with developed mining industry will be accompanied by environmental pollution.
- Hypothesis 6: environmental pollution has constraints on current economic growth.
- Hypothesis 1 to Hypothesis 4 illustrate an action path of natural resources ultimately affecting economic development via the industrial structure, hereinafter referred to as structural effect. Hypothesis 1, Hypothesis 5 and Hypothesis 6 describe an action mechanism of natural resources affecting the economy through environmental variables, hereinafter referred to as environmental effect. Hypothesis 1 to Hypothesis 6 construct an overall framework of natural resources acting on economic growth, hereinafter referred to as growth effect. The above hypotheses construct a one-way noncyclic structural system with resource endowment as the starting point and economic growth as the end point, and its scientificity will be verified in an empirical part, and the influence mechanism may be summarized as
FIG. 2 . - Data of 261 prefecture-level cities or cities above the prefecture level in China are mainly used in the present disclosure. The original data for measuring the natural resource endowments come from the special geological report C species No. 4 (from the 18th to the 20th year of the Republic of China) in the Summary of China Mining Industry (Fourth). Other data representing the concepts of industrial development, environmental pollution, economic growth and the like are from the China Province and Cities Economic Development Yearbook, the China Statistical Yearbook for Regional Economy and the China City Statistical Yearbook. In order to realize the connection of historical data with modern data in the structural equation, balance panel data from 2001 to 2017 is processed as annual means in the present disclosure. Table 2 illustrates operational definitions and statistical descriptions of variables.
Table 2 Operational Definitions and Statistical Descriptions of Variables Variable name Abbreviatio n Operational definition Unit Observed value Mean Standard deviation Minimu m value Maximu m value Economic development level gdp Gross regional domestic product Ten-thousand RMB 4437 1.20E + 07 1.90E+07 179307 2.40E+08 Natural resource abundance mine300 Logarithm of coal mine reserve within three hundred kilometers of city Million tonnes 4437 6.8733 3.898823 0 11.8942 Mining industry development level mining Mining industry practitioner Ten-thousand people 4437 2 3.1721 0 24.39 Secondary industry development level se_gdp Proportions of secondary industry to GDP % 4437 48.6723 1 11.21507 16 91 Tertiary industry development level te_gdp Proportions of tertiary industry to GDP % 4437 36.0691 2 8.362012 9 77.95 Population gross popu Year-end population of city Ten-thousand people 4437 440.084 305.6259 16 3375.2 Employment situation em Regional practitioner Ten-thousand people 4437 47.5874 8 68.82828 4 954 Area of city area_u Area of built-up region Square kilometer s 4437 104.374 2 143.2324 0 1825 Industry development level indus Gross industrial output value above designated size RMB 4437 1.78E + 07 3.20E+07 36179 3.20E+08 Pollution emission so2_dis Emission of industrial sulfur dioxide Ton 4437 63494.9 2 61022.67 2 683162 - According to the research hypotheses of the present disclosure and the influence mechanism described in
FIG. 2 , based on the availability of the prefecture-level statistical data, we abstracted a series of equations based on Hypotheses 1-6 to form a structural equation measuring model. Equation (1) to Equation (4) describe the structural effect; and Equation (1), Equation (5) and Equation (6) describe the environmental effect. Equation (1) to Equation (6) correspond to the growth effect.



- The influence of the natural resource endowments on the economic growth is as shown in
FIG. 2 , and this multi-channel and multi-angle action is summarized into three influence mechanisms of different spans. A direct influence that does not involve intermediate variables is called a primary channel, and a structural equation estimator of the primary channel and a standardized value obtained after z-score processing will be reported in the present disclosure. In addition, according to the different logical chain spans, an indirect influence that involves one intermediate variable is summarized as a secondary channel, while an overall influence of the resource endowments on the economic growth successively involves two intermediate variables, and is summarized as a tertiary channel. The present disclosure deconstructs the association among the direct influence, the indirect influence and the overall influence through matrix operations. - In order to realize horizontal comparison among the plurality of channels and avoid the impact of different data units, the present disclosure not only reports the direct influence of the primary channel in the structural equation, but also compares the standardized value of the direct influence of the primary channel. A z-score method is adopted in the present disclosure to calculate a standardized coefficient, and its economic significance can be interpreted as an influence degree measured by the standard deviation unit (Lomax et al., 2004). Formula (11) is a standardized formula, Xi is direct regression coefficient and X'i is the standardized coefficient.

- Several transmission paths of the resource endowments affecting the economic growth are a link between the past and the future. Therefore, in addition to the direct influence of the primary channel that has not reached a consensus in the literature, the indirect influence of the secondary channel of the mining industry on growth via the environment and industry and the overall influence of resources on economy that integrates all structural equation paths both have the theoretical value and practical significance for study.
- Based on this, the present disclosure will firstly show the direct effect of linear structural equations, and then deconstruct the matrix operations of the indirect effect.

- The above structural equation shows the direct effect, an endogenous variable η is an m-dimensional column vector, an exogenous variable ξ is an n-dimensional column vector, and random error terms are not correlated, i.e., a covariance operator of ζ is 0. Matrix B represents the direct influence of endogenous variables on endogenous variables, Matrix Γ represents the direct influence of exogenous variables on endogenous variables, and the recursion of the model makes B a strict triangular matrix.
- Based on the direct influence described in formula (12), an operation mode of the indirect influence and the overall influence may be deduced. In a total path with a length of r = n (n ∈ N+), the path with r = 1 represents the direct effect, and r > 1 represents the indirect effect. The indirect effect is the sum of related direct effects


- tηiηj represents an overall effect between an ith exogenous variable and a jth exogenous variable, and pηiηj represents an indirect effect between corresponding exogenous variables; and tηiξj represents an overall effect of the influence of the jth exogenous variable on an ith endogenous variable, and pηiξj represents an indirect effect of the corresponding exogenous variable on the endogenous variable.It can be known from formula (12) that the overall effect is:


- Further, the indirect effect may be calculated from formulas (17) and (18):


- It can be known from the above benchmark regression results that the linear relationship between gross regional domestic products and economic growth is not significant, and next, the present disclosure will conduct in-depth analysis of this problem in the form of structural equation. Table 3 to Table 5 describe the structural effect, environmental effect and growth effect of natural resources respectively. Most standardized coefficients can pass a t-test with a significance level of 1%, and a whole system presents better goodness of fit. The mean value of the gross regional domestic products and the logarithm of the mean value of the gross regional domestic products are used for measuring the economic development level, and the logarithm of coal reserves within 300, 200, 100 and 50 kilometers around a city is used for measuring the natural resource abundance, so that an estimation coefficient and significance are both robust. Therefore, we only report estimated results of core variables measured by the mean value of the gross regional domestic products and the logarithm of the coal reserves within 300 kilometers around the city.
- Regression results in Table 3 correspond to the structural effect, which verifies the validity of Hypotheses1-4. The first column of Table 3 reports standardized path coefficients. Firstly, every time the historical coal reserves of a city increase by 1 standard deviation unit, the number of modern mining practitioners increases by 0.327 standard deviation unit, which indicates that regions with abundant mineral resources are more suitable for the development of the mining industry. Secondly, the mining industry drives the secondary industry with a standardized path coefficient of 0.337, and restrains the tertiary industry with a standardized path coefficient of -0.197, thereby affecting the entire industrial structure. On the one hand, as the cornerstone of the secondary industry, the mining industry provides indispensable raw materials and energy for the manufacturing, energy supply and construction industries, although its practitioners account for only 7% of the secondary industry. Micro enterprise site selection will be close to the origin of raw materials from the perspective of saving transportation costs, and the macro level is reflected in the attraction and aggregation of the mining industry to the manufacturing industry. Therefore, both the development of the mining industry itself and the radiation of the mining industry to the rest of the secondary industry are reflected in the positive impact of the mining industry on the secondary industry. On the other hand, just because the surroundings of the mining industry are suitable for the expansion of the secondary industry, it has a crowding-out effect on the tertiary industry from the perspectives of space, capital and labor. Therefore, mineral resource endowments have diametrically opposite influences on the secondary industry and the tertiary industry, which constitutes the distinctive feature of "one industry dominating" in resource-based cities.
- Finally, the proportions of the secondary industry and the tertiary industry can both promote economic growth, and measured by the standardized path coefficient, the influence degrees are 0.366 and 0.605 respectively. So far, empirical data clearly describes the two paths of the structural effect, which are the role of natural resources on economic growth, but the influence directions are opposite. Through horizontal comparison by means of the economic significance of the standardized coefficients, we find that the mining industry has a higher influence degree on the secondary industry than the tertiary industry, but the influence degree of the secondary industry on economic growth is less than that of the tertiary industry. The two influences are indistinguishable from each other in terms of the standardized path coefficient, and therefore, it is necessary to superimpose the direct and indirect effects for overall analysis.
- For the ease of comparison, the second column to the fourth column of Table 3 report non-standardized coefficients of the structural effect of natural resources, the second column is direct influence coefficients, the third column is indirect influence coefficients, and the fourth column is overall influence coefficients with the direct and indirect effects superimposed. By integrating the structural effects reported in Table 3 and calculating overall results after the combination of positive and negative effects, we find that the influences of the historical coal reserves and the modern mining industry on economic growth have the situation of significance disappearance. Based on the results of the direct effects and the indirect effects, it can be seen that the reason for the insignificance is not the lack of influence paths, but a phenomenon after positive and negative transmission mechanisms with similar influence degrees offset each other.
Table 3 Structural Effect Relation standardized Coef. Direct effect Indirect effect Total effect mine300→minin g 0.327∗∗∗ 0.255∗∗∗ - 0.255∗∗∗ mine300→se_gd P - - 0.282∗∗∗ 0.282∗∗∗ mine300→te_gdp - - -0.126∗∗∗ -0.126∗∗∗ mine300→gdp - - 5662.483 5662.483 mining→se_gdp 0.337∗∗∗ 1.107∗∗∗ - 1.107∗∗∗ mining→te_gdp -0.197∗∗∗ -0.496∗∗∗ - -0.496∗∗∗ mining→gdp - - 22246.730 22246.730 se gdp→gdp 0.366∗∗∗ 624465.400∗∗∗ - 624465.400∗∗∗ te gdp→gdp 0.605∗∗∗ 1349642.000∗∗∗ - 1349642.000∗∗∗ Note: ∗∗∗, ∗∗ and ∗ denote significance at levels of 1%, 5% and 10% respectively. - Regression results in Table 4 correspond to the environmental effect, which verifies the validity of Hypothesis 5 and Hypothesis 6. The first column of Table 4 reports standardized path coefficients. Firstly, consistent with the findings in Table 3, the historical coal reserves of a city have a positive influence on the modern mining practitioners. Secondly, every time the mining practitioners increase by 1 standard deviation unit, the sulfur dioxide emission will increase by 0.384 standard deviation unit, that is, a resource mining region is indeed accompanied by more serious pollution. This shows that a mine mining process is still a process of accumulation of ecological arrears, which is still far from the concept of green mines and the goal of reclamation and utilization. Waste, dust and harmful gas produced in the mining process make the surroundings of mines unsuitable for human settlement. Finally, sulfur dioxide emission does have a restrictive effect on economic growth, and its standardized path coefficient is -0.032. On the one hand, nowadays, industrial pollution is serious, and the purification ability of the natural environment to various kinds of pollution is decreasing day by day; and on the other hand, with the improvement of people's living standards, in most regions, earning basic living needs is no longer the primary goal, and the importance of taste and quality of life begins to highlight. Therefore, the mining industry inevitably produces pollution, which is not conducive to the economic development of local and surrounding markets. Different from the accompanying state of "high pollution and high growth" shown by many researches (Xi Penghui et al., 2017; Xia Yong et al., 2017), the present disclosure proves a tight constraint effect of environmental pollution on economic growth by using the multi-dimensional analysis paradigm of the structural equation. At present, such constraint has been presented in the current period and local regions through empirical data, rather than only affecting "our common future" remotely (WCED, 1987).
- The second column to the fourth column of Table 4 report non-standardized coefficients of the environmental effect, and the second column, the third column and the fourth column are the direct, indirect and overall influence coefficients respectively. It can be seen from the overall influence coefficient that, taking environmental pollution as an intermediate variable, the historical mineral resource reserves and the current mining industry development both have a clear restraining effect on economic growth. Different from the structural effect, in the environmental effect, the resource endowments have a one-way restraining effect on the economic growth. Therefore, the negative effects in the "two sides" of resource exploitation will gradually become prominent with the increase of environmental requirements due to the saturation of ecological carrying capacity.
Table 4 Environmental Effect Relation standardized Coef. Direct effect Indirect effect Total effect mine300→mining 0.327∗∗∗ 0.255∗∗∗ - 0.255∗∗∗ mine300→so2 dis - - 1844.275∗∗∗ 1844.275∗∗∗ mine300→gdp - - -15695.380∗∗∗ 15695.380∗∗∗ mining→so2 dis 0.384∗∗∗ 7245.777∗∗∗ - 7245.777∗∗∗ mining→gdp - - -61663.920∗∗∗ 61663.920∗∗∗ so2 dis→gdp -0.032∗∗∗ -8.510∗∗∗ - -8.510∗∗∗ popu→gdp 0.059∗∗∗ 2955.473∗∗∗ - 2955.473∗∗∗ em→gdp 0.213∗∗∗ 52400.710∗∗∗ - 52400.710∗∗∗ area u→gdp 0.250∗∗∗ 28966.200∗∗∗ - 28066.200∗∗∗ indus→gdp 0.563∗∗∗ 0.384∗∗∗ - 0.384∗∗∗ Note: ∗∗∗, ∗∗ and ∗ denote significance at levels of 1%, 5% and 10% respectively. - The growth effect in Table 5 integrates the structural effect and the environmental effect, and embodies all influence paths of resource endowments on economic growth. The first column of Table 5 reports standardized path coefficients, and the second column, the third column and the fourth column are non-standardized coefficients of the direct, indirect and overall influences respectively. Based on the results in Table 3 and Table 4, abundant natural resources bring convenience to the mining industry. As a source of wealth, the mining industry significantly restrains the tertiary industry while effectively driving the secondary industry, and the significance of the influence on the overall economy disappears after offsetting the merits and demerits; and as a source of pollution, the mining industry directly restricts the development of economy. The industrial structural effect to measure wealth and the environmental effect to measure pollution are integrated in Table 5, with the negative effect of resource endowments on economic growth under positive and negative offsetting.
Table 5 Growth Effect Relation standardized Coef. Direct effect Indirect effect Total effect mine300→mining 0.327∗∗∗ 0.255∗∗∗ - 0.255∗∗∗ mine300→so2 dis - - 1844.274∗∗∗ 1844.275∗∗∗ mine300→se gdp - - 0.282∗∗∗ 0.282∗∗∗ mine300→te gdp - - -0.126∗∗∗ -0.126∗∗∗ mine300→gdp - - - - 19152.440∗∗∗ 19152.440∗∗∗ mining→so2 dis 0.384∗∗∗ 7245.777∗∗∗ - 7245.777∗∗∗ mining→se gdp 0.337∗∗∗ 1.107∗∗∗ - 1.107∗∗∗ mining→te_gdp -0.197∗∗∗ -0.496∗∗∗ - -0.496∗∗∗ mining→gdp - - - 75246.040∗∗∗ 75246.040∗∗∗ so2 dis→gdp -0.032∗∗∗ -8.269∗∗∗ - -8.269∗∗∗ se gdp→gdp 0.004 6447.117 - 6447.117 te gdp→gdp 0.023 45319.180 - 45319.180 popu→gdp 0.062∗∗∗ 3128.418∗∗∗ - 3128.418∗∗∗ em→gdp 0.217∗∗∗ 52685.470∗∗∗ - 52685.470∗∗∗ area u→gdp 0.235∗∗∗ 26891.850∗∗∗ - 26891.850∗∗∗ indus→gdp 0.572∗∗∗ 0.350∗∗∗ - 0.350∗∗∗ Note: ∗∗∗, ∗∗ and ∗ denote significance at levels of 1%, 5% and 10% respectively. - Through the deconstruction and reconstruction of a plurality of channels, we have made clear the role of natural resources in economic development, and clarify the "paradox" that the development of the mining industry leads to slow economic growth. On the one hand, when evaluating the role of natural resources within the national economic accounting system, it often comes to the conclusion that the influence is not significant, but this "neutral" conclusion is just the superposition of "curse" and "blessing". So far, we can explain the common "resource neutrality theory" and "mixed conclusion" (Daniel, 2008; Davis, 1995) in resource economics. Under the framework of the growth effect, focusing on different influence paths will lead to very different research results. The present disclosure adopts a systematic and global perspective to decompose and combine different influence paths in resource economics, and comes to the conclusion that the positive and negative effects of natural resources coexist, but the negative effects are more obvious.
- The statistics in Table 6 measure the goodness of fit of the structural effect, the environmental effect and the growth effect, where Likelihood ratio is a X2 test on the benchmark model and the saturation model; AIC (Akaike information criterion) represents Akaike information index, and BIC (Bayesian information criterion) represents Bayesian information index; and SRMR (standardized root mean squared residual) is root mean square of standardized residuals. In general, the fitting degree of the model is better, which indicates that the setting of the structural equation is scientific, and the rules described by the empirical data are consistent with expectations.
- A P value of the X2 test in the Likelihood ratio presented in Table 6 is close to zero, indicating that the goodness of fit of the structural effect, the environmental effect and the growth effect is significantly better than corresponding benchmark models, and the use of the structural equation to deconstruct these three influence paths conforms to the objective law.
- By comparing the goodness of fit between AIC and BIC index models, we find that AIC and BIC indexes of the structural effect have the best goodness of fit, indicating that this influence path is the most significant; the goodness of fit of the environmental effect is slightly weak, indicating that there are differences in the performance of cities in this path; and the growth effect contains the above two effects, with AIC and BIC indexes also showing the strongest residual. The growth effect containing the structural effect and the environmental effect is the weakest in terms of accuracy and information quantity, which proves the significance of distinguishing the structural effect and the environmental effect from the perspective of statistics.
- The root mean squares of standardized residuals of the three models shown by the SRMR index are within a reasonable range. Similar to the results of the AIC and BIC indexes, the SRMR index also shows the phenomenon that the residual of the structural effect is the smallest, the residual of the environmental effect is in the middle, and the residual of the growth effect is the largest.
Table 6 Test of Goodness of Fit Goodness of fit index Fitting statistics Fitting statistic value Structural effect Environmenta l effect Growth effect Likelihood ratio chi2 bs 259.800 1256.721 1652.566 p > chi2 0.000 0.000 0.000 Information criteria AIC 15723.475 36148.405 39849.23 4 BIC 15751.991 36173.357 39881.31 5 Size of residuals SRMR 0.131 0.168 0.197 - According to the present disclosure, influence paths and multiple effects of natural resources on economic factors are systematically analyzed and deconstructed and complex influence paths of natural resources on economic growth are analyzed from the perspectives of direct influences, indirect influences and overall influences by using the multi-dimensional analysis paradigm of a structural equation, which is of great significance to transforming the economic structure, guaranteeing energy safety and constructing a resource-conserving society.
- In the descriptions of this specification, descriptions of reference terms such as "an embodiment", "an example", and "a specific example" mean that specific features, structures, materials, or characteristics that are described with reference to the embodiment or the example are included in at least one embodiment or example of the present disclosure. In this specification, schematic descriptions of the foregoing terms do not necessarily point at a same embodiment or example. In addition, the described specific features, structures, materials, or characteristics may be combined in a proper manner in any one or more of the embodiments or examples.
- The foregoing displays and describes basic principles, main features of the present disclosure and advantages of the present disclosure. A person skilled in the art may understand that the present disclosure is not limited to the foregoing embodiments. Descriptions in the embodiments and this specification only illustrate the principles of the present disclosure. Various modifications and improvements are made in the present disclosure without departing from the spirit and the scope of the present disclosure, and these modifications and improvements shall fall within the protection scope of the present disclosure.
Claims (4)
- A method for studying resource endowments and economic growth, wherein urban resource and economic data are collected, and a structural benchmark model Yi is constructed from independent variables and dependent variables in the collected data;a positive correlation relationship between standard deviation units of urban modern resource practitioners and standard deviation units of urban historical resource reserves is obtained through the structural benchmark model Yi, and obtained results are analyzed and sorted to obtain a structural effect sorting result;an increase relationship between standard deviation units of urban resource contaminants and the standard deviation units of the urban modern resource practitioners is obtained through the structural benchmark model Yi, and obtained results are analyzed and sorted to obtain an environmental effect sorting result;structural effects and environmental effects are integrated, all influence paths of the resource endowments on economic growth are embodied, and obtained results are analyzed and sorted to obtain an overall growth effect result; anda relationship between the resource endowments and the economic growth is obtained by performing comparative analysis on the structural effect sorting result, the environmental effect sorting result and an integrated growth effect result.
- The method for studying resource endowments and economic growth according to claim 1, wherein the structural benchmark model Yi is constructed from the independent variables and the dependent variables in the collected data by adopting a least square method, Yi = α + βNi + εi , in the formula, Yi denotes economic development level, and Ni denotes natural resource abundance.
- The method for studying resource endowments and economic growth according to claim 1, wherein the natural resource abundance Ni is selected from resource reserve data ascertained in Summary of China Mining Industry (Fourth).
- The method for studying resource endowments and economic growth according to claim 1, wherein comparative analysis is performed on the structural effect sorting result, the environmental effect sorting result and the integrated growth effect result through a structural equation measuring model.
Applications Claiming Priority (2)
| Application Number | Priority Date | Filing Date | Title |
|---|---|---|---|
| CN202110251641.4A CN112862357A (en) | 2021-03-08 | 2021-03-08 | Method for researching natural endowment and economic growth |
| PCT/CN2021/090731 WO2022188251A1 (en) | 2021-03-08 | 2021-04-28 | Method for researching resource endowment and economic growth |
Publications (2)
| Publication Number | Publication Date |
|---|---|
| EP4086827A1 true EP4086827A1 (en) | 2022-11-09 |
| EP4086827A4 EP4086827A4 (en) | 2024-06-26 |
Family
ID=75994805
Family Applications (1)
| Application Number | Title | Priority Date | Filing Date |
|---|---|---|---|
| EP21921683.5A Pending EP4086827A4 (en) | 2021-03-08 | 2021-04-28 | METHODS FOR EXAMINING RESOURCE ALLOCATION AND ECONOMIC GROWTH |
Country Status (3)
| Country | Link |
|---|---|
| EP (1) | EP4086827A4 (en) |
| CN (1) | CN112862357A (en) |
| WO (1) | WO2022188251A1 (en) |
Family Cites Families (3)
| Publication number | Priority date | Publication date | Assignee | Title |
|---|---|---|---|---|
| US20140095263A1 (en) * | 2011-08-12 | 2014-04-03 | Mcalister Technologies, Llc | Comprehensive cost modeling of sustainably autogenous systems and processes for the production of energy, material resources and nutrient regimes |
| CN110782133A (en) * | 2019-09-30 | 2020-02-11 | 华北水利水电大学 | Construction method of ecological CGE model |
| CN111861226A (en) * | 2020-07-24 | 2020-10-30 | 郑州大学 | An Evaluation Method for Sustainable Economic Growth under Energy-Environment Constraints |
-
2021
- 2021-03-08 CN CN202110251641.4A patent/CN112862357A/en active Pending
- 2021-04-28 WO PCT/CN2021/090731 patent/WO2022188251A1/en not_active Ceased
- 2021-04-28 EP EP21921683.5A patent/EP4086827A4/en active Pending
Also Published As
| Publication number | Publication date |
|---|---|
| CN112862357A (en) | 2021-05-28 |
| WO2022188251A1 (en) | 2022-09-15 |
| EP4086827A4 (en) | 2024-06-26 |
Similar Documents
| Publication | Publication Date | Title |
|---|---|---|
| Guo et al. | Analyzing the synergistic influence of green credit and green technology innovation in driving the Low-Carbon transition of the energy consumption structure | |
| Zhang et al. | Can green credit policy improve the overseas investment efficiency of enterprises in China? | |
| Huang | The comprehensive environmental efficiency analysis based on a new data envelopment analysis: The super slack based measure network three-stage data envelopment analysis approach | |
| Wang et al. | The potential impacts of Carbon Border Adjustment Mechanism (CBAM) on China's high-carbon industries | |
| Wang et al. | Explaining the transmission mechanism of social-ecological systems adaptive cycling on path dependency in resource-based cities: Evidence from Shanxi Province, China | |
| WO2022188251A1 (en) | Method for researching resource endowment and economic growth | |
| CN119761867A (en) | Construction of energy power indicator system, method and device for determining energy power index | |
| Ding et al. | Green finance and China’s industrial transformation: Pathways and pitfalls | |
| Crawford et al. | Establishing a comprehensive database of construction material environmental flow coefficients for Australia | |
| Yao et al. | Evaluation of Regional Eco-Efficiency and Improvement Paths in the Yangtze River Economic Belt under the “Double Carbon” Target | |
| Lv et al. | Can Public Data Opening Improve Green Total Factor Productivity?—A Quasi‐Natural Experiment Based on the Opening of Chinese Government Public Data Platforms | |
| Dia et al. | Relative performance evaluation of Ontario's sawmills with bootstrap DEA | |
| Wang et al. | The Geography of Value Capture: Mega-Infrastructure Reshapes Firm Sourcing, Domestic Value Added, and Competitiveness Gains | |
| Cheng et al. | The impact of ESG performance on TFP: the role of government subsidies and industrial policies | |
| Baek et al. | Developing a multivariate time-series model to forecast the level of competition in transportation projects | |
| Zhang et al. | Leveraging Public Data Access for Synergistic Haze Reduction and Carbon Mitigation: Evidence from China's Open Government Data Initiative | |
| Bonaparte | How Robot Adoption Impacts Stock Market Outcomes | |
| Tang et al. | Multiple Regression Analysis of the Relationship between Corporate Economic Efficiency and Financial Structure. | |
| Wang et al. | Research on an Ecological Benefit Calculation Model for Mine Restoration Based on Deep Learning and DEA | |
| Hassan | Industrial Production and Carbon Emissions: A Comparative Analysis of Selected Arab and European Countries (1990–2023) | |
| Zareia et al. | Iranian Journal of Economic Studies | |
| Guo et al. | Environmental Efficiency Evaluation and Convergence Analysis of Provinces along" the Belt and Road" Based on SBM-Undesirable Model. | |
| Jia et al. | Measurement of air logistics efficiency in western China | |
| Ramadan et al. | Support Vector Auto-Regression and Neural Network for Prediction of Construction Stock Prices in Egypt | |
| Guan et al. | How artificial intelligence and environmental regulation influence the efficiency of the circular economy in the context of sustainable development |
Legal Events
| Date | Code | Title | Description |
|---|---|---|---|
| STAA | Information on the status of an ep patent application or granted ep patent |
Free format text: STATUS: UNKNOWN |
|
| STAA | Information on the status of an ep patent application or granted ep patent |
Free format text: STATUS: THE INTERNATIONAL PUBLICATION HAS BEEN MADE |
|
| PUAI | Public reference made under article 153(3) epc to a published international application that has entered the european phase |
Free format text: ORIGINAL CODE: 0009012 |
|
| STAA | Information on the status of an ep patent application or granted ep patent |
Free format text: STATUS: REQUEST FOR EXAMINATION WAS MADE |
|
| 17P | Request for examination filed |
Effective date: 20220805 |
|
| AK | Designated contracting states |
Kind code of ref document: A1 Designated state(s): AL AT BE BG CH CY CZ DE DK EE ES FI FR GB GR HR HU IE IS IT LI LT LU LV MC MK MT NL NO PL PT RO RS SE SI SK SM TR |
|
| DAV | Request for validation of the european patent (deleted) | ||
| DAX | Request for extension of the european patent (deleted) | ||
| RIC1 | Information provided on ipc code assigned before grant |
Ipc: G06Q 10/06 20120101AFI20240515BHEP |
|
| A4 | Supplementary search report drawn up and despatched |
Effective date: 20240527 |
|
| RIC1 | Information provided on ipc code assigned before grant |
Ipc: G06Q 10/06 20120101AFI20240521BHEP |