EP4068155A1 - Systems and methods for identifying manufacturing defects - Google Patents
Systems and methods for identifying manufacturing defects Download PDFInfo
- Publication number
- EP4068155A1 EP4068155A1 EP22158093.9A EP22158093A EP4068155A1 EP 4068155 A1 EP4068155 A1 EP 4068155A1 EP 22158093 A EP22158093 A EP 22158093A EP 4068155 A1 EP4068155 A1 EP 4068155A1
- Authority
- EP
- European Patent Office
- Prior art keywords
- data
- machine learning
- training
- learning model
- product
- Prior art date
- Legal status (The legal status is an assumption and is not a legal conclusion. Google has not performed a legal analysis and makes no representation as to the accuracy of the status listed.)
- Pending
Links
Images



Classifications
-
- G—PHYSICS
- G05—CONTROLLING; REGULATING
- G05B—CONTROL OR REGULATING SYSTEMS IN GENERAL; FUNCTIONAL ELEMENTS OF SUCH SYSTEMS; MONITORING OR TESTING ARRANGEMENTS FOR SUCH SYSTEMS OR ELEMENTS
- G05B23/00—Testing or monitoring of control systems or parts thereof
- G05B23/02—Electric testing or monitoring
- G05B23/0205—Electric testing or monitoring by means of a monitoring system capable of detecting and responding to faults
- G05B23/0259—Electric testing or monitoring by means of a monitoring system capable of detecting and responding to faults characterized by the response to fault detection
- G05B23/0275—Fault isolation and identification, e.g. classify fault; estimate cause or root of failure
-
- G—PHYSICS
- G06—COMPUTING OR CALCULATING; COUNTING
- G06V—IMAGE OR VIDEO RECOGNITION OR UNDERSTANDING
- G06V10/00—Arrangements for image or video recognition or understanding
- G06V10/70—Arrangements for image or video recognition or understanding using pattern recognition or machine learning
- G06V10/77—Processing image or video features in feature spaces; using data integration or data reduction, e.g. principal component analysis [PCA] or independent component analysis [ICA] or self-organising maps [SOM]; Blind source separation
- G06V10/774—Generating sets of training patterns; Bootstrap methods, e.g. bagging or boosting
-
- G—PHYSICS
- G05—CONTROLLING; REGULATING
- G05B—CONTROL OR REGULATING SYSTEMS IN GENERAL; FUNCTIONAL ELEMENTS OF SUCH SYSTEMS; MONITORING OR TESTING ARRANGEMENTS FOR SUCH SYSTEMS OR ELEMENTS
- G05B19/00—Program-control systems
- G05B19/02—Program-control systems electric
- G05B19/418—Total factory control, i.e. centrally controlling a plurality of machines, e.g. direct or distributed numerical control [DNC], flexible manufacturing systems [FMS], integrated manufacturing systems [IMS] or computer integrated manufacturing [CIM]
- G05B19/41875—Total factory control, i.e. centrally controlling a plurality of machines, e.g. direct or distributed numerical control [DNC], flexible manufacturing systems [FMS], integrated manufacturing systems [IMS] or computer integrated manufacturing [CIM] characterised by quality surveillance of production
-
- G—PHYSICS
- G05—CONTROLLING; REGULATING
- G05B—CONTROL OR REGULATING SYSTEMS IN GENERAL; FUNCTIONAL ELEMENTS OF SUCH SYSTEMS; MONITORING OR TESTING ARRANGEMENTS FOR SUCH SYSTEMS OR ELEMENTS
- G05B23/00—Testing or monitoring of control systems or parts thereof
- G05B23/02—Electric testing or monitoring
- G05B23/0205—Electric testing or monitoring by means of a monitoring system capable of detecting and responding to faults
- G05B23/0218—Electric testing or monitoring by means of a monitoring system capable of detecting and responding to faults characterised by the fault detection method dealing with either existing or incipient faults
- G05B23/0224—Process history based detection method, e.g. whereby history implies the availability of large amounts of data
- G05B23/0227—Qualitative history assessment, whereby the type of data acted upon, e.g. waveforms, images or patterns, is not relevant, e.g. rule based assessment; if-then decisions
- G05B23/0235—Qualitative history assessment, whereby the type of data acted upon, e.g. waveforms, images or patterns, is not relevant, e.g. rule based assessment; if-then decisions based on a comparison with predetermined threshold or range, e.g. "classical methods", carried out during normal operation; threshold adaptation or choice; when or how to compare with the threshold
-
- G—PHYSICS
- G05—CONTROLLING; REGULATING
- G05B—CONTROL OR REGULATING SYSTEMS IN GENERAL; FUNCTIONAL ELEMENTS OF SUCH SYSTEMS; MONITORING OR TESTING ARRANGEMENTS FOR SUCH SYSTEMS OR ELEMENTS
- G05B23/00—Testing or monitoring of control systems or parts thereof
- G05B23/02—Electric testing or monitoring
- G05B23/0205—Electric testing or monitoring by means of a monitoring system capable of detecting and responding to faults
- G05B23/0218—Electric testing or monitoring by means of a monitoring system capable of detecting and responding to faults characterised by the fault detection method dealing with either existing or incipient faults
- G05B23/0243—Electric testing or monitoring by means of a monitoring system capable of detecting and responding to faults characterised by the fault detection method dealing with either existing or incipient faults model based detection method, e.g. first-principles knowledge model
-
- G—PHYSICS
- G06—COMPUTING OR CALCULATING; COUNTING
- G06F—ELECTRIC DIGITAL DATA PROCESSING
- G06F18/00—Pattern recognition
- G06F18/20—Analysing
- G06F18/21—Design or setup of recognition systems or techniques; Extraction of features in feature space; Blind source separation
- G06F18/214—Generating training patterns; Bootstrap methods, e.g. bagging or boosting
-
- G—PHYSICS
- G06—COMPUTING OR CALCULATING; COUNTING
- G06F—ELECTRIC DIGITAL DATA PROCESSING
- G06F18/00—Pattern recognition
- G06F18/20—Analysing
- G06F18/24—Classification techniques
- G06F18/241—Classification techniques relating to the classification model, e.g. parametric or non-parametric approaches
- G06F18/2413—Classification techniques relating to the classification model, e.g. parametric or non-parametric approaches based on distances to training or reference patterns
-
- G—PHYSICS
- G06—COMPUTING OR CALCULATING; COUNTING
- G06N—COMPUTING ARRANGEMENTS BASED ON SPECIFIC COMPUTATIONAL MODELS
- G06N20/00—Machine learning
-
- G—PHYSICS
- G06—COMPUTING OR CALCULATING; COUNTING
- G06N—COMPUTING ARRANGEMENTS BASED ON SPECIFIC COMPUTATIONAL MODELS
- G06N3/00—Computing arrangements based on biological models
- G06N3/02—Neural networks
- G06N3/04—Architecture, e.g. interconnection topology
- G06N3/0464—Convolutional networks [CNN, ConvNet]
-
- G—PHYSICS
- G06—COMPUTING OR CALCULATING; COUNTING
- G06N—COMPUTING ARRANGEMENTS BASED ON SPECIFIC COMPUTATIONAL MODELS
- G06N3/00—Computing arrangements based on biological models
- G06N3/02—Neural networks
- G06N3/08—Learning methods
-
- G—PHYSICS
- G06—COMPUTING OR CALCULATING; COUNTING
- G06N—COMPUTING ARRANGEMENTS BASED ON SPECIFIC COMPUTATIONAL MODELS
- G06N3/00—Computing arrangements based on biological models
- G06N3/02—Neural networks
- G06N3/08—Learning methods
- G06N3/088—Non-supervised learning, e.g. competitive learning
-
- G—PHYSICS
- G06—COMPUTING OR CALCULATING; COUNTING
- G06N—COMPUTING ARRANGEMENTS BASED ON SPECIFIC COMPUTATIONAL MODELS
- G06N3/00—Computing arrangements based on biological models
- G06N3/02—Neural networks
- G06N3/08—Learning methods
- G06N3/0895—Weakly supervised learning, e.g. semi-supervised or self-supervised learning
-
- G—PHYSICS
- G06—COMPUTING OR CALCULATING; COUNTING
- G06N—COMPUTING ARRANGEMENTS BASED ON SPECIFIC COMPUTATIONAL MODELS
- G06N3/00—Computing arrangements based on biological models
- G06N3/02—Neural networks
- G06N3/08—Learning methods
- G06N3/09—Supervised learning
-
- G—PHYSICS
- G06—COMPUTING OR CALCULATING; COUNTING
- G06N—COMPUTING ARRANGEMENTS BASED ON SPECIFIC COMPUTATIONAL MODELS
- G06N3/00—Computing arrangements based on biological models
- G06N3/02—Neural networks
- G06N3/08—Learning methods
- G06N3/0985—Hyperparameter optimisation; Meta-learning; Learning-to-learn
-
- G—PHYSICS
- G06—COMPUTING OR CALCULATING; COUNTING
- G06N—COMPUTING ARRANGEMENTS BASED ON SPECIFIC COMPUTATIONAL MODELS
- G06N5/00—Computing arrangements using knowledge-based models
- G06N5/04—Inference or reasoning models
-
- G—PHYSICS
- G05—CONTROLLING; REGULATING
- G05B—CONTROL OR REGULATING SYSTEMS IN GENERAL; FUNCTIONAL ELEMENTS OF SUCH SYSTEMS; MONITORING OR TESTING ARRANGEMENTS FOR SUCH SYSTEMS OR ELEMENTS
- G05B2219/00—Program-control systems
- G05B2219/30—Nc systems
- G05B2219/32—Operator till task planning
- G05B2219/32193—Ann, neural base quality management
-
- G—PHYSICS
- G06—COMPUTING OR CALCULATING; COUNTING
- G06F—ELECTRIC DIGITAL DATA PROCESSING
- G06F18/00—Pattern recognition
- G06F18/20—Analysing
- G06F18/23—Clustering techniques
-
- G—PHYSICS
- G06—COMPUTING OR CALCULATING; COUNTING
- G06N—COMPUTING ARRANGEMENTS BASED ON SPECIFIC COMPUTATIONAL MODELS
- G06N3/00—Computing arrangements based on biological models
- G06N3/02—Neural networks
- G06N3/04—Architecture, e.g. interconnection topology
- G06N3/045—Combinations of networks
-
- G—PHYSICS
- G06—COMPUTING OR CALCULATING; COUNTING
- G06V—IMAGE OR VIDEO RECOGNITION OR UNDERSTANDING
- G06V10/00—Arrangements for image or video recognition or understanding
- G06V10/70—Arrangements for image or video recognition or understanding using pattern recognition or machine learning
- G06V10/764—Arrangements for image or video recognition or understanding using pattern recognition or machine learning using classification, e.g. of video objects
-
- G—PHYSICS
- G06—COMPUTING OR CALCULATING; COUNTING
- G06V—IMAGE OR VIDEO RECOGNITION OR UNDERSTANDING
- G06V2201/00—Indexing scheme relating to image or video recognition or understanding
- G06V2201/06—Recognition of objects for industrial automation
Definitions
- One or more aspects of embodiments according to the present disclosure relate to classifiers, and more particularly to a machine-leaming (ML) classifiers for identifying manufacturing defects that use a two-pass approach to filter out low confident data samples.
- ML machine-leaming
- An embodiment of the present disclosure is directed to a method for classifying manufacturing defects.
- a first data sample satisfying a first criterion is identified from a training dataset, and the first data sample is removed from the training dataset.
- a filtered training dataset including a second data sample is output.
- a first machine learning model is trained with the filtered training dataset.
- a second machine learning model is trained based on at least one of the first data sample or the second data sample.
- Product data associated with a manufactured product is received, and the second machine learning model is invoked for predicting confidence of the product data.
- the first machine learning model is invoked for generating a classification based the product data.
- the method of the invention may be computer implemented.
- the first criterion is a confidence level below a set threshold.
- the second data sample is associated with a confidence level above a set threshold.
- the training of the second machine learning model includes invoking unsupervised learning based on the second data sample, wherein the second data sample is associated with a particular class.
- the training of the second machine learning model includes: identifying a cluster associated with the particular class; and tuning a boundary of the cluster based on a tuning threshold, wherein the first machine learning model is invoked for generating the classification in response to determining that the product data is within the boundary of the cluster.
- the training of the second machine learning model includes invoking supervised learning based on the first and second data samples, wherein the first data sample is identified as a first type of data, and the second data sample is identified as a second type of data.
- the training of the second machine learning model includes: identifying a decision boundary for separating the first type of data from a second type of data; and tuning the decision boundary based on a tuning threshold, wherein the first machine learning model is invoked for generating the classification in response to determining that the product data belongs to the second type of data.
- the method for classifying manufacturing defects includes: identifying second product data associated with a second manufactured product; invoking the second machine learning model for predicting confidence of the second product data; and rejecting the second product data based on the confidence of the second product data.
- the method for classifying manufacturing defects further includes generating a signal based on the classification, wherein the signal is for triggering an action.
- An embodiment of the present disclosure is also directed to a system for classifying manufacturing defects.
- the system includes a processor and memory.
- the memory has stored therein instructions that, when executed by the processor, cause the processor to: identify, from a training dataset, a first data sample satisfying a first criterion; remove, from the training dataset, the first data sample and outputting a filtered training dataset including a second data sample; train a first machine learning model with the filtered training dataset; train a second machine learning model based on at least one of the first data sample or the second data sample; receive product data associated with a manufactured product; invoke the second machine learning model for predicting confidence of the product data; and in response to predicting the confidence of the product data, invoke the first machine learning model for generating a classification based the product data.
- An embodiment of the present disclosure is further directed to a system for classifying manufacturing defects.
- the system includes a data collection circuit configured to collect an input dataset, and a processing circuit coupled to the data collection circuit.
- the processing circuit has logic for: identifying, from a training dataset, a first data sample satisfying a first criterion; removing, from the training dataset, the first data sample and outputting a filtered training dataset including a second data sample; training a first machine learning model with the filtered training dataset; training a second machine learning model based on at least one of the first data sample or the second data sample; receiving product data associated with a manufactured product; invoking the second machine learning model for predicting confidence of the product data; and in response to predicting the confidence of the product data, invoking the first machine learning model for generating a classification based the product data.
- One way to monitor for manufacturing defects is by employing human inspectors that have the expertise to identify the defects.
- high-resolution (sub-micron level) images may be acquired around defect areas.
- a human inspector may then review the acquired images to classify the defects into categories in accordance with the type of the defects and how the defects may affect the production yield.
- the human inspector may sample a number of defect images and spend significant time searching for features to separate unclassified defect images into categories. Training the human inspectors, however, takes time. Even when trained, it may take weeks for a human inspector to identify manufacturing defects in a current batch of images, making it hard to expand the human inspector's work to multiple instances at a time.
- Machine learning (ML) models may be used for quicker detection of manufacturing defects that may be expanded to multiple instances at a time. In order for such ML models to be useful, however, they should be accurate in their predictions. In addition, the models should be generalized so that accurate predictions may be made even on new data sets that have not been encountered previously.
- One such factor may be erroneous labeling of training data, referred to as label noise.
- the erroneous labels may be due, for instance, to human error.
- an image used for training may be labeled as depicting a type of manufacturing defect when in fact, no such defect exists, or, even if the defect does exist, the type of defect identified by the human person is erroneous.
- an ML model is trained using erroneous labels, the accuracy of predictions by the ML model is reduced.
- Another issue that may arise in using ML models is due to the small dataset that is often used to train the models.
- the sparse training dataset relative to the high dimensionality of the data may lead to overfitting of the model.
- erroneously labeled data may not be rejected, but learned by the model. This may lead to predictions being made during deployment based on the erroneously labeled data, causing the model to perform poorly on new, unseen data.
- embodiments of the present disclosure are directed to identifying manufacturing defects using deep learning ML models.
- a two-stage approach is used to filter out unconfident (also referred to as noisy) data.
- data samples with noisy labels in a training dataset may be removed for training a first ML model (referred to as a defect detection model) so that the defect detection model is trained using confident (also referred to as clean) training data samples.
- the clean and noisy data may then be used to train a second deep learning ML model (referred to as an outlier detection model or outlier filter) that is used during deployment to filter out unconfident/noisy data samples. This may ensure that the data to be predicted by the defect detection model falls in a high-confident prediction area, improving the accuracy of predictions by the defect detection model.
- a boundary that is used by the outlier filter to filter out unconfident data is tuned using a tuning threshold hyperparameter.
- the threshold hyperparameter may be determined upon considering a tradeoff between a rejection rate (or amount of coverage of the data), and the accuracy of the prediction by the defect detection model. In one embodiment, accuracy of the prediction increases when coverage decreases. In this regard, the threshold hyperparameter may be selected based on identification of current requirements in terms of accuracy and/or coverage.
- FIG. 1 is a block diagram of a system for making predictions relating to products manufactured via a manufacturing process according to one embodiment.
- the system includes, without limitations, one or more data collection circuits 100, and an analysis system 102.
- the data collection circuits 100 may include, for example, one or more imaging systems configured to acquire image data of a product during a manufacturing process such as, for example, X-ray machines, Magnetic Resonance Imaging (MRI) machines, Transmission Electron Microscope (TEM) machines, Scanning Electron Microscope (SEM) machines, and/or the like.
- MRI Magnetic Resonance Imaging
- TEM Transmission Electron Microscope
- SEM Scanning Electron Microscope
- the image data generated by the data collection circuits 100 may be, for example, spectroscopy images such as Energy-Dispersive X-ray Spectrocopy (EDS) images and/or High-Angle Annular Dark-Field (HAADF) images, microscopy images such as Transmission Electron Microscopy (TEM) images, thermal images, and/or the like.
- EDS Energy-Dispersive X-ray Spectrocopy
- HAADF High-Angle Annular Dark-Field
- TEM Transmission Electron Microscopy
- the acquired data samples may not be limited to still images, but may also include video, text, Lidar data, radar data, image fusion data, temperature data, pressure data, and/or the like.
- the data collection circuits 100 may be placed, for example, on top of a conveyer belt that carries the product during production.
- the data collection circuits 100 may be configured to acquire data samples (e.g. image data) of a product multiple times (e.g. every second or few seconds) over a period of manufacturing time.
- the analysis system 102 may include a training module 106 and an inference module 108. Although the training and inference modules 106 and 108 are described as separate functional units, a person of skill in the art will recognize that the functionality of the modules 106 and 108 may be combined or integrated into a single module, or further subdivided into further sub-modules without departing from the scope of the invention.
- the components of the analysis system 102 may be implemented by one or more processors (e.g., a processor 101 in FIG. 1 ) having an associated memory (e.g., a memory 103 in FIG.
- ASICs application specific integrated circuits
- CPUs general purpose or special purpose central processing units
- DSPs digital signal processors
- GPUs graphics processing units
- FPGAs programmable logic devices
- the training module 106 may be configured to generate and train a plurality of machine learning models to be used for classifying product manufacturing defects.
- the plurality of machine learning models may be generated and trained based on training data provided by the data collection circuits 100.
- two machine learning models are trained in two separate stages. In a first stage, a defect detection model may be trained using only the clean training dataset. In this regard, noisy/unconfident data bearing labels that are identified as erroneous are removed from the test dataset to generate the clean training dataset.
- the defect detection model is a joint fusion model trained using the clean test dataset from different types of data collection circuits 100 that have been integrated and trained together.
- the defect detection model need not be a joint fusion model but could also be, for example, any deep neural network known in the art, an may be trained using information from a single source.
- an outlier filter may be trained to filter out unconfident/noisy data samples during deployment.
- the outlier filter is trained using unsupervised learning based on the clean training data samples identified in the first stage.
- the outlier filter is trained using supervised learning based on the data samples labeled as noisy/unconfident in the first stage. The size of the classification clusters or decision boundaries may depend on the identified tuning threshold hyperparameter.
- the inference module 108 may be configured to classify product manufacturing defects during deployment during an inference stage.
- the data samples acquired by the data collection circuits 100 may be provided to the outlier filter for identifying confidence of the data samples.
- the outlier filter is configured to determine whether a data sample is an outlier. For example, the data sample may be identified as an outlier if it cannot be clustered into one of the classification clusters generated based on the clean training data. In another example, the data sample may be deemed to be an outlier if it matches the features of data that is labeled as noisy/unconfident.
- a data sample identified as an outlier is removed.
- removed data samples are not provided to the defect detection model for making predictions.
- data that is provided to the defect detection model is data that is deemed to be confident data, improving accuracy of classifications by the defect detection model.
- the classification made by the defect detection model may include classification of products as faulty or not faulty, classification of faulty products into defect categories, and/or the like.
- the analysis system 102 may generate a signal based on the classification outcome.
- the signal may be for prompting action by a human inspector in response to classifying the product as a faulty product. The action may be to remove the product from the production line for purposes of re-inspection.
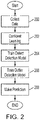
- FIG. 2 is a flow diagram of a process for making predictions relating to products manufactured via a manufacturing process according to one embodiment. It should be understood that the sequence of steps of the process is not fixed, but can be altered in any convenient manner as recognized by a person of skill in the art, including the order of certain steps and performing various steps in parallel, for example.
- data of products manufactured during the manufacturing process is captured by one or more of the data collection circuits 100.
- the captured data may be, for example, image data.
- the image data of a particular product is captured concurrently by two or more disparate data collection circuits 100.
- a first data collection circuit 100 may capture a TEM image of a product
- a second data collection circuit 100 may capture an HAADF image of the same product.
- the data captured by the data collection circuits 100 may be used for training the ML models.
- images around defect areas of a product that are acquired by the data collection circuits 100 may be reviewed and labeled by a human inspector for identifying the defect.
- Humans, however, are prone to errors, and the labels attached to the images may be erroneous at times. Labeling errors may be a problem as the accuracy of the models depend on the accuracy of the training data.
- the training module 106 engages in confident learning at block 202 for identifying and removing the noisy data samples in the training dataset.
- the noisy data samples may include image data that are predicted to be mis-labeled by the human inspector.
- confident learning is based on an estimation of a joint distribution between noisy (given) labels, and uncorrupted (true) labels, as described in further detail in Northcutt et. al, "Confident Learning: Estimating Uncertainty in Dataset Labels," (2021) available at https://arxiv.org/abs/1911.00068v4 , the content of which is incorporated herein by reference.
- the training module 106 in response to the confident learning at block 202, identifies the data samples in the training dataset that are predicted to be noisy, labels the identified data samples as noisy, and removes these data samples from the training dataset.
- the training module 106 trains the defect detection model based on the clean data samples in the filtered training dataset.
- the trained defect detection model may be, for example, a joint fusion model as described in U.S. Patent Application Ser. No. 16/938,812 filed on July 24, 2020 , entitled “Image-Based Defects Identification and Semi-Supervised Localization,” or U.S. Patent Application Ser. No. 16/938,857, filed on July 24, 2020 , entitled “Fusion Model Training Using Distance Metrics,” the content of both of which are incorporated herein by reference.
- the defect detection model is single machine learning model (instead of a joint fusion model) configured with a machine learning algorithm such as, for example, random forest, extreme gradient boosting (XGBoost), support-vector machine (SVM), deep neural network (DNN), and/or the like.
- a machine learning algorithm such as, for example, random forest, extreme gradient boosting (XGBoost), support-vector machine (SVM), deep neural network (DNN), and/or the like.
- the training module 106 uses the noisy and/or clean data samples from the confident learning block 202 for training the outlier filter.
- One of supervised or unsupervised learning may be used to train the outlier filter.
- clean and noisy data samples that have been labeled as such may be used to teach the outlier filter to classify data as noisy/unconfident or clean/confident.
- a decision boundary may be identified during the training for determining the boundary that separates the noisy data from the clean data.
- a machine learning algorithm such as, for example, logistic regression, may be used for identifying the decision boundary.
- the training module 106 invokes a clustering algorithm for finding similarities in the training data samples, and groups similar data samples into a cluster.
- a clustering algorithm such as a K-Means clustering algorithm may be used for generating the clusters.
- the training module 106 is further configured to tune the boundaries of the clusters, or the placement of the decision boundary, based on a tuning threshold hyperparameter.
- the tuning threshold may control how close the decision boundary or cluster is to the noisy data without being filtered out. The closer the boundary to the noisy data, the greater the coverage of the data samples that are kept for purposes of defect prediction. However, accuracy of the prediction may decrease as coverage decreases.
- a desired coverage and/or accuracy are entered as inputs, and the training module 106 selects an appropriate tuning threshold as a function of the entered inputs.
- the trained outlier filter and the trained defect detection model are used at deployment for identifying defects in products, such as, for example, display panels.
- the inference module 108 invokes the outlier filter to predict the confidence of the data samples captured by the data collection circuits 100 during a manufacturing process.
- the outlier filter identifies the data samples that cannot be confidently clustered into one of the known classification classes (if the filter has been trained using unsupervised learning), and/or have features/parameters that cause the data to be classified as noisy/unconfident (if the filter has been trained using supervised leaming), and removes such data samples from the captured dataset. The removed unconfident data samples may be deemed to be outlier data that may be the result of degradation in the machinery used in the manufacturing process.
- the inference module 108 invokes the defect detection model for making predictions in the cleaned, high-confidence data samples. In this manner, accuracy of predictions by the defect detection model may increase when compared to current art defect detection models.
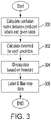
- FIG. 3 is more detailed flow diagram of the confident learning at block 202 according to one embodiment.
- the training module 106 calculates a confusion matrix between predicted (true/correct) labels and given labels (by a human person) of a test dataset.
- a deep learning model may be invoked for predicting the true/correct label of a data sample in the test dataset.
- a confusion matrix may be generated based on a comparison of the predicted labels against the given labels.
- the confusion matrix may be a joint distribution between the predicted labels and given labels, for each predicted label.
- a first entry in the confusion matrix identify a probability that a data sample that is predicted to be an apple is actually labeled an apple
- a second entry may identify a probability that a data sample that is predicted to be an apple is actually labeled a pear
- a third entry may identify a probability that a data sample that is predicted to be an apple is actually labeled an orange. Similar joint distributions may be calculated for pear and orange predictions.
- the training module 106 calculates a threshold based on the confusion matrix for each predicted label.
- the joint probability values are used as the threshold values.
- the threshold values may be based on a peak signal-to-noise ratio (PSNR) for the predicted class, that may be calculated based on the joint probability distributions for the predicted class.
- the threshold value for a particular predicted class may be based on a difference between the probability of the predicted true label and the probability of the class.
- PSNR peak signal-to-noise ratio
- An example pseudocode for calculating the threshold values may be as follows:
- the training module 106 identifies the noisy, unconfident data in the training dataset based on the computed threshold. For example, assuming that the joint probability distribution of apples being labeled as pears is 14%, the training module 106 may identify 14% of the data samples labeled as pears, which have a highest probability of being apples, as being noisy data. In some embodiments, a sample whose difference between the probability of the predicted true label and the probability of the class, is smaller than the threshold set for the class, is identified as a noisy data sample.
- the training module 106 labels and filters out the noisy data from the training dataset.
- the training module 106 may label the noisy data as "noisy” or the like.
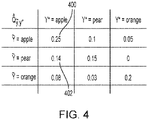
- FIG. 4 is an example confusion matrix according to one embodiment.
- the joint probability 400 of a data sample that is predicted to be an apple that is actually labeled an apple is 0.25.
- the joint probability 402 of a data sample that is predicted to be an apple but is actually labeled as a pear is 0.14.
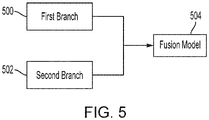
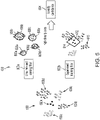
- FIG. 5 is block diagram of the defect detection model implemented as a joint fusion model according to one embodiment.
- the joint fusion model includes a first neural network branch 500 configured to receive a first set of cleaned data that has undergone confident learning, and a second neural network branch 502 configured to receive a second set of cleaned data that has also undergone confident learning.
- the training module 106 trains each branch independently of the other branch, and joins the first branch 500 and the second branch 502 into a joint fusion model 504 through convolutional layers.
- the first set of data may be internally aligned
- the second set of data may be internally aligned
- the first and second sets of data may not be aligned relative to each other.
- the first set of data may include spectroscopy images, such as Energy-Dispersive X-ray Spectrocopy (EDS) image used with High-Angle Annular Dark-Field (HAADF) images
- the second set of data may include microscopy images such as Transmission Electron Microscopy (TEM) images.
- each of the first branch 500 and the second branch 502 includes a respective attention module.
- the attention module for a neural network branch may be configured to overlay a spatial attention onto the images received by the neural network branch to highlight areas where a defect might arise.
- a first attention module of the first branch 500 may overlay a first spatial attention heat map onto the first set of data received by the first branch 500
- a second attention module of the second branch 502 may overlay a second spatial attention heat map onto the second set of data received by the second branch 502.
- the attention module may include a space map network (e.g., corresponding to the spatial attention heat map) which is adjusted based on a final predicted label (error type / no error) of an input image.
- the space map network may represent a spatial relationship between the input image and the final predicted label.
- the first set of data which may be a set of spectroscopy images, may come in multiple channels (X channels in this example), each channel representing data related to specific chemical element or composition.
- Each neural network branch may include a channel attention module and a spatial attention module in the form of a Convolutional Block Attention Module (CBAM) (described below).
- CBAM Convolutional Block Attention Module
- a branch that uses a multiple-image source, such as the first branch 500 may include an extra channel attention module.
- the additional channel attention module may indicate which element input channels to focus on.
- the joint fusion model allows product information obtained from disparate data collection circuits 100 to be integrated and trained together, so that the information may complement each other to make predictions about product manufacturing defects.
- the spatial attention module and the channel attention module are networks that are trained in a semi-supervised manner to force the larger neural network (e.g., the respective neural network branch) to put greater weight on data coming from the selected channel or spatial region.
- the spatial/channel attention module learns which features are associated with errors, and in turn which spatial areas or channels are associated with the error via the associated features. Once trained, these modules operate within the larger neural network structure to force the neural network to pay "more attention" to select regions/channels (e.g., by setting one or more weights associated with the regions/channels).
- the attention modules may be included in a CBAM, which is an effective attention module for feed-forward convolutional neural networks. Both the spectroscopy branch and the microscopy branch may include a CBAM which provides spatial and channel attention.
- the spatial attention may be a space-heat map related to error location, and the channel attention may be related to the color/grayscale channel of the data.
- the additional channel attention module may focus attention on the channel that is associated with the target element that is of interest to the particular defect type.
- FIG. 6 is a conceptual layout diagram of data filtered by an outlier filter 602 during the prediction stage 208 according to one embodiment.
- data samples 600 acquired by the data collection circuits 100 for a manufactured product is provided to the outlier filter 602 for predicting confidence 604 of the data samples.
- the data samples may include data samples 600a-600d of a first type (e.g. clean/confident), and data samples 600e of a second type (e.g. noisy/not confident).
- the outlier filter 602 is an unsupervised learning filter 602a for identifying a class to which a data sample belongs based on the associated data parameters.
- the data samples 600a-660d of the first type are clustered into appropriate classes 606a-606d.
- the boundary of the classes may be set based on the tuning threshold. If the data sample is predicted to be within the boundary of an identified class, the data sample may be deemed to be confident data, and may be used by the defect detection model for making defect predictions.
- the data samples 600e of the second type do not belong to any of the clusters, and thus, may be deemed to be noisy/unconfident data.
- the data samples 600e of the second type are rejected and not used by the defect detection model for making defect predictions.
- the outlier filter is a supervised learning filter 602b configured to classify the data samples 600 as clean/confident 610 or noisy/unconfident 612.
- a decision boundary 614 that separates the confident from the unconfident data may be set based on the tuning threshold. In one embodiment, if the data sample is predicted to be noisy/unconfident, it is rejected and not used by the defect detection model for making defect predictions.
- FIG. 7 is a graph of a tradeoff between accuracy and coverage when selecting a tuning threshold according to one embodiment.
- the graph indicates that accuracy of predictions by the defect detection model increases as coverage decreases (i.e. more of the data samples are filtered out).
- FIG. 8 is a graph of example tuning threshold values that may be calculated as a function of coverage and accuracy according to one embodiment.
- the graph includes an accuracy curve 800 with an accuracy cutoff line 802 at 95% accuracy.
- the 95% accuracy point occurs at intersection point 804.
- a coverage cutoff line 806 that intersects the intersection point 804 at 95% accuracy also intersects a coverage curve 808 at about 65% coverage, and has a tuning threshold value of about 0.17.
- a tuning threshold value of 0.16 yields a prediction accuracy of 95% and coverage of 65%.
- decreasing coverage to 50% increases the prediction accuracy to around 97% (intersection point 814).
- the associated tuning threshold also increases to about 0.57.
- the training module 106 is configured to run a function that outputs a tuning threshold value based on an input of a desired accuracy value and/or coverage value.
- processors may refer to one or more processors and/or one or more processing cores.
- the one or more processors may be hosted in a single device or distributed over multiple devices (e.g. over a cloud system).
- a processor may include, for example, application specific integrated circuits (ASICs), general purpose or special purpose central processing units (CPUs), digital signal processors (DSPs), graphics processing units (GPUs), and programmable logic devices such as field programmable gate arrays (FPGAs).
- ASICs application specific integrated circuits
- CPUs general purpose or special purpose central processing units
- DSPs digital signal processors
- GPUs graphics processing units
- FPGAs programmable logic devices
- each function is performed either by hardware configured, i.e., hard-wired, to perform that function, or by more general-purpose hardware, such as a CPU, configured to execute instructions stored in a non-transitory storage medium (e.g. memory).
- a processor may be fabricated on a single printed circuit board (PCB) or distributed over several interconnected PCBs.
- a processor may contain other processing circuits; for example, a processing circuit may include two processing circuits, an FPGA and a CPU, interconnected on a PCB.
- first, second, third, etc. may be used herein to describe various elements, components, regions, layers and/or sections, these elements, components, regions, layers and/or sections should not be limited by these terms. These terms are only used to distinguish one element, component, region, layer or section from another element, component, region, layer or section. Thus, a first element, component, region, layer or section discussed herein could be termed a second element, component, region, layer or section, without departing from the scope of the invention.
Landscapes
- Engineering & Computer Science (AREA)
- Theoretical Computer Science (AREA)
- Physics & Mathematics (AREA)
- General Physics & Mathematics (AREA)
- Software Systems (AREA)
- Data Mining & Analysis (AREA)
- Artificial Intelligence (AREA)
- Evolutionary Computation (AREA)
- General Engineering & Computer Science (AREA)
- Computing Systems (AREA)
- Mathematical Physics (AREA)
- Life Sciences & Earth Sciences (AREA)
- Computational Linguistics (AREA)
- General Health & Medical Sciences (AREA)
- Health & Medical Sciences (AREA)
- Molecular Biology (AREA)
- Biophysics (AREA)
- Biomedical Technology (AREA)
- Computer Vision & Pattern Recognition (AREA)
- Automation & Control Theory (AREA)
- Medical Informatics (AREA)
- Evolutionary Biology (AREA)
- Bioinformatics & Computational Biology (AREA)
- Bioinformatics & Cheminformatics (AREA)
- Manufacturing & Machinery (AREA)
- Quality & Reliability (AREA)
- Databases & Information Systems (AREA)
- Multimedia (AREA)
- Image Analysis (AREA)
- Investigating Materials By The Use Of Optical Means Adapted For Particular Applications (AREA)
- Information Retrieval, Db Structures And Fs Structures Therefor (AREA)
Abstract
Description
- One or more aspects of embodiments according to the present disclosure relate to classifiers, and more particularly to a machine-leaming (ML) classifiers for identifying manufacturing defects that use a two-pass approach to filter out low confident data samples.
- The mobile display industry has grown rapidly in recent years. As new types of display panel modules and production methods are being deployed, surface defects have been harder to inspect using just traditional mechanisms. It would be desirable to employ artificial intelligence (Al) to automatically predict whether a manufactured display panel module is faulty or not. In fact, it would be desirable to employ AI to predict defects in other hardware products, and not just display panel modules.
- The above information disclosed in this Background section is only for enhancement of understanding of the background of the present disclosure, and therefore, it may contain information that does not form prior art.
- An embodiment of the present disclosure is directed to a method for classifying manufacturing defects. In one embodiment, a first data sample satisfying a first criterion is identified from a training dataset, and the first data sample is removed from the training dataset. A filtered training dataset including a second data sample is output. A first machine learning model is trained with the filtered training dataset. A second machine learning model is trained based on at least one of the first data sample or the second data sample. Product data associated with a manufactured product is received, and the second machine learning model is invoked for predicting confidence of the product data. In response to predicting the confidence of the product data, the first machine learning model is invoked for generating a classification based the product data. The method of the invention may be computer implemented.
- According to one embodiment, the first criterion is a confidence level below a set threshold.
- According to one embodiment, the second data sample is associated with a confidence level above a set threshold.
- According to one embodiment, the training of the second machine learning model includes invoking unsupervised learning based on the second data sample, wherein the second data sample is associated with a particular class.
- According to one embodiment, the training of the second machine learning model includes: identifying a cluster associated with the particular class; and tuning a boundary of the cluster based on a tuning threshold, wherein the first machine learning model is invoked for generating the classification in response to determining that the product data is within the boundary of the cluster.
- According to one embodiment, the training of the second machine learning model includes invoking supervised learning based on the first and second data samples, wherein the first data sample is identified as a first type of data, and the second data sample is identified as a second type of data.
- According to one embodiment, the training of the second machine learning model includes: identifying a decision boundary for separating the first type of data from a second type of data; and tuning the decision boundary based on a tuning threshold, wherein the first machine learning model is invoked for generating the classification in response to determining that the product data belongs to the second type of data.
- According to one embodiment, the method for classifying manufacturing defects includes: identifying second product data associated with a second manufactured product; invoking the second machine learning model for predicting confidence of the second product data; and rejecting the second product data based on the confidence of the second product data.
- According to one embodiment, the method for classifying manufacturing defects further includes generating a signal based on the classification, wherein the signal is for triggering an action.
- An embodiment of the present disclosure is also directed to a system for classifying manufacturing defects. The system includes a processor and memory. The memory has stored therein instructions that, when executed by the processor, cause the processor to: identify, from a training dataset, a first data sample satisfying a first criterion; remove, from the training dataset, the first data sample and outputting a filtered training dataset including a second data sample; train a first machine learning model with the filtered training dataset; train a second machine learning model based on at least one of the first data sample or the second data sample; receive product data associated with a manufactured product; invoke the second machine learning model for predicting confidence of the product data; and in response to predicting the confidence of the product data, invoke the first machine learning model for generating a classification based the product data.
- An embodiment of the present disclosure is further directed to a system for classifying manufacturing defects. The system includes a data collection circuit configured to collect an input dataset, and a processing circuit coupled to the data collection circuit. The processing circuit has logic for: identifying, from a training dataset, a first data sample satisfying a first criterion; removing, from the training dataset, the first data sample and outputting a filtered training dataset including a second data sample; training a first machine learning model with the filtered training dataset; training a second machine learning model based on at least one of the first data sample or the second data sample; receiving product data associated with a manufactured product; invoking the second machine learning model for predicting confidence of the product data; and in response to predicting the confidence of the product data, invoking the first machine learning model for generating a classification based the product data.
- As a person of skill in the art should recognize, the claimed systems and methods that filter out low confident data samples during training and inference help increase accuracy of predictions on covered data samples while minimizing the influence of out-of-distribution samples.
- These and other features, aspects and advantages of the embodiments of the present disclosure will be more fully understood when considered with respect to the following detailed description, appended claims, and accompanying drawings. Of course, the actual scope of the invention is defined by the appended claims.
- At least some of the above and other features of the invention are set out in the claims.
- Non-limiting and non-exhaustive embodiments of the present embodiments are described with reference to the following figures, wherein like reference numerals refer to like parts throughout the various views unless otherwise specified.
-
FIG. 1 is a block diagram of a system for making predictions relating to products manufactured via a manufacturing process according to one embodiment; -
FIG. 2 is a flow diagram of a process for making predictions relating to products manufactured via a manufacturing process according to one embodiment; -
FIG. 3 is more detailed flow diagram of a confident learning process according to one embodiment; -
FIG. 4 is an example confusion matrix according to one embodiment; -
FIG. 5 is block diagram of defect detection implemented as a joint fusion model according to one embodiment; -
FIG. 6 is a conceptual layout diagram of data filtered by an outlier filter during a prediction stage according to one embodiment; -
FIG. 7 is a graph of a tradeoff between accuracy and coverage when selecting a tuning threshold according to one embodiment; and -
FIG. 8 is a graph of example tuning threshold values that may be calculated as a function of coverage and accuracy according to one embodiment. - Hereinafter, example embodiments will be described in more detail with reference to the accompanying drawings, in which like reference numbers refer to like elements throughout. The present disclosure, however, may be embodied in various different forms, and should not be construed as being limited to only the illustrated embodiments herein. Rather, these embodiments are provided as examples so that this disclosure will be thorough and complete, and will fully convey the aspects and features of the present disclosure to those skilled in the art. Accordingly, processes, elements, and techniques that are not necessary to those having ordinary skill in the art for a complete understanding of the aspects and features of the present disclosure may not be described. Unless otherwise noted, like reference numerals denote like elements throughout the attached drawings and the written description, and thus, descriptions thereof may not be repeated. Further, in the drawings, the relative sizes of elements, layers, and regions may be exaggerated and/or simplified for clarity.
- As new types of display modules and product methods are deployed, and as product specifications tighten, it may be desirable to enhance equipment and quality-control methods to maintain production quality. For example, it may be desirable to monitor for manufacturing defects during production.
- One way to monitor for manufacturing defects is by employing human inspectors that have the expertise to identify the defects. In this regard, high-resolution (sub-micron level) images may be acquired around defect areas. A human inspector may then review the acquired images to classify the defects into categories in accordance with the type of the defects and how the defects may affect the production yield. In more detail, the human inspector may sample a number of defect images and spend significant time searching for features to separate unclassified defect images into categories. Training the human inspectors, however, takes time. Even when trained, it may take weeks for a human inspector to identify manufacturing defects in a current batch of images, making it hard to expand the human inspector's work to multiple instances at a time.
- Machine learning (ML) models may be used for quicker detection of manufacturing defects that may be expanded to multiple instances at a time. In order for such ML models to be useful, however, they should be accurate in their predictions. In addition, the models should be generalized so that accurate predictions may be made even on new data sets that have not been encountered previously.
- Various factors, however, may degrade the performance of ML models. One such factor may be erroneous labeling of training data, referred to as label noise. The erroneous labels may be due, for instance, to human error. For example, an image used for training may be labeled as depicting a type of manufacturing defect when in fact, no such defect exists, or, even if the defect does exist, the type of defect identified by the human person is erroneous. When an ML model is trained using erroneous labels, the accuracy of predictions by the ML model is reduced.
- Another issue that may arise in using ML models is due to the small dataset that is often used to train the models. The sparse training dataset relative to the high dimensionality of the data may lead to overfitting of the model. When the model is overfitted, erroneously labeled data may not be rejected, but learned by the model. This may lead to predictions being made during deployment based on the erroneously labeled data, causing the model to perform poorly on new, unseen data.
- In general terms, embodiments of the present disclosure are directed to identifying manufacturing defects using deep learning ML models. In one embodiment, a two-stage approach is used to filter out unconfident (also referred to as noisy) data. In this regard, data samples with noisy labels in a training dataset may be removed for training a first ML model (referred to as a defect detection model) so that the defect detection model is trained using confident (also referred to as clean) training data samples. The clean and noisy data may then be used to train a second deep learning ML model (referred to as an outlier detection model or outlier filter) that is used during deployment to filter out unconfident/noisy data samples. This may ensure that the data to be predicted by the defect detection model falls in a high-confident prediction area, improving the accuracy of predictions by the defect detection model.
- In one embodiment, a boundary that is used by the outlier filter to filter out unconfident data is tuned using a tuning threshold hyperparameter. The threshold hyperparameter may be determined upon considering a tradeoff between a rejection rate (or amount of coverage of the data), and the accuracy of the prediction by the defect detection model. In one embodiment, accuracy of the prediction increases when coverage decreases. In this regard, the threshold hyperparameter may be selected based on identification of current requirements in terms of accuracy and/or coverage.
-
FIG. 1 is a block diagram of a system for making predictions relating to products manufactured via a manufacturing process according to one embodiment. The system includes, without limitations, one or moredata collection circuits 100, and ananalysis system 102. Thedata collection circuits 100 may include, for example, one or more imaging systems configured to acquire image data of a product during a manufacturing process such as, for example, X-ray machines, Magnetic Resonance Imaging (MRI) machines, Transmission Electron Microscope (TEM) machines, Scanning Electron Microscope (SEM) machines, and/or the like. The image data generated by thedata collection circuits 100 may be, for example, spectroscopy images such as Energy-Dispersive X-ray Spectrocopy (EDS) images and/or High-Angle Annular Dark-Field (HAADF) images, microscopy images such as Transmission Electron Microscopy (TEM) images, thermal images, and/or the like. The acquired data samples may not be limited to still images, but may also include video, text, Lidar data, radar data, image fusion data, temperature data, pressure data, and/or the like. - The
data collection circuits 100 may be placed, for example, on top of a conveyer belt that carries the product during production. Thedata collection circuits 100 may be configured to acquire data samples (e.g. image data) of a product multiple times (e.g. every second or few seconds) over a period of manufacturing time. - The
analysis system 102 may include atraining module 106 and aninference module 108. Although the training andinference modules modules analysis system 102 may be implemented by one or more processors (e.g., aprocessor 101 inFIG. 1 ) having an associated memory (e.g., amemory 103 inFIG. 1 ), including, for example, application specific integrated circuits (ASICs), general purpose or special purpose central processing units (CPUs), digital signal processors (DSPs), graphics processing units (GPUs), and programmable logic devices such as field programmable gate arrays (FPGAs). - The
training module 106 may be configured to generate and train a plurality of machine learning models to be used for classifying product manufacturing defects. The plurality of machine learning models may be generated and trained based on training data provided by thedata collection circuits 100. In one embodiment, two machine learning models are trained in two separate stages. In a first stage, a defect detection model may be trained using only the clean training dataset. In this regard, noisy/unconfident data bearing labels that are identified as erroneous are removed from the test dataset to generate the clean training dataset. - In one embodiment, the defect detection model is a joint fusion model trained using the clean test dataset from different types of
data collection circuits 100 that have been integrated and trained together. The defect detection model need not be a joint fusion model but could also be, for example, any deep neural network known in the art, an may be trained using information from a single source. - In a second stage, an outlier filter may be trained to filter out unconfident/noisy data samples during deployment. In one embodiment, the outlier filter is trained using unsupervised learning based on the clean training data samples identified in the first stage. In one embodiment, the outlier filter is trained using supervised learning based on the data samples labeled as noisy/unconfident in the first stage. The size of the classification clusters or decision boundaries may depend on the identified tuning threshold hyperparameter.
- The
inference module 108 may be configured to classify product manufacturing defects during deployment during an inference stage. In this regard, the data samples acquired by thedata collection circuits 100 may be provided to the outlier filter for identifying confidence of the data samples. In one embodiment, the outlier filter is configured to determine whether a data sample is an outlier. For example, the data sample may be identified as an outlier if it cannot be clustered into one of the classification clusters generated based on the clean training data. In another example, the data sample may be deemed to be an outlier if it matches the features of data that is labeled as noisy/unconfident. - In one embodiment, a data sample identified as an outlier is removed. In this regard, removed data samples are not provided to the defect detection model for making predictions. Thus, data that is provided to the defect detection model is data that is deemed to be confident data, improving accuracy of classifications by the defect detection model. The classification made by the defect detection model may include classification of products as faulty or not faulty, classification of faulty products into defect categories, and/or the like. In one embodiment, the
analysis system 102 may generate a signal based on the classification outcome. For example, the signal may be for prompting action by a human inspector in response to classifying the product as a faulty product. The action may be to remove the product from the production line for purposes of re-inspection. -
FIG. 2 is a flow diagram of a process for making predictions relating to products manufactured via a manufacturing process according to one embodiment. It should be understood that the sequence of steps of the process is not fixed, but can be altered in any convenient manner as recognized by a person of skill in the art, including the order of certain steps and performing various steps in parallel, for example. - At
block 200, data of products manufactured during the manufacturing process is captured by one or more of thedata collection circuits 100. The captured data may be, for example, image data. In one embodiment, the image data of a particular product is captured concurrently by two or more disparatedata collection circuits 100. For example, a firstdata collection circuit 100 may capture a TEM image of a product, and a seconddata collection circuit 100 may capture an HAADF image of the same product. - The data captured by the
data collection circuits 100 may be used for training the ML models. In this regard, images around defect areas of a product that are acquired by thedata collection circuits 100 may be reviewed and labeled by a human inspector for identifying the defect. Humans, however, are prone to errors, and the labels attached to the images may be erroneous at times. Labeling errors may be a problem as the accuracy of the models depend on the accuracy of the training data. - In one embodiment, the
training module 106 engages in confident learning atblock 202 for identifying and removing the noisy data samples in the training dataset. The noisy data samples may include image data that are predicted to be mis-labeled by the human inspector. In one embodiment, confident learning is based on an estimation of a joint distribution between noisy (given) labels, and uncorrupted (true) labels, as described in further detail in Northcutt et. al, "Confident Learning: Estimating Uncertainty in Dataset Labels," (2021) available at https://arxiv.org/abs/1911.00068v4, the content of which is incorporated herein by reference. - In one embodiment, in response to the confident learning at
block 202, thetraining module 106 identifies the data samples in the training dataset that are predicted to be noisy, labels the identified data samples as noisy, and removes these data samples from the training dataset. - At
block 204, thetraining module 106 trains the defect detection model based on the clean data samples in the filtered training dataset. The trained defect detection model may be, for example, a joint fusion model as described inU.S. Patent Application Ser. No. 16/938,812 filed on July 24, 2020 U.S. Patent Application Ser. No. 16/938,857, filed on July 24, 2020 - At
block 206, thetraining module 106 uses the noisy and/or clean data samples from theconfident learning block 202 for training the outlier filter. One of supervised or unsupervised learning may be used to train the outlier filter. In the embodiment where supervised learning is used, clean and noisy data samples that have been labeled as such may be used to teach the outlier filter to classify data as noisy/unconfident or clean/confident. A decision boundary may be identified during the training for determining the boundary that separates the noisy data from the clean data. A machine learning algorithm such as, for example, logistic regression, may be used for identifying the decision boundary. - In the embodiment where unsupervised learning is used, the
training module 106 invokes a clustering algorithm for finding similarities in the training data samples, and groups similar data samples into a cluster. A clustering algorithm such as a K-Means clustering algorithm may be used for generating the clusters. - In one embodiment, the
training module 106 is further configured to tune the boundaries of the clusters, or the placement of the decision boundary, based on a tuning threshold hyperparameter. The tuning threshold may control how close the decision boundary or cluster is to the noisy data without being filtered out. The closer the boundary to the noisy data, the greater the coverage of the data samples that are kept for purposes of defect prediction. However, accuracy of the prediction may decrease as coverage decreases. In one embodiment, a desired coverage and/or accuracy are entered as inputs, and thetraining module 106 selects an appropriate tuning threshold as a function of the entered inputs. - At
block 208, the trained outlier filter and the trained defect detection model are used at deployment for identifying defects in products, such as, for example, display panels. In one embodiment, theinference module 108 invokes the outlier filter to predict the confidence of the data samples captured by thedata collection circuits 100 during a manufacturing process. In one embodiment, the outlier filter identifies the data samples that cannot be confidently clustered into one of the known classification classes (if the filter has been trained using unsupervised learning), and/or have features/parameters that cause the data to be classified as noisy/unconfident (if the filter has been trained using supervised leaming), and removes such data samples from the captured dataset. The removed unconfident data samples may be deemed to be outlier data that may be the result of degradation in the machinery used in the manufacturing process. - In one embodiment, the
inference module 108 invokes the defect detection model for making predictions in the cleaned, high-confidence data samples. In this manner, accuracy of predictions by the defect detection model may increase when compared to current art defect detection models. -
FIG. 3 is more detailed flow diagram of the confident learning atblock 202 according to one embodiment. Atblock 300, thetraining module 106 calculates a confusion matrix between predicted (true/correct) labels and given labels (by a human person) of a test dataset. A deep learning model may be invoked for predicting the true/correct label of a data sample in the test dataset. A confusion matrix may be generated based on a comparison of the predicted labels against the given labels. The confusion matrix may be a joint distribution between the predicted labels and given labels, for each predicted label. For example, given three possible classes of labels: apples, pears, and oranges, a first entry in the confusion matrix identify a probability that a data sample that is predicted to be an apple is actually labeled an apple, a second entry may identify a probability that a data sample that is predicted to be an apple is actually labeled a pear, and a third entry may identify a probability that a data sample that is predicted to be an apple is actually labeled an orange. Similar joint distributions may be calculated for pear and orange predictions. - At
block 302, thetraining module 106 calculates a threshold based on the confusion matrix for each predicted label. In one embodiment, the joint probability values are used as the threshold values. In some embodiments, the threshold values may be based on a peak signal-to-noise ratio (PSNR) for the predicted class, that may be calculated based on the joint probability distributions for the predicted class. In one embodiment, the threshold value for a particular predicted class may be based on a difference between the probability of the predicted true label and the probability of the class. An example pseudocode for calculating the threshold values may be as follows:
Obtain a set of prediction probabilities (a matrix of size: n_samples *
      n_classes)
          For each class c in n_classes:
             Calculate (difference of class c) = (probability of the predicted true label)
      - (the probability of the class c); (size: n_samples * 1)
             Find the k-th smallest value of the difference of class c, as the threshold of
      the class c
Claims (11)
- A method for classifying manufacturing defects comprising:identifying, from a training dataset, a first data sample satisfying a first criterion;removing, from the training dataset, the first data sample and outputting a filtered training dataset including a second data sample;training a first machine learning model with the filtered training dataset;training a second machine learning model based on at least one of the first data sample or the second data sample;receiving first product data associated with a first manufactured product;invoking the second machine learning model for predicting confidence of the first product data; andin response to predicting the confidence of the first product data, invoking the first machine learning model for generating a classification based the first product data.
- The method of claim 1, wherein the first criterion is a confidence level below a set threshold.
- The method of claim 1 or 2, wherein the second data sample is associated with a confidence level above a set threshold.
- The method of claim 1, 2 or 3, wherein the training of the second machine learning model includes invoking unsupervised learning based on the second data sample, wherein the second data sample is associated with a particular class.
- The method of claim 4, wherein the training of the second machine learning model further includes:identifying a cluster associated with the particular class; andtuning a boundary of the cluster based on a tuning threshold, wherein the first machine learning model is invoked for generating the classification in response to determining that the first product data is within the boundary of the cluster.
- The method of any one of claims 1 to 5, wherein the training of the second machine learning model includes invoking supervised learning based on the first and second data samples, wherein the first data sample is identified as a first type of data, and the second data sample is identified as a second type of data.
- The method of claim 6, wherein the training of the second machine learning model further includes:
identifying a decision boundary for separating the first type of data from the second type of data; and
tuning the decision boundary based on a tuning threshold, wherein the first machine learning model is invoked for generating the classification in response to determining that the first product data belongs to the second type of data. - The method of any one of claims 1 to 7 further comprising:identifying second product data associated with a second manufactured product;invoking the second machine learning model for predicting confidence of the second product data; andrejecting the second product data based on the confidence of the second product data.
- The method of any one of claims 1 to 8, further comprising:
generating a signal based on the classification, wherein the signal is for triggering an action. - A system for classifying manufacturing defects, the system comprising:processor; andmemory, wherein the memory has stored therein instructions that, when executed by the processor, cause the processor to perform the method of any one of claims 1 to 9.
- A system for classifying manufacturing defects, the system comprising:a data collection circuit configured to collect an input dataset; anda processing circuit coupled to the data collection circuit, the processing circuit having logic for performing the method of any one of claims 1 to 9.
Applications Claiming Priority (2)
| Application Number | Priority Date | Filing Date | Title |
|---|---|---|---|
| US202163169621P | 2021-04-01 | 2021-04-01 | |
| US17/306,737 US20220318672A1 (en) | 2021-04-01 | 2021-05-03 | Systems and methods for identifying manufacturing defects |
Publications (1)
| Publication Number | Publication Date |
|---|---|
| EP4068155A1 true EP4068155A1 (en) | 2022-10-05 |
Family
ID=80999687
Family Applications (1)
| Application Number | Title | Priority Date | Filing Date |
|---|---|---|---|
| EP22158093.9A Pending EP4068155A1 (en) | 2021-04-01 | 2022-02-22 | Systems and methods for identifying manufacturing defects |
Country Status (6)
| Country | Link |
|---|---|
| US (1) | US20220318672A1 (en) |
| EP (1) | EP4068155A1 (en) |
| JP (1) | JP2022158968A (en) |
| KR (1) | KR20220137562A (en) |
| CN (1) | CN115249039A (en) |
| TW (1) | TWI872322B (en) |
Cited By (1)
| Publication number | Priority date | Publication date | Assignee | Title |
|---|---|---|---|---|
| CN116977256A (en) * | 2023-01-30 | 2023-10-31 | 腾讯科技(深圳)有限公司 | Training methods, devices, equipment and storage media for defect detection models |
Families Citing this family (14)
| Publication number | Priority date | Publication date | Assignee | Title |
|---|---|---|---|---|
| US12340558B2 (en) * | 2021-07-22 | 2025-06-24 | The Boeing Company | Anomaly detection using augmented reality (AR) and artificial intelligence (AI) |
| US12573023B2 (en) * | 2021-10-26 | 2026-03-10 | Nvidia Corporation | Defect detection using one or more neural networks |
| US20240058953A1 (en) * | 2022-08-19 | 2024-02-22 | AMP Robotics Corporation | Object picking optimization |
| US20240144075A1 (en) * | 2022-10-28 | 2024-05-02 | Micro Focus Llc | Updating label probability distributions of data points |
| TWI883364B (en) * | 2022-12-27 | 2025-05-11 | 崛智科技股份有限公司 | Device and method for integrated circuit chip assistance design and method for constructing chip characteristics model |
| CN117237270B (en) * | 2023-02-24 | 2024-03-19 | 靖江仁富机械制造有限公司 | Forming control method and system for producing wear-resistant and corrosion-resistant pipeline |
| KR20240140505A (en) * | 2023-03-17 | 2024-09-24 | 피에스케이 주식회사 | Process data processing device and process processing method |
| CN116309564B (en) * | 2023-05-17 | 2023-08-11 | 厦门微图软件科技有限公司 | Battery appearance defect detection method and system based on artificial intelligence image recognition |
| KR102718267B1 (en) * | 2023-10-19 | 2024-10-17 | 주식회사 에이아이비즈 | Method, apparatus and program for detecting defective equipment based on wafer map pattern |
| TWI854880B (en) * | 2023-11-01 | 2024-09-01 | 英業達股份有限公司 | Multi-manifold embedding learning method and system |
| CN117313900B (en) * | 2023-11-23 | 2024-03-08 | 全芯智造技术有限公司 | Methods, equipment and media for data processing |
| CN117689908A (en) * | 2023-12-11 | 2024-03-12 | 深圳技术大学 | Stair point cloud data enhancement method, device, intelligent terminal and storage medium |
| CN119760531B (en) * | 2024-12-06 | 2025-11-07 | 山东电工电气集团数字科技有限公司 | Fault prediction method, device and medium for reducing false action probability of digital gas relay |
| CN120069241B (en) * | 2025-04-29 | 2025-07-25 | 南昌众博金属制品有限公司 | Aluminum alloy casting defect prediction method and equipment |
Family Cites Families (20)
| Publication number | Priority date | Publication date | Assignee | Title |
|---|---|---|---|---|
| US9959146B2 (en) * | 2015-10-20 | 2018-05-01 | Intel Corporation | Computing resources workload scheduling |
| JP6545728B2 (en) * | 2017-01-11 | 2019-07-17 | 株式会社東芝 | ABNORMALITY DETECTING APPARATUS, ABNORMALITY DETECTING METHOD, AND ABNORMALITY DETECTING PROGRAM |
| US10325224B1 (en) * | 2017-03-23 | 2019-06-18 | Palantir Technologies Inc. | Systems and methods for selecting machine learning training data |
| US11436428B2 (en) * | 2017-06-06 | 2022-09-06 | Sightline Innovation Inc. | System and method for increasing data quality in a machine learning process |
| JP2019061494A (en) * | 2017-09-26 | 2019-04-18 | キヤノン株式会社 | INFORMATION PROCESSING APPARATUS, INFORMATION PROCESSING METHOD, AND PROGRAM |
| CN108021931A (en) * | 2017-11-20 | 2018-05-11 | 阿里巴巴集团控股有限公司 | A kind of data sample label processing method and device |
| CN107798390B (en) * | 2017-11-22 | 2023-03-21 | 创新先进技术有限公司 | Training method and device of machine learning model and electronic equipment |
| US12099571B2 (en) * | 2018-01-18 | 2024-09-24 | Ge Infrastructure Technology Llc | Feature extractions to model large-scale complex control systems |
| US11481030B2 (en) * | 2019-03-29 | 2022-10-25 | Meta Platforms Technologies, Llc | Methods and apparatus for gesture detection and classification |
| EP3582142A1 (en) * | 2018-06-15 | 2019-12-18 | Université de Liège | Image classification using neural networks |
| US10943099B2 (en) * | 2019-03-19 | 2021-03-09 | Booz Allen Hamilton Inc. | Method and system for classifying an input data set using multiple data representation source modes |
| US11593650B2 (en) * | 2019-03-27 | 2023-02-28 | GE Precision Healthcare LLC | Determining confident data samples for machine learning models on unseen data |
| MX2021014114A (en) * | 2019-06-06 | 2021-12-10 | Home Depot Int Inc | Optimizing training data for image classification. |
| US11954610B2 (en) * | 2019-08-09 | 2024-04-09 | GE Precision Healthcare LLC | Active surveillance and learning for machine learning model authoring and deployment |
| KR102920453B1 (en) * | 2019-08-09 | 2026-02-02 | 엘지전자 주식회사 | Method and apparatus for inspecting condition of laundry machines based on deep learning |
| TWI751643B (en) * | 2019-09-03 | 2022-01-01 | 財團法人工業技術研究院 | Material property rating system and material property rating method |
| US11379718B2 (en) * | 2019-12-10 | 2022-07-05 | International Business Machines Corporation | Ground truth quality for machine learning models |
| CN111768386B (en) * | 2020-06-30 | 2024-02-20 | 北京百度网讯科技有限公司 | Product defect detection methods, devices, electronic equipment and storage media |
| CN112418313B (en) * | 2020-11-23 | 2022-09-27 | 重庆邮电大学 | Big data online noise filtering system and method |
| US20220292661A1 (en) * | 2021-03-10 | 2022-09-15 | Adlink Technology Inc. | Automated inspection system and operating method thereof |
-
2021
- 2021-05-03 US US17/306,737 patent/US20220318672A1/en active Pending
-
2022
- 2022-02-22 EP EP22158093.9A patent/EP4068155A1/en active Pending
- 2022-02-25 CN CN202210190836.7A patent/CN115249039A/en active Pending
- 2022-03-02 JP JP2022032160A patent/JP2022158968A/en active Pending
- 2022-03-25 TW TW111111504A patent/TWI872322B/en active
- 2022-04-01 KR KR1020220041150A patent/KR20220137562A/en active Pending
Non-Patent Citations (2)
| Title |
|---|
| DAVOOD KARIMI ET AL: "Deep learning with noisy labels: exploring techniques and remedies in medical image analysis", ARXIV.ORG, CORNELL UNIVERSITY LIBRARY, 201 OLIN LIBRARY CORNELL UNIVERSITY ITHACA, NY 14853, 5 December 2019 (2019-12-05), XP081622430 * |
| VEIT ANDREAS ET AL: "Learning from Noisy Large-Scale Datasets with Minimal Supervision", 2017 IEEE CONFERENCE ON COMPUTER VISION AND PATTERN RECOGNITION (CVPR), IEEE COMPUTER SOCIETY, US, 21 July 2017 (2017-07-21), pages 6575 - 6583, XP033250022, ISSN: 1063-6919, [retrieved on 20171106], DOI: 10.1109/CVPR.2017.696 * |
Cited By (1)
| Publication number | Priority date | Publication date | Assignee | Title |
|---|---|---|---|---|
| CN116977256A (en) * | 2023-01-30 | 2023-10-31 | 腾讯科技(深圳)有限公司 | Training methods, devices, equipment and storage media for defect detection models |
Also Published As
| Publication number | Publication date |
|---|---|
| KR20220137562A (en) | 2022-10-12 |
| US20220318672A1 (en) | 2022-10-06 |
| JP2022158968A (en) | 2022-10-17 |
| TW202244797A (en) | 2022-11-16 |
| TWI872322B (en) | 2025-02-11 |
| CN115249039A (en) | 2022-10-28 |
Similar Documents
| Publication | Publication Date | Title |
|---|---|---|
| EP4068155A1 (en) | Systems and methods for identifying manufacturing defects | |
| EP4080414B1 (en) | Systems and methods for identifying manufacturing defects | |
| EP4092632B1 (en) | Systems and methods for sample generation for identifying manufacturing defects | |
| US12007335B2 (en) | Automatic optimization of an examination recipe | |
| US11449711B2 (en) | Machine learning-based defect detection of a specimen | |
| Yuan-Fu | A deep learning model for identification of defect patterns in semiconductor wafer map | |
| TWI889675B (en) | Method, system, and non-transitory computer readable medium of machine learning-based classification of defects in a semiconductor specimen | |
| CN112561910A (en) | Industrial surface defect detection method based on multi-scale feature fusion | |
| JP2019106171A (en) | System, method and computer program product for classifying a plurality of items | |
| Shin et al. | A framework for detecting unknown defect patterns on wafer bin maps using active learning | |
| US20210256687A1 (en) | Determination of defect location for examination of a specimen | |
| US11151710B1 (en) | Automatic selection of algorithmic modules for examination of a specimen | |
| JP2022512292A (en) | Classification of defects in semiconductor samples | |
| US20250124307A1 (en) | Machine learning based defect examination and ranking for semiconductor specimens | |
| Kögel et al. | Machine learning based data and signal analysis methods for application in failure analysis | |
| US20260073500A1 (en) | Defect detection using multiple algorithms | |
| US20250284775A1 (en) | Computer-implemented method and system for optimizing a clustering of a plurality of input data | |
| CN120471131A (en) | Training and using neural networks for defect detection | |
| CN121640146A (en) | Small sample PCBA component target detection method and system based on visual basic model | |
| Ahmeda et al. | Multibranch Neural Network For Predicting Production Lot Quality In Semiconductor Industry |
Legal Events
| Date | Code | Title | Description |
|---|---|---|---|
| PUAI | Public reference made under article 153(3) epc to a published international application that has entered the european phase |
Free format text: ORIGINAL CODE: 0009012 |
|
| STAA | Information on the status of an ep patent application or granted ep patent |
Free format text: STATUS: THE APPLICATION HAS BEEN PUBLISHED |
|
| AK | Designated contracting states |
Kind code of ref document: A1 Designated state(s): AL AT BE BG CH CY CZ DE DK EE ES FI FR GB GR HR HU IE IS IT LI LT LU LV MC MK MT NL NO PL PT RO RS SE SI SK SM TR |
|
| STAA | Information on the status of an ep patent application or granted ep patent |
Free format text: STATUS: REQUEST FOR EXAMINATION WAS MADE |
|
| 17P | Request for examination filed |
Effective date: 20230330 |
|
| RBV | Designated contracting states (corrected) |
Designated state(s): AL AT BE BG CH CY CZ DE DK EE ES FI FR GB GR HR HU IE IS IT LI LT LU LV MC MK MT NL NO PL PT RO RS SE SI SK SM TR |
|
| P01 | Opt-out of the competence of the unified patent court (upc) registered |
Effective date: 20230516 |
|
| STAA | Information on the status of an ep patent application or granted ep patent |
Free format text: STATUS: EXAMINATION IS IN PROGRESS |
|
| 17Q | First examination report despatched |
Effective date: 20241008 |