EP4053549A1 - Method for determining structure of substance in multicomponent sample - Google Patents
Method for determining structure of substance in multicomponent sample Download PDFInfo
- Publication number
- EP4053549A1 EP4053549A1 EP20881003.6A EP20881003A EP4053549A1 EP 4053549 A1 EP4053549 A1 EP 4053549A1 EP 20881003 A EP20881003 A EP 20881003A EP 4053549 A1 EP4053549 A1 EP 4053549A1
- Authority
- EP
- European Patent Office
- Prior art keywords
- peak
- solvent
- crystalline sponge
- sfc
- crystalline
- Prior art date
- Legal status (The legal status is an assumption and is not a legal conclusion. Google has not performed a legal analysis and makes no representation as to the accuracy of the status listed.)
- Pending
Links
Images








Classifications
-
- G—PHYSICS
- G01—MEASURING; TESTING
- G01N—INVESTIGATING OR ANALYSING MATERIALS BY DETERMINING THEIR CHEMICAL OR PHYSICAL PROPERTIES
- G01N30/00—Investigating or analysing materials by separation into components using adsorption, absorption or similar phenomena or using ion-exchange, e.g. chromatography or field flow fractionation
- G01N30/02—Column chromatography
- G01N30/88—Integrated analysis systems specially adapted therefor, not covered by a single one of the groups G01N30/04 - G01N30/86
-
- G—PHYSICS
- G01—MEASURING; TESTING
- G01N—INVESTIGATING OR ANALYSING MATERIALS BY DETERMINING THEIR CHEMICAL OR PHYSICAL PROPERTIES
- G01N23/00—Investigating or analysing materials by the use of wave or particle radiation, e.g. X-rays or neutrons, not covered by groups G01N3/00 – G01N17/00, G01N21/00 or G01N22/00
- G01N23/20—Investigating or analysing materials by the use of wave or particle radiation, e.g. X-rays or neutrons, not covered by groups G01N3/00 – G01N17/00, G01N21/00 or G01N22/00 by using diffraction of the radiation by the materials, e.g. for investigating crystal structure; by using scattering of the radiation by the materials, e.g. for investigating non-crystalline materials; by using reflection of the radiation by the materials
- G01N23/20008—Constructional details of analysers, e.g. characterised by X-ray source, detector or optical system; Accessories therefor; Preparing specimens therefor
- G01N23/2005—Preparation of powder samples therefor
-
- G—PHYSICS
- G01—MEASURING; TESTING
- G01N—INVESTIGATING OR ANALYSING MATERIALS BY DETERMINING THEIR CHEMICAL OR PHYSICAL PROPERTIES
- G01N30/00—Investigating or analysing materials by separation into components using adsorption, absorption or similar phenomena or using ion-exchange, e.g. chromatography or field flow fractionation
- G01N30/02—Column chromatography
-
- G—PHYSICS
- G01—MEASURING; TESTING
- G01N—INVESTIGATING OR ANALYSING MATERIALS BY DETERMINING THEIR CHEMICAL OR PHYSICAL PROPERTIES
- G01N2223/00—Investigating materials by wave or particle radiation
- G01N2223/05—Investigating materials by wave or particle radiation by diffraction, scatter or reflection
- G01N2223/056—Investigating materials by wave or particle radiation by diffraction, scatter or reflection diffraction
- G01N2223/0566—Investigating materials by wave or particle radiation by diffraction, scatter or reflection diffraction analysing diffraction pattern
-
- G—PHYSICS
- G01—MEASURING; TESTING
- G01N—INVESTIGATING OR ANALYSING MATERIALS BY DETERMINING THEIR CHEMICAL OR PHYSICAL PROPERTIES
- G01N2223/00—Investigating materials by wave or particle radiation
- G01N2223/60—Specific applications or type of materials
- G01N2223/607—Specific applications or type of materials strain
-
- G—PHYSICS
- G01—MEASURING; TESTING
- G01N—INVESTIGATING OR ANALYSING MATERIALS BY DETERMINING THEIR CHEMICAL OR PHYSICAL PROPERTIES
- G01N30/00—Investigating or analysing materials by separation into components using adsorption, absorption or similar phenomena or using ion-exchange, e.g. chromatography or field flow fractionation
- G01N30/02—Column chromatography
- G01N30/26—Conditioning of the fluid carrier; Flow patterns
Definitions
- the present invention relates to a method of determining the structure of a substance in a multicomponent sample.
- the qualitative analysis of a multicomponent sample comprises the steps of isolating a chemical substance of interest from multiple components and determining the structure or identification of the isolated chemical substance, and is generally difficult to be performed.
- Techniques for isolating a chemical substance include, for example, gas chromatography (GC), high-performance liquid chromatography (HPLC), and capillary electrophoresis.
- GC gas chromatography
- HPLC high-performance liquid chromatography
- target samples of analysis are limited to thermostable volatile compounds though results with higher resolution are provided.
- capillary electrophoresis target samples of analysis are limited to water-soluble ionic compounds.
- HPLC is widely used as a technique for isolating a chemical substance in a multicomponent sample because of fewer limitations with respect to target samples of analysis than those in the above-described techniques.
- SFC supercritical fluid chromatography
- SFC can not only provide high-resolution separation and high-speed analysis but also isolate a wide variety of polar chemical substances, ranging from low-polarity compounds, such as volatile compounds, which are ideal samples for GC, to high-polarity compounds that are to be analyzed by HPLC (Non-Patent Documents 1 to 3). Furthermore, SFC also provides excellent separation and analysis of enantiomers when combined with a chiral column (Non-Patent Document 4).
- a combination of gas chromatography (GC) and a detector for EI-MS can provide MS spectral information regarding to the isolated chemical substance, and the chemical substance can often be identified by comparing the MS spectrum of the isolated chemical substance to the spectra of compounds recorded in a library because the MS spectral data of frequently detected known components is stored in the library.
- the above method can neither identify a chemical substance unregistered in the library, such as that of a novel compound, nor determine the absolute configuration of an enantiomer.
- HPLC is combined with a detector for APCI-MS or ESI-MS, and the difference in principle of ionization for the MS techniques results in generation of different patterns of fragment ions depending on the type of a detector used and on measurement conditions.
- the information obtained is so limited that a chemical substance is not identified by HPLC-MS as easily as by GC-EI/MS.
- HPLC-NMR in which NMR is incorporated as a detector, has been in practical use. This technique is low in sensitivity and is high in cost because of the necessity of a deuterated solvent for the mobile phase but has potential to estimate the structure of an unknown chemical substance.
- SFC has not been practically used in combination either with a detector for EI-MS or with NMR and shows lower performance in identification of an isolated chemical substance than GC or HPLC.
- An object of the present invention is to provide a novel method for determining the structure of a substance in a multicomponent sample.
- SFC supercritical fluid chromatography
- CS crystalline sponge
- the inventors also found that analytical-scale SFC with a column of 4.6 mm or less in internal diameter can be used in combination with the CS method to determine the structure, including the absolute configuration, of a target substance, and further found that a solvent used for the mobile phase of SFC (including a modifier solvent and a make-up solvent) can be changed to a solvent applicable to the crystalline sponge method to allow the separation step by SFC and the structure determination step by the CS method to be performed sequentially on line.
- the inventors further found a combination of a solvent used for the mobile phase of SFC and a crystalline sponge resistant to the solvent.
- the present invention is based on the above findings.
- the present invention provides the following inventions.
- An advantage of the method of the invention is that the method can quickly and precisely determine the structure (particularly, the absolute configuration) of a target substance in a multicomponent sample (particularly, a mixture of various polar compounds), which is difficult to be analyzed.
- the invention is a method of determining the structure of a target substance contained in a multicomponent sample, or in a mixture of two or more substances.
- the target substance of analysis for structure determination is not specifically limited, provided that the substance can be isolated by the step (A) and be analyzed for structural features by the step (C).
- the analysis for structure determination mainly targets organic compounds and also targets peptides, nucleic acids, and the like.
- the method of the invention comprises the steps of: (A) isolating a target substance from a mixture of two or more substances by means of supercritical fluid chromatography (SFC); (B) soaking the isolated target substance into a crystalline sponge (CS) to produce a sample for crystallography; and (C) performing a crystallographic analysis on the sample for crystallography.
- SFC supercritical fluid chromatography
- CS crystalline sponge
- SFC is used to isolate the target substance for structure determination from the mixture and to collect a solution containing the target substance.
- a wide variety of polar substances ranging from volatile or highly hydrophobic compounds to hydrophilic compounds, can be isolated by the SFC method, and basic operations of SFC are known.
- the target substance can be isolated and collected according to routine procedures of SFC and high-performance liquid chromatography (HPLC).
- HPLC high-performance liquid chromatography
- the target substance can be isolated and collected using a commercially available device for SFC according to the operating manual of the device.
- a blend of carbon dioxide and a solvent called modifier for adjusting the separation of compounds is used as the mobile phase of SFC.
- a volatile organic solvent, a volatile acid, or a volatile base is often used as the modifier.
- a target substance isolated by SFC is collected by fractionation, while the carbon dioxide in the mobile phase is vaporized.
- the target substance dissolved in the modifier solvent is collected in a fraction collector or the like.
- a make-up solvent is a solvent that is added separately during a period when the target substance is isolated by column chromatography and collected in a fraction collector or the like, and the make-up solvent is added for the purpose of increasing the solubility of the target substance or other purposes.
- the collected target substance may be dissolved in the modifier solvent or in a mixed solvent of the modifier solvent and the make-up solvent.
- the mixture that is subjected to SFC in the step (A) contains two or more substances, and the form of the mixture is not specifically limited as long as the mixture contains two or more substances.
- the mixture subjected to SFC include food compositions (including beverage compositions), pharmaceutical compositions, healthcare compositions, oral care compositions, flavors, natural products (for example, food materials such as fruits, vegetables, spices, and herbs) and their extracts, synthetic organic compounds (for example, coating materials, pigments, agrochemicals, pesticides), biological samples (for example, blood, urine, saliva, nasal mucus, biological tissues, organs), environmental samples (for example, river water, lake water, seawater, soil), and enzymatic reaction products.
- the method of the invention can determine the structure of a substance contained in a multicomponent sample that contains multiple similar substances, so that the method of the invention can be suitably applied to natural products and synthetic organic compounds, which potentially contain similar substances.
- the target substance in the mixture may be a strongly polar substance, for example, and the target substance can be a polar substance with an octanol-water partition coefficient (log P ow ) of not less than -4.6.
- the octanol-water partition coefficient is defined as the concentration ratio of a compound between two phases of octanol and water (K ow ), where the compound is dissolved in the octanol phase and in water.
- log P ow the common logarithm of K ow , is used as the octanol-water partition coefficient.
- the solution containing the target substance collected in the step (A) is soaked into a crystalline sponge to produce a sample for crystallography.
- the crystalline sponge is a single crystal material with regular porous structures and can be made for example from metal-organic frameworks (MOFs), covalent organic frameworks (COFs), porous organic molecular crystals (POMCs), inorganic compounds, such as zeolites, or the like.
- MOFs metal-organic frameworks
- COFs covalent organic frameworks
- POMCs porous organic molecular crystals
- the source of the single crystal material is not limited, provided that a compound is incorporated as a guest into pores of the single crystal material.
- An example of the crystalline sponge composed of a metal-organic framework is a polymer metal complex with a three-dimensional network structure, which is composed of a ligand with two or more coordination sites and a metal ion as a coordination center.
- the "three-dimensional network structure" as used herein refers to a network structure composed of repeating structural units, extending in three dimensions, each unit formed by a ligand (a ligand with two or more coordination sites or any of other monodentate ligands) and a metal ion bound thereto.
- a single crystal metal-organic framework that can be used as a crystalline sponge is described in the following literature: for example, Nature 2013, 495, 461-466 ; Chem. Commun.
- a [(ZnX 2 ) 3 (tpt) 2 -(solvent) a ] n -type crystalline sponge (wherein X represents a halogen atom such as chlorine, bromine, iodine, or fluorine, and "tpt” represents 2,4,6-tri(4-pyridyl)-1,3,5-triazine, and "solvent” represents a solvent confined in pores and other structures, and "a” represents a number of not less than 0, and "n” represents a positive integer; the same applies below) described, for example, in Nature 2013, 495, 461-466 and Chem. Commun. 2015, 51, 11252-11255 is preferred in consideration of convenience for single crystal preparation.
- the method of soaking the target substance in a crystalline sponge to incorporate the target substance as a guest into pores is not specifically limited, as long as the method allows the target substance as a guest to be incorporated into pores.
- the target substance can be incorporated as a guest into pores by a method described in the following literature: for example, IUCrJ 2016, 3, 139-151 ; Chem. Eur. J. 2017, 23, 15035-15040 ; CrystEngComm, 2017, 19, 4528-4534 ; Org. Lett. 2018, 20, 3536-3540 ; Science 2016, 353, 808-811 ; and Chem. Commun. 2015, 51, 11252-11255 .
- the presence of water in a crystalline sponge may destroy its own structure, depending on the type of the crystalline sponge. Therefore, the sample containing the target substance collected in the step (A) may be made free of water before proceeding to the step (B).
- a [(ZnX 2 ) 3 (tpt) 2 ⁇ (solvent) a ] n -type crystalline sponge which can incorporate various compounds as a guest and shows excellent performance in structure determination should be away from contamination with water, because the crystal structure of the sponge is destroyed in an environment containing water as a solvent.
- a volatile mobile phase is used throughout the separation procedure in SFC, as described above, and a portion of or all the volatile solvent is evaporated from the fraction containing the target substance collected in the step (A), immediately before the resulting fraction is used for the production of a sample for crystallography in the step (B).
- a volatile solvent preferably a volatile solvent not containing water
- the method of the invention may comprise the step of evaporating a portion of or all the volatile solvent from the isolated target substance after the step (A) and before the step (B). Additionally, an appropriate solvent may be added in the step (B) to adjust the concentration of the target substance.
- the inclusion of such a step provides an advantage to the method of the invention in that the steps (A), (B), and (C) can be performed sequentially.
- the phrase "performed sequentially" means on-line performance of the steps (A), (B), and (C) by a connection of devices for performing SFC and the CS method, as well as sequential off-line performance of those steps.
- a solvent that can be used for the soaking into a crystalline sponge in the step (B) may be used as the solvent (including the modifier solvent and the make-up solvent) used for the mobile phase of SFC in the step (A). That is, the solvent used for the step (A) may be the same as the solvent used for the step (B) or can be selected to be a solvent that has no adverse effects on a crystalline sponge (for example, not causing destruction or dissolution of a crystalline sponge) when the solvent is different from the solvent used for the step (B).
- vials containing a crystalline sponge soaked in a solvent may be prepared prior to the step (B), and a substance isolated by a SFC device is collected directly into the vials together with a solvent used as the mobile phase of SFC.
- the step of evaporating a portion of or all the volatile solvent from the isolated target substance after the step (A) and before the step (B) can be omitted, which advantageously allows seamless connection of a device for performing the step (A) to that for performing the step (B) and quick analysis of the structure of the target substance.
- a volatile compound is so prone to be lost by volatilization that the structure of the compound is difficult to be analyzed from a tiny amount of the sample.
- the seamless connection of a device for performing the step (A) to that for performing the step (B) allows for isolation of a compound from a mixture as a target of analysis and subsequent incorporation of the compound into pores of a crystalline sponge, which enables structural analysis of the compound in a tiny amount of the sample without loss by volatilization.
- hydrocarbons such as n -hexane, cyclohexane, benzene, and toluene
- ethers such as methyl tert-butyl ether (MTBE) and dimethoxyethane (DME)
- esters such as ethyl acetate
- ketones such as acetone and 2-butanone
- alcohols such as methanol, ethanol, propanol, and isopropanol, as well as hydrocarbons, ethers, esters, ketones, and carbon dioxide as described above, are suitable for [CuBr(btt)]-type crystalline sponges, and nitriles
- the sample for crystallography produced in the step (B) can be analyzed by crystallography to determine the molecular structure of the target substance. Any technique selected from X-ray diffraction, neutron diffraction, and electron diffraction may be used for the crystallographic analysis. Additionally, the measurement data, or the structure of the target substance, can be analyzed by a known method. For example, the steps (B) and (C) can be performed as described in WO 2014/038220 or in IUCrJ 2016, 3, 139-151 .
- the method of the invention can quickly and precisely determine the structure of a target substance in a multicomponent sample, which is difficult to be analyzed. Even if the target substance is a mixture of isomers, these isomers can be separated to identify and determine the structure of each isomer.
- Isomers include structural isomers and stereoisomers, and structural isomers include positional isomers and the like, and stereoisomers include conformational isomers and configurational isomers.
- configuration isomers includes optical isomers (enantiomers) and diastereoisomers (diastereomers).
- enantiomeric compounds such as active ingredients, candidates for active ingredients, seasoning ingredients, or flavoring ingredients, in pharmaceutical products or foods with functional claims
- only one of the enantiomers may function as an active ingredient.
- the method of the invention can quickly and precisely determine the absolute configuration of each compound contained in a multicomponent sample.
- Example 1 Separation of Enantiomers in a Racemic Sample by SFC (1)
- Example 1 a preparative SFC device suitable for use of a column with an internal diameter of not less than 10 mm was used to separate enantiomers in a racemic sample.
- omeprazole As the racemic sample, omeprazole (Tokyo Chemical Industry Co., Ltd.), which is an active ingredient in a commercially available pharmaceutical product and is obtainable as a general reagent, was used.
- Omeprazole (racemate) was prepared at a concentration of 10 mg/mL in methanol, and subjected to supercritical fluid chromatography (SFC) (Waters Thar Supercritical Fluid Chromatography System; Waters Corporation) under the following conditions.
- SFC supercritical fluid chromatography
- Example 2 the absolute configuration was determined by the CS Method for each of the two enantiomers of the racemic compound which were separated and collected in Example 1.
- the crystalline sponge was stored with being immersed in n -hexane until before use, and the solvent was exchanged with the above MTBE/DME mixed solvent just before use, and the resulting crystalline sponge was then used for the experiment.
- the measurement data was analyzed according to the method described in Chem. Eur. J. 2017, 23, 15035-15040 .
- Table 2 Crystallographic Data Peak 1 Peak 2 Formula in the asymmetric unit C 110.48 H 131.48 C 112 N 25.50 O 13.49 S 0.50 Zn 6 C 110.45 H 131.45 C 112 N 25.49 O 13.48 S 0.50 Zn 6 Molecular weight 2866.04 2865.43 Crystal color and habit yellow and blocky yellow and blocky Crystal system Monoclinic Monoclinic a ( ⁇ ) 32.9454(2) 33.0111(2) b ( ⁇ ) 14.46490(10) 14.45920(10) c ( ⁇ ) 31.1401(2) 31.1588(2) ⁇ (°) 100.5690(10) 100.6490(10) V ( ⁇ 3 ) 14588.11(17) 14616.39(17) Z 4 4
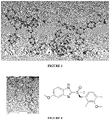
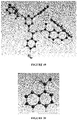
- FIGS. 2 and 3 Crystal structures of the asymmetric unit for the crystalline sponges that have incorporated the compounds eluted as Peak 1 and Peak 2 are shown in FIGS. 2 and 3 , respectively. Each molecule enclosed by the dotted line indicates the guest incorporated in the crystalline sponge. Additionally, the structures of only the observed guests are shown in FIGS. 4 and 5 , respectively. From these results, the enantiomers corresponding to Peak 1 and Peak 2 were determined and identified to be the S - and R -isomers of omeprazole, respectively.
- Example 3 enantiomers in a racemic sample were separated using an analytical-scale SFC device (Shimadzu Nexera UC; Shimadzu Corporation) suitable for use of a column with an internal diameter of not more than 4.6 mm together with a fraction collector (FRC-40 SF; Shimadzu Corporation).
- an analytical-scale SFC device Shimadzu Nexera UC; Shimadzu Corporation
- FRC-40 SF fraction collector
- rac -(4 R ,5 R )-3,5-dihydroxy-4-(3-methylbut-2-en-1-yl)-2-(3-methylbutanoyl)cyclopent-2-en-1-one (this compound can be tautomerized to a compound with the structure of rac -(4 R ,5 R )-3,4-dihydroxy-5-(3-methylbut-2-en-1-yl)-2-(3-methylbutanoyl)cyclopent-2-en-1-one) was prepared according to the method described in J. Inst. Brew. 1990, 96, 137-141 .
- This racemic compound was prepared in methanol at a concentration of 86 mg/mL and subjected to SFC under the conditions described in Table 3.
- the Shimadzu Nexera UC (Shimadzu Corporation) was used as a SFC device, and each separated compound was collected by a fraction collector FRC-40 SF (Shimadzu Corporation).
- a make-up solvent was delivered at a constant flow rate into the fraction collector to increase the efficiency of sample collection.
- Table 3 Conditions for SFC Column CHIRALPAK IG 4.6 mm i.d.
- Example 4 the absolute configuration was determined by the CS Method for each of the two enantiomers of the racemic compound which were separated and collected in Example 3.
- one granule of a crystalline sponge (a size of 100 ⁇ m ⁇ 100 ⁇ m ⁇ 100 ⁇ m multiplied by a density of 1.3 g/cm 3 gives a theoretical weight of 1.3 ⁇ g) and 50 ⁇ L of n -hexane were added together to each vial.
- the vials were capped, and each cap was pierced with an injection needle, and the vials were incubated at 50°C to gently evaporate the solvent.
- the measurement data was analyzed according to the method described in Chem. Eur. J. 2017, 23, 15035-15040 .
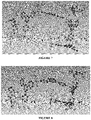
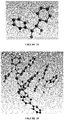
- Crystal structures of the asymmetric unit for the crystalline sponges that have incorporated the compounds eluted as Peak 1 and Peak 2 are shown in FIGS. 7 and 8 , respectively. Each molecule enclosed by the dotted line indicates the guest incorporated in the crystalline sponge. Additionally, the structures of only the observed guests are shown in FIGS. 9 and 10 , respectively.
- Example 5 enantiomers in a racemic sample were separated using a SFC device and a fraction collector which are the same type of devices as those used in Example 3 and employing an elution solvent identical to that used for the CS method.
- trans -stilbene oxide As the racemic sample, a racemic mixture of trans -stilbene oxide (Tokyo Chemical Industry Co., Ltd.), which is obtainable as a general reagent, was used.
- Trans -stilbene oxide (racemate) was prepared in methyl tert-butyl ether (MTBE) at a concentration of 10 mg/mL and subjected to SFC under the conditions described in Table 5.
- MTBE methyl tert-butyl ether
- Table 5 the Shimadzu Nexera UC (Shimadzu Corporation) was used as a SFC device, and each separated compound was collected by a fraction collector FRC-40 SF (Shimadzu Corporation).
- a make-up solvent was delivered at a constant flow rate into the fraction collector to increase the efficiency of sample collection.
- Example 6 the absolute configuration was determined by the CS method for each of the two enantiomers of the racemic compound which were separated and collected in Example 5.
- the solvent inside the crystalline sponge was replaced with methyl tert -butyl ether (MTBE) by removing the n -hexane from and adding 50 ⁇ L of MTBE to the vial.
- MTBE methyl tert -butyl ether
- the measurement data was analyzed according to the method described in Chem. Eur. J. 2017, 23, 15035-15040 .
- Crystal structures of the asymmetric unit for the crystalline sponges that have incorporated the compounds eluted as Peak 1 and Peak 2 are shown in FIGS. 12 and 13 , respectively. Each molecule enclosed by the dotted line indicates the guest incorporated in the crystalline sponge. Additionally, the structures of only the observed guests are shown in FIGS. 14 and 15 , respectively. From these results, the enantiomers corresponding to Peak 1 and Peak 2 were determined and identified to be the RR isomer of trans -stilbene oxide ((2 R ,3 R )-2,3-diphenyloxirane) and the SS isomer of trans -stilbene oxide ((2 S ,3 S )-2,3-diphenyloxirane). The results of Examples 5 and 6 have confirmed that the structure of a compound can be analyzed by isolating the compound by SFC and collecting the compound directly into a vial containing a crystalline sponge to allow incorporation of the compound.
- Example 7 Production of a Methanol-Resistant Crystalline Sponge
- a [CuBr(btt)]-type crystalline sponge was produced by synthesis from benzene-1,3,5-triyl triisonicotinate (btt) and CuBr according to the method described in Chem. Asian J. 2017, 12, 208-211 .
- the crystalline sponge was soaked in methanol for several days, and the crystal structure of the crystalline sponge was then analyzed.
- Example 8 Separation of a Mixed Sample of Positional Isomers by SFC
- Example 8 positional isomers in a mixed sample were separated using a SFC device and a fraction collector which are the same type of devices as those used in
- Example 3 and employing an elution solvent identical to that used for the CS Method.
- Example 9 the structure was determined by the CS method using the crystalline sponge produced in Example 7 for each of the two positional isomeric compounds separated and collected in Example 8.
- the measurement data was analyzed according to the methods described in Chem. Eur. J. 2017, 23, 15035-15040 and in Chem. Asian J. 2017, 12, 208-211 .
- Table 8 Crystallographic Data Peak 1 Peak 2 Crystal system Monoclinic Monoclinic a ( ⁇ ) 31.9635(7) 30.0915(10) b ( ⁇ ) 7.7800(1) 7.71070(10) c ( ⁇ ) 30.6494(6) 32.6089(11) ⁇ (°) 115.897(3) 117.332(4) V ( ⁇ 3 ) 6856.4(2) 6721.5(4) Measurement temperature (K) 100.00(10) 100.00(10) Z 4 8 Space group P2 1 /c I2/a Rint 0.0561 0.0301 R 1 0.0631 0.0845 wR 2 0.1926 0.2394 GoF 1.121 1.123
- Crystal structures of the asymmetric unit for the crystalline sponges that have incorporated the compounds eluted as Peak 1 and Peak 2 are shown in FIGS. 18 and 19 , respectively. Each molecule enclosed by the dotted line indicates the guest incorporated in the crystalline sponge. Additionally, the structures of only the observed guests are shown in FIGS. 20 and 21 , respectively. From these results, the positional isomers corresponding to Peak 1 and Peak 2 were determined and identified to be 1-acetylnaphthalene and 2-acetylnaphthalene, respectively.
- Examples 8 and 9 have confirmed that a methanol-resistant crystalline sponge can be used for analysis of the structure of a compound, wherein the compound is isolated by SFC (methanol is contained in the mobile phase) and collected directly into a vial containing the crystalline sponge to allow incorporation of the compound.
- SFC methanol is contained in the mobile phase
- a [Co 2 ( R -man) 2 (bpy) 3 ](NO 3 ) 2 -type crystalline sponge and a [Co 2 ( S- man) 2 (bpy) 3 ](NO 3 ) 2 -type crystalline sponge were produced by synthesis from 4,4'-bipyridine (bpy), ( S )-mandelic acid ( S -man) or ( R )-mandelic acid ( R -man), and Co(NO 3 ) 2 according to the method described in J. Am. Chem. Soc. 2015, 137, 12045-12049 . These crystalline sponges were soaked in acetonitrile for several days, and the crystal structures of the crystalline sponges were then analyzed.
- Example 11 Separation of a Mixed Sample of Stereoisomers by SFC
- Example 11 stereoisomers in a mixed sample were separated using a SFC device and a fraction collector which are the same type of devices as those used in Example 3 and employing an elution solvent identical to that used for the CS method.
- the Shimadzu Nexera UC (Shimadzu Corporation) was used as a SFC device, and each separated compound was collected by a fraction collector FRC-40 SF (Shimadzu Corporation). A make-up solvent was delivered at a constant flow rate into the fraction collector to increase the efficiency of sample collection.
- Table 9 Conditions for SFC Column CHIRALPAK IG 4.6 mm i.d.
- Example 12 the structure was determined by the CS method using the [Co 2 ( R -man) 2 (bpy) 3 ](NO 3 ) 2 -type crystalline sponge produced in Example 10 for each of the three stereoisomeric compounds separated and collected in Example 11.
- Crystal structures of the asymmetric unit for the crystalline sponges that have incorporated the compounds eluted as Peak 1, Peak 2, and Peak 3 are shown in FIGS. 24 , 25, and 26 , respectively. Each molecule enclosed by the dotted line indicates the guest incorporated in the crystalline sponge. Additionally, the structures of only the observed guests are shown in FIGS. 27, 28 , and 29 , respectively. From these results, the stereoisomers corresponding to Peak 1, Peak 2, and Peak 3 were determined and identified to be ( S , S )-hydrobenzoin, meso -hydrobenzoin, and ( R , R )-hydrobenzoin, respectively.
- Examples 11 and 12 have confirmed that an acetonitrile-resistant crystalline sponge can be used for analysis of the structure of a compound, wherein the compound is isolated by SFC (acetonitrile is contained in the mobile phase) and collected directly into a vial containing the crystalline sponge to allow incorporation of the compound.
- SFC acetonitrile is contained in the mobile phase
- Example 13 the structure was determined by the CS method using the [Co 2 ( S -man) 2 (bpy) 3 ](NO 3 ) 2 -type crystalline sponge produced in Example 10 for each of the three stereoisomeric compounds separated and collected in Example 11.
- Measurement and analysis were performed by a method similar to that in Example 12, except that the [Co 2 ( R -man) 2 (bpy) 3 ](NO 3 ) 2 -type crystalline sponge used in Example 12 was replaced with the opposite enantiomer, [Co 2 ( S -man) 2 (bpy) 3 ](NO 3 ) 2 -type crystalline sponge.
- Crystal structures of the asymmetric unit for the crystalline sponges that have incorporated the compounds eluted as Peak 1, Peak 2, and Peak 3 are shown in FIGS. 30 , 31, and 32 , respectively. Each molecule enclosed by the dotted line indicates the guest incorporated in the crystalline sponge. Additionally, the structures of only the observed guests are shown in FIGS. 33, 34 , and 35 , respectively. From these results, the stereoisomers corresponding to Peak 1, Peak 2, and Peak 3 were determined and identified to be ( S , S )-hydrobenzoin, meso -hydrobenzoin, and ( R , R )-hydrobenzoin, respectively.
- Examples 11 and 13 have confirmed that an acetonitrile-resistant crystalline sponge can be used for analysis of the structure of a compound, wherein the compound is isolated by SFC (acetonitrile is contained in the mobile phase) and collected directly into a vial containing the crystalline sponge to allow incorporation of the compound.
- SFC acetonitrile is contained in the mobile phase
- the crystal structure of the [Co 2 ( R -man) 2 (bpy) 3 ](NO 3 ) 2 -type crystalline sponge with the incorporated compound corresponding to Peak 1 and the crystal structure of the [Co 2 ( S -man) 2 (bpy) 3 ](NO 3 ) 2 -type crystalline sponge with the incorporated compound corresponding to Peak 3 are mirror images of each other.
- the crystal structure of the [Co 2 ( R -man) 2 (bpy) 3 ](NO 3 ) 2 -type crystalline sponge with the incorporated compound corresponding to Peak 3 and the crystal structure of the [Co 2 ( S- man) 2 (bpy) 3 ](NO 3 ) 2 -type crystalline sponge with the incorporated compound corresponding to Peak 1 are mirror images of each other.
- the crystal structure of the [Co 2 ( R -man) 2 (bpy) 3 ](NO 3 ) 2 -type crystalline sponge with the incorporated compound corresponding to Peak 2 and the crystal structure of the [Co 2 ( S- man) 2 (bpy) 3 ](NO 3 ) 2 -type crystalline sponge with the incorporated compound corresponding to Peak 2 are also mirror images of each other.
- Example 14 Separation of a Mixed Sample of Volatile Structural Isomers by SFC (1)
- Example 14 structural isomers of a volatile compound in a mixed sample were separated using a SFC device and a fraction collector which are the same type of devices as those used in Example 3 and employing an elution solvent identical to that used for the CS method.
- Example 15 the absolute configuration was determined by the CS method for each of the two structural isomers of a volatile monoterpene compound which were separated and collected in Example 14.
- the solvent inside the crystalline sponge was replaced with methyl tert -butyl ether (MTBE) by removing the n -hexane from and adding 50 ⁇ L of MTBE to the vial.
- MTBE methyl tert -butyl ether
- the measurement data was analyzed according to the method described in Chem. Eur. J. 2017, 23, 15035-15040 .
- Table 13 Crystallographic Data Peak 1 Peak 2 Crystal system Monoclinic Monoclinic a ( ⁇ ) 33.96777(12) 33.14265(14) b ( ⁇ ) 14.45906(4) 14.43794(6) c ( ⁇ ) 30.95203(9) 30.65267(15) ⁇ (°) 99.8945(3) 99.7981(4) V ( ⁇ 3 ) 14389.41(7) 14453.70(11) Measurement temperature (K) 99.8(4) 100.00(16) Z 4 4 Space group C2 C2 Rint 0.0196 0.0296 R 1 0.0676 0.0623 wR 2 0.2273 0.2053 GoF 1.056 1.080 Flack parameter (Parsons) 0.038(6) 0.046(5)
- Example 16 Separation of a Mixed Sample of Volatile Structural Isomers by SFC (2)
- Example 16 structural isomers of a volatile compound in a mixed sample were separated using a SFC device and a fraction collector which are the same type of devices as those used in Example 3 and employing an elution solvent identical to that used for the CS method.
- Example 17 the absolute configuration was determined by the CS method for each of the two structural isomers of a volatile sesquiterpene compound separated and collected in Example 16.
- the solvent inside the crystalline sponge was replaced with methyl tert -butyl ether (MTBE) by removing the n -hexane from and adding 50 ⁇ L of MTBE to the vial.
- MTBE methyl tert -butyl ether
- the measurement data was analyzed according to the method described in Chem. Eur. J. 2017, 23, 15035-15040 .
- Table 15 Crystallographic Data Peak 1 Peak 2 Crystal system Monoclinic Monoclinic a ( ⁇ ) 33.12401(15) 33.42421(15) b ( ⁇ ) 14.46180(6) 14.43311(5) c ( ⁇ ) 30.73803(14) 31.30072(14) ⁇ (°) 99.7599(4) 101.5552(4) V ( ⁇ 3 ) 14511.42(11) 14793.90(11) Measurement temperature (K) 99.96(13) 100.01(10) Z 4 4 Space group C2 C2 Rint 0.0259 0.0267 R 1 0.0458 0.0564 wR 2 0.1394 0.1799 GoF 1.048 1.084 Flack parameter (Parsons) 0.023(3) 0.046(5)
- Crystal structures of the asymmetric unit for the crystalline sponges that have incorporated the compounds eluted as Peak 1 and Peak 2 are shown in FIGS. 42 and 43 , respectively. Each molecule enclosed by the dotted line indicates the guest incorporated in the crystalline sponge. Additionally, the structures of only the observed guests are shown in FIGS. 44 and 45 , respectively.
- a [Co 2 ( R -man) 2 (bpy) 3 ](NO 3 ) 2 -type crystalline sponge and a [Co 2 ( S- man) 2 (bpy) 3 ](NO 3 ) 2 -type crystalline sponge were produced by synthesis from 4,4'-bipyridine (bpy), ( S )-mandelic acid ( S -man) or ( R )-mandelic acid ( R -man), and Co(NO 3 ) 2 according to the method described in J. Am. Chem. Soc. 2015, 137, 12045-12049 . These crystalline sponges were soaked in isopropanol for several days, and the crystal structures of the crystalline sponges were then analyzed.
- Example 19 enantiomers of a volatile racemate were separated using a SFC device and a fraction collector which are the same type of devices as those used in Example 3 and employing an elution solvent identical to that used for the CS method.
- a volatile monoterpene racemate, rac-terpinen-4-ol (FUJIFILM Wako Pure Chemical Corporation), was used as a volatile racemic sample, and the sample prepared in isopropanol at a concentration of 20 mg/mL was subjected to SFC under the conditions described in Table 16.
- the Shimadzu Nexera UC (Shimadzu Corporation) was used as a SFC device, and each separated compound was collected by a fraction collector FRC-40 SF (Shimadzu Corporation).
- a make-up solvent was delivered at a constant flow rate into the fraction collector to increase the efficiency of sample collection.
- Table 16 Conditions for SFC Column CHIRALPAK IG 4.6 mm i.d.
- Example 20 the absolute configuration was determined by the CS method using the crystalline sponge produced in Example 18 for each of the enantiomeric compounds separated and collected in Example 19.
- Table 17 Crystallographic Data Peak 1 Peak 2 Crystal system Monoclinic Monoclinic a ( ⁇ ) 10.1997(2) 10.17849(18) b ( ⁇ ) 24.6572(6) 24.7746(4) c ( ⁇ ) 11.4298(2) 11.42571(14) ⁇ (°) 92.4691(17) 91.4303(12) V ( ⁇ 3 ) 2871.88(10) 2880.30(7) Measurement temperature (K) 100.00(10) 100.00(10) Z 2 2 Space group P2 1 P2 1 Rint 0.0706 0.0512 R 1 0.0876 0.0610 wR 2 0.2317 0.1716 GoF 1.083 1.057 Flack parameter (Parsons) 0.006(8) 0.010(4)
- Crystal structures of the asymmetric unit for the crystalline sponges that have incorporated the compounds eluted as Peak 1 and Peak 2 are shown in FIGS. 48 and 49 , respectively. Each molecule enclosed by the dotted line indicates the guest incorporated in the crystalline sponge. Additionally, the structures of only the observed guests are shown in FIGS. 50 and 51 , respectively. From these results, the enantiomers corresponding to Peak 1 and Peak 2 were determined and identified to be S -terpinen-4-ol ((4 S )-4-isopropyl-1-methyl-1-cyclohexen-4-ol) and R -terpinen-4-ol ((4 R )-4-isopropyl-1-methyl-1-cyclohexen-4-ol), respectively.
- Examples 18, 19, and 20 have confirmed that an isopropanol-resistant crystalline sponge can be used for analysis of the structure of a volatile compound, wherein the compound is isolated by SFC (isopropanol is contained in the mobile phase) and collected directly into a vial containing the crystalline sponge to allow incorporation of the compound.
- SFC isopropanol is contained in the mobile phase
- Example 21 Determination of Absolute Configuration by the CS Method Using a Conventional Crystalline Sponge with Removal of Isopropanol Under Nitrogen Gas Flow
- Isopropanol destroys [(ZnCl 2 ) 3 (tpt) 2 ] n -type crystalline sponges.
- the inventors studied in Example 21 whether or not removal of isopropanol contained in an eluate under nitrogen gas flow would allow the absolute configuration of a volatile compound to be determined by the CS method. Specifically, the following procedure was adopted.
- the vials were capped, and each cap was pierced with an injection needle, and the vials were incubated at 50°C to gently evaporate the remaining solvent.
- the target compound of analysis was not observed. Possible loss of the volatile target compound during the removal of isopropanol from the eluate was considered as a reason for the unsuccessful observation.
Landscapes
- Chemical & Material Sciences (AREA)
- General Health & Medical Sciences (AREA)
- Life Sciences & Earth Sciences (AREA)
- Health & Medical Sciences (AREA)
- Analytical Chemistry (AREA)
- Biochemistry (AREA)
- Physics & Mathematics (AREA)
- General Physics & Mathematics (AREA)
- Immunology (AREA)
- Pathology (AREA)
- Crystallography & Structural Chemistry (AREA)
- Analysing Materials By The Use Of Radiation (AREA)
- Other Investigation Or Analysis Of Materials By Electrical Means (AREA)
Abstract
Description
- This application enjoys the benefit of priority from the prior
Japanese Patent Application Nos. 2019-200020 (filed on November 1, 2019 2020-014066 (filed on January 30, 2020 - The present invention relates to a method of determining the structure of a substance in a multicomponent sample.
- Qualitative analysis of a multicomponent sample is prevalent in industries including, for example, pharmaceutical, food, cosmetic, and material engineering industries and is an essential process for research and development or for product development. The qualitative analysis of a multicomponent sample comprises the steps of isolating a chemical substance of interest from multiple components and determining the structure or identification of the isolated chemical substance, and is generally difficult to be performed. Techniques for isolating a chemical substance include, for example, gas chromatography (GC), high-performance liquid chromatography (HPLC), and capillary electrophoresis. In GC, target samples of analysis are limited to thermostable volatile compounds though results with higher resolution are provided. In capillary electrophoresis, target samples of analysis are limited to water-soluble ionic compounds. HPLC is widely used as a technique for isolating a chemical substance in a multicomponent sample because of fewer limitations with respect to target samples of analysis than those in the above-described techniques.
- In recent years, supercritical fluid chromatography (SFC) has been attracting attention as a technique for isolating a chemical substance in a multicomponent sample. SFC uses carbon dioxide in a supercritical fluid state as the mobile phase, and this allows for significant reduction in the amount of an organic solvent used for the mobile phase compared with that used in HPLC and also attracts attention to SFC as a separation and analysis technique giving less burden to the environment, from the viewpoint of filling social needs of establishing a low-carbon society. Moreover, SFC can not only provide high-resolution separation and high-speed analysis but also isolate a wide variety of polar chemical substances, ranging from low-polarity compounds, such as volatile compounds, which are ideal samples for GC, to high-polarity compounds that are to be analyzed by HPLC (
Non-Patent Documents 1 to 3). Furthermore, SFC also provides excellent separation and analysis of enantiomers when combined with a chiral column (Non-Patent Document 4). - In the step of identifying an isolated chemical substance in the qualitative analysis of a multicomponent sample, a combination of gas chromatography (GC) and a detector for EI-MS can provide MS spectral information regarding to the isolated chemical substance, and the chemical substance can often be identified by comparing the MS spectrum of the isolated chemical substance to the spectra of compounds recorded in a library because the MS spectral data of frequently detected known components is stored in the library. However, the above method can neither identify a chemical substance unregistered in the library, such as that of a novel compound, nor determine the absolute configuration of an enantiomer. In general, HPLC is combined with a detector for APCI-MS or ESI-MS, and the difference in principle of ionization for the MS techniques results in generation of different patterns of fragment ions depending on the type of a detector used and on measurement conditions. Thus, the information obtained is so limited that a chemical substance is not identified by HPLC-MS as easily as by GC-EI/MS. Accordingly, HPLC-NMR, in which NMR is incorporated as a detector, has been in practical use. This technique is low in sensitivity and is high in cost because of the necessity of a deuterated solvent for the mobile phase but has potential to estimate the structure of an unknown chemical substance. In contrast, SFC has not been practically used in combination either with a detector for EI-MS or with NMR and shows lower performance in identification of an isolated chemical substance than GC or HPLC.
- As seen above, there still remains a room for improvement in qualitative analysis of multicomponent samples containing various chemical substances.
-
- Non-Patent Document 1: J. Chromatogr. A, 2012, 1266, 143-148.
- Non-Patent Document 2: J. Agric. Food Chem., 2015, 63(18), 4457-4463.
- Non-Patent Document 3: J. Chromatogr. A, 2014, 1362, 270-277.
- Non-Patent Document 4: Anal. Chim. Acta, 2014, 821, 1-33.
- An object of the present invention is to provide a novel method for determining the structure of a substance in a multicomponent sample.
- The inventors made efforts to study a method of identifying a target substance in a multicomponent sample and consequently found that supercritical fluid chromatography (hereinafter sometimes referred to simply as "SFC") can be used in combination with the crystalline sponge (hereinafter sometimes referred to simply as "CS") method for isolating a target substance from a multicomponent sample and for identifying the isolated substance and also for determining the absolute configuration or identification of an enantiomer, which is beyond the ability of MS or NMR. The inventors also found that analytical-scale SFC with a column of 4.6 mm or less in internal diameter can be used in combination with the CS method to determine the structure, including the absolute configuration, of a target substance, and further found that a solvent used for the mobile phase of SFC (including a modifier solvent and a make-up solvent) can be changed to a solvent applicable to the crystalline sponge method to allow the separation step by SFC and the structure determination step by the CS method to be performed sequentially on line. The inventors further found a combination of a solvent used for the mobile phase of SFC and a crystalline sponge resistant to the solvent. The present invention is based on the above findings.
- The present invention provides the following inventions.
- [1] A method of determining the structure of a target substance contained in a mixture of two or more substances, the method comprising the steps of: (A) isolating the target substance from the mixture by means of supercritical fluid chromatography; (B) soaking the isolated target substance into a crystalline sponge to produce a sample for crystallography, and (C) performing a crystallographic analysis on the sample for crystallography.
- [2] The method according to [1], wherein, in the step (A), a volatile solvent is used as a mobile phase in the supercritical fluid chromatography.
- [3] The method according to [2], further comprising the step of evaporating the volatile solvent in the isolated target substance after the step (A) and before the step (B).
- [4] The method according to any of [1] to [3], wherein the steps (A), (B), and (C) are performed sequentially.
- [5] The method according to [4], wherein the solvent used as a mobile phase in the supercritical fluid chromatography of the step (A) is a solvent which can be used for the soaking into a crystalline sponge in the step (B).
- [6] The method according to [4] or [5], wherein a device for performing the step (A) and a device for performing the step (B) are seamlessly connected together to perform the steps (A), (B), and (C).
- [7] The method according to any of [1] to [6], wherein the target substance contained in the mixture has an octanol-water partition coefficient (log Pow) of not less than -4.6.
- [8] The method according to any of [1] to [7], wherein the target substance is an enantiomer.
- An advantage of the method of the invention is that the method can quickly and precisely determine the structure (particularly, the absolute configuration) of a target substance in a multicomponent sample (particularly, a mixture of various polar compounds), which is difficult to be analyzed.
-
-
FIG. 1 shows a result (chromatogram) from analyzing a racemic sample, omeprazole, by SFC. -
FIG. 2 shows a result (in the asymmetric unit; solvent molecules are omitted) from crystallographic analysis of a crystalline sponge that has incorporated the fraction corresponding to thepeak 1 inFIG. 1 . -
FIG. 3 shows a result (in the asymmetric unit; solvent molecules are omitted) from crystallographic analysis of a crystalline sponge that has incorporated the fraction corresponding to thepeak 2 inFIG. 1 . -
FIG. 4 shows the structure of a guest corresponding to thepeak 1 inFIG. 1 identified by the CS method. -
FIG. 5 shows the structure of a guest corresponding to thepeak 2 inFIG. 1 identified by the CS method. -
FIG. 6 shows a result (chromatogram) from analyzing a racemic sample, rac-(4R,5R)-3,5-dihydroxy-4-(3-methylbut-2-en-1-yl)-2-(3-methylbutanoyl)cyclopent-2-en-1-one, by SFC. -
FIG. 7 shows a result (in the asymmetric unit; solvent molecules are omitted) from crystallographic analysis of a crystalline sponge that has incorporated the fraction corresponding to thepeak 1 inFIG. 6 . -
FIG. 8 shows a result (in the asymmetric unit; solvent molecules are omitted) from crystallographic analysis of a crystalline sponge that has incorporated the fraction corresponding to thepeak 2 inFIG. 6 . -
FIG. 9 shows the structure of a guest corresponding to thepeak 1 inFIG. 6 identified by the CS method. -
FIG. 10 shows the structure of a guest corresponding to thepeak 2 inFIG. 6 identified by the CS method. -
FIG. 11 shows a result (chromatogram) from analyzing a racemic sample, trans-stilbene oxide, by SFC. -
FIG. 12 shows a result (in the asymmetric unit; solvent molecules are omitted) from crystallographic analysis of a crystalline sponge that has incorporated the fraction corresponding to thepeak 1 inFIG. 11 . -
FIG. 13 shows a result (in the asymmetric unit; solvent molecules are omitted) from crystallographic analysis of a crystalline sponge that has incorporated the fraction corresponding to thepeak 2 inFIG. 11 . -
FIG. 14 shows the structure of a guest corresponding to thepeak 1 inFIG. 11 identified by the CS method. -
FIG. 15 shows the structure of a guest corresponding to thepeak 2 inFIG. 11 identified by the CS method. -
FIG. 16 shows the crystal structure of a [CuBr(btt)]-type crystalline sponge (left: in the asymmetric unit; right: in packing) soaked in methanol for several days. -
FIG. 17 shows a result (chromatogram) from analyzing a mixed sample of positional isomers by SFC. -
FIG. 18 shows a result (in the asymmetric unit; solvent molecules are omitted) from crystallographic analysis of a crystalline sponge that has incorporated the fraction corresponding to thepeak 1 inFIG. 17 . -
FIG. 19 shows a result (in the asymmetric unit; solvent molecules are omitted) from crystallographic analysis of a crystalline sponge that has incorporated the fraction corresponding to thepeak 2 inFIG. 17 . -
FIG. 20 shows the structure of a guest corresponding to thepeak 1 inFIG. 17 identified by the CS method. -
FIG. 21 shows the structure of a guest corresponding to thepeak 2 inFIG. 17 identified by the CS method. -
FIG. 22 shows the crystal structure of a [Co2(R-man)2(bpy)3](NO3)2-type crystalline sponge (left: in the asymmetric unit; right: in packing) soaked in acetonitrile for several days. -
FIG. 23 shows a result (chromatogram) from analyzing a mixed sample of stereoisomers by SFC. -
FIG. 24 shows a result (in the asymmetric unit; solvent molecules are omitted) from crystallographic analysis of a [Co2(R-man)2(bpy)3](NO3)2-type crystalline sponge that has incorporated the fraction corresponding to thepeak 1 inFIG. 23 . -
FIG. 25 shows a result (in the asymmetric unit; solvent molecules are omitted) from crystallographic analysis of a [Co2(R-man)2(bpy)3](NO3)2-type crystalline sponge that has incorporated the fraction corresponding to thepeak 2 inFIG. 23 . -
FIG. 26 shows a result (in the asymmetric unit; solvent molecules are omitted) from crystallographic analysis of a [Co2(R-man)2(bpy)3](NO3)2-type crystalline sponge that has incorporated the fraction corresponding to the peak 3 inFIG. 23 . -
FIG. 27 shows the structure of a guest corresponding to thepeak 1 inFIG. 23 identified using [Co2(R-man)2(bpy)3](NO3)2-type crystalline sponge by the CS method. -
FIG. 28 shows the structure of a guest corresponding to thepeak 2 inFIG. 23 identified using [Co2(R-man)2(bpy)3](NO3)2-type crystalline sponge by the CS method. -
FIG. 29 shows the structure of a guest corresponding to the peak 3 inFIG. 23 identified using [Co2(R-man)2(bpy)3](NO3)2-type crystalline sponge by the CS method. -
FIG. 30 shows a result (in the asymmetric unit; solvent molecules are omitted) from crystallographic analysis of a [Co2(S-man)2(bpy)3](NO3)2-type crystalline sponge that has incorporated the fraction corresponding to thepeak 1 inFIG. 23 . -
FIG. 31 shows a result (in the asymmetric unit; solvent molecules are omitted) from crystallographic analysis of a [Co2(S-man)2(bpy)3](NO3)2-type crystalline sponge that has incorporated the fraction corresponding to thepeak 2 inFIG. 23 . -
FIG. 32 shows a result (in the asymmetric unit; solvent molecules are omitted) from crystallographic analysis of a [Co2(S-man)2(bpy)3](NO3)2-type crystalline sponge that has incorporated the fraction corresponding to the peak 3 inFIG. 23 . -
FIG. 33 shows the structure of a guest corresponding to thepeak 1 inFIG. 23 identified using [Co2(S-man)2(bpy)3](NO3)2-type crystalline sponge by the CS method. -
FIG. 34 shows the structure of a guest corresponding to thepeak 2 inFIG. 23 identified using [Co2(S-man)2(bpy)3](NO3)2-type crystalline sponge by the CS method. -
FIG. 35 shows the structure of a guest corresponding to the peak 3 inFIG. 23 identified using [Co2(S-man)2(bpy)3](NO3)2-type crystalline sponge by the CS method. -
FIG. 36 shows a result (chromatogram) from analyzing a mixed sample of structural isomers of a volatile compound by SFC. -
FIG. 37 shows a result (in the asymmetric unit; solvent molecules are omitted) from crystallographic analysis of a crystalline sponge that has incorporated the fraction corresponding to thepeak 1 inFIG. 36 . -
FIG. 38 shows a result (in the asymmetric unit; solvent molecules are omitted) from crystallographic analysis of a crystalline sponge that has incorporated the fraction corresponding to thepeak 2 inFIG. 36 . -
FIG. 39 shows the structure of a guest corresponding to thepeak 1 inFIG. 36 identified by the CS method. -
FIG. 40 shows the structure of a guest corresponding to thepeak 2 inFIG. 36 identified by the CS method. -
FIG. 41 shows a result (chromatogram) from analyzing a mixed sample of structural isomers of a volatile compound by SFC. -
FIG. 42 shows a result (in the asymmetric unit; solvent molecules are omitted) from crystallographic analysis of a crystalline sponge that has incorporated the fraction corresponding to thepeak 1 inFIG. 41 . -
FIG. 43 shows a result (in the asymmetric unit; solvent molecules are omitted) from crystallographic analysis of a crystalline sponge that has incorporated the fraction corresponding to thepeak 2 inFIG. 41 . -
FIG. 44 shows the structure of a guest corresponding to thepeak 1 inFIG. 41 identified by the CS method. -
FIG. 45 shows the structure of a guest corresponding to thepeak 2 inFIG. 41 identified by the CS method. -
FIG. 46 shows the crystal structure of a [Co2(R-man)2(bpy)3](NO3)2-type crystalline sponge (left: in the asymmetric unit; right: in packing) soaked in isopropanol for several days. -
FIG. 47 shows a result (chromatogram) from analyzing a volatile racemic sample by SFC. -
FIG. 48 shows a result (in the asymmetric unit; solvent molecules are omitted) from crystallographic analysis of a crystalline sponge that has incorporated the fraction corresponding to thepeak 1 inFIG. 47 . -
FIG. 49 shows a result (in the asymmetric unit; solvent molecules are omitted) from crystallographic analysis of a crystalline sponge that has incorporated the fraction corresponding to thepeak 2 inFIG. 47 . -
FIG. 50 shows the structure of a guest corresponding to thepeak 1 inFIG. 47 identified by the CS method. -
FIG. 51 shows the structure of a guest corresponding to thepeak 2 inFIG. 47 identified by the CS method. - The invention is a method of determining the structure of a target substance contained in a multicomponent sample, or in a mixture of two or more substances. The target substance of analysis for structure determination is not specifically limited, provided that the substance can be isolated by the step (A) and be analyzed for structural features by the step (C). However, the analysis for structure determination mainly targets organic compounds and also targets peptides, nucleic acids, and the like.
- The method of the invention comprises the steps of: (A) isolating a target substance from a mixture of two or more substances by means of supercritical fluid chromatography (SFC); (B) soaking the isolated target substance into a crystalline sponge (CS) to produce a sample for crystallography; and (C) performing a crystallographic analysis on the sample for crystallography.
- In the step (A), SFC is used to isolate the target substance for structure determination from the mixture and to collect a solution containing the target substance. A wide variety of polar substances, ranging from volatile or highly hydrophobic compounds to hydrophilic compounds, can be isolated by the SFC method, and basic operations of SFC are known. The target substance can be isolated and collected according to routine procedures of SFC and high-performance liquid chromatography (HPLC). The target substance can be isolated and collected using a commercially available device for SFC according to the operating manual of the device.
- In many cases, a blend of carbon dioxide and a solvent called modifier for adjusting the separation of compounds is used as the mobile phase of SFC. A volatile organic solvent, a volatile acid, or a volatile base is often used as the modifier. A target substance isolated by SFC is collected by fractionation, while the carbon dioxide in the mobile phase is vaporized. Thus, the target substance dissolved in the modifier solvent is collected in a fraction collector or the like. A make-up solvent is a solvent that is added separately during a period when the target substance is isolated by column chromatography and collected in a fraction collector or the like, and the make-up solvent is added for the purpose of increasing the solubility of the target substance or other purposes. The collected target substance may be dissolved in the modifier solvent or in a mixed solvent of the modifier solvent and the make-up solvent.
- The mixture that is subjected to SFC in the step (A) contains two or more substances, and the form of the mixture is not specifically limited as long as the mixture contains two or more substances. Examples of the mixture subjected to SFC include food compositions (including beverage compositions), pharmaceutical compositions, healthcare compositions, oral care compositions, flavors, natural products (for example, food materials such as fruits, vegetables, spices, and herbs) and their extracts, synthetic organic compounds (for example, coating materials, pigments, agrochemicals, pesticides), biological samples (for example, blood, urine, saliva, nasal mucus, biological tissues, organs), environmental samples (for example, river water, lake water, seawater, soil), and enzymatic reaction products. The method of the invention can determine the structure of a substance contained in a multicomponent sample that contains multiple similar substances, so that the method of the invention can be suitably applied to natural products and synthetic organic compounds, which potentially contain similar substances. Moreover, the target substance in the mixture may be a strongly polar substance, for example, and the target substance can be a polar substance with an octanol-water partition coefficient (log Pow) of not less than -4.6. In this respect, the octanol-water partition coefficient is defined as the concentration ratio of a compound between two phases of octanol and water (Kow), where the compound is dissolved in the octanol phase and in water. In this specification, log Pow, the common logarithm of Kow, is used as the octanol-water partition coefficient.
- In the step (B), the solution containing the target substance collected in the step (A) is soaked into a crystalline sponge to produce a sample for crystallography. In this respect, the crystalline sponge is a single crystal material with regular porous structures and can be made for example from metal-organic frameworks (MOFs), covalent organic frameworks (COFs), porous organic molecular crystals (POMCs), inorganic compounds, such as zeolites, or the like. However, the source of the single crystal material is not limited, provided that a compound is incorporated as a guest into pores of the single crystal material. An example of the crystalline sponge composed of a metal-organic framework is a polymer metal complex with a three-dimensional network structure, which is composed of a ligand with two or more coordination sites and a metal ion as a coordination center. The "three-dimensional network structure" as used herein refers to a network structure composed of repeating structural units, extending in three dimensions, each unit formed by a ligand (a ligand with two or more coordination sites or any of other monodentate ligands) and a metal ion bound thereto. A single crystal metal-organic framework that can be used as a crystalline sponge is described in the following literature: for example, Nature 2013, 495, 461-466; Chem. Commun. 2015, 51, 11252-11255; Science 2016, 353, 808-811; Chem. Commun. 2016, 52, 7013-7015; Chem. Asian J. 2017, 12, 208-211; J. Am. Chem. Soc. 2017, 139, 11341-11344; Chem 2017, 3, 281-289; and
JP 5969616 B - The presence of water in a crystalline sponge may destroy its own structure, depending on the type of the crystalline sponge. Therefore, the sample containing the target substance collected in the step (A) may be made free of water before proceeding to the step (B). In particular, a [(ZnX2)3(tpt)2·(solvent)a]n-type crystalline sponge, which can incorporate various compounds as a guest and shows excellent performance in structure determination should be away from contamination with water, because the crystal structure of the sponge is destroyed in an environment containing water as a solvent. Advantageously, a volatile mobile phase is used throughout the separation procedure in SFC, as described above, and a portion of or all the volatile solvent is evaporated from the fraction containing the target substance collected in the step (A), immediately before the resulting fraction is used for the production of a sample for crystallography in the step (B).
- In other words, a volatile solvent (preferably a volatile solvent not containing water) is preferred as the mobile phase of SFC used in the step (A) of the method of the invention. The method of the invention may comprise the step of evaporating a portion of or all the volatile solvent from the isolated target substance after the step (A) and before the step (B). Additionally, an appropriate solvent may be added in the step (B) to adjust the concentration of the target substance. The inclusion of such a step provides an advantage to the method of the invention in that the steps (A), (B), and (C) can be performed sequentially. In this respect, the phrase "performed sequentially" means on-line performance of the steps (A), (B), and (C) by a connection of devices for performing SFC and the CS method, as well as sequential off-line performance of those steps.
- In the sequential performance as described above, a solvent that can be used for the soaking into a crystalline sponge in the step (B) may be used as the solvent (including the modifier solvent and the make-up solvent) used for the mobile phase of SFC in the step (A). That is, the solvent used for the step (A) may be the same as the solvent used for the step (B) or can be selected to be a solvent that has no adverse effects on a crystalline sponge (for example, not causing destruction or dissolution of a crystalline sponge) when the solvent is different from the solvent used for the step (B). For example, as described in examples below (Examples 5 to 20), vials containing a crystalline sponge soaked in a solvent may be prepared prior to the step (B), and a substance isolated by a SFC device is collected directly into the vials together with a solvent used as the mobile phase of SFC. In this case, the step of evaporating a portion of or all the volatile solvent from the isolated target substance after the step (A) and before the step (B) can be omitted, which advantageously allows seamless connection of a device for performing the step (A) to that for performing the step (B) and quick analysis of the structure of the target substance. In particular, a volatile compound is so prone to be lost by volatilization that the structure of the compound is difficult to be analyzed from a tiny amount of the sample. Extremely advantageously, the seamless connection of a device for performing the step (A) to that for performing the step (B) allows for isolation of a compound from a mixture as a target of analysis and subsequent incorporation of the compound into pores of a crystalline sponge, which enables structural analysis of the compound in a tiny amount of the sample without loss by volatilization.
- As examples of the solvent that has no adverse effects on a crystalline sponge, hydrocarbons, such as n-hexane, cyclohexane, benzene, and toluene, and ethers, such as methyl tert-butyl ether (MTBE) and dimethoxyethane (DME), and esters, such as ethyl acetate, ketones, such as acetone and 2-butanone, and carbon dioxide in a supercritical, subcritical, gaseous, or liquid state are suitable for [(ZnCl2)3(tpt)2·(n-hexane)a]n-type crystalline sponges, and alcohols, such as methanol, ethanol, propanol, and isopropanol, as well as hydrocarbons, ethers, esters, ketones, and carbon dioxide as described above, are suitable for [CuBr(btt)]-type crystalline sponges, and nitriles, such as acetonitrile, as well as hydrocarbons, ethers, esters, ketones, carbon dioxide, and alcohols as described above , are suitable for [Co2(R-man)2(bpy)3](NO3)2-type and [Co2(S-man)2(bpy)3](NO3)2-type crystalline sponges. In addition, the above solvents that have no adverse effects on crystalline sponges may be mixed in any combination or ratio.
- In the step (C), the sample for crystallography produced in the step (B) can be analyzed by crystallography to determine the molecular structure of the target substance. Any technique selected from X-ray diffraction, neutron diffraction, and electron diffraction may be used for the crystallographic analysis. Additionally, the measurement data, or the structure of the target substance, can be analyzed by a known method. For example, the steps (B) and (C) can be performed as described in
WO 2014/038220 or in IUCrJ 2016, 3, 139-151. - Advantageously, the method of the invention can quickly and precisely determine the structure of a target substance in a multicomponent sample, which is difficult to be analyzed. Even if the target substance is a mixture of isomers, these isomers can be separated to identify and determine the structure of each isomer. Isomers include structural isomers and stereoisomers, and structural isomers include positional isomers and the like, and stereoisomers include conformational isomers and configurational isomers. Moreover, configuration isomers includes optical isomers (enantiomers) and diastereoisomers (diastereomers). In enantiomeric compounds, such as active ingredients, candidates for active ingredients, seasoning ingredients, or flavoring ingredients, in pharmaceutical products or foods with functional claims, only one of the enantiomers may function as an active ingredient. Extremely advantageously, the method of the invention can quickly and precisely determine the absolute configuration of each compound contained in a multicomponent sample.
- The present invention will be specifically described in more detail by examples below, but the present invention is not limited to those examples.
- In Example 1, a preparative SFC device suitable for use of a column with an internal diameter of not less than 10 mm was used to separate enantiomers in a racemic sample.
- As the racemic sample, omeprazole (Tokyo Chemical Industry Co., Ltd.), which is an active ingredient in a commercially available pharmaceutical product and is obtainable as a general reagent, was used. Omeprazole (racemate) was prepared at a concentration of 10 mg/mL in methanol, and subjected to supercritical fluid chromatography (SFC) (Waters Thar Supercritical Fluid Chromatography System; Waters Corporation) under the following conditions.
Table 1: Conditions for SFC Column CHIRALCEL IC 10 mm i.d. × 250 mm (particle size: 5 µm) Column temperature 40°C Mobile phase A CO2 Mobile phase B MeOH Mobile phase mixture ratio A:B = 70:30 (isocratic) Flow rate 30 mL/min Detection UV 254 nm Injection volume 1.5 mL Sample concentration 10 mg/mL Analysis time 7 minutes - The result of the analysis, a chromatogram, under the above conditions was as shown in
FIG. 1 . The two enantiomers of omeprazole were separated with a resolution as high as 10.5 within 5 minutes. - In Example 2, the absolute configuration was determined by the CS Method for each of the two enantiomers of the racemic compound which were separated and collected in Example 1.
- The components corresponding to the two peaks (
Peak 1 and Peak 2) shown inFIG. 1 for Example 1 were separately collected, and a portion of each collection (equivalent to 40 µg) was transferred into a 1.2-mL V-bottom vial, and an eluent, methanol (MeOH), was evaporated under nitrogen gas flow. Subsequently, one granule of a crystalline sponge (a size of 100 µm × 100 µm × 100 µm multiplied by a density of 1.3 g/cm3 gives a theoretical weight of 1.3 µg) and 20 µL of a mixed solvent of methyl t-butyl ether (MTBE) and dimethoxyethane (DME) (9:1 by volume) were added together to each vial. After the vials were capped and incubated at 50°C for 1 day, the crystalline sponge was recovered from each vial and analyzed by a single crystal X-ray diffractometer (Cu Kα λ = 1.5418 Å). - A [(ZnCl2)3(tpt)2·(n-hexane)a]n-type crystalline sponge produced by the method described in Chem. Eur. J. 2017, 23, 15035-15040 was used as the crystalline sponge. The crystalline sponge was stored with being immersed in n-hexane until before use, and the solvent was exchanged with the above MTBE/DME mixed solvent just before use, and the resulting crystalline sponge was then used for the experiment.
- The measurement data was analyzed according to the method described in Chem. Eur. J. 2017, 23, 15035-15040.
- The measurement by a single crystal X-ray diffractometer and the analysis of the measurement data resulted in observation of the structure of each guest compound incorporated in the crystalline sponge. The crystallographic data from the analysis of the crystalline sponges that have incorporated either of the compounds eluted as
Peak 1 andPeak 2 shown inFIG. 1 for Example 1 is shown in Table 2.Table 2: Crystallographic Data Peak 1 Peak 2Formula in the asymmetric unit C110.48H131.48C112N25.50O13.49S0.50Zn6 C110.45H131.45C112N25.49O13.48S0.50Zn6 Molecular weight 2866.04 2865.43 Crystal color and habit yellow and blocky yellow and blocky Crystal system Monoclinic Monoclinic a (Å) 32.9454(2) 33.0111(2) b (Å) 14.46490(10) 14.45920(10) c (Å) 31.1401(2) 31.1588(2) β (°) 100.5690(10) 100.6490(10) V (Å3) 14588.11(17) 14616.39(17) Z 4 4 Measurement temperature (K) 100(2) 100(2) density (g·cm-3) 1.305 1.302 Crystal dimensions (µm3) 0.157 × 0.222 × 0.310 0.097 × 0.136 × 0.374 θ range for data collection 0.729 < θ < 76.607 2.724 < θ < 76.906 Linear absorption coefficient (mm-1) 3.664 3.657 Space group C2 C2 Rint 0.0271 0.0311 R1 0.0498 0.0494 wR2 0.1562 0.1557 Number of parameters 2010 2010 Number of restraints 1137 1137 Highest electron density (eÅ-3) 0.70 0.70 Lowest electron density (eÅ-3) -0.38 -0.41 GoF 1.024 1.024 Flack parameter (Parsons) 0.073(5) 0.079(6) - Crystal structures of the asymmetric unit for the crystalline sponges that have incorporated the compounds eluted as
Peak 1 andPeak 2 are shown inFIGS. 2 and3 , respectively. Each molecule enclosed by the dotted line indicates the guest incorporated in the crystalline sponge. Additionally, the structures of only the observed guests are shown inFIGS. 4 and5 , respectively. From these results, the enantiomers corresponding to Peak 1 andPeak 2 were determined and identified to be the S- and R-isomers of omeprazole, respectively. - In Example 3, enantiomers in a racemic sample were separated using an analytical-scale SFC device (Shimadzu Nexera UC; Shimadzu Corporation) suitable for use of a column with an internal diameter of not more than 4.6 mm together with a fraction collector (FRC-40 SF; Shimadzu Corporation).
- As a sample of a racemic natural product, rac-(4R,5R)-3,5-dihydroxy-4-(3-methylbut-2-en-1-yl)-2-(3-methylbutanoyl)cyclopent-2-en-1-one (this compound can be tautomerized to a compound with the structure of rac-(4R,5R)-3,4-dihydroxy-5-(3-methylbut-2-en-1-yl)-2-(3-methylbutanoyl)cyclopent-2-en-1-one) was prepared according to the method described in J. Inst. Brew. 1990, 96, 137-141. This racemic compound was prepared in methanol at a concentration of 86 mg/mL and subjected to SFC under the conditions described in Table 3. The Shimadzu Nexera UC (Shimadzu Corporation) was used as a SFC device, and each separated compound was collected by a fraction collector FRC-40 SF (Shimadzu Corporation). A make-up solvent was delivered at a constant flow rate into the fraction collector to increase the efficiency of sample collection.
Table 3: Conditions for SFC Column CHIRALPAK IG 4.6 mm i.d. × 250 mm (particle size: 5 µm) Column temperature 25°C Mobile phase A CO2 Mobile phase B MeCN / MeOH / TFA = 70 / 30 / 0.5 (v/v/v) Make-up solvent MeOH (5 mL/min) Mobile phase mixture ratio A:B = 70:30 (isocratic) Flow rate 2 mL/min Detection UV 270 nm Pressure 10 MPa Injection volume 5 µL Sample concentration 86 mg/mL Analysis time 10 minutes MeCN: acetonitrile, MeOH: methanol, TFA: trifluoroacetic acid - The result of the analysis, a chromatogram, under the above conditions was as shown in
FIG. 6 . The two enantiomers of this racemic compound were separated with a resolution of 2.0 within 10 minutes. - In Example 4, the absolute configuration was determined by the CS Method for each of the two enantiomers of the racemic compound which were separated and collected in Example 3.
- The components corresponding to the two peaks (
Peak 1 and Peak 2) shown inFIG. 6 for Example 3 were separately collected, and a portion of each collection (approximately 1/40 of the volume collected at one time, equivalent to 5 µg) was transferred into a 1.2-mL V-bottom vial, and an eluent, a mixed solution of the mobile phase B and the make-up solvent (composed of methanol, acetonitrile, and trifluoroacetic acid), was evaporated under nitrogen gas flow. Subsequently, one granule of a crystalline sponge (a size of 100 µm × 100 µm × 100 µm multiplied by a density of 1.3 g/cm3 gives a theoretical weight of 1.3 µg) and 50 µL of n-hexane were added together to each vial. The vials were capped, and each cap was pierced with an injection needle, and the vials were incubated at 50°C to gently evaporate the solvent. One day later, the crystalline sponge was recovered from each vial and analyzed by a single crystal X-ray diffractometer (Cu Kα λ = 1.5418 Å). - A [(ZnCl2)3(tpt)2·(n-hexane)a]n-type crystalline sponge produced by the method described in Chem. Eur. J. 2017, 23, 15035-15040 was used as the crystalline sponge. The crystalline sponge was stored with being immersed in n-hexane until before use.
- The measurement data was analyzed according to the method described in Chem. Eur. J. 2017, 23, 15035-15040.
- The measurement by a single crystal X-ray diffractometer and the analysis of the measurement data resulted in observation of the structure of each guest compound incorporated in the crystalline sponge. The crystallographic data from the analysis of the crystalline sponges that have incorporated either of the compounds eluted as
Peak 1 andPeak 2 shown inFIG. 6 for Example 3 is shown in Table 4.Table 4: Crystallographic Data Peak 1 Peak 2Crystal system Monoclinic Monoclinic a (Å) 31.81064(9) 31.69595(14) b (Å) 14.45533(3) 14.39303(5) c (Å) 31.62942(10) 31.06937(16) β (°) 99.6053(3) 98.3166(5) V (Å3) 14340.36(7) 14024.82(11) Measurement temperature (K) 100.0(1) 100.0(1) Z 4 4 Space group C2 C2 Rint 0.0194 0.036 R1 0.0447 0.0578 wR2 0.1395 0.1688 GoF 1.108 1.058 Flack parameter (Parsons) 0.064(4) 0.072(9) - Crystal structures of the asymmetric unit for the crystalline sponges that have incorporated the compounds eluted as
Peak 1 andPeak 2 are shown inFIGS. 7 and 8 , respectively. Each molecule enclosed by the dotted line indicates the guest incorporated in the crystalline sponge. Additionally, the structures of only the observed guests are shown inFIGS. 9 and 10 , respectively. From these results, the enantiomers corresponding to Peak 1 andPeak 2 were determined and identified to be (4S,5S)-3,5-dihydroxy-4-(3-methylbut-2-en-1-yl)-2-(3-methylbutanoyl)cyclopent-2-en-1-one and (4R,5R)-3,5-dihydroxy-4-(3-methylbut-2-en-1-yl)-2-(3-methylbutanoyl)cyclopent-2-en-1-one, respectively. The results of Examples 3 and 4 have confirmed that the structure of a target substance can be determined by the method of the invention even in cases where an analytical-scale SFC device is used, that is, the purified target substance has an amount of approximately several tens of µg. - In Example 5, enantiomers in a racemic sample were separated using a SFC device and a fraction collector which are the same type of devices as those used in Example 3 and employing an elution solvent identical to that used for the CS method.
- As the racemic sample, a racemic mixture of trans-stilbene oxide (Tokyo Chemical Industry Co., Ltd.), which is obtainable as a general reagent, was used. Trans-stilbene oxide (racemate) was prepared in methyl tert-butyl ether (MTBE) at a concentration of 10 mg/mL and subjected to SFC under the conditions described in Table 5. In accordance with Example 3, the Shimadzu Nexera UC (Shimadzu Corporation) was used as a SFC device, and each separated compound was collected by a fraction collector FRC-40 SF (Shimadzu Corporation). A make-up solvent was delivered at a constant flow rate into the fraction collector to increase the efficiency of sample collection.
Table 5: Conditions for SFC Column CHIRALPAK IC-3 3.0 mm i.d. × 100 mm (particle size: 3 µm) Column temperature 25°C Mobile phase A CO2 Mobile phase B MTBE Make-up solvent MTBE (5 mL/min) Mobile phase mixture ratio A:B = 90:10 (isocratic) Flow rate 3 mL/min Detection UV 250nm Pressure 10 MPa Injection volume 2 µL Sample concentration 10 mg/mL Analysis time 3 minutes - The result of the analysis, a chromatogram, under the above conditions was as shown in
FIG. 11 . The two enantiomers of this racemic compound were separated with a resolution of 2.4 within 3 minutes. - In Example 6, the absolute configuration was determined by the CS method for each of the two enantiomers of the racemic compound which were separated and collected in Example 5.
- One granule of a [(ZnCl2)3(tpt)2·(n-hexane)a]n-type crystalline sponge produced by the method described in Chem. Eur. J. 2017, 23, 15035-15040 (a size of 100 µm × 100 µm × 100 µm multiplied by a density of 1.3 g/cm3 gives a theoretical weight of 1.3 µg) and n-hexane were added to a 1.2-mL V-bottom vial. The solvent inside the crystalline sponge was replaced with methyl tert-butyl ether (MTBE) by removing the n-hexane from and adding 50 µL of MTBE to the vial. Multiple vials prepared as described above were placed in the fraction collector.
- The components corresponding to the two peaks (
Peak 1 and Peak 2) shown inFIG. 11 for Example 5 were individually collected directly into the above vials containing the crystalline sponge (about 10 µg per peak). After the solvent was evaporated at 50°C to a volume of about 50 µL, the vials were capped, and each cap was pierced with an injection needle, and the vials were incubated at 50°C to gently evaporate the remaining solvent. One day later, the crystalline sponge was recovered from each vial and analyzed by a single crystal X-ray diffractometer (Cu Kα λ = 1.5418 Å). - The measurement data was analyzed according to the method described in Chem. Eur. J. 2017, 23, 15035-15040.
- The measurement by a single crystal X-ray diffractometer and the analysis of the measurement data resulted in observation of the structure of each guest compound incorporated in the crystalline sponge. The crystallographic data from the analysis of the crystalline sponges that have incorporated either of the compounds eluted as
Peak 1 andPeak 2 shown inFIG. 11 for Example 5 is shown in Table 6.Table 6: Crystallographic Data Peak 1 Peak 2Crystal system Monoclinic Monoclinic a (Å) 33.96777(12) 33.98936(19) b (Å) 14.44849(4) 14.44547(6) c (Å) 31.66428(14) 31.89852(17) β (°) 102.7113(4) 103.0038(5) V (Å3) 15159.41(10) 15260.29(13) Measurement temperature (K) 100.0(1) 100.0(1) Z 4 4 Space group C2 C2 Rint 0.0212 0.0320 R1 0.0719 0.0800 wR2 0.2278 0.2497 GoF 1.088 1.075 Flack parameter (Parsons) 0.021(4) 0.026(6) - Crystal structures of the asymmetric unit for the crystalline sponges that have incorporated the compounds eluted as
Peak 1 andPeak 2 are shown inFIGS. 12 and13 , respectively. Each molecule enclosed by the dotted line indicates the guest incorporated in the crystalline sponge. Additionally, the structures of only the observed guests are shown inFIGS. 14 and15 , respectively. From these results, the enantiomers corresponding to Peak 1 andPeak 2 were determined and identified to be the RR isomer of trans-stilbene oxide ((2R,3R)-2,3-diphenyloxirane) and the SS isomer of trans-stilbene oxide ((2S,3S)-2,3-diphenyloxirane). The results of Examples 5 and 6 have confirmed that the structure of a compound can be analyzed by isolating the compound by SFC and collecting the compound directly into a vial containing a crystalline sponge to allow incorporation of the compound. - When methanol was used as an elution solvent for SFC, the [(ZnCl2)3(tpt)2·(n-hexane)a]n-type crystalline sponge was found to be labile to methanol, so that seamless performance of SFC and the CS method failed. Then, production of a methanol-resistant crystalline sponge was studied in Example 7.
- A [CuBr(btt)]-type crystalline sponge was produced by synthesis from benzene-1,3,5-triyl triisonicotinate (btt) and CuBr according to the method described in Chem. Asian J. 2017, 12, 208-211. The crystalline sponge was soaked in methanol for several days, and the crystal structure of the crystalline sponge was then analyzed.
- Chem. Asian J. 2017, 12, 208-211 reported that a [CuBr(btt)]-type crystalline sponge developed cracks when soaked in methanol, which resulted in failure to obtain a diffraction pattern suitable for analysis. However, the inventors studied hard and consequently found that, surprisingly, the crystal structure of the [CuBr(btt)]-type crystalline sponge produced in this example was precisely measured and observed even after the crystalline sponge was soaked in methanol for several days (
FIG. 16 ). - In Example 8, positional isomers in a mixed sample were separated using a SFC device and a fraction collector which are the same type of devices as those used in
- Example 3 and employing an elution solvent identical to that used for the CS Method.
- 1-Acetylnaphthalene (Tokyo Chemical Industry Co., Ltd.) and 2-acetylnaphthalene (Tokyo Chemical Industry Co., Ltd.) were used to prepare a solution containing both of the compounds in methanol (MeOH) at a concentration of 20 mg/mL each as a mixed sample of the positional isomers, and the resulting solution was subjected to SFC under the conditions described in Table 7. In accordance with Example 3, the Shimadzu Nexera UC (Shimadzu Corporation) was used as a SFC device, and each separated compound was collected by a fraction collector FRC-40 SF (Shimadzu Corporation). A make-up solvent was delivered at a constant flow rate into the fraction collector to increase the efficiency of sample collection.
Table 7: Conditions for SFC Column CHIRALPAK AD-H 4.6 mm i.d. × 250 mm (particle size: 5 µm) Column temperature 35°C Mobile phase A CO2 Mobile phase B MeOH Make-up solvent MeOH (3 mL/min) Mobile phase mixture ratio A:B = 95:5 (isocratic) Flow rate 3 mL/min Detection UV 270 nm Pressure 10 MPa Injection volume 5 µL Sample concentration 20 mg/mL Analysis time 6 minutes - The result of the analysis, a chromatogram, under the above conditions was as shown in
FIG. 17 . The positional isomers (two positional isomeric compounds) in the mixed sample used in this example were separated within 6 minutes. - In Example 9, the structure was determined by the CS method using the crystalline sponge produced in Example 7 for each of the two positional isomeric compounds separated and collected in Example 8.
- One granule of the [CuBr(btt)]-type crystalline sponge produced in Example 7 (a size of 100 µm × 100 µm × 100 µm multiplied by a density of 1.5 g/cm3 gives a theoretical weight of 1.5 µg; stored in chloroform until before use) and chloroform were added together to a 1.2-mL V-bottom vial. The solvent inside the crystalline sponge was replaced with methanol by removing the chloroform from and adding 50 µL of methanol to the vial. Multiple vials prepared as described above were placed in the fraction collector.
- The components corresponding to the two peaks (
Peak 1 and Peak 2) shown inFIG. 17 for Example 8 were individually collected directly into the above vials containing the crystalline sponge (about 100 µg per peak). After the solvent was evaporated at 50°C to a volume of about 20 µL, the vials were capped and further incubated at 50°C for 4 days. Four days later, the crystalline sponge was recovered from each vial and analyzed by a single crystal X-ray diffractometer (Cu Kα λ = 1.5418 Å). - The measurement data was analyzed according to the methods described in Chem. Eur. J. 2017, 23, 15035-15040 and in Chem. Asian J. 2017, 12, 208-211.
- The measurement by a single crystal X-ray diffractometer and the analysis of the measurement data resulted in observation of the structure of each guest compound incorporated in the crystalline sponge. The crystallographic data from the analysis of the crystalline sponges that have incorporated either of the compounds eluted as
Peak 1 andPeak 2 shown inFIG. 17 for Example 8 is shown in Table 8.Table 8: Crystallographic Data Peak 1 Peak 2Crystal system Monoclinic Monoclinic a (Å) 31.9635(7) 30.0915(10) b (Å) 7.7800(1) 7.71070(10) c (Å) 30.6494(6) 32.6089(11) β (°) 115.897(3) 117.332(4) V (Å3) 6856.4(2) 6721.5(4) Measurement temperature (K) 100.00(10) 100.00(10) Z 4 8 Space group P21/c I2/a Rint 0.0561 0.0301 R1 0.0631 0.0845 wR2 0.1926 0.2394 GoF 1.121 1.123 - Crystal structures of the asymmetric unit for the crystalline sponges that have incorporated the compounds eluted as
Peak 1 andPeak 2 are shown inFIGS. 18 and19 , respectively. Each molecule enclosed by the dotted line indicates the guest incorporated in the crystalline sponge. Additionally, the structures of only the observed guests are shown inFIGS. 20 and21 , respectively. From these results, the positional isomers corresponding to Peak 1 andPeak 2 were determined and identified to be 1-acetylnaphthalene and 2-acetylnaphthalene, respectively. The results of Examples 8 and 9 have confirmed that a methanol-resistant crystalline sponge can be used for analysis of the structure of a compound, wherein the compound is isolated by SFC (methanol is contained in the mobile phase) and collected directly into a vial containing the crystalline sponge to allow incorporation of the compound. - When acetonitrile was used as an elution solvent for SFC, the [(ZnCl2)3(tpt)2·(n-hexane)a]n-type crystalline sponge was found to be labile to acetonitrile, so that seamless performance of SFC and the CS method failed. Then, production of an acetonitrile-resistant crystalline sponge was studied in Example 10.
- A [Co2(R-man)2(bpy)3](NO3)2-type crystalline sponge and a [Co2(S-man)2(bpy)3](NO3)2-type crystalline sponge were produced by synthesis from 4,4'-bipyridine (bpy), (S)-mandelic acid (S-man) or (R)-mandelic acid (R-man), and Co(NO3)2 according to the method described in J. Am. Chem. Soc. 2015, 137, 12045-12049. These crystalline sponges were soaked in acetonitrile for several days, and the crystal structures of the crystalline sponges were then analyzed.
- The inventors found that the crystal structures of the [Co2(R-man)2(bpy)3](NO3)2-type and [Co2(S-man)2(bpy)3](NO3)2-type crystalline sponges were precisely measured and observed even after the crystalline sponges were soaked in acetonitrile for several days (
FIG. 22 ). - In Example 11, stereoisomers in a mixed sample were separated using a SFC device and a fraction collector which are the same type of devices as those used in Example 3 and employing an elution solvent identical to that used for the CS method.
- Rac-hydrobenzoin (Tokyo Chemical Industry Co., Ltd.), which is a mixture containing equal amounts of RR and SS isomers, and meso-hydrobenzoin (Tokyo Chemical Industry Co., Ltd.) were used to prepare a solution containing both of the compounds in acetonitrile (MeCN) at concentrations of 20 mg/mL (the concentration of the racemate) and 10 mg/mL, respectively, as a mixed sample of the stereoisomers, and the resulting solution was subjected to SFC under the conditions described in Table 9. In accordance with Example 3, the Shimadzu Nexera UC (Shimadzu Corporation) was used as a SFC device, and each separated compound was collected by a fraction collector FRC-40 SF (Shimadzu Corporation). A make-up solvent was delivered at a constant flow rate into the fraction collector to increase the efficiency of sample collection.
Table 9: Conditions for SFC Column CHIRALPAK IG 4.6 mm i.d. × 250 mm (particle size: 5 µm) Column temperature 35°C Mobile phase A CO2 Mobile phase B MeCN Make-up solvent MeCN(0.3 mL/min) Mobile phase mixture ratio A:B = 40:60 (isocratic) Flow rate 4 mL/min Detection UV 270 nm Pressure 10 MPa Injection volume 10 µL Sample concentration rac-hydrobenzoin (20 mg/mL), meso-hydrobenzoin (10 mg/mL) Analysis time 5 minutes - The result of the analysis, a chromatogram, under the above conditions was as shown in
FIG. 23 . The stereoisomers (three stereoisomeric compounds) in the mixed sample used in this example were separated within 5 minutes. - In Example 12, the structure was determined by the CS method using the [Co2(R-man)2(bpy)3](NO3)2-type crystalline sponge produced in Example 10 for each of the three stereoisomeric compounds separated and collected in Example 11.
- One granule of the [Co2(R-man)2(bpy)3](NO3)2-type crystalline sponge produced in Example 10 (a size of 100 µm × 100 µm × 100 µm multiplied by a density of 1.4 g/cm3 gives a theoretical weight of 1.4 µg; stored in chloroform until before use) and chloroform were added together to a 1.2-mL V-bottom vial. The solvent inside the crystalline sponge was replaced with acetonitrile by removing the chloroform from and adding 50 µL of acetonitrile to the vial. Multiple vials prepared as described above were placed in the fraction collector.
- The components corresponding to three peaks (
Peak 1,Peak 2, and Peak 3) shown inFIG. 23 for Example 11 were individually collected directly into the above vials containing the crystalline sponge (about 100 µg per peak). After the solvent was evaporated at 50°C to a volume of about 20 µL, the vials were capped and further incubated at 50°C for 3 days. Three days later, the crystalline sponge was recovered from each vial and analyzed by a single crystal X-ray diffractometer (Cu Kα λ = 1.5418 Å). - The measurement data was analyzed according to the methods described in Chem. Eur. J. 2017, 23, 15035-15040 and in J. Am. Chem. Soc. 2015, 137, 12045-12049.
- The measurement by a single crystal X-ray diffractometer and the analysis of the measurement data resulted in observation of the structure of each guest compound incorporated in the crystalline sponge. The crystallographic data from the analysis of the crystalline sponges that have incorporated any of the compounds eluted as
Peak 1,Peak 2, and Peak 3 shown inFIG. 23 for Example 11 is shown in Table 10.Table 10: Crystallographic Data Peak 1 Peak 2Peak 3 Crystal system Monoclinic Monoclinic Monoclinic a (Å) 10.19140(10) 10.2035(2) 10.19700(10) b (Å) 25.0599(4) 24.9273(4) 25.0123(3) c (Å) 11.42750(10) 11.4409(2) 11.43370(10) β (°) 91.9200(10) 92.050(2) 91.6080(10) V (Å3) 2916.89(6) 2908.08(9) 2915.02(5) Measurement temperature (K) 100.00(10) 100.00(10) 100.00(10) Z 2 2 2 Space group P21 P21 P21 Rint 0.0393 0.0649 0.0437 R1 0.0856 0.0713 0.0685 wR2 0.2211 0.1925 0.1866 GoF 1.162 1.079 1.147 Flack parameter (Parsons) 0.066(3) -0.014(4) 0.011(2) - Crystal structures of the asymmetric unit for the crystalline sponges that have incorporated the compounds eluted as
Peak 1,Peak 2, and Peak 3 are shown inFIGS. 24 ,25, and 26 , respectively. Each molecule enclosed by the dotted line indicates the guest incorporated in the crystalline sponge. Additionally, the structures of only the observed guests are shown inFIGS. 27, 28 , and29 , respectively. From these results, the stereoisomers corresponding to Peak 1,Peak 2, and Peak 3 were determined and identified to be (S,S)-hydrobenzoin, meso-hydrobenzoin, and (R,R)-hydrobenzoin, respectively. The results of Examples 11 and 12 have confirmed that an acetonitrile-resistant crystalline sponge can be used for analysis of the structure of a compound, wherein the compound is isolated by SFC (acetonitrile is contained in the mobile phase) and collected directly into a vial containing the crystalline sponge to allow incorporation of the compound. - In Example 13, the structure was determined by the CS method using the [Co2(S-man)2(bpy)3](NO3)2-type crystalline sponge produced in Example 10 for each of the three stereoisomeric compounds separated and collected in Example 11.
- Measurement and analysis were performed by a method similar to that in Example 12, except that the [Co2(R-man)2(bpy)3](NO3)2-type crystalline sponge used in Example 12 was replaced with the opposite enantiomer, [Co2(S-man)2(bpy)3](NO3)2-type crystalline sponge.
- The measurement by a single crystal X-ray diffractometer and the analysis of the measurement data resulted in observation of the structure of each guest compound incorporated in the crystalline sponge. The crystallographic data from the analysis of the crystalline sponges that have incorporated any of the compounds eluted as
Peak 1,Peak 2, and Peak 3 shown inFIG. 23 for Example 11 is shown in Table 11.Table 11: Crystallographic Data Peak 1 Peak 2Peak 3 Crystal system Monoclinic Monoclinic Monoclinic a (Å) 10.19210(10) 10.2010(1) 10.19700(0) b (Å) 24.8616(3) 24.9173(4) 25.0123(3) c (Å) 11.44350(10) 11.4379(1) 11.43370(10) β (°) 91.1810(10) 91.991(1) 91.6080(10) V (Å3) 2899.07(5) 2905.55(6) 2915.02(5) Measurement temperature (K) 100.00(10) 100.00(10) 100.00(10) Z 2 2 2 Space group P21 P21 P21 Rint 0.0421 0.0347 0.0437 R1 0.0697 0.0745 0.0685 wR2 0.1938 0.2024 0.1866 GoF 1.164 1.158 1.147 Flack parameter (Parsons) 0.014(2) 0.019(4) 0.011(2) - Crystal structures of the asymmetric unit for the crystalline sponges that have incorporated the compounds eluted as
Peak 1,Peak 2, and Peak 3 are shown inFIGS. 30 ,31, and 32 , respectively. Each molecule enclosed by the dotted line indicates the guest incorporated in the crystalline sponge. Additionally, the structures of only the observed guests are shown inFIGS. 33, 34 , and35 , respectively. From these results, the stereoisomers corresponding to Peak 1,Peak 2, and Peak 3 were determined and identified to be (S,S)-hydrobenzoin, meso-hydrobenzoin, and (R,R)-hydrobenzoin, respectively. The results of Examples 11 and 13 have confirmed that an acetonitrile-resistant crystalline sponge can be used for analysis of the structure of a compound, wherein the compound is isolated by SFC (acetonitrile is contained in the mobile phase) and collected directly into a vial containing the crystalline sponge to allow incorporation of the compound. - The crystal structure of the [Co2(R-man)2(bpy)3](NO3)2-type crystalline sponge with the incorporated compound corresponding to Peak 1 and the crystal structure of the [Co2(S-man)2(bpy)3](NO3)2-type crystalline sponge with the incorporated compound corresponding to Peak 3 are mirror images of each other. Similarly, the crystal structure of the [Co2(R-man)2(bpy)3](NO3)2-type crystalline sponge with the incorporated compound corresponding to Peak 3 and the crystal structure of the [Co2(S-man)2(bpy)3](NO3)2-type crystalline sponge with the incorporated compound corresponding to Peak 1 are mirror images of each other. Furthermore, the crystal structure of the [Co2(R-man)2(bpy)3](NO3)2-type crystalline sponge with the incorporated compound corresponding to Peak 2 and the crystal structure of the [Co2(S-man)2(bpy)3](NO3)2-type crystalline sponge with the incorporated compound corresponding to Peak 2 are also mirror images of each other.
- In Example 14, structural isomers of a volatile compound in a mixed sample were separated using a SFC device and a fraction collector which are the same type of devices as those used in Example 3 and employing an elution solvent identical to that used for the CS method.
- Highly volatile monoterpenes, (+)-isomenthone (Tokyo Chemical Industry Co., Ltd.) and (-)-isopulegol (Sigma-Aldrich), were used to prepare a solution containing both of the compounds in MTBE at a concentration of 10 mg/mL each as a mixed sample of the structural isomers, and the resulting solution was subjected to SFC under the conditions described in Table 12. In accordance with Example 3, the Shimadzu Nexera UC (Shimadzu Corporation) was used as a SFC device, and each separated compound was collected by a fraction collector FRC-40 SF (Shimadzu Corporation). A make-up solvent was delivered at a constant flow rate into the fraction collector to increase the efficiency of sample collection.
Table 12: Conditions for SFC Column CHIRALPAK IG 4.6 mm i.d. × 250 mm (particle size: 5 µm) Column temperature 35°C Mobile phase A CO2 Mobile phase B MTBE Make-up solvent MTBE(3 mL/min) Mobile phase mixture ratio A:B = 85:15 (isocratic) Flow rate 3 mL/min Detection UV 205nm Pressure 10 MPa Injection volume 20 µL Sample concentration 10 mg/mL Analysis time 7 minutes - The result of the analysis, a chromatogram, under the above conditions was as shown in
FIG. 36 . The structural isomers (two volatile monoterpene compounds) in the mixed sample used in this example were separated within 7 minutes. - In Example 15, the absolute configuration was determined by the CS method for each of the two structural isomers of a volatile monoterpene compound which were separated and collected in Example 14.
- One granule of a [(ZnCl2)3(tpt)2·(n-hexane)a]n-type crystalline sponge produced by the method described in Chem. Eur. J. 2017, 23, 15035-15040 (a size of 100 µm × 100 µm × 100 µm multiplied by a density of 1.3 g/cm3 gives a theoretical weight of 1.3 µg) and n-hexane were added to a 1.2-mL V-bottom vial. The solvent inside the crystalline sponge was replaced with methyl tert-butyl ether (MTBE) by removing the n-hexane from and adding 50 µL of MTBE to the vial. Multiple vials prepared as described above were placed in the fraction collector.
- The components corresponding to the two peaks (
Peak 1 and Peak 2) shown inFIG. 36 for Example 14 were individually collected directly into the above vials containing the crystalline sponge (about 200 µg per peak). After the solvent was evaporated at 50°C to a volume of about 50 µL, the vials were capped, and each cap was pierced with an injection needle, and the vials were incubated at 50°C to gently evaporate the remaining solvent. One day later, the crystalline sponge was recovered from each vial and analyzed by a single crystal X-ray diffractometer (Cu Kα λ = 1.5418 Å). - The measurement data was analyzed according to the method described in Chem. Eur. J. 2017, 23, 15035-15040.
- The measurement by a single crystal X-ray diffractometer and the analysis of the measurement data resulted in observation of the structure of each guest compound incorporated in the crystalline sponge. The crystallographic data from the analysis of the crystalline sponges that have incorporated either of the compounds eluted as
Peak 1 andPeak 2 shown inFIG. 36 for Example 14 is shown in Table 13.Table 13: Crystallographic Data Peak 1 Peak 2Crystal system Monoclinic Monoclinic a (Å) 33.96777(12) 33.14265(14) b (Å) 14.45906(4) 14.43794(6) c (Å) 30.95203(9) 30.65267(15) β (°) 99.8945(3) 99.7981(4) V (Å3) 14389.41(7) 14453.70(11) Measurement temperature (K) 99.8(4) 100.00(16) Z 4 4 Space group C2 C2 Rint 0.0196 0.0296 R1 0.0676 0.0623 wR2 0.2273 0.2053 GoF 1.056 1.080 Flack parameter (Parsons) 0.038(6) 0.046(5) - Crystal structures of the asymmetric unit for the crystalline sponges that have incorporated the compounds eluted as
Peak 1, andPeak 2 are shown inFIGS. 37, and 38 , respectively. Each molecule enclosed by the dotted line indicates the guest incorporated in the crystalline sponge. Additionally, the structures of only the observed guests are shown inFIGS. 39 and 40 , respectively. From these results, the compounds corresponding to Peak 1 andPeak 2 were determined and identified to be (+)-isomenthone ((2R,5R)-5-methyl-2-(propane-2-yl)cyclohexanone) and (-)-isopulegol - ((1R,2S,5R)-2-isopropenyl-5-methylcyclohexanol), respectively. The results of Examples 14 and 15 have confirmed that the structure of a volatile compound can be analyzed by isolating the compound by SFC and collecting the compound directly into a vial containing a crystalline sponge to allow incorporation of the compound.
- In Example 16, structural isomers of a volatile compound in a mixed sample were separated using a SFC device and a fraction collector which are the same type of devices as those used in Example 3 and employing an elution solvent identical to that used for the CS method.
- Volatile sesquiterpenes, (+)-β-eudesmol (FUJIFILM Wako Pure Chemical Corporation) and (-)-α-bisabolol (Sigma-Aldrich), were used to prepare a solution containing both of the compounds in MTBE at a concentration of 10 mg/mL each as a mixed sample of the structural isomers, and the resulting solution was subjected to SFC under the conditions described in Table 14. In accordance with Example 3, the Shimadzu Nexera UC (Shimadzu Corporation) was used as a SFC device, and each separated compound was collected by a fraction collector FRC-40 SF (Shimadzu Corporation). A make-up solvent was delivered at a constant flow rate into the fraction collector to increase the efficiency of sample collection.
Table 14: Conditions for SFC Column CHIRALPAK IG 4.6 mm i.d. × 250 mm (particle size: 5 µm) Column temperature 35°C Mobile phase A CO2 Mobile phase B MTBE Make-up solvent MTBE(1-2 mL/min) Mobile phase mixture ratio A:B = 50:50 (isocratic) Flow rate 3 mL/min Detection UV 205nm Pressure 10 MPa Injection volume 20 µL Sample concentration 10 mg/mL Analysis time 9 minutes - The result of the analysis, a chromatogram, under the above conditions was as shown in
FIG. 41 . The structural isomers (two volatile sesquiterpene compounds) in the mixed sample used in this example were separated within 9 minutes. - In Example 17, the absolute configuration was determined by the CS method for each of the two structural isomers of a volatile sesquiterpene compound separated and collected in Example 16.
- One granule of a [(ZnCl2)3(tpt)2·(n-hexane)a]n-type crystalline sponge produced by the method described in Chem. Eur. J. 2017, 23, 15035-15040 (a size of 100 µm × 100 µm × 100 µm multiplied by a density of 1.3 g/cm3 gives a theoretical weight of 1.3 µg) and n-hexane were added to a 1.2-mL V-bottom vial. The solvent inside the crystalline sponge was replaced with methyl tert-butyl ether (MTBE) by removing the n-hexane from and adding 50 µL of MTBE to the vial. Multiple vials prepared as described above were placed in the fraction collector.
- The components corresponding to the two peaks (
Peak 1 and Peak 2) shown inFIG. 41 for Example 16 were individually collected directly into the above vials containing the crystalline sponge (about 200 µg per peak). After the solvent was evaporated at 50°C to a volume of about 50 µL, the vials were capped, and each cap was pierced with an injection needle, and the vials were incubated at 50°C to gently evaporate the remaining solvent. One day later, the crystalline sponge was recovered from each vial and analyzed by a single crystal X-ray diffractometer (Cu Kα λ = 1.5418 Å). - The measurement data was analyzed according to the method described in Chem. Eur. J. 2017, 23, 15035-15040.
- The measurement by a single crystal X-ray diffractometer and the analysis of the measurement data resulted in observation of the structure of each guest compound incorporated in the crystalline sponge. The crystallographic data from the analysis of the crystalline sponges that have incorporated either of the compounds eluted as
Peak 1 andPeak 2 shown inFIG. 41 for Example 16 is shown in Table 15.Table 15: Crystallographic Data Peak 1 Peak 2Crystal system Monoclinic Monoclinic a (Å) 33.12401(15) 33.42421(15) b (Å) 14.46180(6) 14.43311(5) c (Å) 30.73803(14) 31.30072(14) β (°) 99.7599(4) 101.5552(4) V (Å3) 14511.42(11) 14793.90(11) Measurement temperature (K) 99.96(13) 100.01(10) Z 4 4 Space group C2 C2 Rint 0.0259 0.0267 R1 0.0458 0.0564 wR2 0.1394 0.1799 GoF 1.048 1.084 Flack parameter (Parsons) 0.023(3) 0.046(5) - Crystal structures of the asymmetric unit for the crystalline sponges that have incorporated the compounds eluted as
Peak 1 andPeak 2 are shown inFIGS. 42 and 43 , respectively. Each molecule enclosed by the dotted line indicates the guest incorporated in the crystalline sponge. Additionally, the structures of only the observed guests are shown inFIGS. 44 and 45 , respectively. From these results, the compounds corresponding to Peak 1 andPeak 2 were determined and identified to be (+)-β-eudesmol ((3R,4aS)-decahydro-5-methylene-α,α,8aβ-trimethyl-3β-naphthalenemethanol) and (-)-α-bisabolol ((2S)-6-methyl-2-[(1S)-4-methylcyclohex-3-en-1-yl]hept-5-en-2-ol), respectively. The results of Examples 16 and 17 have confirmed that the structure of a volatile compound can be analyzed by isolating the compound by SFC and collecting the compound directly into a vial containing a crystalline sponge to allow incorporation of the compound. - When isopropanol was used as an elution solvent for SFC, the [(ZnCl2)3(tpt)2·(n-hexane)a]n-type crystalline sponge was found to be labile to isopropanol, so that seamless performance of SFC and the CS method failed. Then, production of an isopropanol-resistant crystalline sponge was studied in Example 18.
- A [Co2(R-man)2(bpy)3](NO3)2-type crystalline sponge and a [Co2(S-man)2(bpy)3](NO3)2-type crystalline sponge were produced by synthesis from 4,4'-bipyridine (bpy), (S)-mandelic acid (S-man) or (R)-mandelic acid (R-man), and Co(NO3)2 according to the method described in J. Am. Chem. Soc. 2015, 137, 12045-12049. These crystalline sponges were soaked in isopropanol for several days, and the crystal structures of the crystalline sponges were then analyzed.
- The inventors found that the crystal structures of the [Co2(R-man)2(bpy)3](NO3)2-type and [Co2(S-man)2(bpy)3](NO3)2-type crystalline sponges were precisely measured and observed even after the crystalline sponges were soaked in isopropanol for several days (
FIG. 46 ). - In Example 19, enantiomers of a volatile racemate were separated using a SFC device and a fraction collector which are the same type of devices as those used in Example 3 and employing an elution solvent identical to that used for the CS method.
- A volatile monoterpene racemate, rac-terpinen-4-ol (FUJIFILM Wako Pure Chemical Corporation), was used as a volatile racemic sample, and the sample prepared in isopropanol at a concentration of 20 mg/mL was subjected to SFC under the conditions described in Table 16. In accordance with Example 3, the Shimadzu Nexera UC (Shimadzu Corporation) was used as a SFC device, and each separated compound was collected by a fraction collector FRC-40 SF (Shimadzu Corporation). A make-up solvent was delivered at a constant flow rate into the fraction collector to increase the efficiency of sample collection.
Table 16: Conditions for SFC Column CHIRALPAK IG 4.6 mm i.d. × 250 mm (particle size: 5 µm) Column temperature 35°C Mobile phase A CO2 Mobile phase B isopropanol Make-up solvent isopropanol(2 mL/min) Mobile phase mixture ratio A:B = 95:5 (isocratic) Flow rate 3 mL/min Detection UV 205nm Pressure 10 MPa Injection volume 20 µL Sample concentration 20 mg/mL Analysis time 6 minutes - The result of the analysis, a chromatogram, under the above conditions was as shown in
FIG. 47 . The two enantiomers of the volatile monoterpene racemic compound were separated within 5 minutes. - In Example 20, the absolute configuration was determined by the CS method using the crystalline sponge produced in Example 18 for each of the enantiomeric compounds separated and collected in Example 19.
- One granule of the [Co2(S-man)2(bpy)3](NO3)2-type crystalline sponge produced in Example 18 (a size of 100 µm × 100 µm × 100 µm multiplied by a density of 1.4 g/cm3 gives a theoretical weight of 1.4 µg; stored in chloroform until before use) and chloroform were added together to a 1.2-mL V-bottom vial. The solvent inside the crystalline sponge was replaced with isopropanol by removing the chloroform from and 50 µL of isopropanol to the vial. Multiple vials prepared as described above were placed in the fraction collector.
- The components corresponding to the two peaks (
Peak 1 and Peak 2) shown inFIG. 47 for Example 19 were individually collected directly into the above vials containing the crystalline sponge (about 200 µg per peak). After the solvent was gently evaporated under nitrogen gas flow to a volume of about 50 µL, the vials were capped and incubated at 50°C for 3 days. Three days later, the crystalline sponge was recovered from each vial and analyzed by a single crystal X-ray diffractometer (Cu Kα λ = 1.5418 Å). - The measurement data was analyzed according to the methods described in Chem. Eur. J. 2017, 23, 15035-15040 and in J. Am. Chem. Soc. 2015, 137, 12045-12049.
- The measurement by a single crystal X-ray diffractometer and the analysis of the measurement data resulted in observation of the structure of each guest compound incorporated in the crystalline sponge. The crystallographic data from the analysis of the crystalline sponges that have incorporated either of the compounds eluted as
Peak 1 andPeak 2 shown inFIG. 47 for Example 19 is shown in Table 17.Table 17: Crystallographic Data Peak 1 Peak 2Crystal system Monoclinic Monoclinic a (Å) 10.1997(2) 10.17849(18) b (Å) 24.6572(6) 24.7746(4) c (Å) 11.4298(2) 11.42571(14) β (°) 92.4691(17) 91.4303(12) V (Å3) 2871.88(10) 2880.30(7) Measurement temperature (K) 100.00(10) 100.00(10) Z 2 2 Space group P21 P21 Rint 0.0706 0.0512 R1 0.0876 0.0610 wR2 0.2317 0.1716 GoF 1.083 1.057 Flack parameter (Parsons) 0.006(8) 0.010(4) - Crystal structures of the asymmetric unit for the crystalline sponges that have incorporated the compounds eluted as
Peak 1 andPeak 2 are shown inFIGS. 48 and 49 , respectively. Each molecule enclosed by the dotted line indicates the guest incorporated in the crystalline sponge. Additionally, the structures of only the observed guests are shown inFIGS. 50 and 51 , respectively. From these results, the enantiomers corresponding to Peak 1 andPeak 2 were determined and identified to be S-terpinen-4-ol ((4S)-4-isopropyl-1-methyl-1-cyclohexen-4-ol) and R-terpinen-4-ol ((4R)-4-isopropyl-1-methyl-1-cyclohexen-4-ol), respectively. The results of Examples 18, 19, and 20 have confirmed that an isopropanol-resistant crystalline sponge can be used for analysis of the structure of a volatile compound, wherein the compound is isolated by SFC (isopropanol is contained in the mobile phase) and collected directly into a vial containing the crystalline sponge to allow incorporation of the compound. - Isopropanol destroys [(ZnCl2)3(tpt)2]n-type crystalline sponges. Thus, the inventors studied in Example 21 whether or not removal of isopropanol contained in an eluate under nitrogen gas flow would allow the absolute configuration of a volatile compound to be determined by the CS method. Specifically, the following procedure was adopted.
- Empty vials were first placed in a fraction collector, and the components corresponding to the two peaks (
Peak 1 and Peak 2) shown inFIG. 47 for Example 19 were individually collected into the vials (about 200 µg per peak). After isopropanol contained in each eluate was removed under nitrogen gas flow ([(ZnCl2)3(tpt)2]n-type crystalline sponges are destroyed by isopropanol), a [(ZnCl2)3(tpt)2]n-type crystalline sponge and 50 µL of MTBE were added together to each vial. The vials were capped, and each cap was pierced with an injection needle, and the vials were incubated at 50°C to gently evaporate the remaining solvent. One day later, the crystalline sponge was recovered from each vial and analyzed by a single crystal X-ray diffractometer (Cu Kα λ=1.5418 Å). However, the target compound of analysis was not observed. Possible loss of the volatile target compound during the removal of isopropanol from the eluate was considered as a reason for the unsuccessful observation. - Accordingly, the results of Examples 18, 19, and 20 demonstrated that seamless performance of SFC and the CS method would be especially advantageous for analysis of a tiny amount of a volatile compound.
Claims (8)
- A method of determining the structure of a target substance contained in a mixture of two or more substances, the method comprising the steps of: (A) isolating the target substance from the mixture by means of supercritical fluid chromatography, (B) soaking the isolated target substance into a crystalline sponge to produce a sample for crystallography, and (C) performing a crystallographic analysis on the sample for crystallography.
- The method according to claim 1, wherein, in the step (A), a volatile solvent is used as a mobile phase in the supercritical fluid chromatography.
- The method according to claim 2, further comprising the step of evaporating the volatile solvent in the isolated target substance after the step (A) and before the step (B).
- The method according to any one of claims 1 to 3, wherein the steps (A), (B), and (C) are performed sequentially.
- The method according to claim 4, wherein the solvent used as a mobile phase in the supercritical fluid chromatography of the step (A) is a solvent which can be used for the soaking into a crystalline sponge in the step (B).
- The method according to claim 4 or 5, wherein a device for performing the step (A) and a device for performing the step (B) are seamlessly connected together to perform the steps (A), (B), and (C).
- The method according to any one of claims 1 to 6, wherein the target substance contained in the mixture has an octanol-water partition coefficient (log Pow) of not less than -4.6.
- The method according to any one of claims 1 to 7, wherein the target substance is an enantiomer.
Applications Claiming Priority (3)
| Application Number | Priority Date | Filing Date | Title |
|---|---|---|---|
| JP2019200020 | 2019-11-01 | ||
| JP2020014066 | 2020-01-30 | ||
| PCT/JP2020/040979 WO2021085645A1 (en) | 2019-11-01 | 2020-10-30 | Method for determining structure of substance in multicomponent sample |
Publications (2)
| Publication Number | Publication Date |
|---|---|
| EP4053549A1 true EP4053549A1 (en) | 2022-09-07 |
| EP4053549A4 EP4053549A4 (en) | 2023-12-06 |
Family
ID=75715632
Family Applications (1)
| Application Number | Title | Priority Date | Filing Date |
|---|---|---|---|
| EP20881003.6A Pending EP4053549A4 (en) | 2019-11-01 | 2020-10-30 | METHOD FOR DETERMINING THE STRUCTURE OF A SUBSTANCE IN A MULTICOMPONENT SAMPLE |
Country Status (4)
| Country | Link |
|---|---|
| US (1) | US12253482B2 (en) |
| EP (1) | EP4053549A4 (en) |
| JP (3) | JP7015360B2 (en) |
| WO (1) | WO2021085645A1 (en) |
Families Citing this family (2)
| Publication number | Priority date | Publication date | Assignee | Title |
|---|---|---|---|---|
| KR102157179B1 (en) * | 2019-01-25 | 2020-09-18 | 주식회사 이노서플 | Measuring System for Particulate Matter in Air |
| JPWO2023058659A1 (en) * | 2021-10-05 | 2023-04-13 |
Family Cites Families (18)
| Publication number | Priority date | Publication date | Assignee | Title |
|---|---|---|---|---|
| US4639360A (en) | 1985-10-28 | 1987-01-27 | Mobil Oil Corporation | Synthesis of crystalline silicate ZSM-5 using an organic sulfonic acid |
| US7149280B2 (en) | 2002-12-23 | 2006-12-12 | Astex Therapeutics Limited | Synthesis and screening of ligands using X-ray crystallography |
| JP4776182B2 (en) | 2004-06-08 | 2011-09-21 | 旭化成株式会社 | Dye-sensitized solar cell |
| US9470664B2 (en) | 2009-04-10 | 2016-10-18 | Waters Technologies Corporation | Chromatographic interface |
| WO2014038221A1 (en) | 2012-09-07 | 2014-03-13 | 独立行政法人 科学技術振興機構 | Method for preparing crystal structure analysis sample, method for determining molecular structure of organic compound, and device for preparing crystal structure analysis sample |
| CN103382185B (en) * | 2013-07-02 | 2016-02-24 | 常州大学 | The chirality preparation of 6,12-phenylbenzene dibenzo [b, f] [1,5] dinitrogen heterocyclooctatetraene and configuration are determined |
| JP6633828B2 (en) | 2014-10-17 | 2020-01-22 | 森永乳業株式会社 | Method and apparatus for measuring polysaccharides |
| EP3436455A4 (en) | 2016-03-28 | 2019-09-04 | Intra-Cellular Therapies, Inc. | NEW SALTS AND CRYSTALS |
| EP3254755B1 (en) | 2016-06-10 | 2021-04-14 | Centre National de la Recherche Scientifique CNRS | High degree of condensation titanium-based inorganic-organic hybrid solid material, method for preparing same and uses thereof |
| US10590176B2 (en) | 2016-06-20 | 2020-03-17 | Colorado State University Research Foundation | Engineered programmable molecular scaffolds from porous protein crystals |
| FI3558314T3 (en) | 2016-12-21 | 2024-11-29 | Bioaxone Biosciences Inc | Rho kinase inhibitor ba-1049 (r) and active metabolites thereof |
| US11815475B2 (en) | 2017-03-01 | 2023-11-14 | The University Of Tokyo | Method for identifying molecular structure |
| CN110028676A (en) | 2018-01-12 | 2019-07-19 | 中国药科大学 | A kind of easy, method for efficiently synthesizing stable metal organic backbone crystal |
| JP7141632B2 (en) | 2018-03-27 | 2022-09-26 | 味の素株式会社 | Sample preparation method for crystal structure analysis for structural analysis of hydrophilic organic compounds having polar groups by the crystal sponge method |
| EP3885746B1 (en) | 2018-11-22 | 2025-01-01 | Rigaku Corporation | Single-crystal x-ray structural analysis system |
| EP3885755B1 (en) | 2018-11-23 | 2025-03-05 | Rigaku Corporation | Single-crystal x-ray structural analysis sample occlusion device and occlusion method |
| CN110283328B (en) | 2019-05-28 | 2021-12-07 | 江汉大学 | Zirconium metal organic framework material used as crystal sponge and preparation method thereof |
| EP3786623A1 (en) | 2019-08-28 | 2021-03-03 | Merck Patent GmbH | Optimized analyte derivatization for synergistic application with crystal sponge method |
-
2020
- 2020-10-30 US US17/773,645 patent/US12253482B2/en active Active
- 2020-10-30 JP JP2020183312A patent/JP7015360B2/en active Active
- 2020-10-30 WO PCT/JP2020/040979 patent/WO2021085645A1/en not_active Ceased
- 2020-10-30 EP EP20881003.6A patent/EP4053549A4/en active Pending
-
2021
- 2021-05-28 JP JP2021090277A patent/JP7085045B2/en active Active
-
2022
- 2022-06-02 JP JP2022090366A patent/JP7795419B2/en active Active
Also Published As
| Publication number | Publication date |
|---|---|
| EP4053549A4 (en) | 2023-12-06 |
| JP7015360B2 (en) | 2022-02-02 |
| JP7085045B2 (en) | 2022-06-15 |
| JP2021144045A (en) | 2021-09-24 |
| JP2021119337A (en) | 2021-08-12 |
| JP7795419B2 (en) | 2026-01-07 |
| US20220381708A1 (en) | 2022-12-01 |
| US12253482B2 (en) | 2025-03-18 |
| JP2022119963A (en) | 2022-08-17 |
| WO2021085645A1 (en) | 2021-05-06 |
Similar Documents
| Publication | Publication Date | Title |
|---|---|---|
| Willemse et al. | Comprehensive two-dimensional hydrophilic interaction chromatography (HILIC)× reversed-phase liquid chromatography coupled to high-resolution mass spectrometry (RP-LC-UV-MS) analysis of anthocyanins and derived pigments in red wine | |
| Armstrong et al. | Relevance of enantiomeric separations in food and beverage analyses | |
| Taylor | Supercritical fluid chromatography | |
| Vårdal et al. | Parallel artificial liquid membrane extraction of new psychoactive substances in plasma and whole blood | |
| US12253482B2 (en) | Method for determining structure of substance in multicomponent sample | |
| Lucini et al. | Rapid determination of lycopene and β‐carotene in tomato by liquid chromatography/electrospray tandem mass spectrometry | |
| Tan et al. | Internal standards for quantitative LC-MS bioanalysis | |
| Zhang et al. | A simple and rapid UPLC-PDA method for quality control of Nardostachys jatamansi | |
| Picó et al. | Profiling of compounds and degradation products from the postharvest treatment of pears and apples by ultra-high pressure liquid chromatography quadrupole-time-of-flight mass spectrometry | |
| Liu et al. | Determination of five alternaria toxins in peppermint by dispersive solid-phase extraction coupled with ultra-high performance liquid chromatography-tandem mass spectrometry based on MOF-808-TFA | |
| Oka et al. | Purification of quinoline yellow components using high-speed counter-current chromatography by stepwise increasing the flow-rate of the mobile phase | |
| Bogusz et al. | Determination of serum vitamins 25-OH-D2 and 25-OH-D3 with liquid chromatography–tandem mass spectrometry using atmospheric pressure chemical ionization or electrospray source and core-shell or sub-2 μm particle columns: A comparative study | |
| Zhao et al. | pH‐Zone‐refining counter‐current chromatography for two new lipo‐alkaloids separated from refined alkaline extraction of Kusnezoff monkshood root | |
| EP4012403A1 (en) | Pyrroloquinoline quinone analysis method | |
| Asztemborska et al. | Determination of diastereomerization barrier of some flavanones by high-performance liquid chromatography methods | |
| Wang et al. | Ion-pairing liquid chromatography/negative ion mass spectrometry for improved analysis of polar isoprene-related organosulfates. | |
| Montoro et al. | Liquid chromatography/tandem mass spectrometry of unusual phenols from Yucca schidigera bark: Comparison with other analytical techniques | |
| Zabelina et al. | Analysis of polychlorinated biphenyl mixtures by gas chromatography | |
| Su et al. | Rapid screening and target‐guided isolation of antioxidants from German chamomile by 2, 2‐diphenyl‐1‐picrylhydrazyl‐ultra‐high‐performance liquid chromatography‐mass spectrometry coupled with off‐line two‐dimensional high‐speed countercurrent chromatography | |
| do Amaral et al. | Integrated analytical workflow for chromatographic profiling and metabolite annotation of a cytotoxic Phorbas amaranthus extract | |
| Chen et al. | Simultaneous Determination of Formononetin, Biochanin A Daidzen and Genistein in Trifolium pratense (Red Clover) by HPLC. | |
| Lurie et al. | Recent Advances in Comprehensive Chromatographic Analysis of Emerging Drugs. | |
| Majors | Supported liquid extraction (SLE): the best kept secret in sample preparation | |
| CN117269375B (en) | A method for determining related substances in vitamin A acetate powder | |
| Chasse | Deep Learning Framework for Peak Detection at the Intact Level of Therapeutic Proteins |
Legal Events
| Date | Code | Title | Description |
|---|---|---|---|
| STAA | Information on the status of an ep patent application or granted ep patent |
Free format text: STATUS: THE INTERNATIONAL PUBLICATION HAS BEEN MADE |
|
| PUAI | Public reference made under article 153(3) epc to a published international application that has entered the european phase |
Free format text: ORIGINAL CODE: 0009012 |
|
| STAA | Information on the status of an ep patent application or granted ep patent |
Free format text: STATUS: REQUEST FOR EXAMINATION WAS MADE |
|
| 17P | Request for examination filed |
Effective date: 20220519 |
|
| AK | Designated contracting states |
Kind code of ref document: A1 Designated state(s): AL AT BE BG CH CY CZ DE DK EE ES FI FR GB GR HR HU IE IS IT LI LT LU LV MC MK MT NL NO PL PT RO RS SE SI SK SM TR |
|
| DAV | Request for validation of the european patent (deleted) | ||
| DAX | Request for extension of the european patent (deleted) | ||
| REG | Reference to a national code |
Ref country code: DE Ref legal event code: R079 Free format text: PREVIOUS MAIN CLASS: G01N0023200500 Ipc: G01N0030880000 |
|
| A4 | Supplementary search report drawn up and despatched |
Effective date: 20231108 |
|
| RIC1 | Information provided on ipc code assigned before grant |
Ipc: G01N 23/2055 20180101ALN20231102BHEP Ipc: G01N 30/26 20060101ALN20231102BHEP Ipc: G01N 30/88 20060101AFI20231102BHEP |
|
| GRAP | Despatch of communication of intention to grant a patent |
Free format text: ORIGINAL CODE: EPIDOSNIGR1 |
|
| STAA | Information on the status of an ep patent application or granted ep patent |
Free format text: STATUS: GRANT OF PATENT IS INTENDED |
|
| RIC1 | Information provided on ipc code assigned before grant |
Ipc: G01N 23/2055 20180101ALN20250414BHEP Ipc: G01N 30/26 20060101ALN20250414BHEP Ipc: G01N 30/88 20060101AFI20250414BHEP |
|
| INTG | Intention to grant announced |
Effective date: 20250507 |
|
| GRAJ | Information related to disapproval of communication of intention to grant by the applicant or resumption of examination proceedings by the epo deleted |
Free format text: ORIGINAL CODE: EPIDOSDIGR1 |
|
| STAA | Information on the status of an ep patent application or granted ep patent |
Free format text: STATUS: REQUEST FOR EXAMINATION WAS MADE |
|
| STAA | Information on the status of an ep patent application or granted ep patent |
Free format text: STATUS: EXAMINATION IS IN PROGRESS |
|
| INTC | Intention to grant announced (deleted) | ||
| 17Q | First examination report despatched |
Effective date: 20250908 |
|
| GRAP | Despatch of communication of intention to grant a patent |
Free format text: ORIGINAL CODE: EPIDOSNIGR1 |
|
| STAA | Information on the status of an ep patent application or granted ep patent |
Free format text: STATUS: GRANT OF PATENT IS INTENDED |