EP4053532A1 - Rotating machine diagnosis system - Google Patents
Rotating machine diagnosis system Download PDFInfo
- Publication number
- EP4053532A1 EP4053532A1 EP20880958.2A EP20880958A EP4053532A1 EP 4053532 A1 EP4053532 A1 EP 4053532A1 EP 20880958 A EP20880958 A EP 20880958A EP 4053532 A1 EP4053532 A1 EP 4053532A1
- Authority
- EP
- European Patent Office
- Prior art keywords
- loss
- rotating machine
- load
- running
- characteristic
- Prior art date
- Legal status (The legal status is an assumption and is not a legal conclusion. Google has not performed a legal analysis and makes no representation as to the accuracy of the status listed.)
- Granted
Links
Images




Classifications
-
- G—PHYSICS
- G01—MEASURING; TESTING
- G01M—TESTING STATIC OR DYNAMIC BALANCE OF MACHINES OR STRUCTURES; TESTING OF STRUCTURES OR APPARATUS, NOT OTHERWISE PROVIDED FOR
- G01M99/00—Subject matter not provided for in other groups of this subclass
- G01M99/007—Subject matter not provided for in other groups of this subclass by applying a load, e.g. for resistance or wear testing
-
- G—PHYSICS
- G01—MEASURING; TESTING
- G01M—TESTING STATIC OR DYNAMIC BALANCE OF MACHINES OR STRUCTURES; TESTING OF STRUCTURES OR APPARATUS, NOT OTHERWISE PROVIDED FOR
- G01M13/00—Testing of machine parts
- G01M13/02—Gearings; Transmission mechanisms
- G01M13/025—Test-benches with rotational drive means and loading means; Load or drive simulation
-
- G—PHYSICS
- G01—MEASURING; TESTING
- G01R—MEASURING ELECTRIC VARIABLES; MEASURING MAGNETIC VARIABLES
- G01R31/00—Arrangements for testing electric properties; Arrangements for locating electric faults; Arrangements for electrical testing characterised by what is being tested not provided for elsewhere
- G01R31/34—Testing dynamo-electric machines
- G01R31/343—Testing dynamo-electric machines in operation
Definitions
- the present invention relates to a rotating machine diagnosis technology.
- Patent Document 1 JP 2004-124765 A discloses "including a step of determining a start time of an abnormal state immediately before a monitor rotation machine stops from monitor time-series data of a feature amount of the monitor rotation machine used in a monitor manufacturing process, and statistically analyzing the monitor time-series data to obtain a value at the start time of the abnormal state of the feature amount as a threshold value of abnormality determination, a step of measuring time-series data of a feature amount of a motor current of a rotating machine to be diagnosed during a manufacturing process, a step of creating diagnostic data for evaluation from time-series data whose feature amount fluctuates during a manufacturing process, and a step of determining a time when the evaluation diagnostic data exceeds the threshold value as a life of the rotating machine to be diagnosed" (see summary).
- Patent Document 1 JP 2004-124765 A
- Patent Document 1 describes diagnosis of a life of a dry pump, and in the diagnosis of the life, it is important to determine a threshold value serving as a determination criterion.
- a method of determining the threshold value it is disclosed that time-series data of a maximum current value of the dry pump needs to be measured until the dry pump is stopped in a film forming step in which a current increase of the dry pump for monitoring is recognized in advance. Further, since the motor current is affected by a power supply fluctuation, it is necessary to remove the influence of the power supply fluctuation, and thus a state of equipment connected to the dry pump for monitoring needs to be specified in advance.
- the current, etc. of the rotating machine which is the dry pump to be measured, needs to be measured in advance, and the current fluctuation needs to be taken into consideration including other devices connected to the rotating machine. That is, while a specific abnormal state measured in advance is diagnosed, a method for diagnosing other abnormalities is not considered.
- an object of the invention is to provide a rotating machine diagnosis system that specifies a state of a rotating machine using load loss of the rotating machine.
- an example of a rotating machine diagnosis system of the invention is a rotating machine diagnosis system including a rotating machine having a load connected thereto, a detection unit configured to detect a running load characteristic when the rotating machine is running, a storage unit, and a control unit, in which a product load characteristic based on product specifications provided by a manufacturer of the rotating machine is stored in the storage unit beforehand, and the control unit stores the running load characteristic detected by the detection unit in the storage unit and, on the basis of the product load characteristic, uses iron loss and copper loss to specify load loss other than the iron loss and copper loss in the running load characteristic, and if the other load loss exceeds a predetermined range, causes the display unit to display information presuming that the running load characteristic is abnormal.
- a system that repeatedly processes a specific operation may measure a failure in the same operation or a state serving as a sign or an indication corresponding to the failure, and specify the measured sign or indication to set a threshold value of a parameter that changes with respect to the sign or indication, thereby notifying a user or an administrator of the sign or the indication when the parameter exceeds the threshold value during a next operation. In this way, it is possible to change or replace the rotating machine and or peripheral equipment thereof before the rotating machine fails.
- a threshold value when a specific sign or indication is determined by a threshold value, there may be a case in which, while the operation is normal in a first mode, a sign or indication of a failure is determined in a second mode.
- a threshold value is set, and the threshold value is merely used in a plurality of running modes, there may be a case in which, depending on the running mode, it is considered to be a sign or an indication of an abnormality even though the operation is normal, and correct operation is impossible.
- the rotating machine or a peripheral part thereof when the rotating machine or a peripheral part thereof is replaced, depending on the state of the part, it may be considered to be a sign or an indication of an abnormality even though the operation is normal.
- determination is performed only based on a threshold value, detection of a correct sign or indication is difficult.
- Fig. 1 is an appearance of the system for diagnosing the rotating machine.
- a main configuration of the system for diagnosing the rotating machine according to the present embodiment is that a load 50 such as a fan is connected to an induction motor 40, and a current transformer (CT) 30 detects the current of the induction motor 40.
- CT current transformer
- a measuring device 80 measures the current detected by the current transformer (CT) 30 (hereinafter, also simply referred to as CT 30), and the measured current is collected by a data collecting device 70.
- CT current transformer
- the system is a system having a central processing unit 90 that controls these devices.
- the measuring device 80 may measure not only the current detected by the CT 30 but also other information such as a voltage and a frequency of the voltage.
- the induction motor 40 generally receives power from a molded case circuit breaker 20 built in a distribution board 10 and drives a load 50 such as a fan based on a control signal of the central processing unit 90, etc.
- the symbol of the fan is described as the load of the fan, etc. in this figure.
- the invention may be applied to a load such as a pump portion or a belt conveyor as long as the load can be driven by the induction motor 40.
- the measuring device 80 measures various electric quantities based on current and voltage sensing data of a circuit that supplies power from the molded case circuit breaker 20 to the induction motor 40, and in order to sense the current, the current transformer (CT) 30 is built-in and installed in the distribution board 10 to perform current sensing of a circuit to be measured. Note that the current transformer (CT) 30 may be independently installed without being built in the distribution board 10.
- the circuit to be measured is directly wired for measurement.
- a voltage transformer VT
- the sensor and the measuring device are not particularly limited as long as sensing can be performed.
- the data collecting device 70 collects data of various electric quantities measured by the measuring device 80.
- a storage unit may be provided to store the collected data. Further, the storage unit may be disposed in the central processing unit 90, and both the data collecting device 70 and the central processing unit 90 may have the storage unit.
- the central processing unit 90 has a display unit, etc. that communicates with the data collecting device 70 to display data of various electric quantities or display an abnormality when it is determined that a characteristic different from the usual one described later is determined.
- the display unit that displays measured data and normal or unusual characteristics may be displayed not only on the central processing unit 90 but also on a tablet terminal, a smartphone, a feature phone, etc.
- the measuring device 80 and the data collecting device 70 are built in a control panel 60.
- the data collecting device 70 and the measuring device 80 are separate devices. However, the devices may be integrated.
- the data collecting device 70 and the central processing unit 90 may communicate with each other not only by wire but also wirelessly, and may communicate with each other partially wirelessly through a gateway, etc.
- CTs 30 even though only one CT 30 is illustrated for the sake of brevity, devices such as a plurality of CTs 30 or VTs may be connected to the data collecting device 70. Further, the data collecting device 70 and the CT 30, etc. may be wirelessly or partially wirelessly connected to each other. It is possible to adopt mesh type communication in which a plurality of CTs 30, etc. communicate with each other, and the communication method is not limited.
- Fig. 2 is a block diagram of the system for diagnosing the rotating machine. While Fig. 1 has been described with an awareness of physical wiring and appearance, Fig. 2 will be described with reference to a system configuration using the block diagram.
- a load 120 driven by the rotating machine 110 is illustrated on the rotating machine 110 such as the induction motor 40. Further, a detection unit 130 that detects a state of the rotating machine 110 for driving the load 120 is included, and a control unit 150 that causes a storage unit 140 to store a state of the rotating machine 110 detected by the detection unit 130 as a running load characteristic 170 is provided.
- the storage unit 140 stores a product load characteristic 160 based on product specifications provided by a manufacturer of the rotating machine 110 in advance.
- the control unit 150 performs predetermined calculation using the running load characteristic 170 and the product load characteristic 160 stored in the storage unit 140, and displays a calculation result on the display unit 180. A calculation method will be described later in each example.
- a control unit 155 of the rotating machine may be added.
- the control unit 150 causes the storage unit 140 to store a result detected by the detection unit 130 as the running load characteristic 170, performs predetermined calculation using the running load characteristic 170 and the product load characteristic 160, and causes the display unit 180 to display a result thereof.
- These processes may be provided in different parts. That is, after uploading from the storage unit 140 to a cloud system, a calculation process may be performed and displayed on a display unit of another device or the display unit 180 of this system.
- a first example will be described with reference to Figs. 3 to 5 .
- the rotating machine will be described as a representative.
- a DC converter described later includes a power converter and a frequency converter.
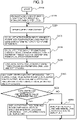
- Fig. 3 is a diagram illustrating a specific flowchart in which the system for diagnosing the rotating machine specifies mechanical loss + floating loss, which are other load loss.
- Mechanical loss includes mechanical damage in addition to typical friction loss.
- step S210 is a START process of processing of the system for diagnosing the rotating machine of this example.
- Step S215 is a process of storing at least the power factor, efficiency, iron loss, and copper loss in the storage unit 140 in the product load characteristic 160 based on the product specifications provided by the manufacturer of the rotating machine in advance.
- storing may be performed at any timing.
- an example of storing after start of processing is adopted.
- processing of the flowchart of Fig. 3 may be performed even when storing is performed before start of step S210.
- step S220 current and voltage are sensed by the current transformer (CT) 30 connected to a wire (circuit) from the molded case circuit breaker 20 to the induction motor 40. Other parameters such as frequency may be detected.
- the current transformer (CT) 30 is described as a current transformer (CT) for detecting current and voltage in the device configuration as a representative. However, a device for detecting other parameters may be added.
- active power (input), apparent power, and power factor are calculated from power factor and efficiency information of the stored product load characteristic 160 and sensed current and voltage information.
- step S250 among the active power (input), apparent power, and power factor calculated in step S230 for the power factor and efficiency of the product load characteristic 160, the calculated power factor is assumed to be equivalent to the power factor of the product load characteristic 160, and efficiency of the product load characteristic 160 based on the product specifications provided by the manufacturer in advance is specified.
- the product load characteristic 160 based on the product specifications refers to a so-called data sheet provided by the manufacturer of the rotating machine 110.
- the data sheet describes, as the load characteristics, voltage (V), frequency (Hz), current (A) corresponding to the load factor, efficiency (%), power factor (%), etc.
- the product load characteristic 160 is also referred to as a catalog load characteristic.
- the active power is calculated from the efficiency of the product load characteristic 160 specified in S260.
- step S280 other load loss (mechanical loss + floating loss) is calculated from the calculated active power (input), the specified active power (output), and the product load characteristics (iron loss and copper loss).
- a value provided by the manufacturer may be used for the iron loss.
- the iron loss is the sum of hysteresis loss and eddy current loss, is load loss when power is supplied without connecting the load to the rotating machine 110, and may be measured and detected in addition to be provided by the manufacturer.
- the copper loss is load loss due to winding resistance between terminals and is provided by the manufacturer.
- the actually measured value may be stored as the product load characteristic in step S215, and the measured value may be used to more accurately diagnose the rotating machine.
- step S290 it is determined that the other load loss (mechanical loss + floating loss) calculated in step S280 exceeds a predetermined range (threshold value), and when the predetermined range is exceeded, the fact that the predetermined range is exceeded or the other load loss (load loss including mechanical loss + floating loss) is displayed on the display unit 180 in step S294.
- a predetermined range threshold value
- the display on the display unit 180 only one of the fact that the predetermined range is exceeded or the other load loss may be displayed.
- step S220 the process returns to step S220, and the flow shifts to current sensing and voltage sensing by the current transformer (CT) 30 in the wire (circuit) from the molded case circuit breaker 20 to the induction motor 40, and the same flow transition is continued below.
- CT current transformer
- step S295 the state of the rotating machine 110 running based on the other load loss (mechanical loss + floating loss) or information about the other load loss is displayed on the display unit 180. Since the rotating machine is operating within the predetermined range, it is possible to perform a process in which the other load loss is not displayed on the display unit 180. A method of specifying the state of the rotating machine 110 based on the information about the other load loss will be described later.
- Fig. 4 is a diagram of a user interface in which the system for diagnosing the rotating machine illustrates the state of the rotating machine 110 using the load loss.
- An example will be given in which the other load loss (mechanical loss + floating loss) is calculated in the block diagram of the system illustrated in Fig. 2 and the system flowchart illustrated in Fig. 3 , and the load 120 is a pump.
- the horizontal axis indicates an elapsed time (running time) of the pump which is the load 120, and the vertical axis plots calculation of other load loss (mechanical loss + floating loss) in the flowchart illustrated in Fig. 3 .
- an area 300 plots a normal operation state
- an area 310 plots a time zone in which the pump portion, which is the load 120, is being replaced
- an area 320 plots the other load loss (mechanical loss + floating loss) after replacement of the pump portion, which is the load 120.
- mechanical loss + floating loss is zero.
- Fig. 4 illustrates that the other load loss (mechanical loss + floating loss) is reduced by replacing the pump portion, which is the load 120.
- Fig. 5 is a diagram illustrating a user interface in which the system for diagnosing the rotating machine 110 sets a deviation range. This example is an example of setting the deviation range based on Fig. 4 , and is an example of arbitrarily setting and displaying a threshold value 330 and comparing the threshold value 330 with the other load loss (mechanical loss + floating loss), which is a calculation result.
- a difference between the threshold value and other current load loss may be sequentially determined at a glance, and when the threshold value is exceeded, the exceeding value may be recognized as an unusual value, and the rotating machine 110 may be diagnosed.
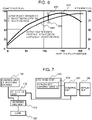
- Fig. 6 is a diagram for describing, using a graph, a principle of a method in which the system for diagnosing the rotating machine 110 specifies other load loss (mechanical loss + floating loss) using a relationship between active power, power factor, and efficiency of the catalog characteristics, which are product load factors, and is a diagram supplementing processing of the flowchart of Fig. 3 .
- the horizontal axis of Fig. 6 indicates the active power (output), and the vertical axis indicates the power factor and efficiency.
- the horizontal axis may be the active power (output) or may be represented by a load factor with respect to a rated output of the rotating machine 110.
- a curve 400 is a load factor-power factor characteristic curve obtained by drawing an approximate line from power factor information for the active power (output) (or load factor) of the product load characteristic 160 based on the product specifications provided by the manufacturer in advance.
- a plurality of points is plotted from the load factor and power factor of the product load characteristic 160, and is connected by a curve so as to pass through each of the plotted points. That is, the curve is a curve drawn so as to connect or pass through the points plotted from the information of the product load characteristic 160 provided by the manufacturer rather than plotted points specified using the measured value.
- a curve 410 is a load factor-efficiency characteristic curve obtained by drawing an approximate line from efficiency information for the active power (output) (or load factor) of the product load characteristic 160 based on the product specifications provided by the manufacturer in advance. While plotting of points used to draw the curve 410 is similar to that of the curve 400, points plotted using efficiency are different.
- the active power (input) and power factor are calculated from the sensed current and voltage information, and plotted on the load factor-power factor characteristic curve 400. From the points plotted on the curve 400, since the output active power is the same, a point is plotted as a point 420 to treat the power factor of the specified curve 400 as efficiency. At this point in time, the active power (input) and the active power (output) are regarded as equivalent and plotted.
- the calculated power factor is assumed to be equivalent to the power factor of the product load characteristic 160, and is plotted as a point 430 together with the load factor-efficiency characteristic curve 410. That is, a perpendicular line is drawn as indicated by an arrow in the figure from a point plotted on the power factor of the curve 400 toward the efficiency of the curve 410, and a point intersecting with the curve 410 is plotted.
- the active power (output) is derived from the active power (input) and the efficiency by the above-mentioned calculation.
- the load loss copper loss + iron loss + mechanical loss + floating loss
- load loss iron loss + mechanical loss + floating loss
- load loss (iron loss + mechanical loss + floating loss) obtained by subtracting the copper loss from the load loss (copper loss + iron loss + mechanical loss + floating loss)
- Fig. 7 is a block diagram of an example in which frequency control of the rotating machine is performed by the control unit 155 of the rotating machine, and is an application version of Fig. 2 .
- the load 120 driven by the rotating machine 110 is illustrated on the rotating machine 110 such as the induction motor 40.
- the control unit 155 of the rotating machine for controlling the rotation speed of the rotating machine 110 by frequency control is connected.
- the detection unit 130 that detects a state of the rotating machine 110 for driving the load 120 is included, and the control unit 150 is provided to cause the storage unit 140 to store the state of the rotating machine 110 detected by the detection unit 130 as a frequency characteristic 160a.
- the control unit 150 performs predetermined processing from information of the frequency characteristic 160a stored in the storage unit 140, and displays a calculation result on the display unit 180.
- a difference from Fig. 2 is that information stored in the storage unit 140 has the frequency characteristic 160a.
- control unit 155 of the rotating machine and the detection unit 130 are separately illustrated.
- control unit 155 of the rotating machine may have a function of the detection unit 130.
- a frequency characteristic detection method may be detected from voltage or voltage information.
- Fig. 8 illustrates a flowchart of processing of the system configuration of the block diagram of Fig. 7 .
- step S500 Processing of the system for diagnosing the rotating machine of this example starts from step S500, which is a START process.
- step S510 a frequency obtained from the detection unit 130 is sensed.
- step S520 frequency information is stored in the storage unit 140 as the frequency characteristic 160a.
- step S530 a time for reaching a second predetermined frequency from a first predetermined frequency is calculated and stored in the storage unit 140 as the frequency characteristic 160a. Note that a plurality of predetermined frequencies may be present.
- Step S540 is a process of determining whether or not the arrival time calculated in step S530 exceeds a predetermined range (threshold value). When the threshold value is exceeded, the fact that the predetermined range (threshold value) is exceeded and [frequency arrival time] is displayed on the display unit 180 in step S550, and then the process returns to frequency sensing in step S510.
- step S540 When the predetermined range (threshold value) is not exceeded in step S540, [frequency arrival time] is displayed on the display unit 180, and then the process returns to frequency sensing in step S510.
- Fig. 9 is a diagram for describing a scheme of performing diagnosis including the rotating machine 110 and the load 120 when the rotating machine 110 described in the block diagram of Fig. 7 and the flowchart of Fig. 8 is controlled by the inverter, etc. (the control unit 155 of the rotating machine 110) using a user interface.
- the horizontal axis of Fig. 9 indicates frequency
- the vertical axis indicates frequency arrival time.
- a time required for a rotation frequency of the rotating machine 110 to reach 50 Hz starting from 35 Hz is measured and plotted in this figure.
- the arrival time is plotted in a similar manner.
- the arrival time under the same condition at the rotation frequency at which the rotating machine 110 actually runs is measured and plotted.
- the rotating machine 110 and the load 120 by providing a deviation area indicated by 600 by utilizing this tendency.
- the case of being within 2.0 seconds is a normal operation, and the case of exceeding 2.0 is regarded as an abnormal state and belongs to the deviation area. That is, when the frequency is changed from 33 Hz to 43 Hz and when the frequency is changed from 75 Hz to 46 Hz, it takes time for frequency conversion of 2.0 seconds or more, and thus it is indicated that some abnormal state is obtained.
- Fig. 10 and Fig. 11 are graphs of the relationship between the active power and the power factor of the catalog specifications, which are product load factors.
- the horizontal axis of Fig. 10 and Fig. 11 indicates the load factor with respect to the rated output of the rotating machine 110, and the vertical axis indicates the power factor and efficiency.
- the horizontal axis may indicate the load factor with respect to the rated output of the rotating machine 110, or may indicate the active power (output).
- a curve 400 is a load factor-power factor characteristic curve obtained by drawing an approximate line from power factor information for the load factor (or the active power (output)) of the product load characteristic 160 based on the product specifications provided by the manufacturer in advance.
- a plurality of points is plotted from the load factor and power factor of the product load characteristic 160, and is connected by a curve so as to pass through each of the plotted points.
- the curve 400 is a curve drawn so as to connect or pass through the points plotted from the information of the product load characteristic 160 provided by the manufacturer rather than plotted points specified using the measured value.
- an obtained state 710 illustrated in Fig. 10 is a load factor-power factor characteristic plotted line plotted by calculating the active power (input) and the power factor from the sensed current and voltage information on the graph on which the load factor-power factor characteristic curve 400 is drawn.
- the obtained state 710 is plotted assuming that the active power (input) and the active power (output) are equivalent at this point in time.
- FIG. 11 illustrates movement of the plotted points.
- An area 720 represents a normal operation state
- an area 730 represents a state in which a degree of vacuum is increased after replacing the pump portion, which is the load 120
- an area 740 represents a normal operation state in which the degree of vacuum is ensured after replacing the pump portion, which is the load 120.
- the area 740 is considered to be an initial normal operation state, and the area shifts to the area 720 as the mechanical loss, etc. of the rotating machine 110, the pump portion, etc. increases. Therefore, by managing the load factor-power factor characteristic plotted line 710, it is possible to diagnose the rotating machine 110, the pump unit, etc.
- a running status may be displayed as illustrated in Fig. 11 before and after the pump is replaced, and based on the displayed information, it is possible to specify a state before the user replaces the pump as the area 720, a transition state as the area 730, and a stable operating state in which a degree of vacuum is highly refreshed as the area 740.
- the areas 720 to 740 may be set by the user while checking the obtained state 710 displayed on the display unit.
- the area 730 since there is a region close to a straight line from a point where the power factor and the load factor are zero to a region which seems to be the area 730, it is considered that the pump is in a starting state. Thereafter, since there is a region where the load factor and the power factor change, such as the area 730, the area may be specified as a linear region and a non-linear region, and thus it is possible to automatically set a region other than the linear region as the area 730.
- the area 720, etc. may be reset, and by monitoring the pump using the reset information, it is possible to diagnose the state of the pump in consideration of a more actual running state.
- a usual state is set to the normal operation of the area 740.
- the diagnostic system since the measured value after the replacement of the pump is present in the area 720, it is determined that there is a sign or an indication of failure immediately after the replacement. In this way, the diagnostic system continues to give an alert, and an indication that needs to be checked may be missed.
- the diagnostic system of this example may specify a sign or an indication of abnormality from the actual running state.
- FIG. 11 Another feature obtained from Fig. 11 is the presence of the area 730, which is a behavior in a transition state in which the degree of vacuum is increased after the pump portion is replaced.
- the behavior of the load factor-power factor characteristic plotted line 710 indicates that, during plotting around the area 730 below the load factor-power factor characteristic curve 400, specifically, the area 730 having a lower load factor and a lower power factor than those of the area 740, the degree of vacuum cannot be ensured.
- the load factor becomes low as the torque of the pump decreases.
- the power factor decreases.
- the area 730 in the transition state containing air may be specified as being normal in the transition state. In this way, when only the threshold value is observed by this time, the state may be specified as abnormal. Even in a state determined to be a sign or an indication of abnormality, when the operation of the pump is considered, the area 730, which is in a transition state up to the normal area 740 after replacing the part, may be specified as normal.
- setting may be performed not to give an alert.
- Fig. 12 is an example of a system for diagnosing a plurality of induction motors 40 by applying the diagnosis system of Fig. 1 .
- a plurality of molded case circuit breakers 20 is lined up on the distribution board 10 and connected to each induction motor 40 and load 50 in many cases.
- the current transformer (CT) 30 is mounted on each of the molded case circuit breakers 20 to detect the current of the induction motor 40.
- a plurality of measuring devices 80 measures the current detected by the current transformer (CT) 30 (hereinafter, also simply referred to as CT 30), and collects the measured current by the data collecting device 70.
- CT 30 current transformer
- This system has the central processing unit 90 that controls these devices.
- the measuring device 80 may measure not only the current detected by the CT 30 but also other information such as a voltage and a frequency of the voltage.
- the data collecting device 70 collects data of various electric quantities measured by the plurality of measuring devices 80.
- the central processing unit 90 has a display unit that communicates with the data collecting device 70 and displays data of various electric quantities, or displays an abnormality when it is determined that a characteristic different from the usual one described later is determined.
- This figure illustrates an example in which the plurality of measuring devices 80 is connected to one data collecting device 70 and the data collecting device 70 collects data of the plurality of measuring devices 80 at once.
- one measuring device 80 detects currents of the plurality of induction motors 40.
- a plurality of data collecting devices 70 is connected to the plurality of measuring devices 80, collects data, and is connected to the central processing unit 90. That is, it is possible to monitor the plurality of induction motors 40.
- maintenance diagnosis of the induction motor may be performed based on information such as the current supplying power to the induction motor, and information of a plurality of induction motors may be generally collected together by a switch board or a distribution board, which is effective in facilitating systematization.
- the invention is not limited to the above-mentioned examples, and includes various modifications.
- the above-mentioned examples have been described in detail in order to describe the invention in an easy-to-understand manner, and are not limited to those having all the described configurations.
Landscapes
- Physics & Mathematics (AREA)
- General Physics & Mathematics (AREA)
- Tests Of Circuit Breakers, Generators, And Electric Motors (AREA)
- Testing Of Devices, Machine Parts, Or Other Structures Thereof (AREA)
Abstract
Description
- The present invention relates to a rotating machine diagnosis technology.
- Patent Document 1 (
JP 2004-124765 A - Patent Document 1:
JP 2004-124765 A - When predictive maintenance of an induction motor is performed, it is common to use sound, heat, or vibration as a measurement item necessary for analyzing a running state of the induction motor.
-
Patent Document 1 describes diagnosis of a life of a dry pump, and in the diagnosis of the life, it is important to determine a threshold value serving as a determination criterion. As for a method of determining the threshold value, it is disclosed that time-series data of a maximum current value of the dry pump needs to be measured until the dry pump is stopped in a film forming step in which a current increase of the dry pump for monitoring is recognized in advance. Further, since the motor current is affected by a power supply fluctuation, it is necessary to remove the influence of the power supply fluctuation, and thus a state of equipment connected to the dry pump for monitoring needs to be specified in advance. - That is, the current, etc. of the rotating machine, which is the dry pump to be measured, needs to be measured in advance, and the current fluctuation needs to be taken into consideration including other devices connected to the rotating machine. That is, while a specific abnormal state measured in advance is diagnosed, a method for diagnosing other abnormalities is not considered.
- Therefore, an object of the invention is to provide a rotating machine diagnosis system that specifies a state of a rotating machine using load loss of the rotating machine.
- To solve the above-mentioned problem, an example of a rotating machine diagnosis system of the invention is a rotating machine diagnosis system including a rotating machine having a load connected thereto, a detection unit configured to detect a running load characteristic when the rotating machine is running, a storage unit, and a control unit, in which a product load characteristic based on product specifications provided by a manufacturer of the rotating machine is stored in the storage unit beforehand, and the control unit stores the running load characteristic detected by the detection unit in the storage unit and, on the basis of the product load characteristic, uses iron loss and copper loss to specify load loss other than the iron loss and copper loss in the running load characteristic, and if the other load loss exceeds a predetermined range, causes the display unit to display information presuming that the running load characteristic is abnormal.
- According to the invention, it is possible to specify a state of a rotating machine using load loss of the rotating machine. Issues, configurations, and effects other than those described above will be clarified by the following description of the embodiment.
-
-
Fig. 1 is an appearance of a system for diagnosing a rotating machine. -
Fig. 2 is a block diagram of the system for diagnosing the rotating machine. -
Fig. 3 is a diagram illustrating a flowchart in which the system for diagnosing the rotating machine specifies mechanical loss and floating loss, which are other load loss. -
Fig. 4 is a diagram illustrating a user interface in which the system for diagnosing the rotating machine illustrates a state of the rotating machine using load loss. -
Fig. 5 is a diagram illustrating a user interface in which the system for diagnosing the rotating machine sets a deviation range. -
Fig. 6 is a diagram for describing a method in which the system for diagnosing the rotating machine specifies other load loss (mechanical loss + floating loss) using a relationship between active power, power factor, and efficiency of the catalog characteristics, which are product load factors. -
Fig. 7 is a block diagram of a system for diagnosing a rotating machine. -
Fig. 8 is a flowchart of a diagnosis method using a frequency of the system for diagnosing the rotating machine. -
Fig. 9 is a diagram illustrating a method in which the system for diagnosing the rotating machine specifies a state of the rotating machine using a frequency of an inverter and a unit frequency arrival time. -
Fig. 10 is a diagram illustrating an example of a diagnosis method using other load loss of the system for diagnosing the rotating machine. -
Fig. 11 is a diagram illustrating an example of a diagnosis method using other load loss of the system for diagnosing the rotating machine. -
Fig. 12 is a diagram illustrating a system for diagnosing a plurality of rotating machines. - Hereinafter, the embodiment and examples will be described with reference to the drawings. In all the drawings for describing the examples, the same components are designated by the same reference symbols, and the repeated description thereof will be omitted. When the same reference symbols are attached in different figures, since the same reference symbols described in the other figures have the same configuration in principle, the description may be omitted. In addition, in order to make the drawing easier to understand, hatching may be added in a plan view.
- In diagnosis of a rotating machine, a system that repeatedly processes a specific operation may measure a failure in the same operation or a state serving as a sign or an indication corresponding to the failure, and specify the measured sign or indication to set a threshold value of a parameter that changes with respect to the sign or indication, thereby notifying a user or an administrator of the sign or the indication when the parameter exceeds the threshold value during a next operation. In this way, it is possible to change or replace the rotating machine and or peripheral equipment thereof before the rotating machine fails.
- However, in a system in which the rotating machine has a plurality of running states, when a specific sign or indication is determined by a threshold value, there may be a case in which, while the operation is normal in a first mode, a sign or indication of a failure is determined in a second mode. When a threshold value is set, and the threshold value is merely used in a plurality of running modes, there may be a case in which, depending on the running mode, it is considered to be a sign or an indication of an abnormality even though the operation is normal, and correct operation is impossible.
- In addition, when the rotating machine or a peripheral part thereof is replaced, depending on the state of the part, it may be considered to be a sign or an indication of an abnormality even though the operation is normal. When determination is performed only based on a threshold value, detection of a correct sign or indication is difficult.
- That is, it is necessary to specify a normal state of a plurality of running states and an abnormality or a sign or indication that an abnormality occurs. For example, even though it takes some time for aging until a part becomes familiar after part replacement, when a threshold value is set for the part after aging, an aging time immediately after part replacement is insufficient and a state before becoming familiar is determined to be a sign or an indication of an abnormality in some cases. When the user or administrator is notified of such a state, the threshold value is lowered, and a sign or an indication of a truly detected failure is overlooked.
- Therefore, the invention provides a system for diagnosing the state of the rotating machine by paying attention to load loss of the rotating machine in consideration of a state of a part connected to the rotating machine and a state of actual operation. Hereinafter, the embodiment will be described with reference to
Figs. 1 and 2. Fig. 1 is an appearance of the system for diagnosing the rotating machine. A main configuration of the system for diagnosing the rotating machine according to the present embodiment is that aload 50 such as a fan is connected to aninduction motor 40, and a current transformer (CT) 30 detects the current of theinduction motor 40. Further, ameasuring device 80 measures the current detected by the current transformer (CT) 30 (hereinafter, also simply referred to as CT 30), and the measured current is collected by adata collecting device 70. The system is a system having acentral processing unit 90 that controls these devices. Themeasuring device 80 may measure not only the current detected by theCT 30 but also other information such as a voltage and a frequency of the voltage. - Further, the
induction motor 40 generally receives power from a moldedcase circuit breaker 20 built in adistribution board 10 and drives aload 50 such as a fan based on a control signal of thecentral processing unit 90, etc. - Here, the symbol of the fan is described as the load of the fan, etc. in this figure. However, for example, the invention may be applied to a load such as a pump portion or a belt conveyor as long as the load can be driven by the
induction motor 40. - The
measuring device 80 measures various electric quantities based on current and voltage sensing data of a circuit that supplies power from the moldedcase circuit breaker 20 to theinduction motor 40, and in order to sense the current, the current transformer (CT) 30 is built-in and installed in thedistribution board 10 to perform current sensing of a circuit to be measured. Note that the current transformer (CT) 30 may be independently installed without being built in thedistribution board 10. - Further, with regard to voltage sensing, in this example, the circuit to be measured is directly wired for measurement. However, depending on the voltage, a voltage transformer (VT) may be used. The sensor and the measuring device are not particularly limited as long as sensing can be performed.
- The
data collecting device 70 collects data of various electric quantities measured by themeasuring device 80. A storage unit may be provided to store the collected data. Further, the storage unit may be disposed in thecentral processing unit 90, and both thedata collecting device 70 and thecentral processing unit 90 may have the storage unit. - The
central processing unit 90 has a display unit, etc. that communicates with thedata collecting device 70 to display data of various electric quantities or display an abnormality when it is determined that a characteristic different from the usual one described later is determined. The display unit that displays measured data and normal or unusual characteristics may be displayed not only on thecentral processing unit 90 but also on a tablet terminal, a smartphone, a feature phone, etc. In addition to the graphical display of data, etc., it is possible to display text for the administrator using, for example, e-mail or SMS (Short Message Service). In this example, the measuringdevice 80 and thedata collecting device 70 are built in acontrol panel 60. - Further, in this example, the
data collecting device 70 and the measuringdevice 80 are separate devices. However, the devices may be integrated. Thedata collecting device 70 and thecentral processing unit 90 may communicate with each other not only by wire but also wirelessly, and may communicate with each other partially wirelessly through a gateway, etc. - Further, even though only one
CT 30 is illustrated for the sake of brevity, devices such as a plurality ofCTs 30 or VTs may be connected to thedata collecting device 70. Further, thedata collecting device 70 and theCT 30, etc. may be wirelessly or partially wirelessly connected to each other. It is possible to adopt mesh type communication in which a plurality ofCTs 30, etc. communicate with each other, and the communication method is not limited. -
Fig. 2 is a block diagram of the system for diagnosing the rotating machine. WhileFig. 1 has been described with an awareness of physical wiring and appearance,Fig. 2 will be described with reference to a system configuration using the block diagram. - A
load 120 driven by the rotatingmachine 110 is illustrated on therotating machine 110 such as theinduction motor 40. Further, adetection unit 130 that detects a state of therotating machine 110 for driving theload 120 is included, and acontrol unit 150 that causes astorage unit 140 to store a state of therotating machine 110 detected by thedetection unit 130 as a running load characteristic 170 is provided. - The
storage unit 140 stores a product load characteristic 160 based on product specifications provided by a manufacturer of therotating machine 110 in advance. Thecontrol unit 150 performs predetermined calculation using the running load characteristic 170 and the product load characteristic 160 stored in thestorage unit 140, and displays a calculation result on thedisplay unit 180. A calculation method will be described later in each example. When therotating machine 110 is controlled by an inverter, acontrol unit 155 of the rotating machine may be added. - In
Fig. 2 , thecontrol unit 150 causes thestorage unit 140 to store a result detected by thedetection unit 130 as the running load characteristic 170, performs predetermined calculation using the running load characteristic 170 and the product load characteristic 160, and causes thedisplay unit 180 to display a result thereof. These processes may be provided in different parts. That is, after uploading from thestorage unit 140 to a cloud system, a calculation process may be performed and displayed on a display unit of another device or thedisplay unit 180 of this system. - A first example will be described with reference to
Figs. 3 to 5 . In this specification, the rotating machine will be described as a representative. A DC converter described later includes a power converter and a frequency converter. -
Fig. 3 is a diagram illustrating a specific flowchart in which the system for diagnosing the rotating machine specifies mechanical loss + floating loss, which are other load loss. Mechanical loss includes mechanical damage in addition to typical friction loss. - Description will start from step S210, which is a START process of processing of the system for diagnosing the rotating machine of this example.
- Step S215 is a process of storing at least the power factor, efficiency, iron loss, and copper loss in the
storage unit 140 in the product load characteristic 160 based on the product specifications provided by the manufacturer of the rotating machine in advance. When storing is performed before processing of step S230 and step S280, storing may be performed at any timing. In this flowchart, an example of storing after start of processing is adopted. However, processing of the flowchart ofFig. 3 may be performed even when storing is performed before start of step S210. - In step S220, current and voltage are sensed by the current transformer (CT) 30 connected to a wire (circuit) from the molded
case circuit breaker 20 to theinduction motor 40. Other parameters such as frequency may be detected. The current transformer (CT) 30 is described as a current transformer (CT) for detecting current and voltage in the device configuration as a representative. However, a device for detecting other parameters may be added. In step S230, active power (input), apparent power, and power factor are calculated from power factor and efficiency information of the stored product load characteristic 160 and sensed current and voltage information. - In step S250, among the active power (input), apparent power, and power factor calculated in step S230 for the power factor and efficiency of the product load characteristic 160, the calculated power factor is assumed to be equivalent to the power factor of the product load characteristic 160, and efficiency of the product load characteristic 160 based on the product specifications provided by the manufacturer in advance is specified.
- Here, the product load characteristic 160 based on the product specifications refers to a so-called data sheet provided by the manufacturer of the
rotating machine 110. The data sheet describes, as the load characteristics, voltage (V), frequency (Hz), current (A) corresponding to the load factor, efficiency (%), power factor (%), etc. The product load characteristic 160 is also referred to as a catalog load characteristic. - The active power (output) is calculated from the efficiency of the product load characteristic 160 specified in S260. The efficiency may be specified by the following formula.

- Therefore, the active power may be specified by the following formula.

- In step S280, other load loss (mechanical loss + floating loss) is calculated from the calculated active power (input), the specified active power (output), and the product load characteristics (iron loss and copper loss). A value provided by the manufacturer may be used for the iron loss. The iron loss is the sum of hysteresis loss and eddy current loss, is load loss when power is supplied without connecting the load to the
rotating machine 110, and may be measured and detected in addition to be provided by the manufacturer. The copper loss is load loss due to winding resistance between terminals and is provided by the manufacturer. The actually measured value may be stored as the product load characteristic in step S215, and the measured value may be used to more accurately diagnose the rotating machine. - In step S290, it is determined that the other load loss (mechanical loss + floating loss) calculated in step S280 exceeds a predetermined range (threshold value), and when the predetermined range is exceeded, the fact that the predetermined range is exceeded or the other load loss (load loss including mechanical loss + floating loss) is displayed on the
display unit 180 in step S294. As for the display on thedisplay unit 180, only one of the fact that the predetermined range is exceeded or the other load loss may be displayed. For the determination using the predetermined range, it is possible to use comparison by a flag or a threshold value after addition and subtraction. - Thereafter, the process returns to step S220, and the flow shifts to current sensing and voltage sensing by the current transformer (CT) 30 in the wire (circuit) from the molded
case circuit breaker 20 to theinduction motor 40, and the same flow transition is continued below. - On the other hand, when the predetermined range (threshold value) is not exceeded, the process proceeds to step S295, and the state of the
rotating machine 110 running based on the other load loss (mechanical loss + floating loss) or information about the other load loss is displayed on thedisplay unit 180. Since the rotating machine is operating within the predetermined range, it is possible to perform a process in which the other load loss is not displayed on thedisplay unit 180. A method of specifying the state of therotating machine 110 based on the information about the other load loss will be described later. -
Fig. 4 is a diagram of a user interface in which the system for diagnosing the rotating machine illustrates the state of therotating machine 110 using the load loss. An example will be given in which the other load loss (mechanical loss + floating loss) is calculated in the block diagram of the system illustrated inFig. 2 and the system flowchart illustrated inFig. 3 , and theload 120 is a pump. - In
Fig. 4 , the horizontal axis indicates an elapsed time (running time) of the pump which is theload 120, and the vertical axis plots calculation of other load loss (mechanical loss + floating loss) in the flowchart illustrated inFig. 3 . - In this example, an
area 300 plots a normal operation state, anarea 310 plots a time zone in which the pump portion, which is theload 120, is being replaced, and anarea 320 plots the other load loss (mechanical loss + floating loss) after replacement of the pump portion, which is theload 120. In the replacement time zone, while the pump is being replaced, the rotatingmachine 110 is not running, and thus mechanical loss + floating loss is zero. -
Fig. 4 illustrates that the other load loss (mechanical loss + floating loss) is reduced by replacing the pump portion, which is theload 120. -
Fig. 5 is a diagram illustrating a user interface in which the system for diagnosing therotating machine 110 sets a deviation range. This example is an example of setting the deviation range based onFig. 4 , and is an example of arbitrarily setting and displaying athreshold value 330 and comparing thethreshold value 330 with the other load loss (mechanical loss + floating loss), which is a calculation result. - In this way, a difference between the threshold value and other current load loss (mechanical loss + floating loss) may be sequentially determined at a glance, and when the threshold value is exceeded, the exceeding value may be recognized as an unusual value, and the
rotating machine 110 may be diagnosed. -
Fig. 6 is a diagram for describing, using a graph, a principle of a method in which the system for diagnosing therotating machine 110 specifies other load loss (mechanical loss + floating loss) using a relationship between active power, power factor, and efficiency of the catalog characteristics, which are product load factors, and is a diagram supplementing processing of the flowchart ofFig. 3 . - The horizontal axis of
Fig. 6 indicates the active power (output), and the vertical axis indicates the power factor and efficiency. The horizontal axis may be the active power (output) or may be represented by a load factor with respect to a rated output of therotating machine 110. - A
curve 400 is a load factor-power factor characteristic curve obtained by drawing an approximate line from power factor information for the active power (output) (or load factor) of the product load characteristic 160 based on the product specifications provided by the manufacturer in advance. A plurality of points is plotted from the load factor and power factor of the product load characteristic 160, and is connected by a curve so as to pass through each of the plotted points. That is, the curve is a curve drawn so as to connect or pass through the points plotted from the information of the product load characteristic 160 provided by the manufacturer rather than plotted points specified using the measured value. - A
curve 410 is a load factor-efficiency characteristic curve obtained by drawing an approximate line from efficiency information for the active power (output) (or load factor) of the product load characteristic 160 based on the product specifications provided by the manufacturer in advance. While plotting of points used to draw thecurve 410 is similar to that of thecurve 400, points plotted using efficiency are different. - The active power (input) and power factor are calculated from the sensed current and voltage information, and plotted on the load factor-power factor
characteristic curve 400. From the points plotted on thecurve 400, since the output active power is the same, a point is plotted as apoint 420 to treat the power factor of the specifiedcurve 400 as efficiency. At this point in time, the active power (input) and the active power (output) are regarded as equivalent and plotted. - Next, the calculated power factor is assumed to be equivalent to the power factor of the product load characteristic 160, and is plotted as a
point 430 together with the load factor-efficiencycharacteristic curve 410. That is, a perpendicular line is drawn as indicated by an arrow in the figure from a point plotted on the power factor of thecurve 400 toward the efficiency of thecurve 410, and a point intersecting with thecurve 410 is plotted. - Since the efficiency may be specified from the
point 430, the active power (output) is derived from the active power (input) and the efficiency by the above-mentioned calculation. When the active power (output) and efficiency can be specified, the load loss (copper loss + iron loss + mechanical loss + floating loss) may be obtained. - In the load loss (copper loss + iron loss + mechanical loss + floating loss), the copper loss is specified in advance in the product specifications provided by the manufacturer, and may be specified since the copper loss has a characteristic proportional to the square of the load factor.

- That is, load loss (iron loss + mechanical loss + floating loss) obtained by subtracting the copper loss from the load loss (copper loss + iron loss + mechanical loss + floating loss) may be calculated from the following formula.


- Further, when the iron loss is specified in the product specifications provided by the manufacturer in advance, other load loss (mechanical loss + floating loss) may be calculated by excluding the iron loss without change. When the iron loss is not specified in the product specifications provided by the manufacturer in advance, the active power (input) when power is supplied without connecting the load to the
rotating machine 110 is measured, and a measurement result is treated as equivalent to the iron loss, so that other load loss (mechanical loss + floating loss) may be obtained using the following formula by subtracting the equivalent iron loss from the load loss (iron loss + mechanical loss + floating loss) excluding the copper loss.

-
Fig. 7 is a block diagram of an example in which frequency control of the rotating machine is performed by thecontrol unit 155 of the rotating machine, and is an application version ofFig. 2 . - The
load 120 driven by the rotatingmachine 110 is illustrated on therotating machine 110 such as theinduction motor 40. Thecontrol unit 155 of the rotating machine for controlling the rotation speed of therotating machine 110 by frequency control is connected. Further, thedetection unit 130 that detects a state of therotating machine 110 for driving theload 120 is included, and thecontrol unit 150 is provided to cause thestorage unit 140 to store the state of therotating machine 110 detected by thedetection unit 130 as a frequency characteristic 160a. Thecontrol unit 150 performs predetermined processing from information of the frequency characteristic 160a stored in thestorage unit 140, and displays a calculation result on thedisplay unit 180. A difference fromFig. 2 is that information stored in thestorage unit 140 has the frequency characteristic 160a. - In this figure, the
control unit 155 of the rotating machine and thedetection unit 130 are separately illustrated. However, thecontrol unit 155 of the rotating machine may have a function of thedetection unit 130. - In addition, as described in
Fig. 2 , a frequency characteristic detection method may be detected from voltage or voltage information. -
Fig. 8 illustrates a flowchart of processing of the system configuration of the block diagram ofFig. 7 . - Processing of the system for diagnosing the rotating machine of this example starts from step S500, which is a START process. In step S510, a frequency obtained from the
detection unit 130 is sensed. In step S520, frequency information is stored in thestorage unit 140 as the frequency characteristic 160a. In step S530, a time for reaching a second predetermined frequency from a first predetermined frequency is calculated and stored in thestorage unit 140 as the frequency characteristic 160a. Note that a plurality of predetermined frequencies may be present. - Step S540 is a process of determining whether or not the arrival time calculated in step S530 exceeds a predetermined range (threshold value). When the threshold value is exceeded, the fact that the predetermined range (threshold value) is exceeded and [frequency arrival time] is displayed on the
display unit 180 in step S550, and then the process returns to frequency sensing in step S510. - When the predetermined range (threshold value) is not exceeded in step S540, [frequency arrival time] is displayed on the
display unit 180, and then the process returns to frequency sensing in step S510. -
Fig. 9 is a diagram for describing a scheme of performing diagnosis including therotating machine 110 and theload 120 when therotating machine 110 described in the block diagram ofFig. 7 and the flowchart ofFig. 8 is controlled by the inverter, etc. (thecontrol unit 155 of the rotating machine 110) using a user interface. - The horizontal axis of
Fig. 9 indicates frequency, and the vertical axis indicates frequency arrival time. For example, a time required for a rotation frequency of therotating machine 110 to reach 50 Hz starting from 35 Hz is measured and plotted in this figure. In the running state of therotating machine 110, when there are several phases of the behavior of reaching 50 Hz starting from 35 Hz, the arrival time is plotted in a similar manner. Similarly, the arrival time under the same condition at the rotation frequency at which therotating machine 110 actually runs, such as changing from 20 Hz to 45 Hz, is measured and plotted. - In such a case, when the mechanical loss of the
rotating machine 110 and theload 120 increases over time, the arrival time under the same condition tends to increase. - In this case, it is possible to perform diagnosis including the
rotating machine 110 and theload 120 by providing a deviation area indicated by 600 by utilizing this tendency. In this example, when various frequency conversions are performed, the case of being within 2.0 seconds is a normal operation, and the case of exceeding 2.0 is regarded as an abnormal state and belongs to the deviation area. That is, when the frequency is changed from 33 Hz to 43 Hz and when the frequency is changed from 75 Hz to 46 Hz, it takes time for frequency conversion of 2.0 seconds or more, and thus it is indicated that some abnormal state is obtained. - Next, the case of performing diagnosis including the
rotating machine 110 and theload 120 is described in a third example usingFig. 10 and Fig. 11 , which are graphs of the relationship between the active power and the power factor of the catalog specifications, which are product load factors. - The horizontal axis of
Fig. 10 and Fig. 11 indicates the load factor with respect to the rated output of therotating machine 110, and the vertical axis indicates the power factor and efficiency. The horizontal axis may indicate the load factor with respect to the rated output of therotating machine 110, or may indicate the active power (output). - As in
Fig. 6 , acurve 400 is a load factor-power factor characteristic curve obtained by drawing an approximate line from power factor information for the load factor (or the active power (output)) of the product load characteristic 160 based on the product specifications provided by the manufacturer in advance. A plurality of points is plotted from the load factor and power factor of the product load characteristic 160, and is connected by a curve so as to pass through each of the plotted points. - That is, the
curve 400 is a curve drawn so as to connect or pass through the points plotted from the information of the product load characteristic 160 provided by the manufacturer rather than plotted points specified using the measured value. - Meanwhile, an obtained
state 710 illustrated inFig. 10 is a load factor-power factor characteristic plotted line plotted by calculating the active power (input) and the power factor from the sensed current and voltage information on the graph on which the load factor-power factorcharacteristic curve 400 is drawn. The obtainedstate 710 is plotted assuming that the active power (input) and the active power (output) are equivalent at this point in time. -
Fig. 11 illustrates movement of the plotted points. Anarea 720 represents a normal operation state, anarea 730 represents a state in which a degree of vacuum is increased after replacing the pump portion, which is theload 120, and anarea 740 represents a normal operation state in which the degree of vacuum is ensured after replacing the pump portion, which is theload 120. - From a load factor-power factor characteristic plotted
line 710 ofFig. 11 , there are two findings obtained from a diagnostic point of view. One is that the load factor during normal operation may be reduced by replacing the pump portion, which can be seen from a shift from thearea 720 to thearea 740. - A reason therefor is that the mechanical loss, etc is reduced and the load factor is lowered by replacing the pump portion.
- Paradoxically, the
area 740 is considered to be an initial normal operation state, and the area shifts to thearea 720 as the mechanical loss, etc. of therotating machine 110, the pump portion, etc. increases. Therefore, by managing the load factor-power factor characteristic plottedline 710, it is possible to diagnose therotating machine 110, the pump unit, etc. - A running status may be displayed as illustrated in
Fig. 11 before and after the pump is replaced, and based on the displayed information, it is possible to specify a state before the user replaces the pump as thearea 720, a transition state as thearea 730, and a stable operating state in which a degree of vacuum is highly refreshed as thearea 740. Theareas 720 to 740 may be set by the user while checking the obtainedstate 710 displayed on the display unit. - Further, for example, since there is a region close to a straight line from a point where the power factor and the load factor are zero to a region which seems to be the
area 730, it is considered that the pump is in a starting state. Thereafter, since there is a region where the load factor and the power factor change, such as thearea 730, the area may be specified as a linear region and a non-linear region, and thus it is possible to automatically set a region other than the linear region as thearea 730. - Not only before and after replacement, but also when the operating time exceeds a certain time, the
area 720, etc. may be reset, and by monitoring the pump using the reset information, it is possible to diagnose the state of the pump in consideration of a more actual running state. - In the conventional threshold value setting, a usual state is set to the normal operation of the
area 740. However, in this case, since the measured value after the replacement of the pump is present in thearea 720, it is determined that there is a sign or an indication of failure immediately after the replacement. In this way, the diagnostic system continues to give an alert, and an indication that needs to be checked may be missed. The diagnostic system of this example may specify a sign or an indication of abnormality from the actual running state. - Another feature obtained from
Fig. 11 is the presence of thearea 730, which is a behavior in a transition state in which the degree of vacuum is increased after the pump portion is replaced. - In order to confirm that the degree of vacuum in the pump portion including the inside of a pipe is ensured, determination has been made by measurement using a vacuum pressure sensor as a conventional technology.
- However, the behavior of the load factor-power factor characteristic plotted
line 710 indicates that, during plotting around thearea 730 below the load factor-power factorcharacteristic curve 400, specifically, thearea 730 having a lower load factor and a lower power factor than those of thearea 740, the degree of vacuum cannot be ensured. After replacing a part of the pump, air enters a part of a flow path and the degree of vacuum drops. However, in this case, since air pulls up the flow path in a state where the density is low when compared to a fluid, the load factor becomes low as the torque of the pump decreases. In addition, since the load factor decreases, the power factor decreases. - That is, when observing the characteristics of the motor alone, the case where a position, at which the load factor and the power factor after the replacement of the part of the pump are plotted, is away from the
curve 400 is not determined to be normal. However, thearea 730 in the transition state containing air may be specified as being normal in the transition state. In this way, when only the threshold value is observed by this time, the state may be specified as abnormal. Even in a state determined to be a sign or an indication of abnormality, when the operation of the pump is considered, thearea 730, which is in a transition state up to thenormal area 740 after replacing the part, may be specified as normal. When the pump state belongs to thearea 730 in the transition state, setting may be performed not to give an alert. - In this way, by drawing the load factor and characteristics of the pump, etc. as a graph, for example, it is possible to specify a state in which a target device or a target system, such as a vacuum pump, is not normal, which may be considered as an alternative to a confirmation method using a conventional vacuum degree sensor. The state of the pump may be specified without providing a separate vacuum degree sensor. Fourth Example
-
Fig. 12 is an example of a system for diagnosing a plurality ofinduction motors 40 by applying the diagnosis system ofFig. 1 . - In general, a plurality of molded
case circuit breakers 20 is lined up on thedistribution board 10 and connected to eachinduction motor 40 andload 50 in many cases. In this case, similarly toFig. 1 , the current transformer (CT) 30 is mounted on each of the moldedcase circuit breakers 20 to detect the current of theinduction motor 40. Further, a plurality of measuringdevices 80 measures the current detected by the current transformer (CT) 30 (hereinafter, also simply referred to as CT 30), and collects the measured current by thedata collecting device 70. This system has thecentral processing unit 90 that controls these devices. The measuringdevice 80 may measure not only the current detected by theCT 30 but also other information such as a voltage and a frequency of the voltage. - The
data collecting device 70 collects data of various electric quantities measured by the plurality of measuringdevices 80. Thecentral processing unit 90 has a display unit that communicates with thedata collecting device 70 and displays data of various electric quantities, or displays an abnormality when it is determined that a characteristic different from the usual one described later is determined. - This figure illustrates an example in which the plurality of measuring
devices 80 is connected to onedata collecting device 70 and thedata collecting device 70 collects data of the plurality of measuringdevices 80 at once. However, it is conceivable that onemeasuring device 80 detects currents of the plurality ofinduction motors 40. - Further, it is possible to adopt a configuration in which a plurality of
data collecting devices 70 is connected to the plurality of measuringdevices 80, collects data, and is connected to thecentral processing unit 90. That is, it is possible to monitor the plurality ofinduction motors 40. - According to the embodiment, maintenance diagnosis of the induction motor may be performed based on information such as the current supplying power to the induction motor, and information of a plurality of induction motors may be generally collected together by a switch board or a distribution board, which is effective in facilitating systematization.
- Note that the invention is not limited to the above-mentioned examples, and includes various modifications. For example, the above-mentioned examples have been described in detail in order to describe the invention in an easy-to-understand manner, and are not limited to those having all the described configurations. Further, it is possible to replace a part of a configuration of one example with a configuration of another example, and it is possible to add a configuration of one example to a configuration of another example. Further, with respect to a part of a configuration of each example, it is possible to add, delete, or replace another configuration.
-
- 10
- Distribution board
- 20
- Molded case circuit breaker
- 30
- Current transformer (CT)
- 40
- Induction motor
- 50
- Load
- 70
- Data collecting device
- 80
- Measuring device
- 90
- Central processing unit
- 110
- Rotating machine
Claims (11)
- A rotating machine diagnosis system, comprising:a rotating machine having a load connected thereto;a detection unit configured to detect a running load characteristic when the rotating machine is running;a storage unit; anda control unit, wherein:a product load characteristic based on product specifications provided by a manufacturer of the rotating machine is stored in the storage unit beforehand; andthe control unit causes the storage unit to store the running load characteristic detected by the detection unit,specifies load loss other than copper loss using the product load characteristic and the running load characteristic, andcauses a display unit to display information based on a fact that the running load characteristic is a characteristic different from usual when load loss other than the copper loss exceeds a predetermined range.
- The rotating machine diagnosis system according to claim 1, wherein load loss other than the copper loss includes any one or more of mechanical loss, floating loss, and iron loss.
- The rotating machine diagnosis system according to claim 1, wherein the different characteristic is a state of the rotating machine specified based on specified load loss other than the copper loss.
- The rotating machine diagnosis system according to claim 1, wherein the predetermined range is specified using load loss other than the copper loss specified in a past.
- The rotating machine diagnosis system according to claim 1, wherein the predetermined range is set to a value of load loss other than the copper loss in a future estimated or specified based on a time-series change of load loss other than the copper loss specified in a past.
- The rotating machine diagnosis system according to claim 2, wherein:the control unit specifies iron loss of the rotating machine; andload loss other than the copper loss includes any one or more of mechanical loss or floating loss specified by excluding the specified iron loss.
- A rotating machine diagnosis system, comprising:a rotating machine having a load connected thereto;a detection unit configured to detect a running load characteristic when the rotating machine is running;a storage unit; anda control unit, wherein:a product load characteristic based on product specifications provided by a manufacturer of the rotating machine is stored in the storage unit beforehand; andthe control unitcauses the storage unit to store the running load characteristic detected by the detection unit,calculates a running power factor indicating a power factor of a running state from the running load characteristic,treats the calculated running power factor as a power factor characteristic with respect to active power based on the product load characteristic to specify a power factor characteristic with respect to the active power and active power corresponding to the power factor characteristic,treats the specified corresponding active power as active power of an efficiency characteristic with respect to active power based on the product load characteristic to specify efficiency of the running load characteristic,specifies an output of the running load characteristic using the specified efficiency of the running load characteristic and the corresponding active power,subtracts copper loss from the running load characteristic from the output to specify load loss other than copper loss, andspecifies the running load characteristic as a characteristic different from usual when load loss other than the copper loss is out of a predetermined range.
- The rotating machine diagnosis system according to claim 7, wherein a state of the rotating machine is specified using a state of specified load loss other than the copper loss.
- The rotating machine diagnosis system according to claim 7, wherein:load loss other than the copper loss includes friction loss of the rotating machine; andthe control unit specifies that the rotating machine is run in a state different from usual based on a change in the friction loss.
- The rotating machine diagnosis system according to claim 7, wherein:the control unit specifies iron loss of the rotating machine; andload loss other than the copper loss includes any one or more of mechanical loss or floating loss specified by excluding the specified iron loss.
- A rotating machine diagnosis system, comprising:a rotating machine having a load connected thereto, a DC/AC converter for controlling the rotating machine being connected to the rotating machine;a detection unit configured to detect a running load characteristic when the rotating machine is running;a storage unit; anda control unit, wherein:a product load characteristic based on product specifications provided by a manufacturer of the rotating machine is stored in the storage unit in advance;when the DC/AC converter performs a control operation to change the rotating machine from a first state to a second state, the control unit specifies a past change time which is a time required to change from the first state to the second state by detecting the running load characteristic by the detection unit in advance, and causes the storage unit to store the specified past change time; andwhen a time required for the rotating machine to change from the first state to the second state, which is different from the past change time, is out of a predetermined range based on the past change time, the control unit specifies that the rotating machine is running in a state different from usual.
Applications Claiming Priority (2)
| Application Number | Priority Date | Filing Date | Title |
|---|---|---|---|
| JP2019198158A JP7312670B2 (en) | 2019-10-31 | 2019-10-31 | Rotating equipment diagnostic system and method. |
| PCT/JP2020/033475 WO2021084906A1 (en) | 2019-10-31 | 2020-09-03 | Rotating machine diagnosis system |
Publications (3)
| Publication Number | Publication Date |
|---|---|
| EP4053532A1 true EP4053532A1 (en) | 2022-09-07 |
| EP4053532A4 EP4053532A4 (en) | 2023-12-06 |
| EP4053532B1 EP4053532B1 (en) | 2025-09-03 |
Family
ID=75712944
Family Applications (1)
| Application Number | Title | Priority Date | Filing Date |
|---|---|---|---|
| EP20880958.2A Active EP4053532B1 (en) | 2019-10-31 | 2020-09-03 | Rotating machine diagnosis system |
Country Status (4)
| Country | Link |
|---|---|
| EP (1) | EP4053532B1 (en) |
| JP (1) | JP7312670B2 (en) |
| DK (1) | DK4053532T3 (en) |
| WO (1) | WO2021084906A1 (en) |
Family Cites Families (9)
| Publication number | Priority date | Publication date | Assignee | Title |
|---|---|---|---|---|
| JPS59200936A (en) * | 1983-04-28 | 1984-11-14 | Nishishiba Denki Kk | Method for measuring torque of dc electric dynamometer |
| JP3967245B2 (en) | 2002-09-30 | 2007-08-29 | 株式会社東芝 | Method for predicting life of rotating machine and manufacturing apparatus having rotating machine |
| US8405339B2 (en) * | 2010-07-01 | 2013-03-26 | Eaton Corporation | System and method for detecting fault in an AC machine |
| JP5724335B2 (en) * | 2010-12-03 | 2015-05-27 | セイコーエプソン株式会社 | Electromechanical device characteristic measuring device, measuring method, and electromechanical device |
| US8803461B2 (en) * | 2010-12-22 | 2014-08-12 | Arvind Kumar Tiwari | System and method for synchronous machine health monitoring |
| JP5884160B2 (en) | 2011-12-07 | 2016-03-15 | Jfeスチール株式会社 | Performance analysis method of motor for hybrid vehicle |
| US9310439B2 (en) * | 2012-09-25 | 2016-04-12 | Emerson Climate Technologies, Inc. | Compressor having a control and diagnostic module |
| JP6564272B2 (en) * | 2014-08-12 | 2019-08-21 | 株式会社神戸製鋼所 | HIL simulation system and HIL simulation method |
| JP6518001B2 (en) * | 2016-03-08 | 2019-05-22 | 株式会社日立製作所 | Diagnostic apparatus and method for rotating machine |
-
2019
- 2019-10-31 JP JP2019198158A patent/JP7312670B2/en active Active
-
2020
- 2020-09-03 DK DK20880958.2T patent/DK4053532T3/en active
- 2020-09-03 EP EP20880958.2A patent/EP4053532B1/en active Active
- 2020-09-03 WO PCT/JP2020/033475 patent/WO2021084906A1/en not_active Ceased
Also Published As
| Publication number | Publication date |
|---|---|
| EP4053532A4 (en) | 2023-12-06 |
| WO2021084906A1 (en) | 2021-05-06 |
| DK4053532T3 (en) | 2025-09-15 |
| EP4053532B1 (en) | 2025-09-03 |
| JP7312670B2 (en) | 2023-07-21 |
| JP2021071384A (en) | 2021-05-06 |
Similar Documents
| Publication | Publication Date | Title |
|---|---|---|
| EP3797304B1 (en) | System and method for monitoring an operating condition of an electrical device when in operation | |
| JP4554501B2 (en) | Motor insulation resistance deterioration detection method, insulation resistance deterioration detection device, and motor drive device | |
| JP4381612B2 (en) | Axis voltage and current monitoring system | |
| EP2778822B1 (en) | A method to implement drive diagnostics and prognostics automatically | |
| US8405339B2 (en) | System and method for detecting fault in an AC machine | |
| US8536839B2 (en) | Device and method for monitoring and/or analyzing rotors of electric machines in operation | |
| JP5875734B2 (en) | Diagnostic device and switching device for electric motor | |
| US6446027B1 (en) | Intelligent analysis system and method for fluid-filled electrical equipment | |
| EP3268760B1 (en) | Generator neutral ground monitoring device utilizing direct current component measurement and analysis | |
| KR102064173B1 (en) | Motor control apparatus for controlling the maximum efficiency point of the motor and diagnosing faults | |
| KR102208830B1 (en) | Apparatus and method for monitoring of motor pump | |
| US9242576B1 (en) | Method and apparatus for controlling an electric machine | |
| CN104685212A (en) | Compressor having a control and diagnostic module | |
| TW201725347A (en) | Monitoring device and monitoring method | |
| JP7422896B2 (en) | Electric motor diagnostic equipment | |
| CN117404348B (en) | Method and system for reducing power consumption of testing machine | |
| CN102035176B (en) | Electrical switching apparatus and protection apparatus | |
| JP7044686B2 (en) | Rotating machine temperature monitoring system and temperature monitoring method | |
| EP4053532B1 (en) | Rotating machine diagnosis system | |
| CN118160217A (en) | Motor diagnostic device, motor diagnostic method, and motor abnormality prediction inference device | |
| KR102064176B1 (en) | Integrated control system for electrical installation systems with maximum efficiency point control and fault diagnosis of motor | |
| JP2016123140A (en) | Composite power generation system | |
| JPH11304864A (en) | Monitoring apparatus and monitoring method for winding equipment | |
| EP4277116A1 (en) | Methods and systems for monitoring of an electrical machine | |
| CN113189416B (en) | Method, device, system, equipment and medium for detecting high-temperature fault of frequency converter |
Legal Events
| Date | Code | Title | Description |
|---|---|---|---|
| STAA | Information on the status of an ep patent application or granted ep patent |
Free format text: STATUS: THE INTERNATIONAL PUBLICATION HAS BEEN MADE |
|
| PUAI | Public reference made under article 153(3) epc to a published international application that has entered the european phase |
Free format text: ORIGINAL CODE: 0009012 |
|
| STAA | Information on the status of an ep patent application or granted ep patent |
Free format text: STATUS: REQUEST FOR EXAMINATION WAS MADE |
|
| 17P | Request for examination filed |
Effective date: 20220531 |
|
| AK | Designated contracting states |
Kind code of ref document: A1 Designated state(s): AL AT BE BG CH CY CZ DE DK EE ES FI FR GB GR HR HU IE IS IT LI LT LU LV MC MK MT NL NO PL PT RO RS SE SI SK SM TR |
|
| DAV | Request for validation of the european patent (deleted) | ||
| DAX | Request for extension of the european patent (deleted) | ||
| REG | Reference to a national code |
Ref country code: DE Ref legal event code: R079 Free format text: PREVIOUS MAIN CLASS: G01M0099000000 Ipc: G01R0031340000 Ref country code: DE Ref legal event code: R079 Ref document number: 602020058240 Country of ref document: DE Free format text: PREVIOUS MAIN CLASS: G01M0099000000 Ipc: G01R0031340000 |
|
| A4 | Supplementary search report drawn up and despatched |
Effective date: 20231103 |
|
| RIC1 | Information provided on ipc code assigned before grant |
Ipc: G01M 13/025 20190101ALI20231027BHEP Ipc: G01M 99/00 20110101ALI20231027BHEP Ipc: G01R 31/34 20200101AFI20231027BHEP |
|
| GRAP | Despatch of communication of intention to grant a patent |
Free format text: ORIGINAL CODE: EPIDOSNIGR1 |
|
| STAA | Information on the status of an ep patent application or granted ep patent |
Free format text: STATUS: GRANT OF PATENT IS INTENDED |
|
| INTG | Intention to grant announced |
Effective date: 20250324 |
|
| GRAS | Grant fee paid |
Free format text: ORIGINAL CODE: EPIDOSNIGR3 |
|
| GRAA | (expected) grant |
Free format text: ORIGINAL CODE: 0009210 |
|
| STAA | Information on the status of an ep patent application or granted ep patent |
Free format text: STATUS: THE PATENT HAS BEEN GRANTED |
|
| RAP3 | Party data changed (applicant data changed or rights of an application transferred) |
Owner name: HITACHI INDUSTRIAL EQUIPMENT SYSTEMS CO., LTD. |
|
| AK | Designated contracting states |
Kind code of ref document: B1 Designated state(s): AL AT BE BG CH CY CZ DE DK EE ES FI FR GB GR HR HU IE IS IT LI LT LU LV MC MK MT NL NO PL PT RO RS SE SI SK SM TR |
|
| REG | Reference to a national code |
Ref country code: DK Ref legal event code: T3 Effective date: 20250912 Ref country code: CH Ref legal event code: EP |
|
| REG | Reference to a national code |
Ref country code: DE Ref legal event code: R096 Ref document number: 602020058240 Country of ref document: DE |
|
| REG | Reference to a national code |
Ref country code: IE Ref legal event code: FG4D |
|
| PGFP | Annual fee paid to national office [announced via postgrant information from national office to epo] |
Ref country code: DE Payment date: 20250930 Year of fee payment: 6 |
|
| REG | Reference to a national code |
Ref country code: CH Ref legal event code: U11 Free format text: ST27 STATUS EVENT CODE: U-0-0-U10-U11 (AS PROVIDED BY THE NATIONAL OFFICE) Effective date: 20251127 |
|
| REG | Reference to a national code |
Ref country code: NL Ref legal event code: MP Effective date: 20250903 |
|
| PGFP | Annual fee paid to national office [announced via postgrant information from national office to epo] |
Ref country code: GB Payment date: 20251030 Year of fee payment: 6 |
|
| PG25 | Lapsed in a contracting state [announced via postgrant information from national office to epo] |
Ref country code: NO Free format text: LAPSE BECAUSE OF FAILURE TO SUBMIT A TRANSLATION OF THE DESCRIPTION OR TO PAY THE FEE WITHIN THE PRESCRIBED TIME-LIMIT Effective date: 20251203 |
|
| REG | Reference to a national code |
Ref country code: LT Ref legal event code: MG9D |
|
| PG25 | Lapsed in a contracting state [announced via postgrant information from national office to epo] |
Ref country code: FI Free format text: LAPSE BECAUSE OF FAILURE TO SUBMIT A TRANSLATION OF THE DESCRIPTION OR TO PAY THE FEE WITHIN THE PRESCRIBED TIME-LIMIT Effective date: 20250903 |
|
| PGFP | Annual fee paid to national office [announced via postgrant information from national office to epo] |
Ref country code: DK Payment date: 20251127 Year of fee payment: 6 |
|
| PG25 | Lapsed in a contracting state [announced via postgrant information from national office to epo] |
Ref country code: HR Free format text: LAPSE BECAUSE OF FAILURE TO SUBMIT A TRANSLATION OF THE DESCRIPTION OR TO PAY THE FEE WITHIN THE PRESCRIBED TIME-LIMIT Effective date: 20250903 |
|
| PGFP | Annual fee paid to national office [announced via postgrant information from national office to epo] |
Ref country code: FR Payment date: 20251030 Year of fee payment: 6 |
|
| PG25 | Lapsed in a contracting state [announced via postgrant information from national office to epo] |
Ref country code: GR Free format text: LAPSE BECAUSE OF FAILURE TO SUBMIT A TRANSLATION OF THE DESCRIPTION OR TO PAY THE FEE WITHIN THE PRESCRIBED TIME-LIMIT Effective date: 20251204 |
|
| PGFP | Annual fee paid to national office [announced via postgrant information from national office to epo] |
Ref country code: CH Payment date: 20251127 Year of fee payment: 6 |
|
| PG25 | Lapsed in a contracting state [announced via postgrant information from national office to epo] |
Ref country code: SE Free format text: LAPSE BECAUSE OF FAILURE TO SUBMIT A TRANSLATION OF THE DESCRIPTION OR TO PAY THE FEE WITHIN THE PRESCRIBED TIME-LIMIT Effective date: 20250903 |
|
| PG25 | Lapsed in a contracting state [announced via postgrant information from national office to epo] |
Ref country code: LV Free format text: LAPSE BECAUSE OF FAILURE TO SUBMIT A TRANSLATION OF THE DESCRIPTION OR TO PAY THE FEE WITHIN THE PRESCRIBED TIME-LIMIT Effective date: 20250903 |
|
| PG25 | Lapsed in a contracting state [announced via postgrant information from national office to epo] |
Ref country code: PL Free format text: LAPSE BECAUSE OF FAILURE TO SUBMIT A TRANSLATION OF THE DESCRIPTION OR TO PAY THE FEE WITHIN THE PRESCRIBED TIME-LIMIT Effective date: 20250903 Ref country code: BG Free format text: LAPSE BECAUSE OF FAILURE TO SUBMIT A TRANSLATION OF THE DESCRIPTION OR TO PAY THE FEE WITHIN THE PRESCRIBED TIME-LIMIT Effective date: 20250903 |
|
| PG25 | Lapsed in a contracting state [announced via postgrant information from national office to epo] |
Ref country code: RS Free format text: LAPSE BECAUSE OF FAILURE TO SUBMIT A TRANSLATION OF THE DESCRIPTION OR TO PAY THE FEE WITHIN THE PRESCRIBED TIME-LIMIT Effective date: 20251203 |
|
| PG25 | Lapsed in a contracting state [announced via postgrant information from national office to epo] |
Ref country code: ES Free format text: LAPSE BECAUSE OF FAILURE TO SUBMIT A TRANSLATION OF THE DESCRIPTION OR TO PAY THE FEE WITHIN THE PRESCRIBED TIME-LIMIT Effective date: 20250903 |
|
| REG | Reference to a national code |
Ref country code: AT Ref legal event code: MK05 Ref document number: 1833646 Country of ref document: AT Kind code of ref document: T Effective date: 20250903 |
|
| PG25 | Lapsed in a contracting state [announced via postgrant information from national office to epo] |
Ref country code: NL Free format text: LAPSE BECAUSE OF FAILURE TO SUBMIT A TRANSLATION OF THE DESCRIPTION OR TO PAY THE FEE WITHIN THE PRESCRIBED TIME-LIMIT Effective date: 20250903 |
|
| PG25 | Lapsed in a contracting state [announced via postgrant information from national office to epo] |
Ref country code: SM Free format text: LAPSE BECAUSE OF FAILURE TO SUBMIT A TRANSLATION OF THE DESCRIPTION OR TO PAY THE FEE WITHIN THE PRESCRIBED TIME-LIMIT Effective date: 20250903 |
|
| PG25 | Lapsed in a contracting state [announced via postgrant information from national office to epo] |
Ref country code: AT Free format text: LAPSE BECAUSE OF FAILURE TO SUBMIT A TRANSLATION OF THE DESCRIPTION OR TO PAY THE FEE WITHIN THE PRESCRIBED TIME-LIMIT Effective date: 20250903 |
|
| PG25 | Lapsed in a contracting state [announced via postgrant information from national office to epo] |
Ref country code: RO Free format text: LAPSE BECAUSE OF FAILURE TO SUBMIT A TRANSLATION OF THE DESCRIPTION OR TO PAY THE FEE WITHIN THE PRESCRIBED TIME-LIMIT Effective date: 20250903 Ref country code: IT Free format text: LAPSE BECAUSE OF FAILURE TO SUBMIT A TRANSLATION OF THE DESCRIPTION OR TO PAY THE FEE WITHIN THE PRESCRIBED TIME-LIMIT Effective date: 20250903 |
|
| PG25 | Lapsed in a contracting state [announced via postgrant information from national office to epo] |
Ref country code: IS Free format text: LAPSE BECAUSE OF FAILURE TO SUBMIT A TRANSLATION OF THE DESCRIPTION OR TO PAY THE FEE WITHIN THE PRESCRIBED TIME-LIMIT Effective date: 20260103 |
|
| PG25 | Lapsed in a contracting state [announced via postgrant information from national office to epo] |
Ref country code: CZ Free format text: LAPSE BECAUSE OF FAILURE TO SUBMIT A TRANSLATION OF THE DESCRIPTION OR TO PAY THE FEE WITHIN THE PRESCRIBED TIME-LIMIT Effective date: 20250903 Ref country code: PT Free format text: LAPSE BECAUSE OF FAILURE TO SUBMIT A TRANSLATION OF THE DESCRIPTION OR TO PAY THE FEE WITHIN THE PRESCRIBED TIME-LIMIT Effective date: 20260105 |
|
| PG25 | Lapsed in a contracting state [announced via postgrant information from national office to epo] |
Ref country code: EE Free format text: LAPSE BECAUSE OF FAILURE TO SUBMIT A TRANSLATION OF THE DESCRIPTION OR TO PAY THE FEE WITHIN THE PRESCRIBED TIME-LIMIT Effective date: 20250903 Ref country code: SK Free format text: LAPSE BECAUSE OF FAILURE TO SUBMIT A TRANSLATION OF THE DESCRIPTION OR TO PAY THE FEE WITHIN THE PRESCRIBED TIME-LIMIT Effective date: 20250903 |