EP4050536A1 - Analysis device, control method, and program - Google Patents
Analysis device, control method, and program Download PDFInfo
- Publication number
- EP4050536A1 EP4050536A1 EP20879389.3A EP20879389A EP4050536A1 EP 4050536 A1 EP4050536 A1 EP 4050536A1 EP 20879389 A EP20879389 A EP 20879389A EP 4050536 A1 EP4050536 A1 EP 4050536A1
- Authority
- EP
- European Patent Office
- Prior art keywords
- explanatory variable
- influence
- explanatory
- degree
- variable
- Prior art date
- Legal status (The legal status is an assumption and is not a legal conclusion. Google has not performed a legal analysis and makes no representation as to the accuracy of the status listed.)
- Pending
Links
Images






Classifications
-
- G—PHYSICS
- G06—COMPUTING OR CALCULATING; COUNTING
- G06F—ELECTRIC DIGITAL DATA PROCESSING
- G06F16/00—Information retrieval; Database structures therefor; File system structures therefor
- G06F16/20—Information retrieval; Database structures therefor; File system structures therefor of structured data, e.g. relational data
- G06F16/26—Visual data mining; Browsing structured data
-
- G—PHYSICS
- G06—COMPUTING OR CALCULATING; COUNTING
- G06Q—INFORMATION AND COMMUNICATION TECHNOLOGY [ICT] SPECIALLY ADAPTED FOR ADMINISTRATIVE, COMMERCIAL, FINANCIAL, MANAGERIAL OR SUPERVISORY PURPOSES; SYSTEMS OR METHODS SPECIALLY ADAPTED FOR ADMINISTRATIVE, COMMERCIAL, FINANCIAL, MANAGERIAL OR SUPERVISORY PURPOSES, NOT OTHERWISE PROVIDED FOR
- G06Q50/00—Information and communication technology [ICT] specially adapted for implementation of business processes of specific business sectors, e.g. utilities or tourism
- G06Q50/04—Manufacturing
-
- G—PHYSICS
- G06—COMPUTING OR CALCULATING; COUNTING
- G06N—COMPUTING ARRANGEMENTS BASED ON SPECIFIC COMPUTATIONAL MODELS
- G06N5/00—Computing arrangements using knowledge-based models
- G06N5/04—Inference or reasoning models
- G06N5/041—Abduction
-
- G—PHYSICS
- G06—COMPUTING OR CALCULATING; COUNTING
- G06N—COMPUTING ARRANGEMENTS BASED ON SPECIFIC COMPUTATIONAL MODELS
- G06N5/00—Computing arrangements using knowledge-based models
- G06N5/02—Knowledge representation; Symbolic representation
- G06N5/022—Knowledge engineering; Knowledge acquisition
-
- G—PHYSICS
- G06—COMPUTING OR CALCULATING; COUNTING
- G06Q—INFORMATION AND COMMUNICATION TECHNOLOGY [ICT] SPECIALLY ADAPTED FOR ADMINISTRATIVE, COMMERCIAL, FINANCIAL, MANAGERIAL OR SUPERVISORY PURPOSES; SYSTEMS OR METHODS SPECIALLY ADAPTED FOR ADMINISTRATIVE, COMMERCIAL, FINANCIAL, MANAGERIAL OR SUPERVISORY PURPOSES, NOT OTHERWISE PROVIDED FOR
- G06Q10/00—Administration; Management
- G06Q10/06—Resources, workflows, human or project management; Enterprise or organisation planning; Enterprise or organisation modelling
-
- Y—GENERAL TAGGING OF NEW TECHNOLOGICAL DEVELOPMENTS; GENERAL TAGGING OF CROSS-SECTIONAL TECHNOLOGIES SPANNING OVER SEVERAL SECTIONS OF THE IPC; TECHNICAL SUBJECTS COVERED BY FORMER USPC CROSS-REFERENCE ART COLLECTIONS [XRACs] AND DIGESTS
- Y02—TECHNOLOGIES OR APPLICATIONS FOR MITIGATION OR ADAPTATION AGAINST CLIMATE CHANGE
- Y02P—CLIMATE CHANGE MITIGATION TECHNOLOGIES IN THE PRODUCTION OR PROCESSING OF GOODS
- Y02P90/00—Enabling technologies with a potential contribution to greenhouse gas [GHG] emissions mitigation
- Y02P90/30—Computing systems specially adapted for manufacturing
Definitions
- the present invention relates to an analysis of data.
- Patent Document 1 discloses a technique for representing relevance between pieces of data by using a cause-and-effect diagram, a pie graph, and the like.
- the cause-and-effect diagram is for visually displaying an effect (result) and a factor thereof, with a trunk extending from the effect and the grouped factors being indicated on branches extending from the trunk.
- Magnitude of influence that a factor gives on an effect may be different for each factor.
- a cause-and-effect diagram in Patent Document 1 does not represent such magnitude of influence of each factor.
- the present invention has been made in view of the above-described problem, and provides a technique capable of easily recognizing both an effect and a factor thereof and influence that each factor gives on the effect.
- An analysis apparatus includes: 1) an acquisition unit that acquires relationship information indicating a degree of influence of each of a plurality of explanatory variables on an objective variable; and 2) a generation unit that generates, by using the relationship information, a cause-and-effect diagram representing a relationship between the objective variable and the explanatory variables.
- the generation unit determines a display aspect for a display relating to each explanatory variable or presence or absence of the display in the cause-and-effect diagram, based on the degree of influence of the explanatory variable.
- a control method is executed by a computer.
- the control method includes: 1) an acquisition step of acquiring relationship information indicating a degree of influence of each of a plurality of explanatory variables on an objective variable; and 2) a generation step of generating, by using the relationship information, a cause-and-effect diagram representing a relationship between the objective variable and the explanatory variables.
- a display aspect for a display relating to each explanatory variable or presence or absence of the display in the cause-and-effect diagram is determined based on the degree of influence of the explanatory variable.
- a program according to the present invention causes a computer to execute the control method according to the present invention.
- a technique capable of easily recognizing both an effect and a factor thereof and influence that each factor gives on the effect is provided.
- each block diagram represents not a configuration on a hardware basis but a configuration on a function basis, except as particularly described.
- Fig. 1 is a diagram for describing an overview of an analysis apparatus 2000 according to the present example embodiment. Note that, Fig. 1 is illustrative for ease of understanding the analysis apparatus 2000, and a function of the analysis apparatus 2000 is not limited to the illustration in Fig. 1 .
- the analysis apparatus 2000 generates a cause-and-effect diagram 10 representing a relationship between an objective variable and a plurality of explanatory variables.
- a cause-and-effect diagram is a diagram visually representing a relationship between an effect and a plurality of factors thereof.
- an effect is associated with the objective variable with the objective variable
- a factor is associated with the explanatory variable.
- the effect may be the objective variable itself, or may be an item relevant to the objective variable.
- the item relevant to the objective variable is, for example, an item focusing on an object or an event common with the objective variable.
- the objective variable represents "presence or absence of a defect in a product” and the effect represents "a defect in a product", and the like.
- the factor may be the explanatory variable itself, or may be an item relevant to the explanatory variable.
- the cause-and-effect diagram 10 includes one trunk 11 being linked with a display (an effect display 12) representing the effect, and the trunk 11 is linked with one or more branches 13. Each branch 13 is linked with a display (a group display 14) representing a group of the factor. Further, one or more subbranches 15 are linked with one branch 13. Then, a display (a factor display 16) representing one factor is linked with each subbranch 15.
- the objective variable is "presence or absence of a defect in a product", and the effect is "a defect in a product”.
- the effect display 12 indicates a "defect”.
- groups of the explanatory variables are a material, an environment, and quality.
- the cause-and-effect diagram 10 indicates a "material", an "environment”, and "quality” as the group displays 14.
- the explanatory variables are an average temperature, a component 1, quality information 1, or the like.
- the cause-and-effect diagram 10 indicates the factor display 16 associated with each of the explanatory variables.
- the analysis apparatus 2000 determines a display aspect for each factor display 16 or presence or absence of a display of each factor display 16, based on a degree of influence (hereinafter, a degree of influence) that an explanatory variable associated with the factor display 16 gives on an objective variable. To do so, the analysis apparatus 2000 acquires relationship information 50 representing a relationship between the objective variable and the explanatory variable.
- the relationship information 50 indicates a degree of influence of each explanatory variable.
- the analysis apparatus 2000 makes a display aspect different between the factor display 16 of an explanatory variable having a relatively high degree of influence and the factor display 16 of an explanatory variable having a relatively low degree of influence. More specifically, the factor display 16 of an explanatory variable having a relatively high degree of influence is more emphasized. In an example in Fig. 1 , the factor display 16 of an explanatory variable having a relatively high degree of influence is framed, and the factor display 16 other than the above is not framed.
- the analysis apparatus 2000 allows the cause-and-effect diagram 10 in such a way as to include only the factor display 16 of an explanatory variable having a relatively high degree of influence, and does not allow the cause-and-effect diagram 10 in such a way as to include the factor display 16 of an explanatory variable other than the above.
- the analysis apparatus 2000 determines a display aspect for the factor display 16, based on a degree of influence. By doing so, difference in a degree of influence of each explanatory variable on an objective variable can be easily recognized in a cause-and-effect diagram visually representing a relationship between an objective variable and an explanatory variable. In other words, by browsing the cause-and-effect diagram 10, both a relationship between an objective variable and an explanatory variable (a relationship between an effect and a factor) and a degree of influence of the explanatory variable can be easily recognized.
- Fig. 2 is a diagram illustrating a function configuration of the analysis apparatus 2000 according to the example embodiment 1.
- the analysis apparatus 2000 includes an acquisition unit 2020 and a generation unit 2040.
- the acquisition unit 2020 acquires the relationship information 5050 for source data 40.
- the generation unit 2040 generates the cause-and-effect diagram 10 by using the relationship information 5050.
- the generation unit 2040 determines a display aspect for each factor display 16 or presence or absence of a display of the factor display 16 in the cause-and-effect diagram 10, based on a degree of influence of an explanatory variable associated with the factor display 16.
- Each of function configuration units of the analysis apparatus 2000 may be achieved by hardware (example: a hard-wired electronic circuit, or the like) achieving each of the function configuration units, or may be achieved by a combination of hardware and software (example: a combination of an electronic circuit and a program controlling the electronic circuit, or the like).
- hardware example: a hard-wired electronic circuit, or the like
- software example: a combination of an electronic circuit and a program controlling the electronic circuit, or the like.
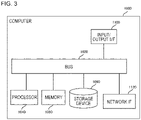
- Fig. 3 is a diagram illustrating a computer 1000 for achieving the analysis apparatus 2000.
- the computer 1000 is any computer.
- the computer 1000 is a stationary computer such as a personal computer (PC) or a server machine.
- the computer 1000 is a portable computer such as a smartphone or a tablet terminal.
- the computer 1000 may be a dedicated computer designed for achieving the analysis apparatus 2000, or may be a general-purpose computer. In a latter case, for example, each of functions of the analysis apparatus 2000 is achieved with the computer 1000 by installing a predetermined application on the computer 1000.
- the above-described application is configured by a program for achieving the function configuration units of the analysis apparatus 2000.
- the computer 1000 includes a bus 1020, a processor 1040, a memory 1060, a storage device 1080, an input/output interface 1100, and a network interface 1120.
- the bus 1020 is a data transmission path through which the processor 1040, the memory 1060, the storage device 1080, the input/output interface 1100, and the network interface 1120 transmit and receive data to and from one another.
- a method of connecting the processor 1040 and the like with one another is not limited to bus connection.
- the processor 1040 is various processors such as a central processing unit (CPU), a graphics processing unit (GPU), and a field-programmable gate array (FPGA).
- the memory 1060 is a main storage apparatus achieved by using a random access memory (RAM) or the like.
- the storage device 1080 is an auxiliary storage apparatus achieved by using a hard disk, a solid state drive (SSD), a memory card, a read only memory (ROM), or the like.
- the input/output interface 1100 is an interface for connecting the computer 1000 to an input/output device.
- an input apparatus such as a keyboard or an output apparatus such as a display apparatus is connected to the input/output interface 1100.
- the network interface 1120 is an interface for connecting the computer 1000 to a communication network.
- the communication network is, for example, a local area network (LAN) or a wide area network (WAN).
- the storage device 1080 stores a program (the program achieving the application described above) for achieving the function configuration units of the analysis apparatus 2000.
- the processor 1040 achieves the function configuration units of the analysis apparatus 2000 by reading the program into the memory 1060 and executing the program.
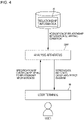
- FIG. 4 is a diagram illustrating a usage environment of the analysis apparatus 2000.
- the analysis apparatus 2000 is connected to a user terminal 60 via a network.
- a user operates the user terminal 60 to transmit, to the analysis apparatus 2000, a request indicating a condition relating to specific relationship information 50 in such a way that the cause-and-effect diagram 10 for the relationship information 50 is provided.
- the analysis apparatus 2000 acquires the relationship information 50 meeting the condition from a storage apparatus, and generates the cause-and-effect diagram 10 by using the acquired relationship information 50. Then, the analysis apparatus 2000 transmits the generated cause-and-effect diagram 10 to the user terminal 60.
- the analysis apparatus 2000 provides, to the user terminal 60, screen data (for example, a web page) including an image of the cause-and-effect diagram 10.
- screen data for example, a web page
- the user terminal 60 displays the received web page with a browser. By doing so, a user can browse the cause-and-effect diagram 10.
- the usage environment of the analysis apparatus 2000 is not limited to the illustration in Fig. 4 .
- the analysis apparatus 2000 may be operated directly by a user, rather than used via the user terminal 60.
- a method of determining the relationship information 50 for which the cause-and-effect diagram 10 is generated is not limited to a method of specifying, by a user, a condition relating to the relationship information 50 (described later in detail).
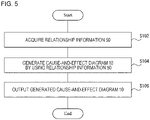
- Fig. 5 is a flowchart illustrating a flow of processing executed by the analysis apparatus 2000 according to the example embodiment 1.
- the acquisition unit 2020 acquires the relationship information 50 (S102).
- the generation unit 2040 generates the cause-and-effect diagram 10 by using the relationship information 50 (SI04).
- the generation unit 2040 outputs the cause-and-effect diagram 10 (S106).
- the relationship information 50 indicates a relationship between an objective variable and a plurality of explanatory variables.
- Fig. 6 is a diagram illustrating a configuration of the relationship information 50.
- the relationship information 50 includes information such as an objective variable 52 and an explanatory variable 54.
- the objective variable 52 indicates identification information (a name and the like) of an objective variable.
- the explanatory variable 54 indicates identification information 56 (a name and the like) and a degree of influence 58 for each explanatory variable.
- a relationship indicated by the relationship information 50 is a relationship estimated, for example, by analyzing data (hereinafter, source data) in which a value of an objective variable is associated with a value of each explanatory variable.
- the estimated relationship is represented by, for example, a linear model (a linear regression model or a linear identification model) for estimating a value of an objective variable from a value of each explanatory variable.
- the relationship information 50 can be regarded also as information representing a linear model.
- a degree of influence of an explanatory variable is represented by a coefficient associated with the explanatory variable (a coefficient by which a value of the explanatory variable is multiplied) in a linear model.
- a coefficient associated with the explanatory variable a coefficient by which a value of the explanatory variable is multiplied
- the relationship information 50 indicates a coefficient associated with an explanatory variable in a learned linear model, as a degree of influence of the explanatory variable.
- each index for example, a component of a material, and an environment such as a temperature
- source data indicate a value (a content of each component, a temperature, and the like) of each index representing a manufacturing condition, and presence or absence of a defect in a product manufactured under the manufacturing condition.
- the analysis apparatus 2000 handles information representing the linear model as the relationship information 50.
- the relationship information 50 indicates, in the objective variable 52, identification information of an objective variable in the generated linear model, indicates, in the identification information 56, identification information of each explanatory variable in the generated linear model, and indicates, in the degree of influence 58, a coefficient associated with each explanatory variable.
- a relationship between an objective variable and an explanatory variable may be represented by a plurality of linear models.
- Examples of a method of representing a relationship between an objective variable and an explanatory variable by a plurality of linear models include a method of generating an estimation model by using heterogeneous mixture learning (see Patent Document 2).
- the heterogeneous mixture learning generates an estimation model being defined by a set of a tree configured by a node representing a conditional branch and a plurality of linear models.
- One linear model is allocated to each leaf of the tree.
- the estimation model first, the tree is traced from a root to a leaf by using data (a combination of values of each explanatory variable) to be estimated. Then, the data to be estimated are input to a linear model associated with the reached leaf, and thereby a value of an objective variable is acquired.
- the relationship information 50 indicates the explanatory variable 54 (a combination of the identification information 56 and the degree of influence 58) for each of the plurality of linear models.
- Fig. 7 is a diagram illustrating the relationship information 50 when a relationship between an objective variable and an explanatory variable is represented by a plurality of linear models.
- the relationship information 50 in Fig. 7 indicates the explanatory variable 54 for each of the plurality of linear models.
- the acquisition unit 2020 acquires the relationship information 50 for use in generation of the cause-and-effect diagram 10 (S102). For example, the acquisition unit 2020 acquires, from among a plurality of pieces of relationship information 50 stored in advance in a storage apparatus, the relationship information 50 meeting a condition specified by a user.
- the relationship information 50 is determined by a condition relating to a source used for a relationship between an objective variable and an explanatory variable indicated by the relationship information 50.
- source data are data relating to manufacture of a product
- the source data can be determined by conditions such as a name of the product, a location of manufacture, and a date and time of manufacture.
- a user gives, to the analysis apparatus 2000, a condition relating to source data from which the cause-and-effect diagram 10 is desired to be generated.
- the analysis apparatus 2000 searches the above-described storage apparatus under the given condition, and thereby acquires the relationship information 50 meeting the condition.
- the analysis apparatus 2000 may generate the cause-and-effect diagram 10 for each of all the pieces of relationship information 50, or may generate the cause-and-effect diagram 10 for only some pieces of relationship information 50.
- the acquisition unit 2020 may provide, to a user, information relating to pieces of relationship information 50 meeting a specified condition and allow the user to select one or more pieces of relationship information 50.
- the analysis apparatus 2000 generates the cause-and-effect diagram 10 for only the relationship information 50 selected by the user.
- the acquisition unit 2020 may receive the relationship information 50 transmitted from another apparatus (for example, the user terminal 60).
- the user terminal 60 transmits the relationship information 50 to the analysis apparatus 2000.
- the acquisition unit 2020 may acquire information necessary for generation of the relationship information 50 and generate the relationship information 50 by using the acquired information.
- a user provides, to the acquisition unit 2020, information indicating source data, identification information of an objective variable, a type of a model, and the like.
- the acquisition unit 2020 generates an estimation model by using the provided information, and generates the relationship information 50 represented by the generated estimation model.
- processing of generating the relationship information 50 by using information provided from a user may be performed by an apparatus other than the analysis apparatus 2000.
- the acquisition unit 2020 acquires the relationship information 50 from an apparatus generating the relationship information 50.
- the generation unit 2040 generates the cause-and-effect diagram 10 by using the relationship information 50.
- information hereinafter, group definition information
- group definition information indicates, for example, identification information (a name or the like) of a group and identification information of each explanatory variable included in the group.
- the group definition information may be included in the relationship information 50, or may be prepared separately from the relationship information 50.
- identification information (a name or the like) of the effect is also prepared as well as identification information of a group. The same applies when a factor is not an explanatory variable itself.
- the generation unit 2040 generates the effect display 12, the group display 14, and the factor display 16 by using identification information of an objective variable, identification information of a group indicated by group definition information, and identification information of an explanatory variable, respectively. Further, the generation unit 2040 determines a positional relationship between the group display 14 and the factor display 16 by using the group definition information. Then, the generation unit 2040 generates the cause-and-effect diagram 10 by connecting each of the generated displays with the trunk 11, the branch 13, and the subbranch 14, based on the determined positional relationship.
- the generation unit 2040 generates the factor display 16, based on a degree of influence of an explanatory variable indicated by the relationship information 50.
- a method of generating the factor display 16, based on a degree of influence will be specifically exemplified.
- the generation unit 2040 determines a display aspect for the factor display 16 of an explanatory variable by comparing a degree of influence of the explanatory variable with a predetermined threshold value. For example, the generation unit 2040 makes a display aspect for the factor display 16 of an explanatory variable having a degree of influence equal to or more than a threshold value different from a display aspect for the factor display 16 of an explanatory variable having a degree of influence less than a threshold value.
- Examples of a method of making a display aspect for the factor display 16 different include a method of making a background (presence or absence of filling, a color, a pattern, and the like) of the factor display 16 different, a method of making a frame of the factor display 16 different (presence or absence of a frame, a color, a shape, a thickness, and the like), and a method of making a size of the factor display 16 different.
- Information determining a display aspect for each of a case in which a degree of influence is equal to or more than a threshold value and a case in which a degree of influence is less than a threshold value is stored in advance in a storage apparatus accessible from the generation unit 2040.
- the information may be modifiable by a user.
- a display aspect for the factor display 16 is determined by a criterion such as "a background of the factor display 16 of an explanatory variable having a degree of influence equal to or more than a threshold value is highlighted more than a background of the factor display 16 other than the above", "a frame of the factor display 16 of an explanatory variable having a degree of influence equal to or more than a threshold value is highlighted more than a frame of the factor display 16 other than the above", or "a size of the factor display 16 of an explanatory variable having a degree of influence equal to or more than a threshold value is made larger than a frame of the factor display 16 other than the above".
- Fig. 8 is a diagram illustrating the cause-and-effect diagram 10 in which a display aspect for the factor display 16 is determined by using a degree of influence of an explanatory variable.
- a display aspect for the factor display 16 is determined by using a degree of influence of an explanatory variable.
- explanatory variables a lowest temperature, a component 2, quality information 2, and quality information 3
- an explanatory variable having a degree of influence equal to or more than a threshold value can be easily discriminated from an explanatory variable other than the above.
- a plurality of threshold values for a degree of influence There may be a plurality of threshold values for a degree of influence.
- a plurality of numerical ranges may be determined for a degree of influence, and a display aspect for the factor display 16 may be made different for each numerical range.
- three numerical ranges R1 to R3, each being "less than Th1", “equal to or more than Th1 and less than Th2", and “equal to or more than Th2”, are provided (where Th1 and Th2 are real numbers satisfying Th1 ⁇ Th2).
- the generation unit 2040 makes a display aspect for the factor display 16 of an explanatory variable having a degree of influence belonging to the numerical range R1, a display aspect for the factor display 16 of an explanatory variable having a degree of influence belonging to the numerical range R2, and a display aspect for the factor display 16 of an explanatory variable having a degree of influence belonging to the numerical range R3 different from one another.
- a degree of highlight is high in order of a display aspect for the factor display 16 of an explanatory variable having a degree of influence belonging to the numerical range R3, a display aspect for the factor display 16 of an explanatory variable having a degree of influence belonging to the numerical range R2, and a display aspect for the factor display 16 of an explanatory variable having a degree of influence belonging to the numerical range R1.
- Information determining association between a numerical range and a display aspect is stored in advance in a storage apparatus accessible from the generation unit 2040.
- the information may be modifiable by a user.
- the generation unit 2040 may determine a display aspect for the factor display 16, based on a rank in order of a degree of influence. For example, the generation unit 2040 determines each explanatory variable that falls within a predetermined rank in descending order of a degree of influence from among all explanatory variables, and makes a display aspect for the factor display 16 of the explanatory variable different from a display aspect for the factor display 16 of other explanatory variables. For example, when a predetermined rank in order is 3, a display aspect for the factor display 16 of each of explanatory variables having largest to third largest degrees of influence is made different from the factor display 16 other than the above.
- the generation unit 2040 may perform ranking of a degree of influence in a group unit of explanatory variables. In other words, the generation unit 2040 determines, for each group, each explanatory variable that falls within a predetermined rank in descending order of a degree of influence in the group, and makes a display aspect for the factor display 16 of the determined explanatory variable different from a display aspect for the factor display 16 of other explanatory variables. For example, when a predetermined rank in order is 2, the generation unit 2040 determines, for each group, an explanatory variable having the largest degree of influence and an explanatory variable having a next largest degree of influence in the group. Then, the generation unit 2040 makes a display aspect for the factor display 16 of the determined explanatory variables different from a display aspect for the factor display 16 of other explanatory variables.
- a degree of influence may be a minus value like a degree of influence of the component 2 in the relationship information 50 in Fig. 6 .
- the generation unit 2040 may use an absolute value of a degree of influence, rather than a value itself of a degree of influence.
- the generation unit 2040 emphasizes the factor display 16 of an explanatory variable having an absolute value of a degree of influence equal to or more than a threshold value.
- the generation unit 2040 ranks an explanatory variable by using an absolute value of a degree of influence, and determines a display aspect for the factor display 16, based on the rank in order. The same applies to a case in which presence or absence of the factor display 16 is determined according to a degree of influence.
- the generation unit 2040 may reflect, on a display aspect for the factor display 16, a sign of an associated explanatory variable. For example, the generation unit 2040 adds an upward arrow to the factor display 16 when a sign of a value of an associated explanatory variable is positive, and adds a downward arrow to the factor display 16 when a sign of a value of an associated explanatory variable is negative. Besides the above, for example, the generation unit 2040 may use, for the factor display 16, different colors, shapes, and the like between when a sign of a value of an associated explanatory variable is positive and when a sign of a value of an associated explanatory variable is negative.
- the generation unit 2040 determines whether to allow the cause-and-effect diagram 10 to include the factor display 16 of an explanatory variable by comparing a degree of influence of the explanatory variable with a threshold value. More specifically, the generation unit 2040 allows the cause-and-effect diagram 10 in such a way as to include the factor display 16 of an explanatory variable having a degree of influence equal to or more than a threshold value, and does not allow the cause-and-effect diagram 10 in such a way as to include the factor display 16 of an explanatory variable having a degree of influence less than a threshold value.
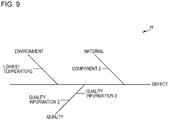
- Fig. 9 is a diagram illustrating the cause-and-effect diagram 10 in which presence or absence of the factor display 16 is determined by using a degree of influence of an explanatory variable.
- explanatory variables having a degree of influence equal to or more than a threshold value are same as an example in Fig. 8 .
- only the factor display 16 of the explanatory variables having a degree of influence equal to or more than a threshold value is included in the cause-and-effect diagram 10.
- the generation unit 2040 may determine presence or absence of the factor display 16 according to a rank in order of a degree of influence. For example, the generation unit 2040 determines each explanatory variable that falls within a predetermined rank in descending order of a degree of influence from among all explanatory variables, and allows the cause-and-effect diagram 10 to include only the factor display 16 of the determined explanatory variable. Besides the above, for example, the generation unit 2040 determines, for each group, each explanatory variable that falls within a predetermined rank in descending order of a degree of influence in the group, and allows the cause-and-effect diagram 10 to include only the factor display 16 of the determined explanatory variable.
- the generation unit 2040 may determine a display aspect for the group display 14 according to whether the factor display 16 is included. By doing so, the group display 14 including the factor display 16 is more emphasized than the group display 14 including no factor display 16.
- An example of a method of making a display aspect for the group display 14 different includes a method of making a background, a frame, and the like different, similarly to a method of making a display aspect for the factor display 16 different.
- the generation unit 2040 may not display the group display 14 including no factor display 16. In other words, the generation unit 2040 determines presence or absence of a display of the group display 14 only the group display 14 including at least one factor display 16.
- the relationship information 50 may indicate information on each of a plurality of linear models.
- the generation unit 2040 may generate the cause-and-effect diagram 10 for each of a plurality of linear models, or may accept specification of a linear model from a user and generate the cause-and-effect diagram 10 for the specified linear model.
- the generation unit 2040 may compute, for each explanatory variable, a statistical value (a sum value, a mean value, a maximum value, a minimum value, or the like) of a degree of influence of the explanatory variable, and generate one cause-and-effect diagram 10 by handling the statistical value as a degree of influence of the explanatory variable. For example, when a sum value of degrees of influence indicated by the relationship information 50 is used for generation of the cause-and-effect diagram 10, the generation unit 2040 uses an equation (1) below.
- n is a total number of linear models indicated by the relationship information 50.
- E i is a value handled as a degree of influence of the explanatory variable i when the cause-and-effect diagram 10 is generated.
- the analysis apparatus 2000 outputs the cause-and-effect diagram 10 generated by the generation unit 2040. There are various specific methods of outputting the cause-and-effect diagram 10. For example, the analysis apparatus 2000 stores image data representing the cause-and-effect diagram 10 in a storage apparatus, displays the image data on a display apparatus connected to the analysis apparatus 2000, or transmits the image data to another apparatus (for example, the user terminal 60).
- Fig. 10 is a diagram for describing an overview of an analysis apparatus 2000 according to an example embodiment 2.
- Fig. 10 is illustrative for ease of understanding the analysis apparatus 2000, and a function of the analysis apparatus 2000 is not limited to the illustration in Fig. 10 .
- the analysis apparatus 2000 according to the example embodiment 2 has a function similar to the analysis apparatus 2000 according to the example embodiment 1, except for the description below.
- the analysis apparatus 2000 outputs, in response to an input being performed of specifying a factor display 16 on an output cause-and-effect diagram 10, a graph 30 for an explanatory variable (hereinafter, also referred to as a specified explanatory variable) associated with the specified factor display 16.
- a specified explanatory variable hereinafter, also referred to as a specified explanatory variable
- the factor display 16 being a "component 2" is selected by a user.
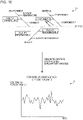
- the analysis apparatus 2000 generates, as the graph 30, a line graph representing data acquired for the component 2 in time-series order.
- source data used for estimating a relationship between an objective variable and an explanatory variable represented by relationship information 50 include a plurality of sets of a value of an objective variable and a value of an explanatory variable.
- the source data indicate time-series data of a set of a value of an objective variable and a value of an explanatory variable.
- the source data relating to manufacture of a product data indicating sets of presence or absence of a defect in a product and a manufacturing condition at each different point in time of manufacture can be handled.
- the graph 30 is for graphically representing a plurality of values indicated by source data for a specified explanatory variable.
- the graph 30 is a graph representing the plurality of pieces of data in time-series order, or a graph representing a result of statistically processing the plurality of pieces of data.
- a user can easily recognize difference in a degree of influence that each explanatory variable gives on an objective variable, by browsing the cause-and-effect diagram 10 generated by the analysis apparatus 2000.
- an explanatory variable having a high degree of influence can be easily recognized by emphasizing the factor display 16 of the explanatory variable having a high degree of influence.
- the analysis apparatus 2000 generates, when an input of specifying the factor display 16 is performed on the cause-and-effect diagram 10, the graph 30 for the specified explanatory variable.
- the analysis apparatus 2000 generates, when an input of specifying the factor display 16 is performed on the cause-and-effect diagram 10, the graph 30 for the specified explanatory variable.
- a function configuration of the analysis apparatus 2000 according to the example embodiment 2 is, for example, represented by Fig. 2 , similarly to the analysis apparatus 2000 according to the example embodiment 1.
- a generation unit 2040 according to the example embodiment 2 generates and outputs, in response to an input being performed of specifying the factor display 16 on the cause-and-effect diagram 10, the graph 30 for a factor associated with the specified factor display 16.
- a hardware configuration of the analysis apparatus 2000 according to the example embodiment 2 is, for example, represented by Fig. 3 , similarly to the analysis apparatus 2000 according to the example embodiment 1.
- a storage device 1080 according to the example embodiment 2 stores a program for achieving a function of the analysis apparatus 2000 according to the example embodiment 2.
- Fig. 11 is a flowchart illustrating a flow of processing executed by the analysis apparatus 2000 according to the example embodiment 2.
- An acquisition unit 2020 acquires identification information of a specified explanatory variable (S202).
- the generation unit 2040 acquires, for the specified explanatory variable, a plurality of pieces of data indicated by source data (S204).
- the generation unit 2040 generates the graph 30 by using the acquired plurality of pieces of data (S206).
- the generation unit 2040 outputs the generated graph 30 (S208).
- the acquisition unit 2020 acquires identification information of a specified explanatory variable in the cause-and-effect diagram 10 (S202).
- S202 cause-and-effect diagram 10
- various types of existing techniques can be used for a technique for acquiring identification information of the specified part.
- the generation unit 2040 acquires, for a specified explanatory variable, a plurality of pieces of data indicated by source data.
- the source data are stored in advance in a storage apparatus accessible from the generation unit 2040.
- the generation unit 2040 acquires a plurality of pieces of data for a specified explanatory variable by accessing the storage apparatus.
- the source data indicate time-series data including a set of a value of an objective variable and a value of an explanatory variable.
- the generation unit 2040 acquires time-series data representing a temporal change of a value of a specified explanatory variable.
- the source data only need to include a plurality of sets of a value of an objective variable and a value of an explanatory variable, and the sets may not be data representing a temporal change.
- the generation unit 2040 generates the graph 30 by using a plurality of pieces of data acquired for a specified explanatory variable (S206).
- the graph 30 can be any type that can be generated by using a plurality of pieces of data.
- acquired data are time-series data as described above, for example, the graph 30 is a line graph or the like representing a temporal change of a value of a specified explanatory variable.
- the graph 30 is a histogram or the like representing a result of statistically processing a plurality of values of an explanatory variable.
- the generation unit 2040 may generate a plurality of graphs 30 for a specified explanatory variable. For example, the generation unit 2040 generates a graph representing a time-series change of acquired data and a graph representing a result of statistically processing the data. Besides the above, for example, the generation unit 2040 statistically processes acquired data by using each of a plurality of methods, and generates the graph 30 for each of results.
- what type of graph generated as the graph 30 may be fixedly determined in advance, or may be specifiable by a user.
- the generation unit 2040 outputs the generated graph 30.
- a method of outputting the graph 30 is similar to a method of outputting the cause-and-effect diagram 10.
- the generation unit 2040 may output the cause-and-effect diagram 10 together with the graph 30.
- the generation unit 2040 generates and outputs screen data (for example, a web page) including both the cause-and-effect diagram 10 and the graph 30.
- Fig. 12 is a diagram illustrating a screen including both the cause-and-effect diagram 10 and the graph 30. Note that, in Fig. 12 , two graphs being a graph (30-1) representing data in time-series order and a histogram (30-2) are included as the graph 30.
- the graph 30 is not limited to a line graph or a histogram.
- a box plot may be generated by accumulating for each particular interval, or a bar graph representing the number of samples in a similar interval may be displayed.
- the intervals for accumulating may be set in advance, may be selected by a user from among a plurality of types of intervals (monthly, weekly, daily, and hourly) prepared in advance, or any value may be specified by a user.
- an entire period included in the graph 30 may be from a first point in time to a last point in time included in source data, or any period may be specified by a user.
- a calendar is displayed on a screen and an input of specifying both a first point in time and a last point in time can be performed on the calendar.
- the generation unit 2040 may acquire, from source data, data on an objective variable in addition to a specified explanatory variable, and generate the graph 30 by using the specified explanatory variable and data on the objective variable. By doing so, a relationship with the objective variable can be directly recognized regarding the specified explanatory variable.
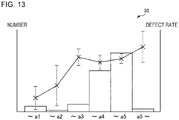
- Fig. 13 is a diagram illustrating the graph 30 indicating data on a specified explanatory variable and an objective variable.
- the graph 30 is a graph including a histogram of values of a specified explanatory variable on which a broken line representing data on an objective variable is superimposed. More specifically, the broken line indicates, for each grade indicated on a horizontal axis of the histogram, a defect rate in products that fall under the grade (a rate of the number of defective products to the total number of manufactured products that fall under the grade). Note that, in Fig. 13 , a confidence interval is displayed for a defect rate of each grade.
- data on an item relevant to the objective variable may be added to the graph 30.
- examples include a case of allowing the graph 30 to include data on a defect rate when an objective variable is presence or absence of a defect, and the like.
- a user may be able to specify a plurality of factor displays 16 included in the cause-and-effect diagram 10.
- the generation unit 2040 generates the graph 30 for each of a plurality of specified explanatory variables.
- the generation unit 2040 may generate the graph 30 individually for each piece of data acquired for each of the plurality of specified explanatory variables, or may generate one graph 30 for these pieces of data.
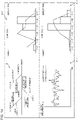
- Fig. 14 is a diagram illustrating the graph 30 when a plurality of factor displays 16 are specified.
- two explanatory variables being a component 1 and the component 2 are specified.
- a graph 30-1 indicates data on the component 1 and the component 2 in time-series order.
- a graph 30-2 and a graph 30-3 indicate a histogram for the component 1 and a histogram for the component 2, respectively.
Landscapes
- Engineering & Computer Science (AREA)
- Theoretical Computer Science (AREA)
- Physics & Mathematics (AREA)
- General Physics & Mathematics (AREA)
- Business, Economics & Management (AREA)
- General Engineering & Computer Science (AREA)
- Data Mining & Analysis (AREA)
- Economics (AREA)
- Human Resources & Organizations (AREA)
- Strategic Management (AREA)
- Evolutionary Computation (AREA)
- Computing Systems (AREA)
- Computational Linguistics (AREA)
- Artificial Intelligence (AREA)
- Software Systems (AREA)
- Mathematical Physics (AREA)
- Databases & Information Systems (AREA)
- Entrepreneurship & Innovation (AREA)
- Tourism & Hospitality (AREA)
- Marketing (AREA)
- General Business, Economics & Management (AREA)
- General Health & Medical Sciences (AREA)
- Primary Health Care (AREA)
- Development Economics (AREA)
- Educational Administration (AREA)
- Health & Medical Sciences (AREA)
- Game Theory and Decision Science (AREA)
- Operations Research (AREA)
- Quality & Reliability (AREA)
- Manufacturing & Machinery (AREA)
- Information Retrieval, Db Structures And Fs Structures Therefor (AREA)
- Management, Administration, Business Operations System, And Electronic Commerce (AREA)
- User Interface Of Digital Computer (AREA)
Abstract
Description
- The present invention relates to an analysis of data.
- A technique for recognizing a relationship between a plurality of pieces of data is developed. For example,
Patent Document 1 discloses a technique for representing relevance between pieces of data by using a cause-and-effect diagram, a pie graph, and the like. Herein, the cause-and-effect diagram is for visually displaying an effect (result) and a factor thereof, with a trunk extending from the effect and the grouped factors being indicated on branches extending from the trunk. -
- [Patent Document 1]
Japanese Patent Application Publication No. 2019-36061 - [Patent Document 2]
U.S. Patent Application Publication No. 2014/0222741A1 Specification - Magnitude of influence that a factor gives on an effect may be different for each factor. However, a cause-and-effect diagram in
Patent Document 1 does not represent such magnitude of influence of each factor. - The present invention has been made in view of the above-described problem, and provides a technique capable of easily recognizing both an effect and a factor thereof and influence that each factor gives on the effect.
- An analysis apparatus according to the present invention includes: 1) an acquisition unit that acquires relationship information indicating a degree of influence of each of a plurality of explanatory variables on an objective variable; and 2) a generation unit that generates, by using the relationship information, a cause-and-effect diagram representing a relationship between the objective variable and the explanatory variables.
- The generation unit determines a display aspect for a display relating to each explanatory variable or presence or absence of the display in the cause-and-effect diagram, based on the degree of influence of the explanatory variable.
- A control method according to the present invention is executed by a computer. The control method includes: 1) an acquisition step of acquiring relationship information indicating a degree of influence of each of a plurality of explanatory variables on an objective variable; and 2) a generation step of generating, by using the relationship information, a cause-and-effect diagram representing a relationship between the objective variable and the explanatory variables.
- In the generation step, a display aspect for a display relating to each explanatory variable or presence or absence of the display in the cause-and-effect diagram is determined based on the degree of influence of the explanatory variable.
- A program according to the present invention causes a computer to execute the control method according to the present invention.
- A technique capable of easily recognizing both an effect and a factor thereof and influence that each factor gives on the effect is provided.
-
- [
Fig. 1] Fig. 1 is a diagram for describing an overview of an analysis apparatus according to an example embodiment. - [
Fig. 2] Fig. 2 is a diagram illustrating a function configuration of an analysis apparatus according to theexample embodiment 1. - [
Fig. 3] Fig. 3 is a diagram illustrating a computer for achieving the analysis apparatus. - [
Fig. 4] Fig. 4 is a diagram illustrating a usage environment of the analysis apparatus. - [
Fig. 5] Fig. 5 is a flowchart illustrating a flow of processing executed by the analysis apparatus according to theexample embodiment 1. - [
Fig. 6] Fig. 6 is a diagram illustrating a configuration of relationship information. - [
Fig. 7] Fig. 7 is a diagramillustrating relationship information 50 when a relationship between an objective variable and an explanatory variable is represented by a plurality of linear models. - [
Fig. 8] Fig. 8 is a diagram illustrating a cause-and-effect diagram 10 in which a display aspect for a factor display is determined by using a degree of influence of an explanatory variable. - [
Fig. 9] Fig. 9 is a diagram illustrating the cause-and-effect diagram 10 in which presence or absence of a factor display is determined by using a degree of influence of an explanatory variable. - [
Fig. 10] Fig. 10 is a diagram for describing an overview of an analysis apparatus according to anexample embodiment 2. - [
Fig. 11] Fig. 11 is a flowchart illustrating a flow of processing executed by the analysis apparatus according to theexample embodiment 2. - [
Fig. 12] Fig. 12 is a diagram illustrating a screen including both a cause-and-effect diagram and a graph. - [
Fig. 13] Fig. 13 is a diagram illustrating a graph indicating data on a specified explanatory variable and an objective variable. - [
Fig. 14] Fig. 14 is a diagram illustrating a graph when a plurality of factor displays are specified. - Hereinafter, example embodiments of the present invention will be described by using the drawings. Note that, a similar component is assigned with a similar reference sign throughout all the drawings, and description therefor will be omitted as appropriate. Further, in each block diagram, each block represents not a configuration on a hardware basis but a configuration on a function basis, except as particularly described.
-
Fig. 1 is a diagram for describing an overview of ananalysis apparatus 2000 according to the present example embodiment. Note that,Fig. 1 is illustrative for ease of understanding theanalysis apparatus 2000, and a function of theanalysis apparatus 2000 is not limited to the illustration inFig. 1 . - The
analysis apparatus 2000 generates a cause-and-effect diagram 10 representing a relationship between an objective variable and a plurality of explanatory variables. Herein, a cause-and-effect diagram is a diagram visually representing a relationship between an effect and a plurality of factors thereof. In the cause-and-effect diagram 10, an effect is associated with the objective variable with the objective variable, and a factor is associated with the explanatory variable. Herein, the effect may be the objective variable itself, or may be an item relevant to the objective variable. The item relevant to the objective variable is, for example, an item focusing on an object or an event common with the objective variable. For example, there is a case in which the objective variable represents "presence or absence of a defect in a product" and the effect represents "a defect in a product", and the like. Similarly, the factor may be the explanatory variable itself, or may be an item relevant to the explanatory variable. - The cause-and-effect diagram 10 includes one
trunk 11 being linked with a display (an effect display 12) representing the effect, and thetrunk 11 is linked with one ormore branches 13. Eachbranch 13 is linked with a display (a group display 14) representing a group of the factor. Further, one or more subbranches 15 are linked with onebranch 13. Then, a display (a factor display 16) representing one factor is linked with each subbranch 15. - In an example in
Fig. 1 , the objective variable is "presence or absence of a defect in a product", and the effect is "a defect in a product". Herein, theeffect display 12 indicates a "defect". Further, groups of the explanatory variables are a material, an environment, and quality. Herein, the cause-and-effect diagram 10 indicates a "material", an "environment", and "quality" as the group displays 14. Further, the explanatory variables are an average temperature, acomponent 1,quality information 1, or the like. Herein, the cause-and-effect diagram 10 indicates thefactor display 16 associated with each of the explanatory variables. - The
analysis apparatus 2000 determines a display aspect for each factor display 16 or presence or absence of a display of eachfactor display 16, based on a degree of influence (hereinafter, a degree of influence) that an explanatory variable associated with thefactor display 16 gives on an objective variable. To do so, theanalysis apparatus 2000 acquiresrelationship information 50 representing a relationship between the objective variable and the explanatory variable. Therelationship information 50 indicates a degree of influence of each explanatory variable. - For example, the
analysis apparatus 2000 makes a display aspect different between thefactor display 16 of an explanatory variable having a relatively high degree of influence and thefactor display 16 of an explanatory variable having a relatively low degree of influence. More specifically, thefactor display 16 of an explanatory variable having a relatively high degree of influence is more emphasized. In an example inFig. 1 , thefactor display 16 of an explanatory variable having a relatively high degree of influence is framed, and thefactor display 16 other than the above is not framed. Besides the above, for example, theanalysis apparatus 2000 allows the cause-and-effect diagram 10 in such a way as to include only thefactor display 16 of an explanatory variable having a relatively high degree of influence, and does not allow the cause-and-effect diagram 10 in such a way as to include thefactor display 16 of an explanatory variable other than the above. - As one method of visually representing a relationship between an objective variable and an explanatory variable, a method of using a cause-and-effect diagram is conceivable. However, in an existing cause-and-effect diagram, magnitude of influence that each explanatory variable has on an objective variable cannot be recognized.
- In view of the above, the
analysis apparatus 2000 determines a display aspect for thefactor display 16, based on a degree of influence. By doing so, difference in a degree of influence of each explanatory variable on an objective variable can be easily recognized in a cause-and-effect diagram visually representing a relationship between an objective variable and an explanatory variable. In other words, by browsing the cause-and-effect diagram 10, both a relationship between an objective variable and an explanatory variable (a relationship between an effect and a factor) and a degree of influence of the explanatory variable can be easily recognized. - Hereinafter, the present example embodiment will be described in further detail.
-
Fig. 2 is a diagram illustrating a function configuration of theanalysis apparatus 2000 according to theexample embodiment 1. Theanalysis apparatus 2000 includes anacquisition unit 2020 and ageneration unit 2040. Theacquisition unit 2020 acquires the relationship information 5050 for source data 40. Thegeneration unit 2040 generates the cause-and-effect diagram 10 by using the relationship information 5050. Herein, thegeneration unit 2040 determines a display aspect for eachfactor display 16 or presence or absence of a display of thefactor display 16 in the cause-and-effect diagram 10, based on a degree of influence of an explanatory variable associated with thefactor display 16. - Each of function configuration units of the
analysis apparatus 2000 may be achieved by hardware (example: a hard-wired electronic circuit, or the like) achieving each of the function configuration units, or may be achieved by a combination of hardware and software (example: a combination of an electronic circuit and a program controlling the electronic circuit, or the like). Hereinafter, a case will be further described in which each of the function configuration units of theanalysis apparatus 2000 is achieved by a combination of hardware and software. -
Fig. 3 is a diagram illustrating acomputer 1000 for achieving theanalysis apparatus 2000. Thecomputer 1000 is any computer. For example, thecomputer 1000 is a stationary computer such as a personal computer (PC) or a server machine. Besides the above, for example, thecomputer 1000 is a portable computer such as a smartphone or a tablet terminal. - The
computer 1000 may be a dedicated computer designed for achieving theanalysis apparatus 2000, or may be a general-purpose computer. In a latter case, for example, each of functions of theanalysis apparatus 2000 is achieved with thecomputer 1000 by installing a predetermined application on thecomputer 1000. The above-described application is configured by a program for achieving the function configuration units of theanalysis apparatus 2000. - The
computer 1000 includes abus 1020, aprocessor 1040, amemory 1060, astorage device 1080, an input/output interface 1100, and anetwork interface 1120. Thebus 1020 is a data transmission path through which theprocessor 1040, thememory 1060, thestorage device 1080, the input/output interface 1100, and thenetwork interface 1120 transmit and receive data to and from one another. However, a method of connecting theprocessor 1040 and the like with one another is not limited to bus connection. - The
processor 1040 is various processors such as a central processing unit (CPU), a graphics processing unit (GPU), and a field-programmable gate array (FPGA). Thememory 1060 is a main storage apparatus achieved by using a random access memory (RAM) or the like. Thestorage device 1080 is an auxiliary storage apparatus achieved by using a hard disk, a solid state drive (SSD), a memory card, a read only memory (ROM), or the like. - The input/
output interface 1100 is an interface for connecting thecomputer 1000 to an input/output device. For example, an input apparatus such as a keyboard or an output apparatus such as a display apparatus is connected to the input/output interface 1100. - The
network interface 1120 is an interface for connecting thecomputer 1000 to a communication network. The communication network is, for example, a local area network (LAN) or a wide area network (WAN). - The
storage device 1080 stores a program (the program achieving the application described above) for achieving the function configuration units of theanalysis apparatus 2000. Theprocessor 1040 achieves the function configuration units of theanalysis apparatus 2000 by reading the program into thememory 1060 and executing the program. - One example of a usage environment of the
analysis apparatus 2000 will be described for easy understanding of theanalysis apparatus 2000.Fig. 4 is a diagram illustrating a usage environment of theanalysis apparatus 2000. - In
Fig. 4 , theanalysis apparatus 2000 is connected to auser terminal 60 via a network. A user operates theuser terminal 60 to transmit, to theanalysis apparatus 2000, a request indicating a condition relating tospecific relationship information 50 in such a way that the cause-and-effect diagram 10 for therelationship information 50 is provided. In response to the request, theanalysis apparatus 2000 acquires therelationship information 50 meeting the condition from a storage apparatus, and generates the cause-and-effect diagram 10 by using the acquiredrelationship information 50. Then, theanalysis apparatus 2000 transmits the generated cause-and-effect diagram 10 to theuser terminal 60. - For example, the
analysis apparatus 2000 provides, to theuser terminal 60, screen data (for example, a web page) including an image of the cause-and-effect diagram 10. In this case, theuser terminal 60 displays the received web page with a browser. By doing so, a user can browse the cause-and-effect diagram 10. - The usage environment of the
analysis apparatus 2000 is not limited to the illustration inFig. 4 . For example, theanalysis apparatus 2000 may be operated directly by a user, rather than used via theuser terminal 60. Further, a method of determining therelationship information 50 for which the cause-and-effect diagram 10 is generated is not limited to a method of specifying, by a user, a condition relating to the relationship information 50 (described later in detail). -
Fig. 5 is a flowchart illustrating a flow of processing executed by theanalysis apparatus 2000 according to theexample embodiment 1. Theacquisition unit 2020 acquires the relationship information 50 (S102). Thegeneration unit 2040 generates the cause-and-effect diagram 10 by using the relationship information 50 (SI04). Thegeneration unit 2040 outputs the cause-and-effect diagram 10 (S106). - The
relationship information 50 indicates a relationship between an objective variable and a plurality of explanatory variables.Fig. 6 is a diagram illustrating a configuration of therelationship information 50. InFig. 6 , therelationship information 50 includes information such as an objective variable 52 and anexplanatory variable 54. The objective variable 52 indicates identification information (a name and the like) of an objective variable. The explanatory variable 54 indicates identification information 56 (a name and the like) and a degree ofinfluence 58 for each explanatory variable. - A relationship indicated by the
relationship information 50 is a relationship estimated, for example, by analyzing data (hereinafter, source data) in which a value of an objective variable is associated with a value of each explanatory variable. The estimated relationship is represented by, for example, a linear model (a linear regression model or a linear identification model) for estimating a value of an objective variable from a value of each explanatory variable. In this case, therelationship information 50 can be regarded also as information representing a linear model. - For example, a degree of influence of an explanatory variable is represented by a coefficient associated with the explanatory variable (a coefficient by which a value of the explanatory variable is multiplied) in a linear model. This is because an explanatory variable having a larger associated coefficient in a linear model gives more influence on a value of an objective variable acquired by using the model. In view of this, for example, the
relationship information 50 indicates a coefficient associated with an explanatory variable in a learned linear model, as a degree of influence of the explanatory variable. - For example, it is assumed that presence or absence of a defect in a product is handled as an objective variable and each index (for example, a component of a material, and an environment such as a temperature) representing a manufacturing condition for a product is handled as an explanatory variable. In this case, source data indicate a value (a content of each component, a temperature, and the like) of each index representing a manufacturing condition, and presence or absence of a defect in a product manufactured under the manufacturing condition. When a linear model is learned by using the source data, a learned linear model representing a relationship between presence or absence of a defect and a manufacturing condition can be acquired.
- For example, the
analysis apparatus 2000 handles information representing the linear model as therelationship information 50. In this case, therelationship information 50 indicates, in the objective variable 52, identification information of an objective variable in the generated linear model, indicates, in theidentification information 56, identification information of each explanatory variable in the generated linear model, and indicates, in the degree ofinfluence 58, a coefficient associated with each explanatory variable. - A relationship between an objective variable and an explanatory variable may be represented by a plurality of linear models. Examples of a method of representing a relationship between an objective variable and an explanatory variable by a plurality of linear models include a method of generating an estimation model by using heterogeneous mixture learning (see Patent Document 2). The heterogeneous mixture learning generates an estimation model being defined by a set of a tree configured by a node representing a conditional branch and a plurality of linear models. One linear model is allocated to each leaf of the tree. Upon use of the estimation model, first, the tree is traced from a root to a leaf by using data (a combination of values of each explanatory variable) to be estimated. Then, the data to be estimated are input to a linear model associated with the reached leaf, and thereby a value of an objective variable is acquired.
- When a relationship between an objective variable and an explanatory variable is represented by a plurality of linear models, for example, the
relationship information 50 indicates the explanatory variable 54 (a combination of theidentification information 56 and the degree of influence 58) for each of the plurality of linear models.Fig. 7 is a diagram illustrating therelationship information 50 when a relationship between an objective variable and an explanatory variable is represented by a plurality of linear models. Therelationship information 50 inFig. 7 indicates the explanatory variable 54 for each of the plurality of linear models. - The
acquisition unit 2020 acquires therelationship information 50 for use in generation of the cause-and-effect diagram 10 (S102). For example, theacquisition unit 2020 acquires, from among a plurality of pieces ofrelationship information 50 stored in advance in a storage apparatus, therelationship information 50 meeting a condition specified by a user. - For example, the
relationship information 50 is determined by a condition relating to a source used for a relationship between an objective variable and an explanatory variable indicated by therelationship information 50. For example, when source data are data relating to manufacture of a product, the source data can be determined by conditions such as a name of the product, a location of manufacture, and a date and time of manufacture. - In view of the above, a user gives, to the
analysis apparatus 2000, a condition relating to source data from which the cause-and-effect diagram 10 is desired to be generated. Theanalysis apparatus 2000 searches the above-described storage apparatus under the given condition, and thereby acquires therelationship information 50 meeting the condition. - Note that, when there are a plurality of pieces of
relationship information 50 meeting a condition specified by a user, theanalysis apparatus 2000 may generate the cause-and-effect diagram 10 for each of all the pieces ofrelationship information 50, or may generate the cause-and-effect diagram 10 for only some pieces ofrelationship information 50. In a latter case, theacquisition unit 2020 may provide, to a user, information relating to pieces ofrelationship information 50 meeting a specified condition and allow the user to select one or more pieces ofrelationship information 50. In this case, theanalysis apparatus 2000 generates the cause-and-effect diagram 10 for only therelationship information 50 selected by the user. - Besides the above, for example, the
acquisition unit 2020 may receive therelationship information 50 transmitted from another apparatus (for example, the user terminal 60). For example, in this case, theuser terminal 60 transmits therelationship information 50 to theanalysis apparatus 2000. - Besides the above, for example, the
acquisition unit 2020 may acquire information necessary for generation of therelationship information 50 and generate therelationship information 50 by using the acquired information. For example, a user provides, to theacquisition unit 2020, information indicating source data, identification information of an objective variable, a type of a model, and the like. Theacquisition unit 2020 generates an estimation model by using the provided information, and generates therelationship information 50 represented by the generated estimation model. - Note that, processing of generating the
relationship information 50 by using information provided from a user may be performed by an apparatus other than theanalysis apparatus 2000. In this case, theacquisition unit 2020 acquires therelationship information 50 from an apparatus generating therelationship information 50. - The
generation unit 2040 generates the cause-and-effect diagram 10 by using therelationship information 50. Herein, for generation of the cause-and-effect diagram 10, information (hereinafter, group definition information) for defining a group of explanatory variables is necessary in addition to identification information of an objective variable and an explanatory variable. The group definition information indicates, for example, identification information (a name or the like) of a group and identification information of each explanatory variable included in the group. The group definition information may be included in therelationship information 50, or may be prepared separately from therelationship information 50. Note that, when an effect is not an objective variable itself (for example, when an objective variable is "presence or absence of a defect", whereas an effect is a "defect"), identification information (a name or the like) of the effect is also prepared as well as identification information of a group. The same applies when a factor is not an explanatory variable itself. - For example, the
generation unit 2040 generates theeffect display 12, thegroup display 14, and thefactor display 16 by using identification information of an objective variable, identification information of a group indicated by group definition information, and identification information of an explanatory variable, respectively. Further, thegeneration unit 2040 determines a positional relationship between thegroup display 14 and thefactor display 16 by using the group definition information. Then, thegeneration unit 2040 generates the cause-and-effect diagram 10 by connecting each of the generated displays with thetrunk 11, thebranch 13, and thesubbranch 14, based on the determined positional relationship. - However, the
generation unit 2040 generates thefactor display 16, based on a degree of influence of an explanatory variable indicated by therelationship information 50. Hereinafter, a method of generating thefactor display 16, based on a degree of influence, will be specifically exemplified. - For example, the
generation unit 2040 determines a display aspect for thefactor display 16 of an explanatory variable by comparing a degree of influence of the explanatory variable with a predetermined threshold value. For example, thegeneration unit 2040 makes a display aspect for thefactor display 16 of an explanatory variable having a degree of influence equal to or more than a threshold value different from a display aspect for thefactor display 16 of an explanatory variable having a degree of influence less than a threshold value. Examples of a method of making a display aspect for thefactor display 16 different include a method of making a background (presence or absence of filling, a color, a pattern, and the like) of thefactor display 16 different, a method of making a frame of thefactor display 16 different (presence or absence of a frame, a color, a shape, a thickness, and the like), and a method of making a size of thefactor display 16 different. - Information determining a display aspect for each of a case in which a degree of influence is equal to or more than a threshold value and a case in which a degree of influence is less than a threshold value is stored in advance in a storage apparatus accessible from the
generation unit 2040. However, the information may be modifiable by a user. - Herein, it is preferred that the higher a degree of influence of an explanatory variable, the more highlighted (emphasized) the
factor display 16 of the explanatory variable. In view of this, for example, it is preferred that a display aspect for thefactor display 16 is determined by a criterion such as "a background of thefactor display 16 of an explanatory variable having a degree of influence equal to or more than a threshold value is highlighted more than a background of thefactor display 16 other than the above", "a frame of thefactor display 16 of an explanatory variable having a degree of influence equal to or more than a threshold value is highlighted more than a frame of thefactor display 16 other than the above", or "a size of thefactor display 16 of an explanatory variable having a degree of influence equal to or more than a threshold value is made larger than a frame of thefactor display 16 other than the above". -
Fig. 8 is a diagram illustrating the cause-and-effect diagram 10 in which a display aspect for thefactor display 16 is determined by using a degree of influence of an explanatory variable. InFig. 8 , only thefactor display 16 of explanatory variables (a lowest temperature, acomponent 2,quality information 2, and quality information 3) having a degree of influence equal to or more than a threshold value is framed. Thus, an explanatory variable having a degree of influence equal to or more than a threshold value can be easily discriminated from an explanatory variable other than the above. - There may be a plurality of threshold values for a degree of influence. In other words, a plurality of numerical ranges may be determined for a degree of influence, and a display aspect for the
factor display 16 may be made different for each numerical range. For example, three numerical ranges R1 to R3, each being "less than Th1", "equal to or more than Th1 and less than Th2", and "equal to or more than Th2", are provided (where Th1 and Th2 are real numbers satisfying Th1<Th2). In this case, thegeneration unit 2040 makes a display aspect for thefactor display 16 of an explanatory variable having a degree of influence belonging to the numerical range R1, a display aspect for thefactor display 16 of an explanatory variable having a degree of influence belonging to the numerical range R2, and a display aspect for thefactor display 16 of an explanatory variable having a degree of influence belonging to the numerical range R3 different from one another. For example, when the higher a degree of influence, the more emphasized thefactor display 16, a degree of highlight is high in order of a display aspect for thefactor display 16 of an explanatory variable having a degree of influence belonging to the numerical range R3, a display aspect for thefactor display 16 of an explanatory variable having a degree of influence belonging to the numerical range R2, and a display aspect for thefactor display 16 of an explanatory variable having a degree of influence belonging to the numerical range R1. - Information determining association between a numerical range and a display aspect is stored in advance in a storage apparatus accessible from the
generation unit 2040. However, the information may be modifiable by a user. - The
generation unit 2040 may determine a display aspect for thefactor display 16, based on a rank in order of a degree of influence. For example, thegeneration unit 2040 determines each explanatory variable that falls within a predetermined rank in descending order of a degree of influence from among all explanatory variables, and makes a display aspect for thefactor display 16 of the explanatory variable different from a display aspect for thefactor display 16 of other explanatory variables. For example, when a predetermined rank in order is 3, a display aspect for thefactor display 16 of each of explanatory variables having largest to third largest degrees of influence is made different from thefactor display 16 other than the above. - The
generation unit 2040 may perform ranking of a degree of influence in a group unit of explanatory variables. In other words, thegeneration unit 2040 determines, for each group, each explanatory variable that falls within a predetermined rank in descending order of a degree of influence in the group, and makes a display aspect for thefactor display 16 of the determined explanatory variable different from a display aspect for thefactor display 16 of other explanatory variables. For example, when a predetermined rank in order is 2, thegeneration unit 2040 determines, for each group, an explanatory variable having the largest degree of influence and an explanatory variable having a next largest degree of influence in the group. Then, thegeneration unit 2040 makes a display aspect for thefactor display 16 of the determined explanatory variables different from a display aspect for thefactor display 16 of other explanatory variables. - Note that, a degree of influence may be a minus value like a degree of influence of the
component 2 in therelationship information 50 inFig. 6 . When a degree of influence can take a minus value like this, thegeneration unit 2040 may use an absolute value of a degree of influence, rather than a value itself of a degree of influence. For example, thegeneration unit 2040 emphasizes thefactor display 16 of an explanatory variable having an absolute value of a degree of influence equal to or more than a threshold value. Besides the above, for example, thegeneration unit 2040 ranks an explanatory variable by using an absolute value of a degree of influence, and determines a display aspect for thefactor display 16, based on the rank in order. The same applies to a case in which presence or absence of thefactor display 16 is determined according to a degree of influence. - Further, the
generation unit 2040 may reflect, on a display aspect for thefactor display 16, a sign of an associated explanatory variable. For example, thegeneration unit 2040 adds an upward arrow to thefactor display 16 when a sign of a value of an associated explanatory variable is positive, and adds a downward arrow to thefactor display 16 when a sign of a value of an associated explanatory variable is negative. Besides the above, for example, thegeneration unit 2040 may use, for thefactor display 16, different colors, shapes, and the like between when a sign of a value of an associated explanatory variable is positive and when a sign of a value of an associated explanatory variable is negative. - For example, the
generation unit 2040 determines whether to allow the cause-and-effect diagram 10 to include thefactor display 16 of an explanatory variable by comparing a degree of influence of the explanatory variable with a threshold value. More specifically, thegeneration unit 2040 allows the cause-and-effect diagram 10 in such a way as to include thefactor display 16 of an explanatory variable having a degree of influence equal to or more than a threshold value, and does not allow the cause-and-effect diagram 10 in such a way as to include thefactor display 16 of an explanatory variable having a degree of influence less than a threshold value. -
Fig. 9 is a diagram illustrating the cause-and-effect diagram 10 in which presence or absence of thefactor display 16 is determined by using a degree of influence of an explanatory variable. InFig. 9 , explanatory variables having a degree of influence equal to or more than a threshold value are same as an example inFig. 8 . However, inFig. 9 , only thefactor display 16 of the explanatory variables having a degree of influence equal to or more than a threshold value is included in the cause-and-effect diagram 10. - Besides the above, for example, the
generation unit 2040 may determine presence or absence of thefactor display 16 according to a rank in order of a degree of influence. For example, thegeneration unit 2040 determines each explanatory variable that falls within a predetermined rank in descending order of a degree of influence from among all explanatory variables, and allows the cause-and-effect diagram 10 to include only thefactor display 16 of the determined explanatory variable. Besides the above, for example, thegeneration unit 2040 determines, for each group, each explanatory variable that falls within a predetermined rank in descending order of a degree of influence in the group, and allows the cause-and-effect diagram 10 to include only thefactor display 16 of the determined explanatory variable. - Herein, when presence or absence of the
factor display 16 is determined by the above-described method, there may be thegroup display 14 including nofactor display 16. In view of this, thegeneration unit 2040 may determine a display aspect for thegroup display 14 according to whether thefactor display 16 is included. By doing so, thegroup display 14 including thefactor display 16 is more emphasized than thegroup display 14 including nofactor display 16. An example of a method of making a display aspect for thegroup display 14 different includes a method of making a background, a frame, and the like different, similarly to a method of making a display aspect for thefactor display 16 different. Further, thegeneration unit 2040 may not display thegroup display 14 including nofactor display 16. In other words, thegeneration unit 2040 determines presence or absence of a display of thegroup display 14 only thegroup display 14 including at least onefactor display 16. - As illustrated by using
Fig. 7 , therelationship information 50 may indicate information on each of a plurality of linear models. In this case, thegeneration unit 2040 may generate the cause-and-effect diagram 10 for each of a plurality of linear models, or may accept specification of a linear model from a user and generate the cause-and-effect diagram 10 for the specified linear model. - Besides the above, for example, the
generation unit 2040 may compute, for each explanatory variable, a statistical value (a sum value, a mean value, a maximum value, a minimum value, or the like) of a degree of influence of the explanatory variable, and generate one cause-and-effect diagram 10 by handling the statistical value as a degree of influence of the explanatory variable. For example, when a sum value of degrees of influence indicated by therelationship information 50 is used for generation of the cause-and-effect diagram 10, thegeneration unit 2040 uses an equation (1) below.
[Mathematical 1]
relationship information 50 for a j-th linear model. n is a total number of linear models indicated by therelationship information 50. Ei is a value handled as a degree of influence of the explanatory variable i when the cause-and-effect diagram 10 is generated. - The
analysis apparatus 2000 outputs the cause-and-effect diagram 10 generated by thegeneration unit 2040. There are various specific methods of outputting the cause-and-effect diagram 10. For example, theanalysis apparatus 2000 stores image data representing the cause-and-effect diagram 10 in a storage apparatus, displays the image data on a display apparatus connected to theanalysis apparatus 2000, or transmits the image data to another apparatus (for example, the user terminal 60). -
Fig. 10 is a diagram for describing an overview of ananalysis apparatus 2000 according to anexample embodiment 2.Fig. 10 is illustrative for ease of understanding theanalysis apparatus 2000, and a function of theanalysis apparatus 2000 is not limited to the illustration inFig. 10 . Further, theanalysis apparatus 2000 according to theexample embodiment 2 has a function similar to theanalysis apparatus 2000 according to theexample embodiment 1, except for the description below. - The
analysis apparatus 2000 according to theexample embodiment 2 outputs, in response to an input being performed of specifying afactor display 16 on an output cause-and-effect diagram 10, agraph 30 for an explanatory variable (hereinafter, also referred to as a specified explanatory variable) associated with the specifiedfactor display 16. InFig. 10 , thefactor display 16 being a "component 2" is selected by a user. In view of this, theanalysis apparatus 2000 generates, as thegraph 30, a line graph representing data acquired for thecomponent 2 in time-series order. - Herein, source data used for estimating a relationship between an objective variable and an explanatory variable represented by
relationship information 50 include a plurality of sets of a value of an objective variable and a value of an explanatory variable. For example, the source data indicate time-series data of a set of a value of an objective variable and a value of an explanatory variable. For example, as the source data relating to manufacture of a product, data indicating sets of presence or absence of a defect in a product and a manufacturing condition at each different point in time of manufacture can be handled. - The
graph 30 is for graphically representing a plurality of values indicated by source data for a specified explanatory variable. For example, thegraph 30 is a graph representing the plurality of pieces of data in time-series order, or a graph representing a result of statistically processing the plurality of pieces of data. - A user can easily recognize difference in a degree of influence that each explanatory variable gives on an objective variable, by browsing the cause-and-effect diagram 10 generated by the
analysis apparatus 2000. For example, an explanatory variable having a high degree of influence can be easily recognized by emphasizing thefactor display 16 of the explanatory variable having a high degree of influence. - Then, it can be said that there is a high probability that a user having recognized difference in a degree of influence of an explanatory variable in this way wants to browse more information relevant to each explanatory variable. For example, when the
factor display 16 of an explanatory variable having a high degree of influence is emphasized, there is a high probability that a user wants to browse more detailed information on an explanatory variable having a high degree of influence. - In this regard, the
analysis apparatus 2000 according to the present example embodiment generates, when an input of specifying thefactor display 16 is performed on the cause-and-effect diagram 10, thegraph 30 for the specified explanatory variable. Thus, a user can easily acquire more detailed information on the specified explanatory variable. - Hereinafter, the
analysis apparatus 2000 according to the present example embodiment will be described in further detail. - A function configuration of the
analysis apparatus 2000 according to theexample embodiment 2 is, for example, represented byFig. 2 , similarly to theanalysis apparatus 2000 according to theexample embodiment 1. However, ageneration unit 2040 according to theexample embodiment 2 generates and outputs, in response to an input being performed of specifying thefactor display 16 on the cause-and-effect diagram 10, thegraph 30 for a factor associated with the specifiedfactor display 16. - A hardware configuration of the
analysis apparatus 2000 according to theexample embodiment 2 is, for example, represented byFig. 3 , similarly to theanalysis apparatus 2000 according to theexample embodiment 1. However, astorage device 1080 according to theexample embodiment 2 stores a program for achieving a function of theanalysis apparatus 2000 according to theexample embodiment 2. -
Fig. 11 is a flowchart illustrating a flow of processing executed by theanalysis apparatus 2000 according to theexample embodiment 2. Anacquisition unit 2020 acquires identification information of a specified explanatory variable (S202). Thegeneration unit 2040 acquires, for the specified explanatory variable, a plurality of pieces of data indicated by source data (S204). Thegeneration unit 2040 generates thegraph 30 by using the acquired plurality of pieces of data (S206). Thegeneration unit 2040 outputs the generated graph 30 (S208). - The
acquisition unit 2020 acquires identification information of a specified explanatory variable in the cause-and-effect diagram 10 (S202). Herein, when a particular part is specified in a diagram output by a method of being displayed or the like on a display apparatus, various types of existing techniques can be used for a technique for acquiring identification information of the specified part. - The
generation unit 2040 acquires, for a specified explanatory variable, a plurality of pieces of data indicated by source data. The source data are stored in advance in a storage apparatus accessible from thegeneration unit 2040. Thegeneration unit 2040 acquires a plurality of pieces of data for a specified explanatory variable by accessing the storage apparatus. - For example, as described above, the source data indicate time-series data including a set of a value of an objective variable and a value of an explanatory variable. In this case, the
generation unit 2040 acquires time-series data representing a temporal change of a value of a specified explanatory variable. However, the source data only need to include a plurality of sets of a value of an objective variable and a value of an explanatory variable, and the sets may not be data representing a temporal change. - The
generation unit 2040 generates thegraph 30 by using a plurality of pieces of data acquired for a specified explanatory variable (S206). Thegraph 30 can be any type that can be generated by using a plurality of pieces of data. When acquired data are time-series data as described above, for example, thegraph 30 is a line graph or the like representing a temporal change of a value of a specified explanatory variable. Besides the above, for example, thegraph 30 is a histogram or the like representing a result of statistically processing a plurality of values of an explanatory variable. - Herein, the
generation unit 2040 may generate a plurality ofgraphs 30 for a specified explanatory variable. For example, thegeneration unit 2040 generates a graph representing a time-series change of acquired data and a graph representing a result of statistically processing the data. Besides the above, for example, thegeneration unit 2040 statistically processes acquired data by using each of a plurality of methods, and generates thegraph 30 for each of results. - Herein, what type of graph generated as the
graph 30 may be fixedly determined in advance, or may be specifiable by a user. - The
generation unit 2040 outputs the generatedgraph 30. A method of outputting thegraph 30 is similar to a method of outputting the cause-and-effect diagram 10. Further, thegeneration unit 2040 may output the cause-and-effect diagram 10 together with thegraph 30. For example, thegeneration unit 2040 generates and outputs screen data (for example, a web page) including both the cause-and-effect diagram 10 and thegraph 30. -
Fig. 12 is a diagram illustrating a screen including both the cause-and-effect diagram 10 and thegraph 30. Note that, inFig. 12 , two graphs being a graph (30-1) representing data in time-series order and a histogram (30-2) are included as thegraph 30. - The
graph 30 is not limited to a line graph or a histogram. For example, a box plot may be generated by accumulating for each particular interval, or a bar graph representing the number of samples in a similar interval may be displayed. Note that, the intervals for accumulating may be set in advance, may be selected by a user from among a plurality of types of intervals (monthly, weekly, daily, and hourly) prepared in advance, or any value may be specified by a user. - Further, an entire period included in the graph 30 (a period of time from when to when data are displayed) may be from a first point in time to a last point in time included in source data, or any period may be specified by a user. In a latter case, for example, a calendar is displayed on a screen and an input of specifying both a first point in time and a last point in time can be performed on the calendar.
- The
generation unit 2040 may acquire, from source data, data on an objective variable in addition to a specified explanatory variable, and generate thegraph 30 by using the specified explanatory variable and data on the objective variable. By doing so, a relationship with the objective variable can be directly recognized regarding the specified explanatory variable. -
Fig. 13 is a diagram illustrating thegraph 30 indicating data on a specified explanatory variable and an objective variable. InFig. 13 , thegraph 30 is a graph including a histogram of values of a specified explanatory variable on which a broken line representing data on an objective variable is superimposed. More specifically, the broken line indicates, for each grade indicated on a horizontal axis of the histogram, a defect rate in products that fall under the grade (a rate of the number of defective products to the total number of manufactured products that fall under the grade). Note that, inFig. 13 , a confidence interval is displayed for a defect rate of each grade. - Further, instead of data on an objective variable or together therewith, data on an item relevant to the objective variable may be added to the
graph 30. For example, examples include a case of allowing thegraph 30 to include data on a defect rate when an objective variable is presence or absence of a defect, and the like. - A user may be able to specify a plurality of factor displays 16 included in the cause-and-effect diagram 10. In this case, the
generation unit 2040 generates thegraph 30 for each of a plurality of specified explanatory variables. At this time, thegeneration unit 2040 may generate thegraph 30 individually for each piece of data acquired for each of the plurality of specified explanatory variables, or may generate onegraph 30 for these pieces of data. -
Fig. 14 is a diagram illustrating thegraph 30 when a plurality of factor displays 16 are specified. In this example, two explanatory variables being acomponent 1 and thecomponent 2 are specified. In view of this, a graph 30-1 indicates data on thecomponent 1 and thecomponent 2 in time-series order. Further, a graph 30-2 and a graph 30-3 indicate a histogram for thecomponent 1 and a histogram for thecomponent 2, respectively. - While the example embodiments of the present invention have been described with reference to the drawings, the above-described example embodiments are exemplification of the present invention, and a combination of the above-described example embodiments or various configurations other than the above may be employed.
- A part or all of the above-described example embodiments can be described as, but not limited to, the following supplementary notes.
- Hereinafter, examples of a reference form will be added.
- 1. An analysis apparatus including:
- an acquisition unit that acquires relationship information indicating a degree of influence of each of a plurality of explanatory variables on an objective variable; and
- a generation unit that generates, by using the relationship information, a cause-and-effect diagram representing a relationship between the objective variable and the explanatory variables, in which
- the generation unit determines a display aspect for a display relating to each explanatory variable or presence or absence of the display in the cause-and-effect diagram, based on the degree of influence of the explanatory variable.
- 2. The analysis apparatus according to
supplementary note 1, in which- a relationship between the objective variable and a plurality of the explanatory variables is represented by one or more linear models, and
- the degree of influence of the explanatory variable indicated by the relationship information is represented by a coefficient by which the explanatory variable is multiplied in the linear model.
- 3. The analysis apparatus according to
supplementary note - the relationship information indicates, for each of the explanatory variables, a plurality of degrees of influence of the explanatory variable, and
- the generation unit computes, for each of the explanatory variables, a statistical value of the plurality of degrees of influence indicated by the relationship information for the explanatory variable, and generates the determination-and-effect diagram by handling the computed statistical value as the degree of influence of the explanatory variable.
- 4. The analysis apparatus according to
supplementary notes 1 to 3, in which the generation unit- makes a display aspect different between a display relating to an explanatory variable having the degree of influence equal to or more than a threshold value and a display relating to an explanatory variable other than the explanatory variable having the degree of influence equal to or more than the threshold value,
- makes a display aspect different between a display relating to an explanatory variable having the degree of influence within a predetermined rank in order and a display relating to an explanatory variable other than the explanatory variable having the degree of influence within the predetermined rank in order, or,
- for each group of the explanatory variables, makes a display aspect different between a display relating to an explanatory variable having the degree of influence within a predetermined rank in order among explanatory variables belonging to the group and a display relating to an explanatory variable other than the explanatory variable having the degree of influence within the predetermined rank in order among the explanatory variables belonging to the group.
- 5. The analysis apparatus according to
supplementary notes 1 to 3, in which the generation unit- allows the cause-and-effect diagram to include only a display relating to an explanatory variable having the degree of influence equal to or more than a threshold value,
- allows the cause-and-effect diagram to include only a display relating to an explanatory variable having the degree of influence within a predetermined rank in order, or,
- for each group of the explanatory variables, allows the cause-and-effect diagram to include only a display relating to an explanatory variable having the degree of influence within a predetermined rank in order among explanatory variables belonging to the group.
- 6. The analysis apparatus according to any one of
supplementary notes 1 to 5, in which the generation unit- outputs the cause-and-effect diagram,
- acquires, when the explanatory variable is specified in the output cause-and-effect diagram, data indicating a plurality of values of the specified explanatory variable, and
- generates a graph by using the data.
- 7. The analysis apparatus according to supplementary note 6, in which the generation unit
- acquires time-series data on the specified explanatory variable, and
- generates, as the graph, a first graph representing a temporal change of a value of the explanatory variable or a second graph representing a result of statistically processing the time-series data.
- 8. The analysis apparatus according to supplementary note 7, in which
the generation unit generates screen data including both the first graph and the second graph. - 9. The analysis apparatus according to any one of supplementary notes 6 to 8, in which the generation unit allows the graph to include data on the objective variable.
- 10. A control method executed by a computer, including:
- an acquisition step of acquiring relationship information indicating a degree of influence of each of a plurality of explanatory variables on an objective variable; and
- a generation step of generating, by using the relationship information, a cause-and-effect diagram representing a relationship between the objective variable and the explanatory variables, in which,
- in the generation step, a display aspect for a display relating to each explanatory variable or presence or absence of the display in the cause-and-effect diagram is determined based on the degree of influence of the explanatory variable.
- 11. The control method according to
supplementary note 10, in which- a relationship between the objective variable and a plurality of the explanatory variables is represented by one or more linear models, and
- the degree of influence of the explanatory variable indicated by the relationship information is represented by a coefficient by which the explanatory variable is multiplied in the linear model.
- 12. The control method according to
supplementary note - the relationship information indicates, for each of the explanatory variables, a plurality of degrees of influence of the explanatory variable,
- the control method further including,
- in the generation step, computing, for each of the explanatory variables, a statistical value of the plurality of degrees of influence indicated by the relationship information for the explanatory variable, and generating the determination-and-effect diagram by handling the computed statistical value as the degree of influence of the explanatory variable.
- 13. The control method according to
supplementary notes 10 to 12, further including,- in the generation step,
- making a display aspect different between a display relating to an explanatory variable having the degree of influence equal to or more than a threshold value and a display relating to an explanatory variable other than the explanatory variable having the degree of influence equal to or more than the threshold value,
- making a display aspect different between a display relating to an explanatory variable having the degree of influence within a predetermined rank in order and a display relating to an explanatory variable other than the explanatory variable having the degree of influence within the predetermined rank in order, or,
- for each group of the explanatory variables, making a display aspect different between a display relating to an explanatory variable having the degree of influence within a predetermined rank in order among explanatory variables belonging to the group and a display relating to an explanatory variable other than the explanatory variable having the degree of influence within the predetermined rank in order among the explanatory variables belonging to the group.
- 14. The control method according to
supplementary notes 10 to 12, further including,- in the generation step,
- allowing the cause-and-effect diagram to include only a display relating to an explanatory variable having the degree of influence equal to or more than a threshold value,
- allowing the cause-and-effect diagram to include only a display relating to an explanatory variable having the degree of influence within a predetermined rank in order, or,
- for each group of the explanatory variables, allowing the cause-and-effect diagram to include only a display relating to an explanatory variable having the degree of influence within a predetermined rank in order among explanatory variables belonging to the group.
- 15. The control method according to any one of
supplementary notes 10 to 14, further including:- in the generation step,
- outputting the cause-and-effect diagram;
- acquiring, when the explanatory variable is specified in the output cause-and-effect diagram, data indicating a plurality of values of the specified explanatory variable; and
- generating a graph by using the data.
- 16. The control method according to supplementary note 15, further including:
- in the generation step,
- acquiring time-series data on the specified explanatory variable; and
- generating, as the graph, a first graph representing a temporal change of a value of the explanatory variable or a second graph representing a result of statistically processing the time-series data.
- 17. The control method according to
supplementary note 16, further including,
in the generation step, generating screen data including both the first graph and the second graph. - 18. The control method according to any one of supplementary notes 15 to 17, further including,
in the generation step, allowing the graph to include data on the objective variable. - 19. A program causing a computer to execute the control method according to any one of
supplementary notes 10 to 18. - This application is based upon and claims the benefit of priority from
Japanese patent application No. 2019-193810, filed on October 24, 2019 -
- 10
- Cause-and-effect diagram
- 11
- Trunk
- 12
- Effect display
- 13
- Branch
- 14
- Group display
- 15
- Subbranch
- 16
- Factor display
- 30
- Graph
- 50
- Relationship information
- 52
- Objective variable
- 54
- Explanatory variable
- 56
- Degree of influence
- 60
- User terminal
- 1000
- Computer
- 1020
- Bus
- 1040
- Processor
- 1060
- Memory
- 1080
- Storage device
- 1100
- Input/output interface
- 1120
- Network interface
- 2000
- Analysis apparatus
- 2020
- Acquisition unit
- 2040
- Generation unit
Claims (19)
- An analysis apparatus comprising:an acquisition unit that acquires relationship information indicating a degree of influence of each of a plurality of explanatory variables on an objective variable; anda generation unit that generates, by using the relationship information, a cause-and-effect diagram representing a relationship between the objective variable and the explanatory variables, whereinthe generation unit determines a display aspect for a display relating to each explanatory variable or presence or absence of the display in the cause-and-effect diagram, based on the degree of influence of the explanatory variable.
- The analysis apparatus according to claim 1, whereina relationship between the objective variable and a plurality of the explanatory variables is represented by one or more linear models, andthe degree of influence of the explanatory variable indicated by the relationship information is represented by a coefficient by which the explanatory variable is multiplied in the linear model.
- The analysis apparatus according to claim 1 or 2, whereinthe relationship information indicates, for each of the explanatory variables, a plurality of degrees of influence of the explanatory variable, andthe generation unit computes, for each of the explanatory variables, a statistical value of the plurality of degrees of influence indicated by the relationship information for the explanatory variable, and generates the determination-and-effect diagram by handling the computed statistical value as the degree of influence of the explanatory variable.
- The analysis apparatus according to claims 1 to 3, whereinthe generation unitmakes a display aspect different between a display relating to an explanatory variable having the degree of influence equal to or more than a threshold value and a display relating to an explanatory variable other than the explanatory variable having the degree of influence equal to or more than the threshold value,makes a display aspect different between a display relating to an explanatory variable having the degree of influence within a predetermined rank in order and a display relating to an explanatory variable other than the explanatory variable having the degree of influence within the predetermined rank in order, or,for each group of the explanatory variables, makes a display aspect different between a display relating to an explanatory variable having the degree of influence within a predetermined rank in order among explanatory variables belonging to the group and a display relating to an explanatory variable other than the explanatory variable having the degree of influence within the predetermined rank in order among the explanatory variables belonging to the group.
- The analysis apparatus according to claims 1 to 3, whereinthe generation unitallows the cause-and-effect diagram to include only a display relating to an explanatory variable having the degree of influence equal to or more than a threshold value,allows the cause-and-effect diagram to include only a display relating to an explanatory variable having the degree of influence within a predetermined rank in order, or,for each group of the explanatory variables, allows the cause-and-effect diagram to include only a display relating to an explanatory variable having the degree of influence within a predetermined rank in order among explanatory variables belonging to the group.
- The analysis apparatus according to any one of claims 1 to 5, whereinthe generation unitoutputs the cause-and-effect diagram,acquires, when the explanatory variable is specified in the output cause-and-effect diagram, data indicating a plurality of values of the specified explanatory variable, andgenerates a graph by using the data.
- The analysis apparatus according to claim 6, whereinthe generation unitacquires time-series data on the specified explanatory variable, andgenerates, as the graph, a first graph representing a temporal change of a value of the explanatory variable or a second graph representing a result of statistically processing the time-series data.
- The analysis apparatus according to claim 7, wherein
the generation unit generates screen data including both the first graph and the second graph. - The analysis apparatus according to any one of claims 6 to 8, wherein
the generation unit allows the graph to include data on the objective variable. - A control method executed by a computer, comprising:an acquisition step of acquiring relationship information indicating a degree of influence of each of a plurality of explanatory variables on an objective variable; anda generation step of generating, by using the relationship information, a cause-and-effect diagram representing a relationship between the objective variable and the explanatory variables, wherein,in the generation step, a display aspect for a display relating to each explanatory variable or presence or absence of the display in the cause-and-effect diagram is determined based on the degree of influence of the explanatory variable.
- The control method according to claim 10, whereina relationship between the objective variable and a plurality of the explanatory variables is represented by one or more linear models, andthe degree of influence of the explanatory variable indicated by the relationship information is represented by a coefficient by which the explanatory variable is multiplied in the linear model.
- The control method according to claim 10 or 11, whereinthe relationship information indicates, for each of the explanatory variables, a plurality of degrees of influence of the explanatory variable,the control method further comprising,in the generation step, computing, for each of the explanatory variables, a statistical value of the plurality of degrees of influence indicated by the relationship information for the explanatory variable, and generating the determination-and-effect diagram by handling the computed statistical value as the degree of influence of the explanatory variable.
- The control method according to claims 10 to 12, further comprising,in the generation step,making a display aspect different between a display relating to an explanatory variable having the degree of influence equal to or more than a threshold value and a display relating to an explanatory variable other than the explanatory variable having the degree of influence equal to or more than the threshold value,making a display aspect different between a display relating to an explanatory variable having the degree of influence within a predetermined rank in order and a display relating to an explanatory variable other than the explanatory variable having the degree of influence within the predetermined rank in order, or,for each group of the explanatory variables, making a display aspect different between a display relating to an explanatory variable having the degree of influence within a predetermined rank in order among explanatory variables belonging to the group and a display relating to an explanatory variable other than the explanatory variable having the degree of influence within the predetermined rank in order among the explanatory variables belonging to the group.
- The control method according to claims 10 to 12, further comprising,in the generation step,allowing the cause-and-effect diagram to include only a display relating to an explanatory variable having the degree of influence equal to or more than a threshold value,allowing the cause-and-effect diagram to include only a display relating to an explanatory variable having the degree of influence within a predetermined rank in order, or,for each group of the explanatory variables, allowing the cause-and-effect diagram to include only a display relating to an explanatory variable having the degree of influence within a predetermined rank in order among explanatory variables belonging to the group.
- The control method according to any one of claims 10 to 14, further comprising:in the generation step,outputting the cause-and-effect diagram;acquiring, when the explanatory variable is specified in the output cause-and-effect diagram, data indicating a plurality of values of the specified explanatory variable; andgenerating a graph by using the data.
- The control method according to claim 15, further comprising:in the generation step,acquiring time-series data on the specified explanatory variable; andgenerating, as the graph, a first graph representing a temporal change of a value of the explanatory variable or a second graph representing a result of statistically processing the time-series data.
- The control method according to claim 16, further comprising,
in the generation step, generating screen data including both the first graph and the second graph. - The control method according to any one of claims 15 to 17, further comprising,
in the generation step, allowing the graph to include data on the objective variable. - A program causing a computer to execute the control method according to any one of claims 10 to 18.
Applications Claiming Priority (2)
| Application Number | Priority Date | Filing Date | Title |
|---|---|---|---|
| JP2019193810 | 2019-10-24 | ||
| PCT/JP2020/039819 WO2021079966A1 (en) | 2019-10-24 | 2020-10-23 | Analysis device, control method, and program |
Publications (2)
| Publication Number | Publication Date |
|---|---|
| EP4050536A1 true EP4050536A1 (en) | 2022-08-31 |
| EP4050536A4 EP4050536A4 (en) | 2022-12-14 |
Family
ID=75620155
Family Applications (1)
| Application Number | Title | Priority Date | Filing Date |
|---|---|---|---|
| EP20879389.3A Pending EP4050536A4 (en) | 2019-10-24 | 2020-10-23 | ANALYSIS DEVICE, CONTROL METHOD AND PROGRAM |
Country Status (5)
| Country | Link |
|---|---|
| US (1) | US20220391727A1 (en) |
| EP (1) | EP4050536A4 (en) |
| JP (1) | JP7380699B2 (en) |
| CN (1) | CN114586025A (en) |
| WO (1) | WO2021079966A1 (en) |
Families Citing this family (1)
| Publication number | Priority date | Publication date | Assignee | Title |
|---|---|---|---|---|
| CN114089934A (en) * | 2021-10-08 | 2022-02-25 | 远光软件股份有限公司 | Target variable and influence factor display method and device |
Family Cites Families (13)
| Publication number | Priority date | Publication date | Assignee | Title |
|---|---|---|---|---|
| JPH11250135A (en) * | 1998-03-02 | 1999-09-17 | Hitachi Ltd | Information system |
| JP4495960B2 (en) * | 2003-12-26 | 2010-07-07 | キヤノンItソリューションズ株式会社 | Model creation device for the relationship between process and quality |
| JP4239932B2 (en) * | 2004-08-27 | 2009-03-18 | 株式会社日立製作所 | production management system |
| JP5352485B2 (en) | 2010-01-21 | 2013-11-27 | 株式会社日立製作所 | Factor analyzer |
| US20130297475A1 (en) * | 2012-05-07 | 2013-11-07 | Accenture Global Services Limited | Robust position detection, cause-and-effect and rule determinants to govern excessive risks for global regulatory compliance |
| US8909582B2 (en) | 2013-02-04 | 2014-12-09 | Nec Corporation | Hierarchical latent variable model estimation device, hierarchical latent variable model estimation method, and recording medium |
| CA2946536C (en) | 2014-05-07 | 2023-01-10 | Alcon Pharmaceuticals, Ltd. | Ophthalmic surgical systems, methods, and devices |
| US10083073B2 (en) * | 2015-09-14 | 2018-09-25 | Dynatrace Llc | Method and system for real-time causality and root cause determination of transaction and infrastructure related events provided by multiple, heterogeneous agents |
| JP6904331B2 (en) * | 2016-03-23 | 2021-07-14 | 日本電気株式会社 | Factor analyzers, factor analysis methods, and programs |
| JP6451895B2 (en) | 2016-03-28 | 2019-01-16 | 日本電気株式会社 | Prediction model selection system, prediction model selection method, and prediction model selection program |
| JP6740157B2 (en) * | 2017-03-13 | 2020-08-12 | 株式会社東芝 | Analysis device, analysis method, and program |
| JP6833642B2 (en) * | 2017-08-10 | 2021-02-24 | 株式会社東芝 | Factor analyzers, factor analysis methods, and programs |
| JP6942617B2 (en) * | 2017-11-30 | 2021-09-29 | 株式会社日立製作所 | Data analysis system and data analysis equipment |
-
2020
- 2020-10-23 US US17/767,216 patent/US20220391727A1/en active Pending
- 2020-10-23 EP EP20879389.3A patent/EP4050536A4/en active Pending
- 2020-10-23 JP JP2021553543A patent/JP7380699B2/en active Active
- 2020-10-23 WO PCT/JP2020/039819 patent/WO2021079966A1/en not_active Ceased
- 2020-10-23 CN CN202080073714.9A patent/CN114586025A/en active Pending
Also Published As
| Publication number | Publication date |
|---|---|
| US20220391727A1 (en) | 2022-12-08 |
| JPWO2021079966A1 (en) | 2021-04-29 |
| WO2021079966A1 (en) | 2021-04-29 |
| CN114586025A (en) | 2022-06-03 |
| JP7380699B2 (en) | 2023-11-15 |
| EP4050536A4 (en) | 2022-12-14 |
Similar Documents
| Publication | Publication Date | Title |
|---|---|---|
| US11037080B2 (en) | Operational process anomaly detection | |
| US20190333078A1 (en) | Methods of assessing long-term indicators of sentiment | |
| US20150142520A1 (en) | Crowd-based sentiment indices | |
| US20140309989A1 (en) | Method and system for analyzing text | |
| CN111178377A (en) | Visual feature screening method, server and storage medium | |
| CN113254542A (en) | Data visualization processing method and device and electronic equipment | |
| CN117223016A (en) | Industry-specific machine learning applications | |
| KR101667199B1 (en) | Relative quality index estimation apparatus of the web page using keyword search | |
| Saghir et al. | Control chart for monitoring multivariate COM-Poisson attributes | |
| US11115440B2 (en) | Dynamic threat intelligence detection and control system | |
| Allouche et al. | Solving multi-criteria scheduling flow shop problem through compromise programming and satisfaction functions | |
| EP4050536A1 (en) | Analysis device, control method, and program | |
| EP4089598A1 (en) | Information processing device, information processing method, and program | |
| Zens et al. | Efficient Bayesian modeling of binary and categorical data in R: The UPG package | |
| CN110688273B (en) | Classification model monitoring method and device, terminal and computer storage medium | |
| JP4777941B2 (en) | Demand forecasting method and apparatus | |
| CN115689143A (en) | Work order assignment method, device, electronic device and medium | |
| Alemu | Causality links between consumer and producer price inflation in South Africa | |
| CN118212072A (en) | Data evaluation method, device, equipment and storage medium based on artificial intelligence | |
| WO2016187504A1 (en) | Crowd-based sentiment indices | |
| Solvang et al. | Estimation and classification of temporal trends to support integrated ecosystem assessment | |
| JP2017182363A (en) | Information processing device, information processing method and information processing program | |
| CN106484710B (en) | Dynamic data processing method and device and information display method and device | |
| JP2020187511A (en) | Information processing program, information processing method, and information processing device | |
| CN116542779A (en) | Product recommendation method, device, equipment and storage medium based on artificial intelligence |
Legal Events
| Date | Code | Title | Description |
|---|---|---|---|
| STAA | Information on the status of an ep patent application or granted ep patent |
Free format text: STATUS: THE INTERNATIONAL PUBLICATION HAS BEEN MADE |
|
| PUAI | Public reference made under article 153(3) epc to a published international application that has entered the european phase |
Free format text: ORIGINAL CODE: 0009012 |
|
| STAA | Information on the status of an ep patent application or granted ep patent |
Free format text: STATUS: REQUEST FOR EXAMINATION WAS MADE |
|
| 17P | Request for examination filed |
Effective date: 20220422 |
|
| AK | Designated contracting states |
Kind code of ref document: A1 Designated state(s): AL AT BE BG CH CY CZ DE DK EE ES FI FR GB GR HR HU IE IS IT LI LT LU LV MC MK MT NL NO PL PT RO RS SE SI SK SM TR |
|
| A4 | Supplementary search report drawn up and despatched |
Effective date: 20221111 |
|
| RIC1 | Information provided on ipc code assigned before grant |
Ipc: G06F 17/18 20060101ALI20221107BHEP Ipc: G06F 16/904 20190101ALI20221107BHEP Ipc: G06Q 50/04 20120101ALI20221107BHEP Ipc: G06Q 10/06 20120101AFI20221107BHEP |
|
| DAV | Request for validation of the european patent (deleted) | ||
| DAX | Request for extension of the european patent (deleted) | ||
| STAA | Information on the status of an ep patent application or granted ep patent |
Free format text: STATUS: EXAMINATION IS IN PROGRESS |
|
| 17Q | First examination report despatched |
Effective date: 20251125 |