EP4044067A1 - Information processing program, information processing method, and information processing device - Google Patents
Information processing program, information processing method, and information processing device Download PDFInfo
- Publication number
- EP4044067A1 EP4044067A1 EP19948777.8A EP19948777A EP4044067A1 EP 4044067 A1 EP4044067 A1 EP 4044067A1 EP 19948777 A EP19948777 A EP 19948777A EP 4044067 A1 EP4044067 A1 EP 4044067A1
- Authority
- EP
- European Patent Office
- Prior art keywords
- loss function
- categorical data
- feature amounts
- information processing
- anomaly
- Prior art date
- Legal status (The legal status is an assumption and is not a legal conclusion. Google has not performed a legal analysis and makes no representation as to the accuracy of the status listed.)
- Withdrawn
Links
Images







Classifications
-
- G—PHYSICS
- G06—COMPUTING OR CALCULATING; COUNTING
- G06N—COMPUTING ARRANGEMENTS BASED ON SPECIFIC COMPUTATIONAL MODELS
- G06N3/00—Computing arrangements based on biological models
- G06N3/02—Neural networks
- G06N3/08—Learning methods
-
- G—PHYSICS
- G06—COMPUTING OR CALCULATING; COUNTING
- G06F—ELECTRIC DIGITAL DATA PROCESSING
- G06F21/00—Security arrangements for protecting computers, components thereof, programs or data against unauthorised activity
- G06F21/50—Monitoring users, programs or devices to maintain the integrity of platforms, e.g. of processors, firmware or operating systems
- G06F21/55—Detecting local intrusion or implementing counter-measures
-
- G—PHYSICS
- G06—COMPUTING OR CALCULATING; COUNTING
- G06N—COMPUTING ARRANGEMENTS BASED ON SPECIFIC COMPUTATIONAL MODELS
- G06N20/00—Machine learning
- G06N20/10—Machine learning using kernel methods, e.g. support vector machines [SVM]
-
- G—PHYSICS
- G06—COMPUTING OR CALCULATING; COUNTING
- G06N—COMPUTING ARRANGEMENTS BASED ON SPECIFIC COMPUTATIONAL MODELS
- G06N3/00—Computing arrangements based on biological models
- G06N3/02—Neural networks
- G06N3/04—Architecture, e.g. interconnection topology
-
- G—PHYSICS
- G06—COMPUTING OR CALCULATING; COUNTING
- G06N—COMPUTING ARRANGEMENTS BASED ON SPECIFIC COMPUTATIONAL MODELS
- G06N3/00—Computing arrangements based on biological models
- G06N3/02—Neural networks
- G06N3/04—Architecture, e.g. interconnection topology
- G06N3/045—Combinations of networks
-
- G—PHYSICS
- G06—COMPUTING OR CALCULATING; COUNTING
- G06N—COMPUTING ARRANGEMENTS BASED ON SPECIFIC COMPUTATIONAL MODELS
- G06N3/00—Computing arrangements based on biological models
- G06N3/02—Neural networks
- G06N3/04—Architecture, e.g. interconnection topology
- G06N3/0499—Feedforward networks
-
- G—PHYSICS
- G06—COMPUTING OR CALCULATING; COUNTING
- G06N—COMPUTING ARRANGEMENTS BASED ON SPECIFIC COMPUTATIONAL MODELS
- G06N3/00—Computing arrangements based on biological models
- G06N3/02—Neural networks
- G06N3/08—Learning methods
- G06N3/09—Supervised learning
-
- H—ELECTRICITY
- H04—ELECTRIC COMMUNICATION TECHNIQUE
- H04L—TRANSMISSION OF DIGITAL INFORMATION, e.g. TELEGRAPHIC COMMUNICATION
- H04L63/00—Network architectures or network communication protocols for network security
- H04L63/14—Network architectures or network communication protocols for network security for detecting or protecting against malicious traffic
- H04L63/1408—Network architectures or network communication protocols for network security for detecting or protecting against malicious traffic by monitoring network traffic
- H04L63/1425—Traffic logging, e.g. anomaly detection
-
- H—ELECTRICITY
- H04—ELECTRIC COMMUNICATION TECHNIQUE
- H04L—TRANSMISSION OF DIGITAL INFORMATION, e.g. TELEGRAPHIC COMMUNICATION
- H04L63/00—Network architectures or network communication protocols for network security
- H04L63/02—Network architectures or network communication protocols for network security for separating internal from external traffic, e.g. firewalls
- H04L63/0227—Filtering policies
- H04L63/0236—Filtering by address, protocol, port number or service, e.g. IP-address or URL
-
- H—ELECTRICITY
- H04—ELECTRIC COMMUNICATION TECHNIQUE
- H04L—TRANSMISSION OF DIGITAL INFORMATION, e.g. TELEGRAPHIC COMMUNICATION
- H04L63/00—Network architectures or network communication protocols for network security
- H04L63/02—Network architectures or network communication protocols for network security for separating internal from external traffic, e.g. firewalls
- H04L63/0281—Proxies
Definitions
- the embodiment discussed herein is related to an information processing program, an information processing method, and an information processing apparatus.
- categorical data refers to data in which values are discrete.
- categorical data include internet protocol (IP) addresses, port numbers, and host names.
- FIG. 10 is a diagram illustrating a flow of anomaly IP address detection.
- an apparatus for detecting an anomaly IP address extracts feature amounts of source IP addresses from a communication log and conducts machine training by using the extracted feature amounts, thereby detecting an anomaly IP address.
- a communication log includes Src. IP, Dst. IP, Dst. Port, and host.
- Src. IP refers to a source IP address.
- Dst. IP refers to a destination IP address.
- Dst. Port refers to a destination port number.
- host refers to a place where the communication log is obtained.
- the feature is, for example, whether a specific destination IP address is included. If the address is included, the feature amount is "1", and, if not, the feature amount is "0".
- the communication log has enormous patterns, causing the feature amount vector of the source IP addresses to have a high dimension reaching several hundred thousand dimensions, which makes machine training inefficient.
- IP2Vec exists as a technology for extracting low-dimensional feature amount vectors.
- feature amounts of IP addresses are extracted based on co-occurrence patterns.
- FIG. 11 is a diagram for explaining IP2Vec.
- the source IP address "IP1” co-occurs with the destination IP address "10.***.2”, the destination IP address "10.***.3", the destination port number "22", and the destination port number "3389" in the communication log.
- IP2Vec feature vectors of IP addresses are extracted by applying Word2Vec to extract feature vectors of words on the basis of word co-occurrence. Because an anomaly IP address and a normal IP address have different co-occurrence patterns of destination IP addresses and destination port numbers from each other, an abnormal feature amount is extracted for the anomaly IP address.
- a communication analysis apparatus As a conventional technology for analyzing an abnormality in a network, a communication analysis apparatus has been present that, when detecting an abnormality on a network, is capable of determining the content of abnormality.
- This communication analysis apparatus has a plurality of abnormality detection units that detect the degree of an abnormality of the network from information generated in a network device.
- the communication analysis apparatus also has a feature amount generation unit that generates, for each of the abnormality detection units, a feature amount to be supplied to the abnormality detection unit from the information generated by the network device.
- the communication analysis apparatus also has a detection result management unit that manages management information obtained by summing up detection results detected by each of the abnormality detection units on the basis of the feature amount.
- the communication analysis apparatus also has: a determination unit that performs a determination process of determining the content of an abnormality that has occurred on the network on the basis of the management information managed by the detection result management unit; and an output unit that outputs determination result information indicating the result of the determination process.
- Patent Literature 1 Japanese Laid-open Patent Publication No. 2019-80201
- Non Patent Literature 1 Ring, Markus, et al. "IP2Vec: Learning Similarities between IP Addresses.”, 2017 IEEE International Conference on Data Mining Workshops (ICDMW), IEEE, 2017 .
- a feature amount effective for detection refers to such a feature amount that the separation boundary between normal and anomaly is noticeable in a feature amount space.
- an object of the present invention to provide an information processing program, an information processing method, and an information processing apparatus that improve the precision of anomaly detection.
- an information processing program causes a computer to execute a process including: identifying feature amounts for respective values in categorical data so as to minimize a third loss function based on a first loss function for extraction of feature amounts in categorical data and a second loss function for detection of abnormal values in the categorical data; and detecting the abnormal values in the categorical data, based on the feature amounts identified for the respective values in the categorical data.
- the precision of anomaly detection can be improved.
- FIG. 1 is a diagram illustrating the functional configuration of the anomaly detection apparatus according to the embodiment.
- an anomaly detection apparatus 1 according to the embodiment has an encoding unit 11, a feature amount generation unit 12, an anomaly score computation unit 13, and an anomaly determination unit 14.
- the encoding unit 11 receives a proxy log 3 from a proxy 2, receives an intrusion detection system (IDS) log 5 from an IDS 4, receives a firewall (FW) log 7 from FW 6, and receives a terminal log 9 from a terminal 8.
- the encoding unit 11 may receive other communication logs from other devices.
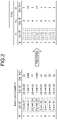
- FIG. 2 is a diagram illustrating an example encoding of logs.
- Src. IP refers to a source IP address
- Dst. IP refers to a destination IP address
- Dst Port refers to a destination port number.
- w i represents the source IP address of the i-th log.
- c represents the number of pieces of information constituting the communication information of w i .
- c 2, w 1,i is Dst. IP, and w 2,i is Dst. Port.
- the Src. IP “10.***.01” is encoded into “1"
- the Src. IP “212.***.201” is encoded into “2”
- the Src. IP “3.***.101” is encoded into “3”.
- the Dst. IP “20.***.02” is encoded into “4"
- the Dst. IP “11.***.70” is encoded into “5"
- the Dst. IP “20.***.01” is encoded into “6”.
- the Dst. IP “20.***.03” is encoded into “7”
- the Dst. IP “20.***.04” is encoded into “8”.
- the Dst. Port “22” is encoded into “9"
- the Dst. Port “3389” is encoded into “10".
- the feature amount generation unit 12 receives an encoding result encoded by the encoding unit 11, and generates a feature amount of the source IP address.
- L extraction is a loss function for feature extraction
- L detection is a loss function for anomaly detection
- ⁇ represents the coefficient for adjusting a trade-off between the loss function for feature extraction and the loss function for anomaly detection.
- L extraction is defined by the following expression (1).
- U U ′ ⁇ ⁇ i ⁇ c log P w c , i
- U and U' respectively represent a weighting matrix from an input layer to a hidden layer and a weighting matrix from the hidden layer to a final layer in IP2Vec.
- w i ;U, U') represents the posterior probability that, when w i is determined, w c,i co-occur.
- L detection is defined by the following expression (2).
- L detection U c 0 ⁇ j ⁇ ⁇ h j ⁇ c 0 ⁇ 2 2
- ⁇ represents an arbitrary map
- c 0 represents a point in a mapping space H
- h j represents a feature amount of a source IP address j
- c 0 and h j are vectors.
- vectors such as c 0 and h j appear in boldface, while, in the rest, boldface is not used.
- ⁇ (h j ) - c 0 ⁇ 2 represents the L 2 norm of ⁇ (h j )-c 0 .
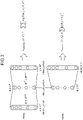
- FIG. 3 is a diagram for explaining generation of feature amounts by the feature amount generation unit 12.
- FIG. 3 illustrates a case in which IP2Vec is used for feature extraction and SVDD is used for anomaly detection.
- FIG. 4A illustrates definitions of symbols for IP2Vec
- FIG. 4B illustrates definitions of symbols for SVDD.
- a one-hot vector is a vector in which a single 1 is used for only one element and 0s are used for the other elements.
- a neural network (NN) with a single hidden layer is used in IP2Vec.
- the number of neurons in the input layer is p
- the number of neurons in the hidden layer is d
- he number of neurons in the final layer is p.
- p represents the total number of patterns of communication information
- q represents the number of unique source IP addresses.
- d represents the number of feature amounts extracted for the source IP addresses.
- an input is x
- U' T is a transpose of U'.
- training is conducted using (w i , C(w i )) as training data.
- C(w i ) is output in response to an input of w i .
- the input of w i is provided as a one-hot vector x i in which the number of components is p and the component corresponding to w i is 1.
- Training is conducted so that, in response to an input of x i , an output of a neuron corresponding to w c,i in the final layer is 1.
- the output of the neuron corresponding to w c,i in the final layer is P(w c,i
- IP2Vec U and U' are calculated so that the posterior probability P(w c,i
- h is mapped by the map ⁇ in the space H.
- the dimension of H is arbitrary.
- a loss function of SVDD is found in the following expression (3).
- r represents a radius of a sphere centering around c 0 in the space H. If the space H is two-dimensional, r is a radius of a circle. If the space H is three-dimensional, r is a radius of a sphere.
- C represents a coefficient for adjusting a trade-off between the first term and the second term.
- the first term represents the size of the sphere
- the second term is the sum of squares of the distances from points out of the sphere, of the points of the feature amount vector u j of the source IP address j (j ⁇ 1, ⁇ , q ⁇ ) mapped in the space H, to the surface of the sphere.
- a larger sphere enables the second term to be zero but the first term to be larger, while a smaller sphere enables the first term to be smaller but the second term to be larger with more points out of the sphere.
- r and c 0 are determined so that points of the feature amount vector u j mapped in the space H gather as closer to c 0 as possible.
- the feature amount generation unit 12 minimizes expression (2) as an abbreviated version of expression (3).
- the feature amount generation unit 12 uses gradient descent, for example, as an optimization method to minimize the loss function L.
- the anomaly score computation unit 13 computes an anomaly score by using the feature amount generated by the feature amount generation unit 12.
- the anomaly score computation unit 13 computes an anomaly score S j by using the following expression (4).
- S j ⁇ ⁇ h j ⁇ c 0 ⁇ 2 2
- the anomaly determination unit 14 compares the anomaly score S j with a predetermined threshold, and, if the anomaly score S j is equal to or greater than the predetermined threshold, detects the source IP address j as an anomaly IP address.
- the anomaly determination unit 14 decodes the encoded anomaly IP address and displays the address on a display device.
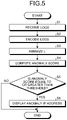
- FIG. 5 is a flowchart illustrating the flow of a process performed by the anomaly detection apparatus 1.
- the anomaly detection apparatus 1 receives logs (step S1).
- the anomaly detection apparatus 1 receives the proxy log 3, the IDS log 5, the FW log 7, and the terminal log 9.
- the anomaly detection apparatus 1 then encodes the logs (step S2), and minimizes L (step S3).
- the anomaly detection apparatus 1 then computes the anomaly score for each source IP address (step S4), determines whether the anomaly score is equal to or greater than a threshold (step S5), and, if the anomaly score is equal to or greater than the threshold, displays an anomaly IP address (step S6).
- the anomaly detection apparatus 1 minimizes a loss function for feature extraction and a loss function for anomaly detection at the same time by minimizing L, which enables extraction of a feature amount suitable for anomaly detection.
- FIG. 6 is a diagram illustrating a flow of a process of computing anomaly scores by generating feature amounts that minimize L. As illustrated in FIG. 6 , the flow of the process of computing anomaly scores by generating feature amounts that minimize L is made up of two loops: (a) anomaly score computation (outer loop); and (b) inner loop.
- the output is an anomaly score ⁇ S j ⁇ j (line number 2).
- the anomaly detection apparatus 1 randomly initializes a 0-th generation U and U', and initializes a 0-th generation c 0 with a mean value of a 0-th generation ⁇ (h j ) (line number 3).
- the anomaly detection apparatus 1 then computes a first-generation to maximum generation U, U', and c 0 by performing repeated computation (line numbers 4 to 7), and takes the maximum generation U and c 0 as optimum values (line number 8).
- the anomaly detection apparatus 1 computes k-th generation U and U' in the inner loop while fixing a (k-1)-th generation c 0 during the repeated computation (line number 5), and computes a k-th generation c 0 by using the k-th generation U (line number 6).
- the anomaly detection apparatus 1 computes anomaly scores ⁇ S j ⁇ j by using expression (4) from the optimum values of U and c 0 (line number 9), and returns the anomaly scores ⁇ S j ⁇ j (line number 10).
- the input of the inner loop is D and (k-1)-th generation U, U', and c 0 (line number 11), and the output is the k-th generation U and U' (line number 12).
- the anomaly detection apparatus 1 initializes 0-th batch of the k-th generation U and U' with the (k-1)-th generation U and U' (line number 13), and dives D into n mini batches D 1 , ⁇ , D n (line number 14).
- the anomaly detection apparatus 1 then computes a first batch to an n-th batch of the k-th generation U and U' by performing repeated computation (line numbers 15 to 19), and takes the n-th batch of the k-th generation U and U' as the k-th generation U and U' (line number 20). The anomaly detection apparatus 1 then returns the k-th generation U and U' (line number 21).
- the anomaly detection apparatus 1 computes a gradient of L with respect to U and a gradient of L with respect to U' by using a mini batch D m during the repeated computation (line number 16).
- the anomaly detection apparatus 1 subtracts a value obtained by multiplying the gradient of L with respect to U by ⁇ from a (m-1)-th batch of the k-th generation U to compute a m-th batch of the k-th generation U (line number 17).
- the anomaly detection apparatus 1 also subtracts a value obtained by multiplying the gradient of L with respect to U' by ⁇ from a (m-1)-th batch of the k-th generation U' to compute a m-th batch of the k-th generation U' (line number 18).
- the anomaly detection apparatus 1 repeats a process the number of times of the maximum generation while adding 1 to k one at a time, the process of computing the k-th generation U and U' by using gradient descent while fixing the (k-1)-th generation c 0 and computing the k-th generation c 0 by using the computed k-th generation U. Consequently, the anomaly detection apparatus 1 can compute U and c 0 that minimize L.
- FIG. 7 is a diagram for explaining effective feature amounts generated by the anomaly detection apparatus 1.
- FIG. 7(a) illustrates ineffective feature amounts
- FIG. 7(b) illustrates effective feature amounts generated by the anomaly detection apparatus 1.
- FIG. 7 illustrates cases in which the number of feature amounts is two for convenience of explanation.
- the separation boundary between normal and anomaly is noticeable in the feature amount space, as illustrated in FIG. 7(b) , and thus many detection algorithms are capable of defining a correct separation boundary.
- the anomaly detection apparatus 1 generates a feature amount effective for detection, which can improve the precision of anomaly detection.
- FIG. 8 is a diagram illustrating the effect of the anomaly detection apparatus 1.
- FIG. 8 illustrates a case in which coburg intrusion detection data sets (CIDDS)-001 are used as an example of data sets. The task of this example is to detect an IP address of an attacker from one hundred thousand IDS logs including about four thousand IP addresses as an anomaly IP address.
- FIG. 8(a) illustrates feature amounts of a conventional technology
- FIG. 8(b) illustrates feature amounts of the embodiment.
- a point 21 indicates an anomaly IP address, and other points indicate normal IP addresses.
- the separation boundary between normal and anomaly is noticeable as compared with the conventional technology, and the feature amounts of the embodiment are effective as compared with the feature amounts of the conventional technology.
- PRC refers to the ratio of being a truly anomaly IP address to IP address that have been determined as anomaly, and being closer to 1 is better. Consequently, the anomaly detection apparatus 1 has higher precision than the conventional technology.
- the feature amount generation unit 12 connects the output at the hidden layer of the NN based on IP2Vec to L detection , thereby minimizing the loss function L, which can minimize L extraction and L detection at the same time.
- the anomaly detection apparatus 1 may use other methods for feature amount extraction and anomaly detection.
- the case has been explained in which gradient descent is used for optimization.
- the anomaly detection apparatus 1 may use other methods for optimization.
- the case has been explained in which an anomaly IP address is detected.
- the anomaly detection apparatus 1 may detect other abnormal values in categorical data.
- an anomaly detection program having the same functions can be obtained by achieving the configuration that the anomaly detection apparatus 1 has by means of software.
- a computer that executes the anomaly detection program will be explained.
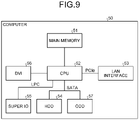
- FIG. 9 is a diagram illustrating a hardware configuration of a computer that executes an anomaly detection program according to the embodiment.
- a computer 50 has a main memory 51, a central processing unit (CPU) 52, a local area network (LAN) interface 53, and a hard disk drive (HDD) 54.
- the computer 50 also has a super input/output (IO) 55, a digital visual interface (DVI) 56, and an optical disk drive (ODD) 57.
- IO super input/output
- DVI digital visual interface
- ODD optical disk drive
- the main memory 51 is a memory that stores therein computer programs, intermediate results of executing the computer programs, or the like.
- the CPU 52 is a central processing unit that reads a computer program from the main memory 51 and executes the computer program.
- the CPU 52 includes a chip set having a memory controller.
- the LAN interface 53 is an interface for connecting the computer 50 through a LAN to another computer.
- the HDD 54 is a disk device that stores therein computer programs and data
- the super IO 55 is an interface for connecting input devices, such as a mouse and a keyboard.
- the DVI 56 is an interface for connecting a liquid crystal display
- the ODD 57 is a device that reads and writes DVDs and CD-Rs.
- the LAN interface 53 is connected to the CPU 52 with PCI Express (PCIe), and the HDD 54 and the ODD 57 are connected to the CPU 52 via serial advanced technology attachment (SATA).
- the super IO 55 is connected to the CPU 52 via low pin count (LPC).
- the anomaly detection program to be executed on the computer 50 is stored in a CD-R, which is an example of a recording medium readable by the computer 50, is read from the CD-R by the ODD 57, and is installed in the computer 50.
- the anomaly detection program is stored in a database and the like of another computer system connected through the LAN interface 53, is read from such a database, and is installed in the computer 50.
- the installed anomaly detection program is then stored in the HDD 54, is read into the main memory 51, and is executed by the CPU 52.
Landscapes
- Engineering & Computer Science (AREA)
- Theoretical Computer Science (AREA)
- Physics & Mathematics (AREA)
- Software Systems (AREA)
- General Engineering & Computer Science (AREA)
- Computing Systems (AREA)
- General Physics & Mathematics (AREA)
- Artificial Intelligence (AREA)
- Mathematical Physics (AREA)
- Data Mining & Analysis (AREA)
- Evolutionary Computation (AREA)
- Biophysics (AREA)
- Molecular Biology (AREA)
- General Health & Medical Sciences (AREA)
- Computational Linguistics (AREA)
- Biomedical Technology (AREA)
- Life Sciences & Earth Sciences (AREA)
- Health & Medical Sciences (AREA)
- Computer Security & Cryptography (AREA)
- Computer Vision & Pattern Recognition (AREA)
- Medical Informatics (AREA)
- Computer Hardware Design (AREA)
- Computer Networks & Wireless Communication (AREA)
- Signal Processing (AREA)
- Data Exchanges In Wide-Area Networks (AREA)
Abstract
Description
- The embodiment discussed herein is related to an information processing program, an information processing method, and an information processing apparatus.
- Conventional technologies have been present for detecting abnormal values in categorical data. Herein, categorical data refers to data in which values are discrete. Examples of categorical data include internet protocol (IP) addresses, port numbers, and host names. By detecting an abnormal value in a source IP address as an anomaly IP address, unauthorized access can be detected.
-
FIG. 10 is a diagram illustrating a flow of anomaly IP address detection. As illustrated inFIG. 10 , an apparatus for detecting an anomaly IP address extracts feature amounts of source IP addresses from a communication log and conducts machine training by using the extracted feature amounts, thereby detecting an anomaly IP address. - A communication log includes Src. IP, Dst. IP, Dst. Port, and host. Src. IP refers to a source IP address. Dst. IP refers to a destination IP address. Dst. Port refers to a destination port number. host refers to a place where the communication log is obtained. The feature is, for example, whether a specific destination IP address is included. If the address is included, the feature amount is "1", and, if not, the feature amount is "0".
- In a case in which feature amounts of source IP addresses are extracted, the communication log has enormous patterns, causing the feature amount vector of the source IP addresses to have a high dimension reaching several hundred thousand dimensions, which makes machine training inefficient.
- Thus, IP2Vec exists as a technology for extracting low-dimensional feature amount vectors. In IP2Vec, feature amounts of IP addresses are extracted based on co-occurrence patterns.
FIG. 11 is a diagram for explaining IP2Vec. InFIG. 11 , the source IP address "IP1" co-occurs with the destination IP address "10.***.2", the destination IP address "10.***.3", the destination port number "22", and the destination port number "3389" in the communication log. - In IP2Vec, feature vectors of IP addresses are extracted by applying Word2Vec to extract feature vectors of words on the basis of word co-occurrence. Because an anomaly IP address and a normal IP address have different co-occurrence patterns of destination IP addresses and destination port numbers from each other, an abnormal feature amount is extracted for the anomaly IP address.
- As a conventional technology for analyzing an abnormality in a network, a communication analysis apparatus has been present that, when detecting an abnormality on a network, is capable of determining the content of abnormality. This communication analysis apparatus has a plurality of abnormality detection units that detect the degree of an abnormality of the network from information generated in a network device. The communication analysis apparatus also has a feature amount generation unit that generates, for each of the abnormality detection units, a feature amount to be supplied to the abnormality detection unit from the information generated by the network device. The communication analysis apparatus also has a detection result management unit that manages management information obtained by summing up detection results detected by each of the abnormality detection units on the basis of the feature amount. The communication analysis apparatus also has: a determination unit that performs a determination process of determining the content of an abnormality that has occurred on the network on the basis of the management information managed by the detection result management unit; and an output unit that outputs determination result information indicating the result of the determination process.
- Patent Literature 1:
Japanese Laid-open Patent Publication No. 2019-80201 - Non Patent Literature 1: Ring, Markus, et al. "IP2Vec: Learning Similarities between IP Addresses.", 2017 IEEE International Conference on Data Mining Workshops (ICDMW), IEEE, 2017.
- Conventional anomaly detection performs feature extraction and detection at independent steps. Consequently, a feature amount effective for detection is not capable of being extracted at the feature extraction step, and detection precision is problematically low. Herein, a feature amount effective for detection refers to such a feature amount that the separation boundary between normal and anomaly is noticeable in a feature amount space.
- Accordingly, it is an object of the present invention to provide an information processing program, an information processing method, and an information processing apparatus that improve the precision of anomaly detection.
- In one proposal, an information processing program causes a computer to execute a process including: identifying feature amounts for respective values in categorical data so as to minimize a third loss function based on a first loss function for extraction of feature amounts in categorical data and a second loss function for detection of abnormal values in the categorical data; and detecting the abnormal values in the categorical data, based on the feature amounts identified for the respective values in the categorical data.
- In one aspect of an embodiment of the invention, the precision of anomaly detection can be improved.
-
-
FIG. 1 is a diagram illustrating a functional configuration of an anomaly detection apparatus according to an embodiment. -
FIG. 2 is a diagram illustrating an example encoding of logs. -
FIG. 3 is a diagram for explaining generation of feature amounts by a feature amount generation unit. -
FIG. 4A is a diagram illustrating definitions of symbols for IP2Vec. -
FIG. 4B is a diagram illustrating definitions of symbols for SVDD. -
FIG. 5 is a flowchart illustrating a flow of a process performed by the anomaly detection apparatus. -
FIG. 6 is a diagram illustrating a flow of a process of computing anomaly scores by generating feature amounts that minimize L. -
FIG. 7 is a diagram for explaining effective feature amounts generated by the anomaly detection apparatus. -
FIG. 8 is a diagram illustrating the effect of the anomaly detection apparatus. -
FIG. 9 is a diagram illustrating a hardware configuration of a computer that executes an anomaly detection program according to the embodiment. -
FIG. 10 is a diagram illustrating a flow of anomaly IP address detection. -
FIG. 11 is a diagram for explaining IP2Vec. - Preferred embodiments of an information processing program, an information processing method, and an information processing apparatus of the present invention will be explained in detail below with reference to accompanying drawings. The embodiments are not intended to limit the disclosed technology.
- A functional configuration of an anomaly detection apparatus according to an embodiment will be explained first.
FIG. 1 is a diagram illustrating the functional configuration of the anomaly detection apparatus according to the embodiment. As illustrated inFIG. 1 , ananomaly detection apparatus 1 according to the embodiment has anencoding unit 11, a featureamount generation unit 12, an anomalyscore computation unit 13, and ananomaly determination unit 14. - The
encoding unit 11 receives aproxy log 3 from aproxy 2, receives an intrusion detection system (IDS) log 5 from anIDS 4, receives a firewall (FW) log 7 fromFW 6, and receives aterminal log 9 from aterminal 8. Theencoding unit 11 may receive other communication logs from other devices. - The
encoding unit 11 then encodes these logs.FIG. 2 is a diagram illustrating an example encoding of logs. InFIG. 2 , Src. IP refers to a source IP address, Dst. IP refers to a destination IP address, and Dst Port refers to a destination port number. i represents the log number, and, in this example, the total number of logs N = 8. wi represents the source IP address of the i-th log. C(wi) = {wi, i, ···, wc,i} represents communication information of the i-th log, and c represents the number of pieces of information constituting the communication information of wi. In this example, c = 2, w1,i is Dst. IP, and w2,i is Dst. Port. - As illustrated in
FIG. 2 , the Src. IP "10.***.01" is encoded into "1", the Src. IP "212.***.201" is encoded into "2", and the Src. IP "3.***.101" is encoded into "3". Also, the Dst. IP "20.***.02" is encoded into "4", the Dst. IP "11.***.70" is encoded into "5", and the Dst. IP "20.***.01" is encoded into "6". Also, the Dst. IP "20.***.03" is encoded into "7", and the Dst. IP "20.***.04" is encoded into "8". Also, the Dst. Port "22" is encoded into "9", and the Dst. Port "3389" is encoded into "10". - The feature
amount generation unit 12 receives an encoding result encoded by theencoding unit 11, and generates a feature amount of the source IP address. The featureamount generation unit 12 generates a feature amount that minimizes
- Herein, Lextraction is a loss function for feature extraction, and Ldetection is a loss function for anomaly detection. λ represents the coefficient for adjusting a trade-off between the loss function for feature extraction and the loss function for anomaly detection. An inequality λ > 0 holds.
- For example, in a case in which IP2Vec is used to extract a feature amount of a source IP address, Lextraction is defined by the following expression (1).
Expression 1
- Herein, U and U' respectively represent a weighting matrix from an input layer to a hidden layer and a weighting matrix from the hidden layer to a final layer in IP2Vec. P(wc,i|wi;U, U') represents the posterior probability that, when wi is determined, wc,i co-occur.
- For example, in a case in which support vector data description (SVDD) is used to perform anomaly detection, Ldetection is defined by the following expression (2).
Expression 2
- Herein, ϕ represents an arbitrary map, c0 represents a point in a mapping space H, and hj represents a feature amount of a source IP address j. c0 and hj are vectors. In expressions and drawings, vectors such as c0 and hj appear in boldface, while, in the rest, boldface is not used. ∥ϕ(hj) - c0∥2 represents the L2 norm of ϕ(hj)-c0.
-
FIG. 3 is a diagram for explaining generation of feature amounts by the featureamount generation unit 12. -
FIG. 3 illustrates a case in which IP2Vec is used for feature extraction and SVDD is used for anomaly detection. RegardingFIG. 3 ,FIG. 4A illustrates definitions of symbols for IP2Vec, andFIG. 4B illustrates definitions of symbols for SVDD. InFIG. 4A , a one-hot vector is a vector in which a single 1 is used for only one element and 0s are used for the other elements. - As illustrated in
FIG. 3 , a neural network (NN) with a single hidden layer is used in IP2Vec. The number of neurons in the input layer is p, the number of neurons in the hidden layer is d, and he number of neurons in the final layer is p. Herein, p represents the total number of patterns of communication information, and, of that number, q represents the number of unique source IP addresses. d represents the number of feature amounts extracted for the source IP addresses. Letting an input is x, an output h from the hidden layer is h = Ux, and an output y from the final layer is y = softmax(U'Th). U'T is a transpose of U'. - In an NN based on IP2Vec, training is conducted using (wi, C(wi)) as training data. In other words, training is conducted so that C(wi) is output in response to an input of wi. The input of wi is provided as a one-hot vector xi in which the number of components is p and the component corresponding to wi is 1. Training is conducted so that, in response to an input of xi, an output of a neuron corresponding to wc,i in the final layer is 1. The output of the neuron corresponding to wc,i in the final layer is P(wc,i|wi;U, U').
- In other words, in IP2Vec, U and U' are calculated so that the posterior probability P(wc,i|wi;U, U') that, when wi is determined, wc,i co-occur reaches a maximum, and the feature amount vector of the source IP address j is obtained as uj. Consequently, in IP2Vec, by minimizing the loss function defined by expression (1), the posterior probability P(wc,i|wi;U, U') is maximized, which extracts an optimum feature amount vector.
- The feature
amount generation unit 12 takes the output h = Ux = u at the hidden layer of IP2Vec as an input to SVDD. In SVDD, h is mapped by the map ϕ in the space H. The dimension of H is arbitrary. A loss function of SVDD is found in the following expression (3).
Expression 3
- Herein, r represents a radius of a sphere centering around c0 in the space H. If the space H is two-dimensional, r is a radius of a circle. If the space H is three-dimensional, r is a radius of a sphere. C represents a coefficient for adjusting a trade-off between the first term and the second term. The first term represents the size of the sphere, and the second term is the sum of squares of the distances from points out of the sphere, of the points of the feature amount vector uj of the source IP address j (j∈{1, ···, q}) mapped in the space H, to the surface of the sphere. A larger sphere enables the second term to be zero but the first term to be larger, while a smaller sphere enables the first term to be smaller but the second term to be larger with more points out of the sphere.
- In SVDD, by minimizing expression (3), r and c0 are determined so that points of the feature amount vector uj mapped in the space H gather as closer to c0 as possible. However, the feature
amount generation unit 12 minimizes expression (2) as an abbreviated version of expression (3). - In this manner, the feature
amount generation unit 12 connects the output hj = Uxj = uj at the hidden layer of IP2Vec to the loss function for anomaly detection, thereby enabling extraction of a feature amount suitable for anomaly detection. The featureamount generation unit 12 uses gradient descent, for example, as an optimization method to minimize the loss function L. - The explanation returns to
FIG. 1 now. The anomalyscore computation unit 13 computes an anomaly score by using the feature amount generated by the featureamount generation unit 12. The anomalyscore computation unit 13 computes an anomaly score Sj by using the following expression (4).
- The
anomaly determination unit 14 compares the anomaly score Sj with a predetermined threshold, and, if the anomaly score Sj is equal to or greater than the predetermined threshold, detects the source IP address j as an anomaly IP address. Theanomaly determination unit 14 decodes the encoded anomaly IP address and displays the address on a display device. - A flow of a process performed by the
anomaly detection apparatus 1 will be explained next.FIG. 5 is a flowchart illustrating the flow of a process performed by theanomaly detection apparatus 1. As illustrated inFIG. 5 , theanomaly detection apparatus 1 receives logs (step S1). In other words, theanomaly detection apparatus 1 receives theproxy log 3, theIDS log 5, theFW log 7, and theterminal log 9. - The
anomaly detection apparatus 1 then encodes the logs (step S2), and minimizes L (step S3). Theanomaly detection apparatus 1 then computes the anomaly score for each source IP address (step S4), determines whether the anomaly score is equal to or greater than a threshold (step S5), and, if the anomaly score is equal to or greater than the threshold, displays an anomaly IP address (step S6). - In this manner, the
anomaly detection apparatus 1 minimizes a loss function for feature extraction and a loss function for anomaly detection at the same time by minimizing L, which enables extraction of a feature amount suitable for anomaly detection. -
FIG. 6 is a diagram illustrating a flow of a process of computing anomaly scores by generating feature amounts that minimize L. As illustrated inFIG. 6 , the flow of the process of computing anomaly scores by generating feature amounts that minimize L is made up of two loops: (a) anomaly score computation (outer loop); and (b) inner loop. - As illustrated in
FIG. 6(a) , the input of the outer loop is a data set D = {(wi, C(wi))}i (line number 1), and the output is an anomaly score {Sj}j (line number 2). Theanomaly detection apparatus 1 randomly initializes a 0-th generation U and U', and initializes a 0-th generation c0 with a mean value of a 0-th generation ϕ(hj) (line number 3). - The
anomaly detection apparatus 1 then computes a first-generation to maximum generation U, U', and c0 by performing repeated computation (line numbers 4 to 7), and takes the maximum generation U and c0 as optimum values (line number 8). Theanomaly detection apparatus 1 computes k-th generation U and U' in the inner loop while fixing a (k-1)-th generation c0 during the repeated computation (line number 5), and computes a k-th generation c0 by using the k-th generation U (line number 6). Theanomaly detection apparatus 1 computes anomaly scores {Sj}j by using expression (4) from the optimum values of U and c0 (line number 9), and returns the anomaly scores {Sj}j (line number 10). - As illustrated in
FIG. 6(b) , the input of the inner loop is D and (k-1)-th generation U, U', and c0 (line number 11), and the output is the k-th generation U and U' (line number 12). In the inner loop, theanomaly detection apparatus 1 initializes 0-th batch of the k-th generation U and U' with the (k-1)-th generation U and U' (line number 13), and dives D into n mini batches D1, ···, Dn (line number 14). - The
anomaly detection apparatus 1 then computes a first batch to an n-th batch of the k-th generation U and U' by performing repeated computation (line numbers 15 to 19), and takes the n-th batch of the k-th generation U and U' as the k-th generation U and U' (line number 20). Theanomaly detection apparatus 1 then returns the k-th generation U and U' (line number 21). - The
anomaly detection apparatus 1 computes a gradient of L with respect to U and a gradient of L with respect to U' by using a mini batch Dm during the repeated computation (line number 16). Theanomaly detection apparatus 1 subtracts a value obtained by multiplying the gradient of L with respect to U by η from a (m-1)-th batch of the k-th generation U to compute a m-th batch of the k-th generation U (line number 17). Theanomaly detection apparatus 1 also subtracts a value obtained by multiplying the gradient of L with respect to U' by η from a (m-1)-th batch of the k-th generation U' to compute a m-th batch of the k-th generation U' (line number 18). - In this manner, the
anomaly detection apparatus 1 repeats a process the number of times of the maximum generation while adding 1 to k one at a time, the process of computing the k-th generation U and U' by using gradient descent while fixing the (k-1)-th generation c0 and computing the k-th generation c0 by using the computed k-th generation U. Consequently, theanomaly detection apparatus 1 can compute U and c0 that minimize L. - The effect of the
anomaly detection apparatus 1 will be explained next with reference toFIG. 7 andFIG. 8 .FIG. 7 is a diagram for explaining effective feature amounts generated by theanomaly detection apparatus 1.FIG. 7(a) illustrates ineffective feature amounts, andFIG. 7(b) illustrates effective feature amounts generated by theanomaly detection apparatus 1.FIG. 7 illustrates cases in which the number of feature amounts is two for convenience of explanation. - As illustrated in
FIG. 7(a) , in the case in which the feature amounts are ineffective, the separation boundary between normal and anomaly is unclear in the feature amount space, and thus there is a possibility that some detection algorithms are not capable of defining a correct separation boundary. There is a possibility that especially an algorithm having strong nonlinearity is not capable of defining a correct separation boundary. - Meanwhile, in the case in which the feature amounts generated by the
anomaly detection apparatus 1 are effective, the separation boundary between normal and anomaly is noticeable in the feature amount space, as illustrated inFIG. 7(b) , and thus many detection algorithms are capable of defining a correct separation boundary. Theanomaly detection apparatus 1 generates a feature amount effective for detection, which can improve the precision of anomaly detection. -
FIG. 8 is a diagram illustrating the effect of theanomaly detection apparatus 1.FIG. 8 illustrates a case in which coburg intrusion detection data sets (CIDDS)-001 are used as an example of data sets. The task of this example is to detect an IP address of an attacker from one hundred thousand IDS logs including about four thousand IP addresses as an anomaly IP address.FIG. 8(a) illustrates feature amounts of a conventional technology, andFIG. 8(b) illustrates feature amounts of the embodiment. Apoint 21 indicates an anomaly IP address, and other points indicate normal IP addresses. - As illustrated in
FIG. 8 , in the embodiment, the separation boundary between normal and anomaly is noticeable as compared with the conventional technology, and the feature amounts of the embodiment are effective as compared with the feature amounts of the conventional technology. Also, precision (PRC) = 0.90 in the embodiment, whereas PRC = 0.22 in the conventional technology. Herein, PRC refers to the ratio of being a truly anomaly IP address to IP address that have been determined as anomaly, and being closer to 1 is better. Consequently, theanomaly detection apparatus 1 has higher precision than the conventional technology. - As has been explained above, in the embodiment, the feature
amount generation unit 12 generates a feature amount that minimizes the loss function L = Lextraction + λLdetection, and can thus generate a feature amount effective for anomaly detection. Consequently, theanomaly detection apparatus 1 can improve the detection precision. - In the embodiment, the feature
amount generation unit 12 connects the output at the hidden layer of the NN based on IP2Vec to Ldetection, thereby minimizing the loss function L, which can minimize Lextraction and Ldetection at the same time. - In the embodiment, the case has been explained in which IP2Vec is used for feature amount extraction and SVDD is used for anomaly detection. However, the
anomaly detection apparatus 1 may use other methods for feature amount extraction and anomaly detection. In the embodiment, the case has been explained in which gradient descent is used for optimization. However, theanomaly detection apparatus 1 may use other methods for optimization. In the embodiment, the case has been explained in which an anomaly IP address is detected. However, theanomaly detection apparatus 1 may detect other abnormal values in categorical data. - While the
anomaly detection apparatus 1 has been explained in the embodiment, an anomaly detection program having the same functions can be obtained by achieving the configuration that theanomaly detection apparatus 1 has by means of software. Thus, a computer that executes the anomaly detection program will be explained. -
FIG. 9 is a diagram illustrating a hardware configuration of a computer that executes an anomaly detection program according to the embodiment. As illustrated inFIG. 9 , acomputer 50 has amain memory 51, a central processing unit (CPU) 52, a local area network (LAN)interface 53, and a hard disk drive (HDD) 54. Thecomputer 50 also has a super input/output (IO) 55, a digital visual interface (DVI) 56, and an optical disk drive (ODD) 57. - The
main memory 51 is a memory that stores therein computer programs, intermediate results of executing the computer programs, or the like. TheCPU 52 is a central processing unit that reads a computer program from themain memory 51 and executes the computer program. TheCPU 52 includes a chip set having a memory controller. - The
LAN interface 53 is an interface for connecting thecomputer 50 through a LAN to another computer. TheHDD 54 is a disk device that stores therein computer programs and data, and thesuper IO 55 is an interface for connecting input devices, such as a mouse and a keyboard. TheDVI 56 is an interface for connecting a liquid crystal display, and theODD 57 is a device that reads and writes DVDs and CD-Rs. - The
LAN interface 53 is connected to theCPU 52 with PCI Express (PCIe), and theHDD 54 and theODD 57 are connected to theCPU 52 via serial advanced technology attachment (SATA). Thesuper IO 55 is connected to theCPU 52 via low pin count (LPC). - The anomaly detection program to be executed on the
computer 50 is stored in a CD-R, which is an example of a recording medium readable by thecomputer 50, is read from the CD-R by theODD 57, and is installed in thecomputer 50. Alternatively, the anomaly detection program is stored in a database and the like of another computer system connected through theLAN interface 53, is read from such a database, and is installed in thecomputer 50. The installed anomaly detection program is then stored in theHDD 54, is read into themain memory 51, and is executed by theCPU 52. -
- 1
- Anomaly detection apparatus
- 2
- Proxy
- 3
- Proxy log
- 4
- IDS
- 5
- IDS log
- 6
- FW
- 7
- FW log
- 8
- Terminal
- 9
- Terminal log
- 11
- Encoding unit
- 12
- Feature amount generation unit
- 13
- Anomaly score computation unit
- 14
- Anomaly determination unit
- 21
- Point
- 50
- Computer
- 51
- Main memory
- 52
- CPU
- 53
- LAN interface
- 54
- HDD
- 55
- Super IO
- 56
- DVI
- 57
- ODD
Claims (7)
- An information processing program that causes a computer to execute a process comprising:identifying feature amounts for respective values in categorical data so as to minimize a third loss function based on a first loss function for extraction of feature amounts in categorical data and a second loss function for detection of abnormal values in the categorical data; anddetecting the abnormal values in the categorical data, based on the feature amounts identified for the respective values in the categorical data.
- The information processing program according to claim 1, wherein the third loss function is a function obtained by adding the first loss function to a function obtained by multiplying the second loss function by a value for adjusting a trade-off between the first loss function and the second loss function.
- The information processing program according to claim 1 or 2, whereinthe categorical data is source IP addresses,the identifying identifies feature amounts of source IP addresses included in a communication log by using the communication log, andthe detecting detects an anomaly IP address.
- The information processing program according to claim 3, whereinthe identifying identifies the feature amounts by using IP2Vec, andthe detecting detects the abnormal values by using SVDD.
- The information processing program according to claim 4, wherein the identifying connects an output at a hidden layer of a neural network used for identifying the feature amounts to the second loss function to minimize the third loss function.
- An information processing method for a computer to execute a process comprising:identifying feature amounts for respective values in categorical data so as to minimize a third loss function based on a first loss function for extraction of feature amounts in categorical data and a second loss function for detection of abnormal values in the categorical data; anddetecting the abnormal values in the categorical data, based on the feature amounts identified for the respective values in the categorical data.
- An information processing apparatus comprising:an identification unit configured to identify feature amounts for respective values in categorical data so as to minimize a third loss function based on a first loss function for extraction of feature amounts in categorical data and a second loss function for detection of abnormal values in the categorical data; anda detection unit configured to detect the abnormal values in the categorical data, based on the feature amounts identified by the identification unit for the respective values in the categorical data.
Applications Claiming Priority (1)
| Application Number | Priority Date | Filing Date | Title |
|---|---|---|---|
| PCT/JP2019/039499 WO2021070224A1 (en) | 2019-10-07 | 2019-10-07 | Information processing program, information processing method, and information processing device |
Publications (2)
| Publication Number | Publication Date |
|---|---|
| EP4044067A1 true EP4044067A1 (en) | 2022-08-17 |
| EP4044067A4 EP4044067A4 (en) | 2022-11-23 |
Family
ID=75437058
Family Applications (1)
| Application Number | Title | Priority Date | Filing Date |
|---|---|---|---|
| EP19948777.8A Withdrawn EP4044067A4 (en) | 2019-10-07 | 2019-10-07 | INFORMATION PROCESSING PROGRAM, INFORMATION PROCESSING METHOD AND INFORMATION PROCESSING DEVICE |
Country Status (4)
| Country | Link |
|---|---|
| US (1) | US20220222586A1 (en) |
| EP (1) | EP4044067A4 (en) |
| JP (1) | JP7347528B2 (en) |
| WO (1) | WO2021070224A1 (en) |
Families Citing this family (1)
| Publication number | Priority date | Publication date | Assignee | Title |
|---|---|---|---|---|
| CN118784342A (en) * | 2024-07-31 | 2024-10-15 | 北京积加科技有限公司 | Access device anomaly detection method, device, electronic device and computer medium |
Family Cites Families (1)
| Publication number | Priority date | Publication date | Assignee | Title |
|---|---|---|---|---|
| JP7009907B2 (en) | 2017-10-25 | 2022-01-26 | 沖電気工業株式会社 | Communication analysis device, communication analysis program, and communication analysis method |
-
2019
- 2019-10-07 EP EP19948777.8A patent/EP4044067A4/en not_active Withdrawn
- 2019-10-07 JP JP2021550957A patent/JP7347528B2/en active Active
- 2019-10-07 WO PCT/JP2019/039499 patent/WO2021070224A1/en not_active Ceased
-
2022
- 2022-03-30 US US17/707,976 patent/US20220222586A1/en not_active Abandoned
Also Published As
| Publication number | Publication date |
|---|---|
| WO2021070224A1 (en) | 2021-04-15 |
| JP7347528B2 (en) | 2023-09-20 |
| EP4044067A4 (en) | 2022-11-23 |
| JPWO2021070224A1 (en) | 2021-04-15 |
| US20220222586A1 (en) | 2022-07-14 |
Similar Documents
| Publication | Publication Date | Title |
|---|---|---|
| Kosmidis et al. | Machine learning and images for malware detection and classification | |
| CN111027069B (en) | Malicious software family detection method, storage medium and computing device | |
| CN111600874B (en) | User account detection method, device, electronic device, medium | |
| US20250209156A1 (en) | Security threat mitigation | |
| CN102265227B (en) | Method and apparatus for creating state estimation models in machine condition monitoring | |
| WO2019077656A1 (en) | Production facility monitoring device, production facility monitoring method, and production facility monitoring program | |
| CN111866004B (en) | Security assessment method, apparatus, computer system, and medium | |
| Karataş et al. | Big Data: controlling fraud by using machine learning libraries on Spark | |
| US12266077B2 (en) | Deep learning of entity resolution rules | |
| CN113344581B (en) | Service data processing method and device | |
| US20220222586A1 (en) | Recording medium, information processing method, and information processing apparatus | |
| CN115567224B (en) | Method for detecting abnormal block chain transaction and related product | |
| CN117540382A (en) | Malicious code detection method and device, electronic equipment and storage medium | |
| CN116743555A (en) | A robust multi-modal network operation and maintenance fault detection method, system and product | |
| KR20230061902A (en) | System and method for detecting source code vulnerability using machine learning | |
| CN116719919B (en) | Text processing method and device | |
| Zhao et al. | TAElog: a novel transformer autoencoder-based log anomaly detection method | |
| Pastika et al. | Machine learning-based malicious website detection using logistic regression algorithm | |
| CN115221519A (en) | Small sample malicious software classification method and system based on prototype network | |
| CN116502147A (en) | Training method and related equipment for anomaly detection model | |
| Sivanaiah et al. | Fake News Detection in Low Resource Language Using Machine Learning Techniques and SMOTE. | |
| CN114998289A (en) | Defect detection method and system for optimal vertex matching | |
| Živanović et al. | An application of machine learning methods for anomaly detection in internet advertising | |
| Xiong et al. | SMART: a robustness evaluation framework for neural networks | |
| Tete et al. | Using Deep Learning and Object-Oriented Metrics to Identify Critical Components in Object-Oriented Systems |
Legal Events
| Date | Code | Title | Description |
|---|---|---|---|
| STAA | Information on the status of an ep patent application or granted ep patent |
Free format text: STATUS: THE INTERNATIONAL PUBLICATION HAS BEEN MADE |
|
| PUAI | Public reference made under article 153(3) epc to a published international application that has entered the european phase |
Free format text: ORIGINAL CODE: 0009012 |
|
| STAA | Information on the status of an ep patent application or granted ep patent |
Free format text: STATUS: REQUEST FOR EXAMINATION WAS MADE |
|
| 17P | Request for examination filed |
Effective date: 20220331 |
|
| AK | Designated contracting states |
Kind code of ref document: A1 Designated state(s): AL AT BE BG CH CY CZ DE DK EE ES FI FR GB GR HR HU IE IS IT LI LT LU LV MC MK MT NL NO PL PT RO RS SE SI SK SM TR |
|
| A4 | Supplementary search report drawn up and despatched |
Effective date: 20221024 |
|
| RIC1 | Information provided on ipc code assigned before grant |
Ipc: G06N 3/08 20060101ALI20221018BHEP Ipc: H04L 9/40 20220101ALI20221018BHEP Ipc: G06N 20/10 20190101ALI20221018BHEP Ipc: G06F 21/55 20130101ALI20221018BHEP Ipc: G06N 3/04 20060101AFI20221018BHEP |
|
| DAV | Request for validation of the european patent (deleted) | ||
| DAX | Request for extension of the european patent (deleted) | ||
| STAA | Information on the status of an ep patent application or granted ep patent |
Free format text: STATUS: THE APPLICATION HAS BEEN WITHDRAWN |
|
| 18W | Application withdrawn |
Effective date: 20231023 |