EP4042153B1 - Fluid sample classification - Google Patents
Fluid sample classification Download PDFInfo
- Publication number
- EP4042153B1 EP4042153B1 EP20786567.6A EP20786567A EP4042153B1 EP 4042153 B1 EP4042153 B1 EP 4042153B1 EP 20786567 A EP20786567 A EP 20786567A EP 4042153 B1 EP4042153 B1 EP 4042153B1
- Authority
- EP
- European Patent Office
- Prior art keywords
- sample
- profile
- samples
- separation
- data
- Prior art date
- Legal status (The legal status is an assumption and is not a legal conclusion. Google has not performed a legal analysis and makes no representation as to the accuracy of the status listed.)
- Active
Links
Images



Classifications
-
- G—PHYSICS
- G01—MEASURING; TESTING
- G01N—INVESTIGATING OR ANALYSING MATERIALS BY DETERMINING THEIR CHEMICAL OR PHYSICAL PROPERTIES
- G01N30/00—Investigating or analysing materials by separation into components using adsorption, absorption or similar phenomena or using ion-exchange, e.g. chromatography or field flow fractionation
- G01N30/02—Column chromatography
- G01N30/86—Signal analysis
- G01N30/8624—Detection of slopes or peaks; baseline correction
- G01N30/8644—Data segmentation, e.g. time windows
-
- G—PHYSICS
- G01—MEASURING; TESTING
- G01N—INVESTIGATING OR ANALYSING MATERIALS BY DETERMINING THEIR CHEMICAL OR PHYSICAL PROPERTIES
- G01N27/00—Investigating or analysing materials by the use of electric, electrochemical, or magnetic means
- G01N27/26—Investigating or analysing materials by the use of electric, electrochemical, or magnetic means by investigating electrochemical variables; by using electrolysis or electrophoresis
- G01N27/416—Systems
- G01N27/447—Systems using electrophoresis
-
- G—PHYSICS
- G01—MEASURING; TESTING
- G01N—INVESTIGATING OR ANALYSING MATERIALS BY DETERMINING THEIR CHEMICAL OR PHYSICAL PROPERTIES
- G01N30/00—Investigating or analysing materials by separation into components using adsorption, absorption or similar phenomena or using ion-exchange, e.g. chromatography or field flow fractionation
- G01N30/02—Column chromatography
- G01N30/86—Signal analysis
- G01N30/8624—Detection of slopes or peaks; baseline correction
- G01N30/8631—Peaks
- G01N30/8634—Peak quality criteria
-
- G—PHYSICS
- G01—MEASURING; TESTING
- G01N—INVESTIGATING OR ANALYSING MATERIALS BY DETERMINING THEIR CHEMICAL OR PHYSICAL PROPERTIES
- G01N30/00—Investigating or analysing materials by separation into components using adsorption, absorption or similar phenomena or using ion-exchange, e.g. chromatography or field flow fractionation
- G01N30/02—Column chromatography
- G01N30/86—Signal analysis
- G01N30/8696—Details of Software
Definitions
- the present invention relates to methods and computer programs for the classification of samples which have been subject to a separation of their constituents, for example either by chromatography or electrophoresis, and more particularly to a method for classifying that sample based on the relative amount and constituent profile similarity to a reference sample.
- separation profiles often display multiple molecule-peak bands which may overlap.
- the analysis of such complex separation profiles adds significant cost and process time.
- separation profiles of complex samples can be difficult to analyse accurately which may introduce individual operator bias.
- there is a significant interest in fast automated analysis both to remove personal bias and to reduce the time of manufacturing biopharmaceuticals. Accordingly, there is a need for methods and computer programs for sample comparisons which can be both fast and automated if needed.
- One aspect of the invention is to provide a method as defined by appended claim 1, which may be implemented by a computer program, for comparison of different samples in a biopharmaceutical process. This is achieved with the introduction of a similarity score based on a two-dimensional analysis of the relative amount and constituent profile similarity to a reference sample.
- the relative amount is a measurement of the magnitude of different chemical constituents of a sample compared to the magnitude of constituents of a reference sample.
- the constituent profile similarity calculation is a measurement of similarity of a spatial, or temporal, profile of separated constituents generated by a separation process, in comparison to the profile(s) of one or multiple reference sample(s) which have been subject to the same separation process.
- the resulting two-dimensional data set forms the basis of classification of samples by providing a score of similarity to each sample which allows an estimate of the similarity of the sample of interest with the reference sample(s).
- the analysis method can be automated and implemented using computer analysis software together with suitable hardware, after the classification criteria has been set.
- One advantage is that such analysis method allows for a fast, non-operator dependent, classification scheme, in which limits for grouping samples can be easily set for automated analysis. This method allows for decisions to be made, for example if the manufacturing process is working satisfactory, or if separation parameters need to be changed. Additionally, it is common for separations of sample constituents to be incomplete, in other words measured bands of constituents overlap, leading to data which is difficult to analyse. The proposed method allows for such incomplete separation by comparing a measured profile with a reference in the manner described immediately above, rather than looking at certain peaks of measurements only.
- the terms “comprises,” “comprising,” “containing,” “having” and the like can have the meaning ascribed to them and can mean “includes,” “including,” and the like; “consisting essentially of or “consists essentially” likewise has the meaning ascribed in patent law and the term is open-ended, allowing for the presence of more than that which is recited so long as basic or novel characteristics of that which is recited is not changed by the presence of more than that which is recited, but excludes prior art embodiments.
- the present invention discloses a computer assisted method for automated analysis of samples which have been subject to a separation, which term includes forming into aliquots, fractions or streams of higher concentration of at least some of the samples' constituents.
- separation includes partial separation.
- the samples may be intermediates or a final product, in a biopharmaceutical manufacturing process.
- reference samples may either be subjected to a chemical separation and subsequent analysis when the process was created, or saved for a chemical separation analysis at a later stage. It is well known in the art of biopharmaceutical manufacturing how store reference samples for future analysis. Saved reference sample data may be used also for comparisons.
- the separation is performed by electrophoresis and the separated molecules are detected using colour stains or fluorescent dyes. Lane profiles of the electrophoretic separations are then compared, both in terms of how much sample constituent there is in the lane, and how similar the lane spatial profiles are, in comparison with a reference sample.
- the separation is performed by chromatography and separated molecules are detected using light absorbance measurements. Separation profiles are then compared, both in terms of how much sample was eluted from the chromatography column and how similar the sample profiles (also called chromatograms) are. In this way the reproducibility of different batches in a bioprocess manufacturing process can quickly assessed and decisions for the continuation of the process can be easily made.
- Fig. 1 Different protein samples were analysed using SDS-PAGE electrophoresis. The resulting Coomassie stained gel is shown in Fig. 1 . Some samples contain multiple proteins and the resulting lane profile after electrophoretic separation is complex, i.e. it exhibits many overlapping peaks. Such lane profiles are difficult to compare manually by eye.
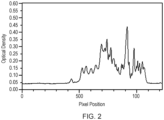
- the opacity, also termed optical density, of each lane or lanes of interest can be measured in relation to the spatial position along the lane. Such a measurement is given in the graph shown in Fig 2 for lane 5 of Fig 1 only, but the same measurement can be made for the other lanes shown in Fig 1 .
- This calculation compares two arrays of data, in this case sample lane profile data of the type graphically illustrated in Fig 2 , with a reference sample lane profile-in this case lane 8.
- the calculated value can range from -1 (negative correlation) to 0 (no correlation) to 1 (positive correlation).
- the Pearson pair-wise correlation calculation is one way to correlate different lane-profiles using a reference lane profile or a reference average of several lane profiles. However, there are many other ways to correlate lane profiles which may be used.
- the data points allow for easy classification by grouping of samples. Such classification allows for fast analysis and is not dependent on the users estimate of how similar different profiles are. Limits for grouping sample can be set based on:
- a photo-absorbance meter has been used to measure bands of chemical constituents, such as proteins, emerging from a column containing a chromatographic media (typical UV absorbance to measure protein concentration).
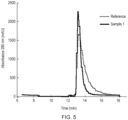
- the resultant data (called a chromatogram) is shown in Fig 5 with two chromatograms superimposed and the data set comprises a photodetector output reading, equivalent to the opacity/constituent amount measurements of Fig 2 , and temporal (time related) data, equivalent to the spatial/distance data shown also in Fig 2 .
- That data set is processed in the same way as described above, again to provide a comparison score of the constituent amount and chemical similarity with a reference sample or average sample data. That processed data then classifies the sample, for example to pass or fail result in a biopharmaceutical manufacturing process.
- Fig 5 the two chromatograms of two protein samples, with the same starting concentration, were compared using an ⁇ kta pure 25 chromatography system (available from Cytiva Life Sciences). The samples differed in type of Strep-Tactin tag used for separation. As a result, the chromatogram (i.e. the time separation profile) showed different peak shapes and subtle changes in separation profile.
- the similarity score analysis resulted in a similarity score of (0,90; 0,87) for sample 1, where 0,90 is the separation profile similarity score and 0,87 is the relative amount, which shows that sample 1 differed both in eluted amount, and also to some degree in the chemical binding to the separation matrix, compared to the reference sample.
- additional dimensions in the chromatography analysis may be, for example, one or more of: pH, conductivity and/or pressure.
- chromatography run data such as time-related data corresponding to pressure, pH and/or conductivity data can be used for the classification of samples.
- Such parameters may instead of a relative amount, or additionally thereto, be used as y-axis data (ordinate data) for a similarity plot.
- Fig. 6 shows a 2D similarity scatter plot of 185 chromatograms from different cycles in a protein purification process produced using an embodiment of the present invention.
- the plot shows how chromatogram relative peak area correlates to separation profile similarity score.
- Such plot data demonstrated that using embodiments of the present invention many runs can be analyzed at high resolution, and can further identify data points that cannot readily be determined, for example, by a skilled operator.
- Various embodiments of the invention may thus be used to alert an operator to outlier values and/or could be used in automated processing systems to optimise control parameters for a chromatography based bio-processing system.
- Fig. 7 shows a Graphical User Interface for presenting results produced using an embodiment of the present invention.
- the GUI includes a window that provides 2D visualization of data.
- a similarity score vs. relative volume plot is shown.
- Such a 2D scatter plot provides for easy user visualization.
- the GUI may also, or alternatively, enable user selection of reference profiles so as to display profiles, for example electrophoresis lanes or chromatograms, and show the two-dimensional sample data in a scatter plot.
- the 2D scatter plot(s) can enable a user to select a region of interest for analysis, remove all data points from an analysis which have reached the maximum limit of the detector and/or use the scatter plot to set limits for grouping samples into different groups.
- various embodiments may also allow a scatter plot to track a protein purification process, for example, by using trend lines or colour gradients.
- Fig. 8 shows a method according to various embodiments of the present invention.
- the method 100 comprises the steps of: a. at least partially separating 110 one or more of the chemical constituents of the fluid sample; b. measuring and recording 120 the amount of separated chemical constituents of the sample during, or after, the chemical separation; c. measuring and recording 130 the spatial or time separation profile of sample constituents, during or after separation, and providing a data set of the same; d. comparing 140 the amount of said separated constituents to one or more reference samples; e. comparing 150 the spatial or time separation profile to the corresponding profile of the or each reference sample; f. assigning 160 a similarity score to the sample based on the similarity of the amount or the profile comparisons of the separated constituents, as performed under steps d. 140 and e. 150 above, or both, with the equivalent amount and/or profile of the or each reference sample respectively; g. providing 170 a classification of the sample based on the similarity score.
- the method 100 may include one or more of the following steps:
- the method 100 may include one or more of the following steps:
Landscapes
- Health & Medical Sciences (AREA)
- Life Sciences & Earth Sciences (AREA)
- Chemical & Material Sciences (AREA)
- General Health & Medical Sciences (AREA)
- Physics & Mathematics (AREA)
- Analytical Chemistry (AREA)
- Biochemistry (AREA)
- General Physics & Mathematics (AREA)
- Immunology (AREA)
- Pathology (AREA)
- Molecular Biology (AREA)
- Chemical Kinetics & Catalysis (AREA)
- Electrochemistry (AREA)
- Quality & Reliability (AREA)
- Engineering & Computer Science (AREA)
- Investigating Or Analysing Biological Materials (AREA)
Description
- The present invention relates to methods and computer programs for the classification of samples which have been subject to a separation of their constituents, for example either by chromatography or electrophoresis, and more particularly to a method for classifying that sample based on the relative amount and constituent profile similarity to a reference sample.
- In the manufacturing of biopharmaceuticals such as vaccines, antibodies, recombinant proteins, gene therapy vectors etc. several chromatographic separation steps are usually needed to remove various contaminants and impurities from the product. During each step of the manufacturing process, there is a need to check both amount and purity compared to reference samples.
- Also known, for example from
US 2018/0031530 Al , is a technique for product quality control in which a comparison between a product and its standard reference is provided. - However, separation profiles often display multiple molecule-peak bands which may overlap. The analysis of such complex separation profiles adds significant cost and process time. Furthermore, separation profiles of complex samples can be difficult to analyse accurately which may introduce individual operator bias. Hence, there is a significant interest in fast automated analysis, both to remove personal bias and to reduce the time of manufacturing biopharmaceuticals. Accordingly, there is a need for methods and computer programs for sample comparisons which can be both fast and automated if needed.
- One aspect of the invention is to provide a method as defined by appended
claim 1, which may be implemented by a computer program, for comparison of different samples in a biopharmaceutical process. This is achieved with the introduction of a similarity score based on a two-dimensional analysis of the relative amount and constituent profile similarity to a reference sample. The relative amount is a measurement of the magnitude of different chemical constituents of a sample compared to the magnitude of constituents of a reference sample. The constituent profile similarity calculation is a measurement of similarity of a spatial, or temporal, profile of separated constituents generated by a separation process, in comparison to the profile(s) of one or multiple reference sample(s) which have been subject to the same separation process. The resulting two-dimensional data set forms the basis of classification of samples by providing a score of similarity to each sample which allows an estimate of the similarity of the sample of interest with the reference sample(s). The analysis method can be automated and implemented using computer analysis software together with suitable hardware, after the classification criteria has been set. - One advantage is that such analysis method allows for a fast, non-operator dependent, classification scheme, in which limits for grouping samples can be easily set for automated analysis. This method allows for decisions to be made, for example if the manufacturing process is working satisfactory, or if separation parameters need to be changed. Additionally, it is common for separations of sample constituents to be incomplete, in other words measured bands of constituents overlap, leading to data which is difficult to analyse. The proposed method allows for such incomplete separation by comparing a measured profile with a reference in the manner described immediately above, rather than looking at certain peaks of measurements only.
- Further suitable embodiments of the invention are described in the dependent claims.
-
-
Fig. 1 shows an image of an analysed Coomassie stained gel. Different samples (1-10) were separated on a polyacrylamide gel and subsequently stained with the Coomassie stain. The gel was analysed using the analysis software Image Quant TL (available from Cytiva Life Sciences). -
Fig. 2 shows the electrophoretic lane profile ofsample 5 inFig. 1 . -
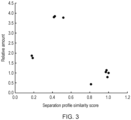
Fig. 3 shows the two-dimensional similarity score plot of the samples inFig. 1 andFig. 2 . The relative amount of sample (y-axis) and the lane profile similarity score (x-axis) are displayed in one plot. In this example,sample number 8 was the reference sample. -
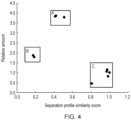
Fig. 4 shows one way of grouping the different samples ofFig. 3 into three groups (A-C). -
Fig. 5 shows chromatograms for two protein samples. -
Fig. 6 shows a 2D similarity scatter plot of 185 chromatograms from different cycles in a protein purification process produced using an embodiment of the present invention. -
Fig. 7 shows a Graphical User Interface (GUI) for presenting results produced using an embodiment of the present invention. -
Fig. 8 shows a method according to various embodiments of the present invention. - As used herein, the terms "comprises," "comprising," "containing," "having" and the like can have the meaning ascribed to them and can mean "includes," "including," and the like; "consisting essentially of or "consists essentially" likewise has the meaning ascribed in patent law and the term is open-ended, allowing for the presence of more than that which is recited so long as basic or novel characteristics of that which is recited is not changed by the presence of more than that which is recited, but excludes prior art embodiments.
- In one aspect, the present invention discloses a computer assisted method for automated analysis of samples which have been subject to a separation, which term includes forming into aliquots, fractions or streams of higher concentration of at least some of the samples' constituents. The term separation includes partial separation.
- In certain embodiments, the samples may be intermediates or a final product, in a biopharmaceutical manufacturing process. In addition, reference samples may either be subjected to a chemical separation and subsequent analysis when the process was created, or saved for a chemical separation analysis at a later stage. It is well known in the art of biopharmaceutical manufacturing how store reference samples for future analysis. Saved reference sample data may be used also for comparisons.
- In some embodiments, the separation is performed by electrophoresis and the separated molecules are detected using colour stains or fluorescent dyes. Lane profiles of the electrophoretic separations are then compared, both in terms of how much sample constituent there is in the lane, and how similar the lane spatial profiles are, in comparison with a reference sample.
- In some embodiments, the separation is performed by chromatography and separated molecules are detected using light absorbance measurements. Separation profiles are then compared, both in terms of how much sample was eluted from the chromatography column and how similar the sample profiles (also called chromatograms) are. In this way the reproducibility of different batches in a bioprocess manufacturing process can quickly assessed and decisions for the continuation of the process can be easily made.
- Different protein samples were analysed using SDS-PAGE electrophoresis. The resulting Coomassie stained gel is shown in
Fig. 1 . Some samples contain multiple proteins and the resulting lane profile after electrophoretic separation is complex, i.e. it exhibits many overlapping peaks. Such lane profiles are difficult to compare manually by eye. The opacity, also termed optical density, of each lane or lanes of interest can be measured in relation to the spatial position along the lane. Such a measurement is given in the graph shown inFig 2 forlane 5 ofFig 1 only, but the same measurement can be made for the other lanes shown inFig 1 . Using the data generated from the graph ofFig 2 (which need not be graphically represented but could exist purely as data), the lane profiles were analysed both in terms of amount of protein (opacity =optical density in this case) and how the different lane profiles correlate spatially, using the Pearson correlation coefficient. This calculation compares two arrays of data, in this case sample lane profile data of the type graphically illustrated inFig 2 , with a reference sample lane profile-in thiscase lane 8. The calculated value can range from -1 (negative correlation) to 0 (no correlation) to 1 (positive correlation). The Pearson pair-wise correlation calculation is one way to correlate different lane-profiles using a reference lane profile or a reference average of several lane profiles. However, there are many other ways to correlate lane profiles which may be used. - The results of the correlation calculation for each of the ten lanes shown in
Fig 1 are displayed in a two-dimensional plot inFig. 3 . Where it becomes apparent that certain lanes correlate well to the reference sample in terms of the amount of a sample constituent separated proteins in this lane give rise to the opacity bands shown inFig 1 and are given a score close to 1 (y axis), and also the entire lane profile for certain lanes correlate well with the reference lane and are thus given a score close to 1 (x axis). These data provide two similarity comparisons: the amount of chemical constituent (e.g. protein) similarity (y axis); and the actual chemical constituent profile similarity (x axis). It is also apparent that the samples in this example fall into different groups based on the separation profile similarity score. - As shown in
Fig 4 , the data points allow for easy classification by grouping of samples. Such classification allows for fast analysis and is not dependent on the users estimate of how similar different profiles are. Limits for grouping sample can be set based on: - A) The amount of sample similarity only;
- B) The chemical separation profile similarity only;
- C) The amount of sample and chemical separation profile similarity.
- Thus, depending on which samples have been analysed, different rules for grouping samples may be applied. For example, only group C samples in
Fig 4 are considered to be classified as falling within an acceptable similarity to the reference sample. - A similar technique as described above can be applied to chromatographic separations as shown in
Fig 5 , where a photo-absorbance meter has been used to measure bands of chemical constituents, such as proteins, emerging from a column containing a chromatographic media (typical UV absorbance to measure protein concentration). The resultant data (called a chromatogram) is shown inFig 5 with two chromatograms superimposed and the data set comprises a photodetector output reading, equivalent to the opacity/constituent amount measurements ofFig 2 , and temporal (time related) data, equivalent to the spatial/distance data shown also inFig 2 . That data set is processed in the same way as described above, again to provide a comparison score of the constituent amount and chemical similarity with a reference sample or average sample data. That processed data then classifies the sample, for example to pass or fail result in a biopharmaceutical manufacturing process. InFig 5 , the two chromatograms of two protein samples, with the same starting concentration, were compared using an Äkta pure 25 chromatography system (available from Cytiva Life Sciences). The samples differed in type of Strep-Tactin tag used for separation. As a result, the chromatogram (i.e. the time separation profile) showed different peak shapes and subtle changes in separation profile. For this part of the chromatogram, the similarity score analysis resulted in a similarity score of (0,90; 0,87) forsample 1, where 0,90 is the separation profile similarity score and 0,87 is the relative amount, which shows thatsample 1 differed both in eluted amount, and also to some degree in the chemical binding to the separation matrix, compared to the reference sample. - Those skilled in the art would be aware that various analyses could be performed in accordance with the present invention. For example, when considering chromatography examples, additional dimensions in the chromatography analysis may be, for example, one or more of: pH, conductivity and/or pressure. Hence, chromatography run data such as time-related data corresponding to pressure, pH and/or conductivity data can be used for the classification of samples. Such parameters may instead of a relative amount, or additionally thereto, be used as y-axis data (ordinate data) for a similarity plot.
-
Fig. 6 shows a 2D similarity scatter plot of 185 chromatograms from different cycles in a protein purification process produced using an embodiment of the present invention. The plot shows how chromatogram relative peak area correlates to separation profile similarity score. Such plot data demonstrated that using embodiments of the present invention many runs can be analyzed at high resolution, and can further identify data points that cannot readily be determined, for example, by a skilled operator. Various embodiments of the invention may thus be used to alert an operator to outlier values and/or could be used in automated processing systems to optimise control parameters for a chromatography based bio-processing system. - In
Figure 6 , data was derived for each of the 185 chromatograms from purification cycles using Fibro HiTrap PrismA™ chromatography units in an Äkta Pure 25™ system with pH step elution. The reference sample was chosen as the first chromatogram in the series. All chromatograms were apparently very similar but a Pearson correlation coefficient calculation was used to detect two runs which differed in terms of peak shape. These two values appear as outliers to the left ofFigure 6 . After inspection, all cycle chromatograms were judged to be acceptable. (Note: Some values in these chromatograms were saturated and peak area is therefore not proportional to relative amount for this particular data-set.) -
Fig. 7 shows a Graphical User Interface for presenting results produced using an embodiment of the present invention. The GUI includes a window that provides 2D visualization of data. In this example, a similarity score vs. relative volume plot is shown. Such a 2D scatter plot provides for easy user visualization. The GUI may also, or alternatively, enable user selection of reference profiles so as to display profiles, for example electrophoresis lanes or chromatograms, and show the two-dimensional sample data in a scatter plot. - Furthermore, in various embodiments, the 2D scatter plot(s) can enable a user to select a region of interest for analysis, remove all data points from an analysis which have reached the maximum limit of the detector and/or use the scatter plot to set limits for grouping samples into different groups. Moreover, various embodiments may also allow a scatter plot to track a protein purification process, for example, by using trend lines or colour gradients.
-
Fig. 8 shows a method according to various embodiments of the present invention. Themethod 100 comprises the steps of: a. at least partially separating 110 one or more of the chemical constituents of the fluid sample; b. measuring andrecording 120 the amount of separated chemical constituents of the sample during, or after, the chemical separation; c. measuring andrecording 130 the spatial or time separation profile of sample constituents, during or after separation, and providing a data set of the same; d. comparing 140 the amount of said separated constituents to one or more reference samples; e. comparing 150 the spatial or time separation profile to the corresponding profile of the or each reference sample; f. assigning 160 a similarity score to the sample based on the similarity of the amount or the profile comparisons of the separated constituents, as performed under steps d. 140 and e. 150 above, or both, with the equivalent amount and/or profile of the or each reference sample respectively; g. providing 170 a classification of the sample based on the similarity score. - In various embodiments, relating to electrophoresis, the
method 100 may include one or more of the following steps: - 1a. Selecting region of interest in an image. For electrophoresis a user may create a lane box, for example, using a GUI of the type referred to above.
- 2a. Optionally, saturated regions of the lane profiles may then be excluded from analysis, i.e. regions in which the detector has reached its maximum value. This may be automated or could be user driven.
- 3a. Correcting for uneven migration. A user may adjust a lane box and lanes to correct for uneven migration across an electrophoresis gel. Optionally, the lane profile scales may be corrected by comparing to marker samples, i.e. samples with known molecular weight, in other lanes, either by the user or automatically.
- In various embodiments, relating to chromatography, the
method 100 may include one or more of the following steps: - 1b. Selecting a region of interest in chromatogram either manually or automatically by way of analysis software. This step is optional, alternatively a full chromatogram can be analyzed.
- 2b. Optionally, saturated regions of the lane profiles are excluded from an analysis, i.e. regions in which the detector has reached its maximum value.
- 3b. Aligning of chromatograms for comparison is undertaken. Chromatogram alignment can be performed either automatically by a software algorithm automatically or by the user. Alignment is typically based on the performed chromatography operations, for example start of a phase, or time at elution of a known reference sample. This step is optional, and in some cases no alignment is needed.
- The following steps may then be applied to both electrophoresis analysis and chromatogram analysis:
- 4. If data-sets have a different number of data points, individual electrophoresis lane profiles or chromatograms may then either be sampled or interpolated to obtain the same number of data points per sample.
- 5. Analysis of all data points or user a defined analysis range may then be performed. For example, in some cases there is only one peak of interest, then an analysis range may adjusted accordingly either automatically or by the user.
- 6. The integrated signal of samples of a lane or chromatogram is calculated. Alternatively, the volume sum of all detected bands, or peaks, are summed for each lane.
- 7. In a preferred embodiment, all possible pair-wise comparisons of the N samples are made. This results in N X N arrays. For example, one array for relative amounts, and one for profile similarity score. Such may also be used to compare pressure, pH and/or conductivity data-sets for chromatography.
- 8. A GUI allows user to select one reference lane or chromatogram and a 2D scatter plot may then be generated showing relative amounts on the y-axis and profile similarity score on the x-axis.
- Various embodiments and features of the present invention have thus been described. This written description further uses examples to disclose the invention, including the preferred mode, and is provided to enable any person skilled in the art to practice the invention, including making and using any devices or systems and performing any incorporated methods. The scope of the invention is defined by the claims.
Claims (14)
- A method (100) for classifying a fluid sample, which method comprises the steps of:a) at least partially separating (110) one or more of the chemical constituents of the fluid sample;b) measuring and recording (120) data relating to the separated chemical constituents of the sample during, or after, the chemical separation, including an amount thereof;c) measuring and recording (130) the spatial or time separation profile of sample constituents, during or after separation, and providing a data set of the same;d) comparing (140) the amount of said separated constituents to one or more reference samples;e) comparing (150) the spatial or time separation profile to the corresponding profile of the or each reference sample; characterised by:f) assigning a similarity score (160) to the sample based on the similarity of the amount and the profile comparisons of the separated constituents, as performed under steps d (140) and e (150) above, with the amount and profile of the or each reference sample, respectively; andg) providing (170) a classification of the sample based on the similarity score.
- The method (100) according to claim 1, wherein plural samples are classified, wherein step b) includes providing (120) a data set of the amount of the or each separated constituent for each of the samples, wherein step c) includes providing (130) a data set of the spatial separation profile or time separation profile for each sample, and wherein those two data sets are processed by an algorithm to provide a two-dimensional sample data set for each sample which is used in steps d) to g).
- The method (100) according to claim 2, wherein different groups of samples represent pass or fail results in a quality control of a biopharmaceutical manufacturing process.
- The method (100) according to claim 2 or 3, wherein the presence, or absence, of samples in different groups lead to changes in a biopharmaceutical manufacturing process.
- The method (100) according to any preceding claim, wherein the chemical separation is electrophoresis.
- The method (100) according to any preceding claim, wherein the chemical separation is chromatography.
- The method (100) according to Claim 6 where chromatography run data, for example time-series of pressure, pH and/or conductivity data, or a combination of these, is used for the classification of samples.
- The method (100) according to any preceding claim, wherein the spatial or time separation profile similarity score is calculated using the Pearson correlation function.
- A computer program, comprising program code for performing at least the method (100) steps d), e), f) and g) of claim 1 when the program is run on a computer having means for processing the recorded data obtained by the steps b) and c) of claim 1.
- The computer program according to claim 9, further comprising program code for controlling a graphical user interface, GUI, for user selection and/or presentation of reference profiles and/or regions of interest for analysis and/or data, and/or electrophoresis lanes and/or chromatograms and/or a two-dimensional scatter plot.
- The computer program according to claim 10, wherein the program code for controlling the GUI is further configured to enable a user to remove data points from an analysis which have reached a maximum limit of a detector.
- The computer program according to claim 10 or 11, wherein the program code for controlling the GUI is configured to present a two-dimensional scatter plot which can be used to set limits for grouping samples into different groups and/or track a protein purification process.
- The computer program according to claim 12, wherein the program code for controlling the GUI is configured to present trend lines and/or colour gradients to aid in tracking a protein purification process.
- A biopharmaceutical manufacturing plant for checking and/or controlling a biopharmaceutical manufacturing process, the biopharmaceutical manufacturing plant comprising:a. means for at least partially separating (110) one or more of the chemical constituents of the fluid sample;b. means for measuring and recording (120) data relating to the separated chemical constituents of the sample during, or after, the chemical separation, such as an amount thereof;c. means for measuring and recording (130) the spatial or time separation profile of sample constituents, during or after separation, and providing a data set of the same;d. means for comparing (140) the amount of said separated constituents to one or more reference samples;e. means for comparing (150) the spatial or time separation profile to the corresponding profile of the or each reference sample; further characterised by:f. means for assigning a similarity score (160) to the sample based on the similarity of the amount and the profile comparisons of the separated constituents, as performed under steps d (140) and e (150) above; andg. means for providing (170) a classification of the sample based on the similarity score.
Applications Claiming Priority (2)
| Application Number | Priority Date | Filing Date | Title |
|---|---|---|---|
| GB201914575A GB201914575D0 (en) | 2019-10-09 | 2019-10-09 | Fluid Sample Classification |
| PCT/EP2020/078119 WO2021069493A1 (en) | 2019-10-09 | 2020-10-07 | Fluid sample classification |
Publications (2)
| Publication Number | Publication Date |
|---|---|
| EP4042153A1 EP4042153A1 (en) | 2022-08-17 |
| EP4042153B1 true EP4042153B1 (en) | 2025-01-29 |
Family
ID=68541360
Family Applications (1)
| Application Number | Title | Priority Date | Filing Date |
|---|---|---|---|
| EP20786567.6A Active EP4042153B1 (en) | 2019-10-09 | 2020-10-07 | Fluid sample classification |
Country Status (6)
| Country | Link |
|---|---|
| US (1) | US20220349864A1 (en) |
| EP (1) | EP4042153B1 (en) |
| JP (1) | JP7652768B2 (en) |
| CN (1) | CN114450588B (en) |
| GB (1) | GB201914575D0 (en) |
| WO (1) | WO2021069493A1 (en) |
Family Cites Families (20)
| Publication number | Priority date | Publication date | Assignee | Title |
|---|---|---|---|---|
| SU368528A1 (en) * | 1970-08-27 | 1973-01-26 | METHOD OF ANALYSIS OF ELECTROPROGRAMM | |
| DE3644969C2 (en) * | 1985-08-17 | 1994-05-05 | Olympus Optical Co | Process for processing and displaying an electrophoretic image |
| US6710871B1 (en) * | 1997-06-09 | 2004-03-23 | Guava Technologies, Inc. | Method and apparatus for detecting microparticles in fluid samples |
| US6816789B2 (en) * | 2001-04-19 | 2004-11-09 | Varian, Inc. | Method and system for analyzing chromatograms |
| US6982029B2 (en) * | 2001-05-07 | 2006-01-03 | Spectramedix Llc | Electrophoretic method and system having internal lane standards for color calibration |
| JP2003029304A (en) * | 2001-07-13 | 2003-01-29 | Mitsubishi Chemicals Corp | Electrophoresis image processing method, electrophoresis image processing device, electrophoresis image processing program, electrophoresis image display method, electrophoresis image display device, and electrophoresis image display program |
| AU2006274029B2 (en) * | 2005-07-25 | 2011-07-14 | Metanomics Gmbh | Means and methods for analyzing a sample by means of chromatography-mass spectrometry |
| DE102009028295A1 (en) * | 2009-07-31 | 2011-02-17 | Endress + Hauser Conducta Gesellschaft für Mess- und Regeltechnik mbH + Co. KG | Method for determining a parameter, in particular the chemical oxygen demand (COD) or the total organic carbon content (TOC), of a liquid sample |
| CN102586448B (en) * | 2012-03-06 | 2015-01-14 | 北华大学 | Deer antler capillary electrophoresis DNA (deoxyribonucleic acid) fingerprint spectrum and identification method |
| GB201415273D0 (en) * | 2014-08-28 | 2014-10-15 | Thermo Fisher Scient Bremen | Data processing device and method for the evaluation of mass spectrometry data |
| GB201511508D0 (en) * | 2015-07-01 | 2015-08-12 | Ge Healthcare Bio Sciences Ab | Method for determining a size of biomolecules |
| CN105891364A (en) * | 2016-04-11 | 2016-08-24 | 北京洛奇临床检验所股份有限公司 | Method and kit for detecting melatonin in saliva with HPLC-MS/MS (high performance liquid chromatography-tandem mass spectrometry) technology |
| CN107522768A (en) * | 2016-06-20 | 2017-12-29 | 湖北生物医药产业技术研究院有限公司 | The detection method of protein desamidization and its application |
| EP3276343B1 (en) * | 2016-07-28 | 2019-08-28 | Alpha M.O.S. | Method and device for characterising an analyte |
| BR102016019770B1 (en) * | 2016-08-26 | 2021-11-16 | Optionline LLC | METHODOLOGY FOR IDENTIFICATION OF MATERIALS THROUGH METHODS OF COMPARISON BETWEEN SPECTRUM OF A SAMPLE AGAINST MATERIAL SPECTRUM REFERENCE LIBRARY |
| JP7057912B2 (en) * | 2017-04-14 | 2022-04-21 | 次世代バイオ医薬品製造技術研究組合 | Protein separation and purification method and equipment |
| CN107784192A (en) * | 2017-09-15 | 2018-03-09 | 山东大学 | Fingerprint similarity computational methods, device and sample quality evaluation system |
| WO2019126693A1 (en) * | 2017-12-22 | 2019-06-27 | Quest Diagnostics Investments Llc | Automated analysis of analytical gels and blots |
| JP7081385B2 (en) * | 2018-08-03 | 2022-06-07 | 東ソー株式会社 | How to calculate the similarity of chromatograms |
| CN110033449B (en) * | 2019-04-15 | 2023-06-27 | 苏州金唯智生物科技有限公司 | Method, device, equipment and storage medium for identifying electrophoresis chart |
-
2019
- 2019-10-09 GB GB201914575A patent/GB201914575D0/en not_active Ceased
-
2020
- 2020-10-07 EP EP20786567.6A patent/EP4042153B1/en active Active
- 2020-10-07 CN CN202080070768.XA patent/CN114450588B/en active Active
- 2020-10-07 JP JP2022521476A patent/JP7652768B2/en active Active
- 2020-10-07 US US17/764,452 patent/US20220349864A1/en active Pending
- 2020-10-07 WO PCT/EP2020/078119 patent/WO2021069493A1/en not_active Ceased
Also Published As
| Publication number | Publication date |
|---|---|
| JP7652768B2 (en) | 2025-03-27 |
| US20220349864A1 (en) | 2022-11-03 |
| CN114450588A (en) | 2022-05-06 |
| CN114450588B (en) | 2025-06-24 |
| EP4042153A1 (en) | 2022-08-17 |
| JP2022551505A (en) | 2022-12-09 |
| GB201914575D0 (en) | 2019-11-20 |
| WO2021069493A1 (en) | 2021-04-15 |
Similar Documents
| Publication | Publication Date | Title |
|---|---|---|
| US6554987B1 (en) | Method and apparatus for alignment of signals for use in DNA base-calling | |
| US7279679B2 (en) | Methods and systems for peak detection and quantitation | |
| US10386346B2 (en) | System and method for processing chromatogram data | |
| US10354421B2 (en) | Apparatuses and methods for annotated peptide mapping | |
| CN113711031B (en) | Analysis device | |
| CA2133412A1 (en) | Improved method for interpreting complex data and detecting abnormal instrument or process behavior | |
| CN109475795B (en) | System and method for automatic alignment, calibration and normalization of electrophoresis data | |
| Giddings et al. | An adaptive, object oriented strategy for base calling in DNA sequence analysis | |
| US5932080A (en) | Mobility-based and normalized capillary electrophoresis | |
| US5098536A (en) | Method of improving signal-to-noise in electropherogram | |
| EP1600771B1 (en) | Peak pattern calibration | |
| JPWO2020044435A1 (en) | Data analysis method, data analysis device, and learning model creation method for data analysis | |
| CN118795074A (en) | Waveform analysis method, waveform analysis device, and analysis device | |
| US20240210366A1 (en) | Data processing method and device for chromatogram, chromatographic device, and recording medium | |
| CA2443650C (en) | Method and system for comparing and/or classifying chromatograms | |
| CN107209151A (en) | Interference Detection and peak value deconvolution of interest | |
| WO2021064924A1 (en) | Waveform analysis method and waveform analysis device | |
| AU2002307141A1 (en) | Method and system for analysing chromatograms | |
| US20220349864A1 (en) | Fluid sample classification | |
| Füssl et al. | Cation exchange chromatography on a monodisperse 3 µm particle enables extensive analytical similarity assessment of biosimilars | |
| US12482152B2 (en) | Analyzer and display method | |
| Labyed et al. | Automatic segmentation and band detection of protein images based on the standard deviation profile and its derivative | |
| Duarte et al. | Chromatographic response functions | |
| CA2260779C (en) | Mobility-based and normalized capillary electrophoresis | |
| Berlage | Guided Image Interpretation in Proteome Analysis |
Legal Events
| Date | Code | Title | Description |
|---|---|---|---|
| STAA | Information on the status of an ep patent application or granted ep patent |
Free format text: STATUS: UNKNOWN |
|
| STAA | Information on the status of an ep patent application or granted ep patent |
Free format text: STATUS: THE INTERNATIONAL PUBLICATION HAS BEEN MADE |
|
| PUAI | Public reference made under article 153(3) epc to a published international application that has entered the european phase |
Free format text: ORIGINAL CODE: 0009012 |
|
| STAA | Information on the status of an ep patent application or granted ep patent |
Free format text: STATUS: REQUEST FOR EXAMINATION WAS MADE |
|
| 17P | Request for examination filed |
Effective date: 20220317 |
|
| AK | Designated contracting states |
Kind code of ref document: A1 Designated state(s): AL AT BE BG CH CY CZ DE DK EE ES FI FR GB GR HR HU IE IS IT LI LT LU LV MC MK MT NL NO PL PT RO RS SE SI SK SM TR |
|
| DAV | Request for validation of the european patent (deleted) | ||
| DAX | Request for extension of the european patent (deleted) | ||
| P01 | Opt-out of the competence of the unified patent court (upc) registered |
Effective date: 20230526 |
|
| GRAP | Despatch of communication of intention to grant a patent |
Free format text: ORIGINAL CODE: EPIDOSNIGR1 |
|
| STAA | Information on the status of an ep patent application or granted ep patent |
Free format text: STATUS: GRANT OF PATENT IS INTENDED |
|
| INTG | Intention to grant announced |
Effective date: 20240805 |
|
| GRAJ | Information related to disapproval of communication of intention to grant by the applicant or resumption of examination proceedings by the epo deleted |
Free format text: ORIGINAL CODE: EPIDOSDIGR1 |
|
| STAA | Information on the status of an ep patent application or granted ep patent |
Free format text: STATUS: REQUEST FOR EXAMINATION WAS MADE |
|
| GRAP | Despatch of communication of intention to grant a patent |
Free format text: ORIGINAL CODE: EPIDOSNIGR1 |
|
| STAA | Information on the status of an ep patent application or granted ep patent |
Free format text: STATUS: GRANT OF PATENT IS INTENDED |
|
| INTC | Intention to grant announced (deleted) | ||
| INTG | Intention to grant announced |
Effective date: 20241004 |
|
| GRAS | Grant fee paid |
Free format text: ORIGINAL CODE: EPIDOSNIGR3 |
|
| GRAA | (expected) grant |
Free format text: ORIGINAL CODE: 0009210 |
|
| STAA | Information on the status of an ep patent application or granted ep patent |
Free format text: STATUS: THE PATENT HAS BEEN GRANTED |
|
| AK | Designated contracting states |
Kind code of ref document: B1 Designated state(s): AL AT BE BG CH CY CZ DE DK EE ES FI FR GB GR HR HU IE IS IT LI LT LU LV MC MK MT NL NO PL PT RO RS SE SI SK SM TR |
|
| REG | Reference to a national code |
Ref country code: GB Ref legal event code: FG4D |
|
| REG | Reference to a national code |
Ref country code: CH Ref legal event code: EP |
|
| REG | Reference to a national code |
Ref country code: DE Ref legal event code: R096 Ref document number: 602020045541 Country of ref document: DE |
|
| REG | Reference to a national code |
Ref country code: IE Ref legal event code: FG4D |
|
| REG | Reference to a national code |
Ref country code: NL Ref legal event code: MP Effective date: 20250129 |
|
| PG25 | Lapsed in a contracting state [announced via postgrant information from national office to epo] |
Ref country code: NL Free format text: LAPSE BECAUSE OF FAILURE TO SUBMIT A TRANSLATION OF THE DESCRIPTION OR TO PAY THE FEE WITHIN THE PRESCRIBED TIME-LIMIT Effective date: 20250129 |
|
| PG25 | Lapsed in a contracting state [announced via postgrant information from national office to epo] |
Ref country code: RS Free format text: LAPSE BECAUSE OF FAILURE TO SUBMIT A TRANSLATION OF THE DESCRIPTION OR TO PAY THE FEE WITHIN THE PRESCRIBED TIME-LIMIT Effective date: 20250429 |
|
| PG25 | Lapsed in a contracting state [announced via postgrant information from national office to epo] |
Ref country code: FI Free format text: LAPSE BECAUSE OF FAILURE TO SUBMIT A TRANSLATION OF THE DESCRIPTION OR TO PAY THE FEE WITHIN THE PRESCRIBED TIME-LIMIT Effective date: 20250129 |
|
| PG25 | Lapsed in a contracting state [announced via postgrant information from national office to epo] |
Ref country code: PL Free format text: LAPSE BECAUSE OF FAILURE TO SUBMIT A TRANSLATION OF THE DESCRIPTION OR TO PAY THE FEE WITHIN THE PRESCRIBED TIME-LIMIT Effective date: 20250129 |
|
| PG25 | Lapsed in a contracting state [announced via postgrant information from national office to epo] |
Ref country code: ES Free format text: LAPSE BECAUSE OF FAILURE TO SUBMIT A TRANSLATION OF THE DESCRIPTION OR TO PAY THE FEE WITHIN THE PRESCRIBED TIME-LIMIT Effective date: 20250129 |
|
| REG | Reference to a national code |
Ref country code: LT Ref legal event code: MG9D |
|
| PG25 | Lapsed in a contracting state [announced via postgrant information from national office to epo] |
Ref country code: IS Free format text: LAPSE BECAUSE OF FAILURE TO SUBMIT A TRANSLATION OF THE DESCRIPTION OR TO PAY THE FEE WITHIN THE PRESCRIBED TIME-LIMIT Effective date: 20250529 Ref country code: NO Free format text: LAPSE BECAUSE OF FAILURE TO SUBMIT A TRANSLATION OF THE DESCRIPTION OR TO PAY THE FEE WITHIN THE PRESCRIBED TIME-LIMIT Effective date: 20250429 |
|
| REG | Reference to a national code |
Ref country code: AT Ref legal event code: MK05 Ref document number: 1763928 Country of ref document: AT Kind code of ref document: T Effective date: 20250129 |
|
| PG25 | Lapsed in a contracting state [announced via postgrant information from national office to epo] |
Ref country code: HR Free format text: LAPSE BECAUSE OF FAILURE TO SUBMIT A TRANSLATION OF THE DESCRIPTION OR TO PAY THE FEE WITHIN THE PRESCRIBED TIME-LIMIT Effective date: 20250129 |
|
| PG25 | Lapsed in a contracting state [announced via postgrant information from national office to epo] |
Ref country code: PT Free format text: LAPSE BECAUSE OF FAILURE TO SUBMIT A TRANSLATION OF THE DESCRIPTION OR TO PAY THE FEE WITHIN THE PRESCRIBED TIME-LIMIT Effective date: 20250529 Ref country code: LV Free format text: LAPSE BECAUSE OF FAILURE TO SUBMIT A TRANSLATION OF THE DESCRIPTION OR TO PAY THE FEE WITHIN THE PRESCRIBED TIME-LIMIT Effective date: 20250129 |
|
| PG25 | Lapsed in a contracting state [announced via postgrant information from national office to epo] |
Ref country code: BG Free format text: LAPSE BECAUSE OF FAILURE TO SUBMIT A TRANSLATION OF THE DESCRIPTION OR TO PAY THE FEE WITHIN THE PRESCRIBED TIME-LIMIT Effective date: 20250129 Ref country code: GR Free format text: LAPSE BECAUSE OF FAILURE TO SUBMIT A TRANSLATION OF THE DESCRIPTION OR TO PAY THE FEE WITHIN THE PRESCRIBED TIME-LIMIT Effective date: 20250430 |
|
| PG25 | Lapsed in a contracting state [announced via postgrant information from national office to epo] |
Ref country code: AT Free format text: LAPSE BECAUSE OF FAILURE TO SUBMIT A TRANSLATION OF THE DESCRIPTION OR TO PAY THE FEE WITHIN THE PRESCRIBED TIME-LIMIT Effective date: 20250129 |
|
| PG25 | Lapsed in a contracting state [announced via postgrant information from national office to epo] |
Ref country code: SE Free format text: LAPSE BECAUSE OF FAILURE TO SUBMIT A TRANSLATION OF THE DESCRIPTION OR TO PAY THE FEE WITHIN THE PRESCRIBED TIME-LIMIT Effective date: 20250129 |
|
| PG25 | Lapsed in a contracting state [announced via postgrant information from national office to epo] |
Ref country code: SM Free format text: LAPSE BECAUSE OF FAILURE TO SUBMIT A TRANSLATION OF THE DESCRIPTION OR TO PAY THE FEE WITHIN THE PRESCRIBED TIME-LIMIT Effective date: 20250129 |
|
| PG25 | Lapsed in a contracting state [announced via postgrant information from national office to epo] |
Ref country code: DK Free format text: LAPSE BECAUSE OF FAILURE TO SUBMIT A TRANSLATION OF THE DESCRIPTION OR TO PAY THE FEE WITHIN THE PRESCRIBED TIME-LIMIT Effective date: 20250129 |
|
| PG25 | Lapsed in a contracting state [announced via postgrant information from national office to epo] |
Ref country code: IT Free format text: LAPSE BECAUSE OF FAILURE TO SUBMIT A TRANSLATION OF THE DESCRIPTION OR TO PAY THE FEE WITHIN THE PRESCRIBED TIME-LIMIT Effective date: 20250129 |
|
| PG25 | Lapsed in a contracting state [announced via postgrant information from national office to epo] |
Ref country code: CZ Free format text: LAPSE BECAUSE OF FAILURE TO SUBMIT A TRANSLATION OF THE DESCRIPTION OR TO PAY THE FEE WITHIN THE PRESCRIBED TIME-LIMIT Effective date: 20250129 Ref country code: EE Free format text: LAPSE BECAUSE OF FAILURE TO SUBMIT A TRANSLATION OF THE DESCRIPTION OR TO PAY THE FEE WITHIN THE PRESCRIBED TIME-LIMIT Effective date: 20250129 |
|
| PG25 | Lapsed in a contracting state [announced via postgrant information from national office to epo] |
Ref country code: RO Free format text: LAPSE BECAUSE OF FAILURE TO SUBMIT A TRANSLATION OF THE DESCRIPTION OR TO PAY THE FEE WITHIN THE PRESCRIBED TIME-LIMIT Effective date: 20250129 |
|
| PG25 | Lapsed in a contracting state [announced via postgrant information from national office to epo] |
Ref country code: SK Free format text: LAPSE BECAUSE OF FAILURE TO SUBMIT A TRANSLATION OF THE DESCRIPTION OR TO PAY THE FEE WITHIN THE PRESCRIBED TIME-LIMIT Effective date: 20250129 |
|
| REG | Reference to a national code |
Ref country code: DE Ref legal event code: R097 Ref document number: 602020045541 Country of ref document: DE |
|
| PLBE | No opposition filed within time limit |
Free format text: ORIGINAL CODE: 0009261 |
|
| STAA | Information on the status of an ep patent application or granted ep patent |
Free format text: STATUS: NO OPPOSITION FILED WITHIN TIME LIMIT |
|
| 26N | No opposition filed |
Effective date: 20251030 |
|
| PGFP | Annual fee paid to national office [announced via postgrant information from national office to epo] |
Ref country code: DE Payment date: 20251028 Year of fee payment: 6 |
|
| PGFP | Annual fee paid to national office [announced via postgrant information from national office to epo] |
Ref country code: GB Payment date: 20251023 Year of fee payment: 6 |
|
| PGFP | Annual fee paid to national office [announced via postgrant information from national office to epo] |
Ref country code: FR Payment date: 20251027 Year of fee payment: 6 |